1. Introduction
Activated carbons (ACs) have found wide applications in multiple fields as a consequence of their unique adsorption properties [1ŌĆō3]. World demand for activated carbon is forecast to expand 3.5% per year through 2020 to 970 million pounds [4]. The demand for AC has increased in response to two major environmental regulations implemented by the US Environmental Protection Agency: the Disinfectants and Disinfection Byproducts Rule (DBPR) and the Mercury and Air Toxics Standards (MATS). Both regulations allow utilities and industrial manufacturers in the US to upgrade their coal-fired power plants [4,5]. Powdered AC can be used in coal-fired power plants to adsorb air-phase mercury from flue gas. The injected AC can reduce the mercury concentration in the flue gas to levels that satisfy emission standards specified in environmental regulations. Another major application of AC is water purification, where it functions as an adsorbent for the removal of organic and inorganic contaminants [6ŌĆō9]. In addition, ACs are extensively used in the science and engineering fields because of their reasonably high electronic conductivity, high electrochemical stability, and large specific surface areas. In the construction of heterogeneous catalysts, AC is utilized as a support for noble metals and as a biocompatible material [10ŌĆō14]. In recent years, the use of ACs in energy storage applications such as electrodes in electrochemical capacitors and anodes in hybrid storage batteries has been increasing rapidly [6,15ŌĆō17]. Their broad application in energy storage industry is attributed to their high abundance, and accompanying low cost.
ACs are conventionally manufactured through a two-step process [1,3,18]. The first step is the extraction of elemental carbon from an organic raw material via thermal pyrolysis. During the pyrolysis, the carbon source is first dehydrated at 120┬░C under air and is then heated to at least 450┬░C under an inert atmosphere for several hours until the carbonaceous source is completely dehydrated and rigid carbon rings with sp2 bonding form [1,19,20]. In the second step, the pyrolyzed carbon is activated using either a chemical agent such as NaOH, KOH, H3PO4, or ZnCl2 under inert conditions or a physical etchant employing steam and CO2 activation [1,21]. The thermal pyrolysis of the first step suffers from poor yields: as much as 40ŌĆō50% of the constituent carbon contained in the raw material is lost in several cases [22, 23] (Fig. 1). This low yield could offset the advantage of low manufacturing cost of ACs [24]. A high-yield process would make ACs more attractive from a cost perspective.
Here, we report the high-yield synthesis of NaOH-ACs from carbonized sucrose via a hydrothermal process. Initially, the precursor sucrose was carbonized via a hydrothermal process in high production yield. This hydrothermal carbonization (HTC) process does not require the laborious caramelization step used in conventional carbonization, where the sugar powder expands in volume approximately 20ŌĆō50 fold during the caramelization and requires grinding before the subsequent pyrolysis. In our method, the carbon obtained after hydrothermal treatment is subsequently converted into porous activated carbon via NaOH treatment. We used the produced ACs as an electrode material for an electric double-layer capacitor. The measured specific capacitance value was similar to that of an AC prepared by the conventional two-step activation process.
2. Experimental
2.1 Synthesis
Sucrose (>99.5%, Sigma-Aldrich, known as ŌĆ£table sugarŌĆØ) was used as a raw material to prepare the carbon materials for final ACs. The hydrothermal carbonization of the sucrose was carried out in Teflon-lined autoclave (100 mL capacity). A sucrose (20 g) was dissolved in 60 mL of deionized water and transferred to an autoclave. The autoclave was further sealed and heated in an oven at 180┬░C for 16 h. The resultant black carbon chunk was ground into a fine powder using an agate mortar and pestle. To attain a homogeneous particle size, the ground carbon was screened through a 300 ╬╝m mesh sieve. The homogeneous powdered carbon was used for further activation. For chemical activation, a carbon sample (5 g) was mixed with various amounts of NaOH (98%, Alfa Aesar) chemical etching agent (10 g, 15 g, and 20 g) in 10 mL of deionized water. The mixtures were stirred for 1 h for complete infiltration of the etchant into the carbon and then the final slurry was dried in an oven at 80┬░C for 4 h to remove excess water. The obtained mixture was then transferred to a horizontal furnace, where it was heat-treated at 800┬░C under a flowing N2 environment (3 ft3 hŌłÆ1 = 1,416 cm3 minŌłÆ1) for 2 h. The activation temperature was chosen as 800┬░C because the metallic sodium evolves by the reduction of sodium hydroxide at this temperature [2]. The chemically etched pyrolyzed samples were named according to the gravimetric NaOH/C ratio. The sample labels AC-NaOH-2, AC-NaOH-3, and AC-NaOH-4 refer to the AC samples prepared with NaOH/C ratios of 2, 3, and 4, respectively. The obtained AC products were washed with hot deionized water and then with 1 M HCl solution multiple times to remove remaining alkali from the product. The washed carbon samples were subsequently dried in a vacuum oven at 120┬░C for 24 h. The schematic in Fig. 2 illustrates the synthesis process of the ACs, including the hydrothermal carbonization. The water used in all experiments was double-distilled water (18 M╬®).
2.2 Characterization
An automated gas adsorption analyzer (NOVA 2000, Quantachrome Instruments) was used to characterize the porous structure of the NaOH-AC samples. N2 gas was used as an adsorbent to obtain the adsorption/desorption profiles (isotherms). Prior to the gas-adsorption analysis, the samples were degassed at 300┬░C for 6 h under vacuum to remove organic contaminants and moisture from their surface.
The electrochemical performance of the ACs was analyzed by cyclic voltammetry (CV) using a multi-channel potentiostat (VMP3, Bio-logic). The voltammograms were recorded at a scanning rate of 5 mV sŌłÆ1 in 1 M Na2SO4 solution. For the CV measurements, the powder-type samples were used to prepare composite electrodes composed of an AC sample as the active material, carbon black, and polytetrafluoroethylene (PTFE) as a binder, combined in a 85:10:5 mass ratio. The ingredients used to prepare the composite electrodes were physically mixed using an agate mortar and pestle. The composite electrode materials were deposited onto nickel mesh using a hydraulic press (70 kN). Approximately 3ŌĆō5 mg of a given composite electrode material was loaded onto a Ni-mesh substrate. The electrochemical measurements were carried out with beaker-type three-electrode cell. The composite electrode was used as the working electrode, and platinum wire and a mercury sulfate electrode were used as the counter and reference electrodes, respectively. The measured potentials were converted to potentials referenced to a normal hydrogen electrode (NHE) as follows [25]:
The specific capacitance was evaluated from the cyclic voltammograms on the basis of the following equation:
where idis (mA) is the discharge current, E (V) is the measured voltage window, and melec (g) is the total mass of the electrode.
3. Results and Discussion
Fig. 3(a) shows illustrative scanning electron micrographs of a HTC sugar sample at low and high magnifications. Compared with the thermally pyrolyzed sugar (Fig. 3(b)), the HTC sugar exhibits a uniform spherical geometry with a diameter on the order of tens of microns. The surface group of the pyrolyzed carbon was characterized by Fourier transform infrared (FTIR) spectroscopy; the corresponding spectrum shows the characteristic C = O and OŌĆōH frequencies at 1780 cmŌłÆ1, 1850 cmŌłÆ1, and 3600 cmŌłÆ1, respectively. These features confirm that the surface was hydrophilic [26ŌĆō28]. This observation was further confirmed on the basis of thermogravimetric analysis (TGA). The TGA curves of the carbonized sugar samples show a small 3% weight loss in the region from 150 to 200┬░C, which is ascribed to the presence of loosely bonded surface moisture. Another 30% weight loss in the range 250ŌĆō550┬░C is attributed to the dehydration and condensation of various surface hydroxyl groups present on the carbonized solids.
Conventional carbonization of the sucrose precursor includes caramelization and subsequent pyrolysis. The carbon yield of this conventional process is only 20% of the initial mass. In comparison, the HTC process yields a conversion ratio of almost 100% based on carbon content (Table 1). HTC works on the principle of dehydration under autogenous pressure at mild temperatures, with the final products having a nanoscale morphology and hydrophilic surface functional groups.
In the chemical activation process, the prepared carbon powders were stirred in the aqueous etching solution for 4 h. This infiltration is a critical pretreatment step because any carbon fraction not sufficiently wetted by the etchant results in a reduced level of activation. The produced carbon powder obtained via HTC exhibits a spherical surface morphology with hydrophilic functional groups, which facilitates homogeneous impregnation by the chemical etchant.
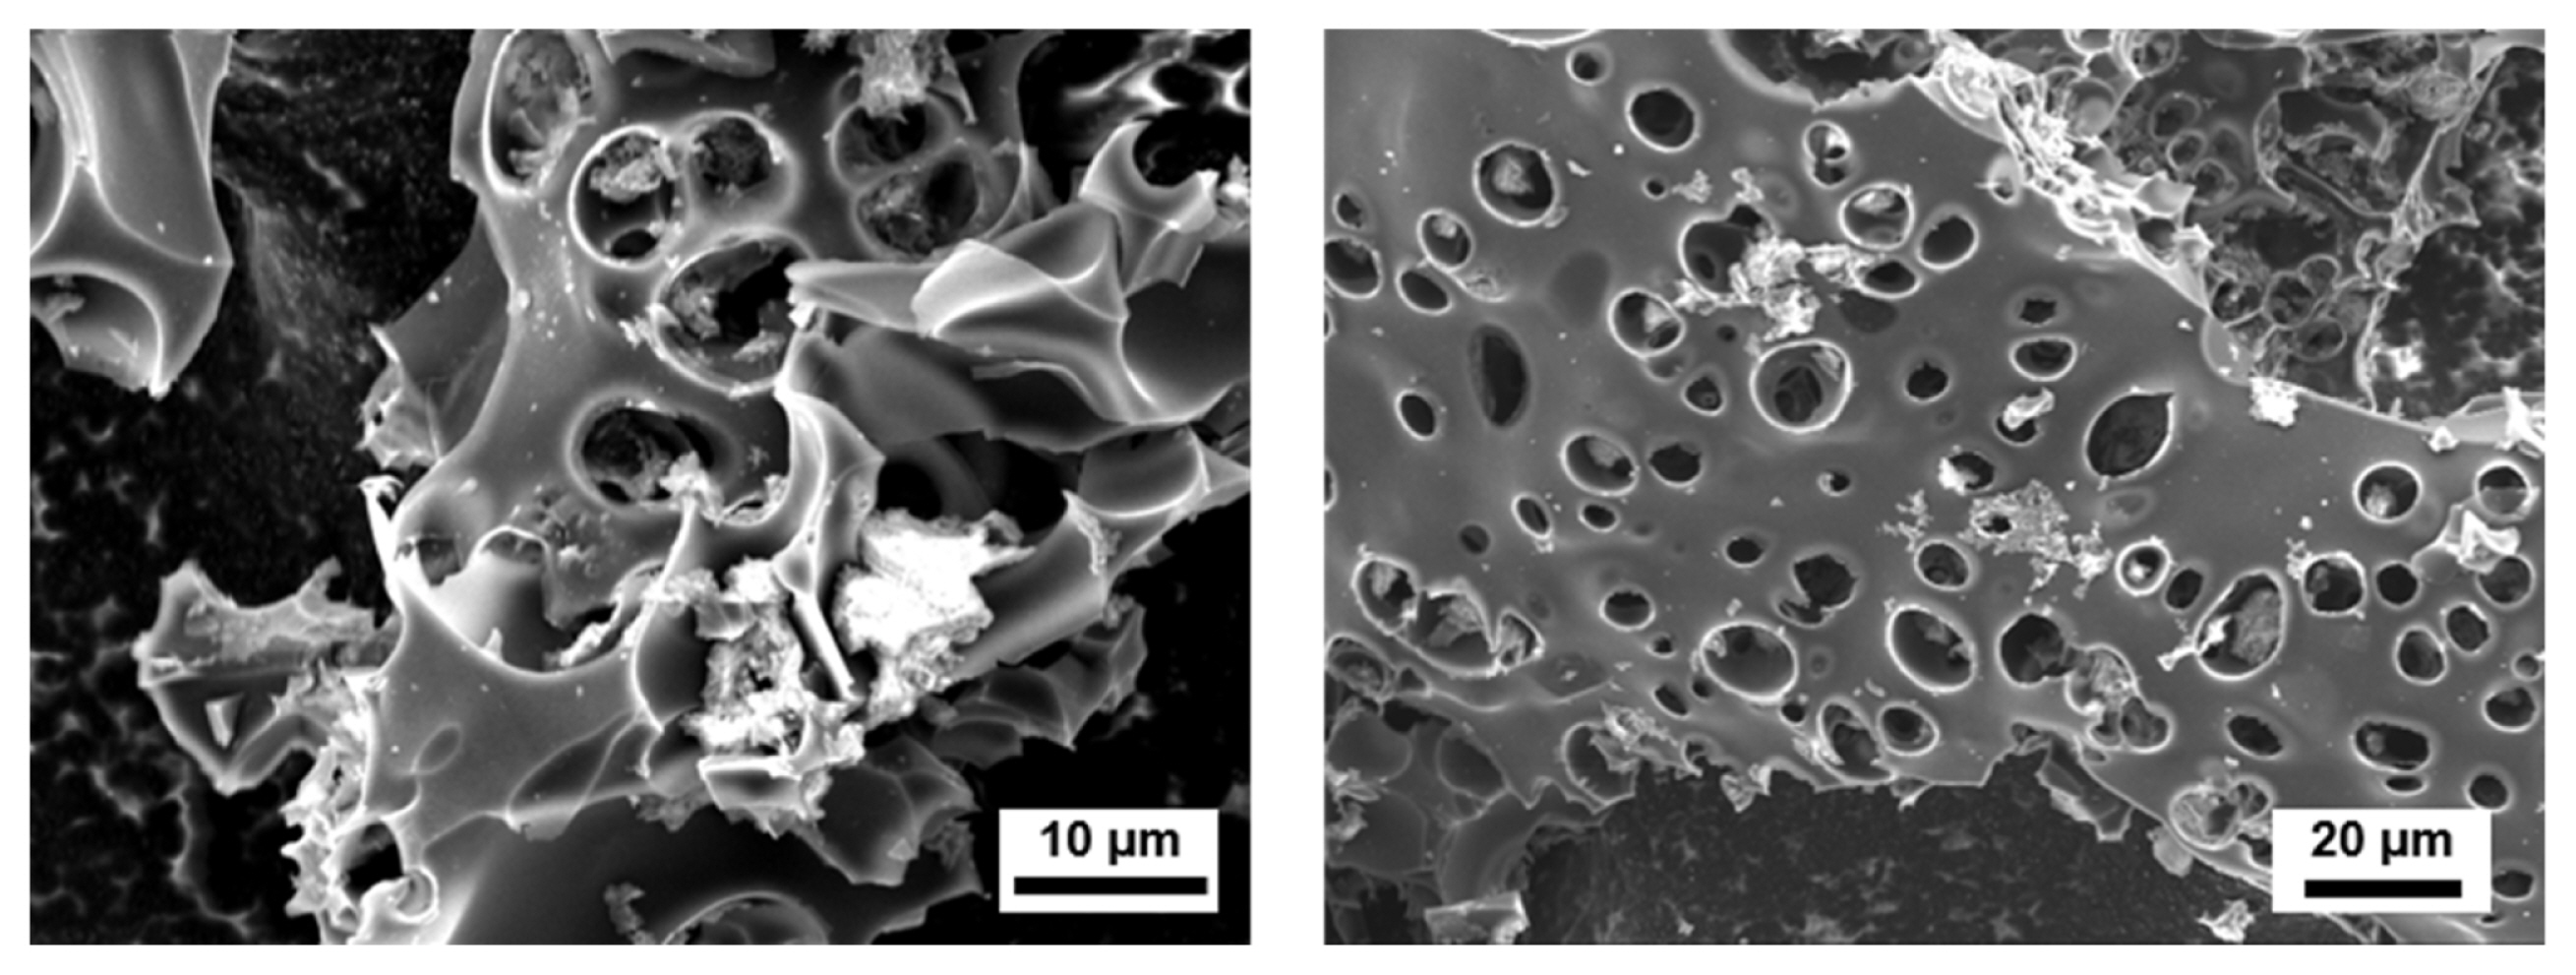
The hydrothermally pyrolyzed sugar was subsequently activated at 800┬░C to create the porous surface morphology. The resultant ACs were qualitatively examined by scanning electron microscopy to assess their surface texture and porosity (Fig. 4). The samples have rough surfaces with numerous macrosized pores with various sizes. The samplesŌĆÖ surface texture and porosity were quantitatively characterized on the basis of their adsorption/desorption profiles (isotherms) of inert N2 gas (Fig. 5).
Fig. 5 illustrates that all of the ACs exhibit type-I isotherms, which is typical for microporous carbons [29]. All of the isotherms show that a large amount of N2 was adsorbed at low relative pressures (P/P0), reaching a saturation value at middle and high P/P0, which can be explained on the basis of the N2 filling of micropores [29]. The AC-NaOH-4 sample exhibited a higher N2 adsorption volume (saturated adsorbed volume: 900 cm3 gŌłÆ1) than the other samples. By comparison, samples AC-NaOH-2 and AC-NaOH-3 exhibited saturated adsorbed volumes of 150 cm3 gŌłÆ1 and 300 cm3 gŌłÆ1, respectively. This comparison illustrates that the volume of micropores created in NaOH-ACs is directly dependent on the NaOH/C ratio.
The differences in microporosity contribute to large differences in the specific surface areas among carbon samples AC-NaOH-2, AC-NaOH-3, and AC-NaOH-4. The surface area of the ACs was calculated on the basis of multipoint BET theory at relative pressures less than 0.3 [30]. The appropriate range among adsorption points at 0 Ōēż P/P0 Ōēż 0.3 was selected to achieve the optimum fitting results until the lowest fitting error was obtained. The estimated specific surface area increased with increasing NaOH/C ratio. A large difference was observed in the surface areas of the resultant AC samples. When the NaOH/C ratio was increased from 2 to 4, the specific surface area of the AC increased more than twofold (Table 2).
To analyze the porosity quantitatively, we plotted the pore size distributions of all of the AC samples on the basis of the BarrettŌĆōJoynerŌĆōHalenda (BJH) method [31](Fig. 6). All of the ACs contain micropores with diameters less than 2 nm, which leads to their large specific surface areas. Samples AC-NaOH-2 and AC-NaOH-3 exhibit the same amount of mesopores in the range of 3ŌĆō4 nm in their microporous structures. By contrast, sample AC-NaOH-4 exhibits a unimodal pore distribution in the micropore regime. The micropore volume and mesopore volume ratio were estimated from the pore distribution profile; the results are tabulated in Table 2. The AC sample made from the mixture with lowest NaOH/C ratio shows the largest mesopore volume ratio among the prepared NaOH-AC samples. Fewer mesopores formed as more NaOH etchant was added to the mixture. Meanwhile, the micropore volume ratio increased with increasing NaOH/C ratio. This result is attributed to the micropore evolution induced by NaOH etching. During the activation with NaOH, pores can be created by the exfoliation of the stacked graphene layers by intercalated sodium metal [22,23,32]. The voids between exfoliated graphene layers exposed on the free surface are considered to function as microsized pores. Therefore, when a larger amount of NaOH was used, as in the case of sample AC-NaOH-4, new micropores developed on the existing micropores and mesopores. Therefore, the amount of mesopores was reduced by the formation of the myriad micropores, leading to the higher micropore ratio. Meanwhile, the specific surface area at higher NaOH/C ratios was enhanced because of the evolution of the micropores with a high specific surface area.
When an AC is used as an electrode material in an electrolyte, the electrolyte ions can deploy on the electrode surface under an applied external potential. ACs with a high specific surface area have an important application as electrode materials for supercapacitors. In particular, ACs with a higher specific surface area would have a higher specific capacitance to store electrical charge. To estimate the specific capacitance of the NaOH-ACs prepared in the present work, we recorded their cyclic voltammograms; the results are shown in Fig. 7. The rectangular shapes of the voltammograms indicate capacitive behavior of the NaOH electrodes in the 1 M Na2SO4 electrolyte solution. Among the samples, AC-NaOH-4, prepared with a NaOH/C ratio of 4, exhibits the best performance (specific capacitance : 157 F gŌłÆ1), as expected on the basis of its high BET surface area. Table 3 clearly shows that the ACs with higher BET surface areas exhibit higher specific capacitances.
4. Conclusions
We developed a process to manufacture ACs from sucrose (carbohydrate) via hydrothermal carbonization and subsequent NaOH activation in yields as high as 40%, which is close to the theoretical yield. Conventional carbonization includes dehydration of an organic raw material at ~120┬░C and the pyrolysis of the dehydrated precursor at temperatures greater than 400┬░C; however, constituent carbon is also lost from the precursor during this process. With our hydrothermal process, the precursor was contained in a closed chamber and heat-treated at 180┬░C under the self-generated pressure. By adopting this hydrothermal pyrolysis, we prepared pyrolyzed sugar powder instead of bulky caramelized sucrose. The laborious mechanical grinding process of caramelized sucrose was avoided, and circumventing the use of bulky caramelized sucrose enabled the use of a smaller reactor for pyrolysis. Furthermore, the loss of the carbon was mostly prevented. In the subsequent activation procedure, NaOH etchant was used to create a porous structure from the carbonized sugar. Among various investigated NaOH/C ratios, a 4:1 ratio led to the best activation performance, as indicated its extremely high specific surface area (2,918 m gŌłÆ1) and total pore volume (43.47 cm3 gŌłÆ1). The NaOH-AC with a high specific surface area advantageously adsorbed a large amount of electrolyte ions on its surface when tested as a supercapacitor electrode material. A specific capacitance of 157 F gŌłÆ1 was obtained in 1 M Na2SO4 electrolyte solution. Compared with conventional pyrolysis and activation, the NaOH activation of hydrothermally pyrolyzed carbon leads high yields of a carbon electrode material suitable for use in supercapacitor applications.