1. Introduction
Research efforts have continuously been made in pursuit of achieving green hydrogen [1ŌĆō4]. The use of fossil fuels (such as reforming natural gas or coal gasification) for the production of hydrogen gas causes environmental problems due to the emission of toxic and greenhouse gases [5]. Water electrolysis using renewable energy sources is one of the clean processes for hydrogen production. Various technologies are available for water electrolysis in which alkaline water electrolysis (AWE) came first on the list as a matured and commercial technology. AWE utilizes inexpensive materials for electrodes (Ni, Fe, and various alloys) and has a wide variety of non-precious electrocatalysts [6ŌĆō7]. Hydrogen is produced on a commercial scale, but the commercial production by AWE has drawbacks, such as the formation of carbonate/ bicarbonate precipitates in the electrolyte and on the surfaces of the electrodes and slow start up/ shut down cycles [8ŌĆō11]. Proton exchange membrane water electrolysis (PEMWE) can be considered as an alternative technology to address the above problems; it operates at higher current densities (1.5ŌĆō2.2 AcmŌłÆ2), utilizes strong membranes capable of working under high operational pressure, and has a rapid system response. However, the operation at lower pH values limits the choice of PEMWE catalyst materials to expensive platinum group metals, which increases the cost of the PEMWE system compared to AWE [12ŌĆō14].
Recently, anion exchange membrane water electrolysis (AEMWE) has attracted attention since it has the combined advantages of AWE and PEMWE; it utilizes inexpensive materials as electrodes, a lower concentrated electrolyte solution (usually 1 M KOH), compact system hardware (like PEMWE), and thinner membranes (10~50 ╬╝m compared to ~ 180 ╬╝m for Nafion) [15ŌĆō17]. AEMWE studies have usually focused on the development of novel catalysts and membranes for higher performance of AEMWE [18ŌĆō20]. Continuous current or voltage bias tests have been carried out on AEMWE cells for 200ŌĆō1000 h [11,21ŌĆō22], but the long-term stability of AEMWE has not been systematically investigated. The stability of AEMWE can be affected by various aspects, such as membrane types [18], catalysts and binder materials (platinum group metals or transition metal oxides, etc.) [9,11,23], solution types (electrolyte or D.I water) [11,20], feeding modes (anode or cathode side) [24ŌĆō25] and operation modes (continuous or periodic) [26], etc. In most studies, voltage increase rates (or current density drop rate) at a fixed current density (or a fixed voltage) were determined by merely comparing the initial and the final voltages (or current densities), but this does not provide detailed information of changes in electrochemical performances of AEMWE cells. In this study, we operated an AEMWE cell for about 1000 h during which we regularly measured ohmic and non-ohmic resistances to trace out the performance changes (improvement or degradation) as a function of time. This regular test protocol offers us clear insights into the performance degradation (or improvement) mechanism of AEMWE cells.
2. Experimental
We assembled an AEMWE cell using a membrane electrode assembly (MEA), Ni flow fields, and Teflon gaskets. The MEA was prepared by compressing an anion exchange membrane (Sustainion 37ŌĆō50; Dioxide Materials) between anode and cathode layers with the help of Ni flow fields. Anode catalyst particles of NiFe2O4 with 5% Nafion dispersion were spray-coated on a stainless steel fiber paper (anode gas diffusion layer). Similarly, cathode NiFeCo alloy catalyst particles were spray-coated on a carbon paper (cathode gas diffusion layer). Detailed descriptions for the electrode preparation were described in [18].
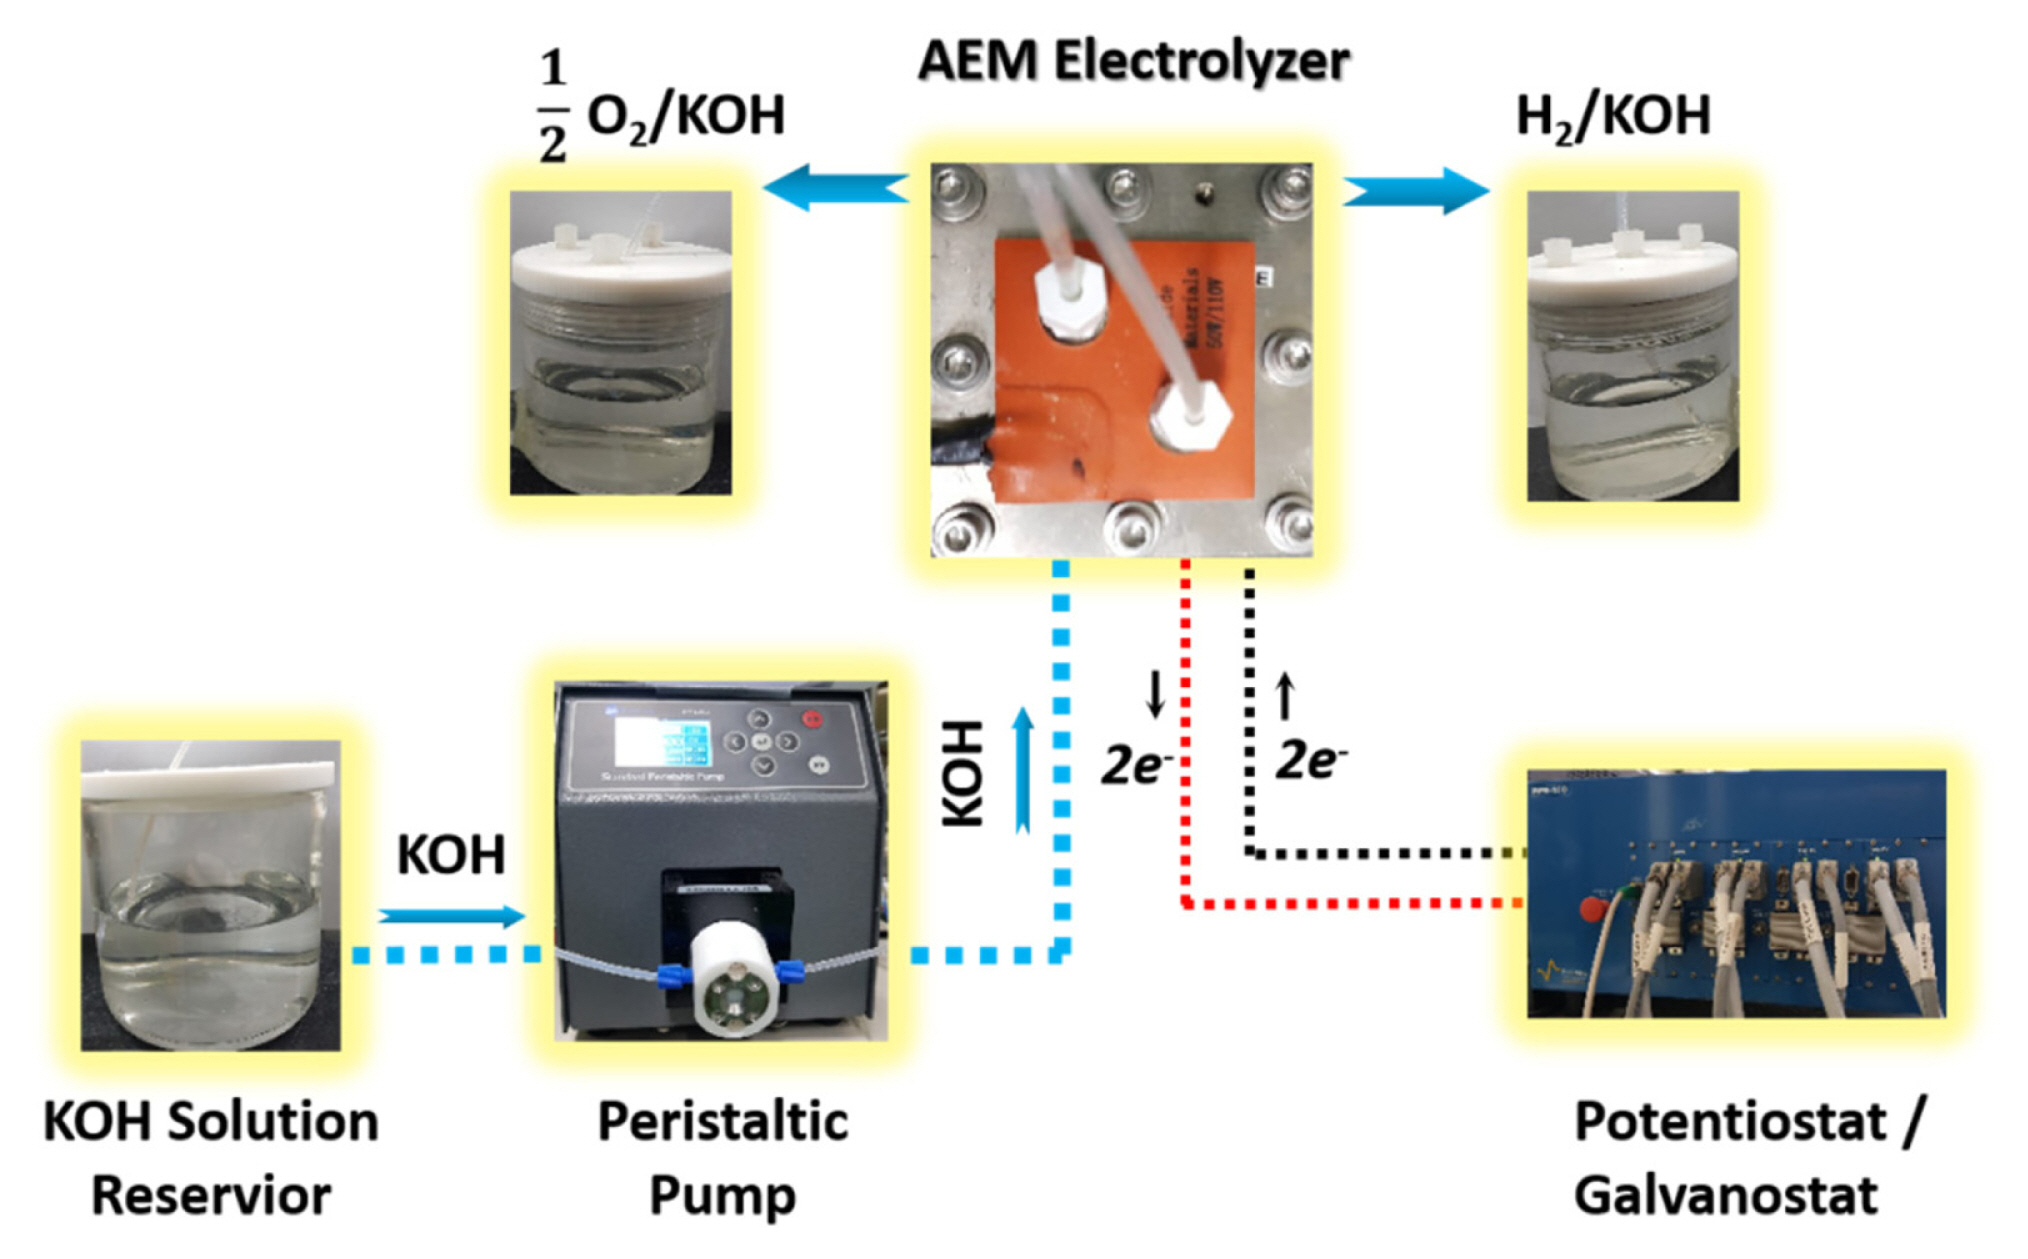
A heating jacket was used to heat the cell to the desired operating temperature (~ 50┬░C), and the temperature was maintained and controlled by a thermocouple and PID. A 1M KOH electrolyte solution was supplied to the anode chamber at a flow rate of 2 mL┬ĘminŌłÆ1 using a peristaltic pump (EMP-600G2, EMS Tech., Korea). The solution was fed to the anode side because dry cathode operation is beneficial for cell management and high purity hydrogen production [9,23]. The peristaltic pump was switched off for 5 min each time a 20-min test was completed. This protocol was designed to investigate the effect of short-term feeding interruption on the cell stability. The corresponding test setup is shown in Fig. 1. The electrolyte solution was pre-fed to the cell for ~ 1 h, and then the cell was long-term operated at a voltage bias of 1.95. For about every 100 h of a short-term test, a rest time was given to the cell for about 12 h under open-circuit conditions without solution feeding, and the solution was renewed. After each test and rest time, we measured impedance spectra at a DC bias of 1.80 V and in a frequency range from 100 kHz to 0.1 Hz. All the electrochemical tests were carried out using Bio-Logic MPG-210. After the interim performance checks at the end of the rest times, the cell was subjected to the same voltage bias again for the next 100 h of testing. This protocol was repeated until the 1000 h operation was completed. IV curves were also recorded before and after the long-term tests (all 10 short-term tests) in a voltage span of 1.20 V to 2.10 V and with a scanning rate of 0.02 VsecŌłÆ1. After the long-term test, the membrane was disassembled from the MEA, and its ionic conductivity was measured in a 1M KOH solution at 50┬░C using a specially designed test fixture to determine whether or not the membrane itself was degraded.
3. Results and Discussion
Fig. 2 shows the measured current density as a function of time for the initial 52 h at a voltage bias of 1.95 V (namely, ŌĆśTest-1ŌĆÖ). The initial current density was ~ 0.84 AcmŌłÆ2, and then it increased to ~ 1.2 AcmŌłÆ2 after several hours. After getting to the maximum point, the current density gradually decreased; the current density at the end of ŌĆśTest-1ŌĆÖ was measured to be 0.8ŌĆō0.9 AcmŌłÆ2. Note that the small fluctuation in the current density was due to switching the peristaltic pump on and off every 20 min during the test; the current density increased when the pump was stopped, and then it decreased with restating the pump. Note that switching the pump on and off every 20 min did not influence the cell stability [26]. Fig. 3(a) compares the Nyquist plots of the impedance spectra measured at the beginning and end of ŌĆśTest -1ŌĆÖ. The ohmic area-specific resistance (ASR) corresponded to the real axis intercept of impedance spectra at a high frequency of ~28 kHz while the non-ohmic ASR corresponded to the arc size of the real axis from the high frequency (~ 28 kHz) to the lowest frequency (~ 0.1 Hz). For the 52 h test, the ohmic ASR decreased from ~ 0.185 to 0.094 ╬®cm2 and the non-ohmic ASR from ~ 0.233 to ~ 0.161 ╬®cm2, which indicated that the cell performance was improved. Fig. 3(b) compares I-V curves before and after ŌĆśTest-1ŌĆÖ; the initial current density at 2.0 V was ~ 0.601 AcmŌłÆ2, and then it increased to ~ 1.55 AcmŌłÆ2. This initial performance improvement was due to the MEA activation as observed in previous studies [26ŌĆō30]. On the other hand, the cell performance appeared to be about the same or slightly degraded when the initial and final values were compared, as shown in Fig. 2. This discrepancy was due to the impedance and IŌĆōV curve measurement timing associated with the bubble resistance [26]. The gradual decrease in the current density in Fig. 2 was due to the bubble resistance that developed in the continuous voltage bias. The bubble resistance-increasing rate would be higher with a higher current density [31]. After removing the voltage bias and leaving the cell in open-circuit conditions at the end of ŌĆśTest-1ŌĆÖ, the bubble resistance was removed, and we observed improved cell performance in the impedance spectra (Fig. 3a) and IŌĆōV curves (Fig. 3b).
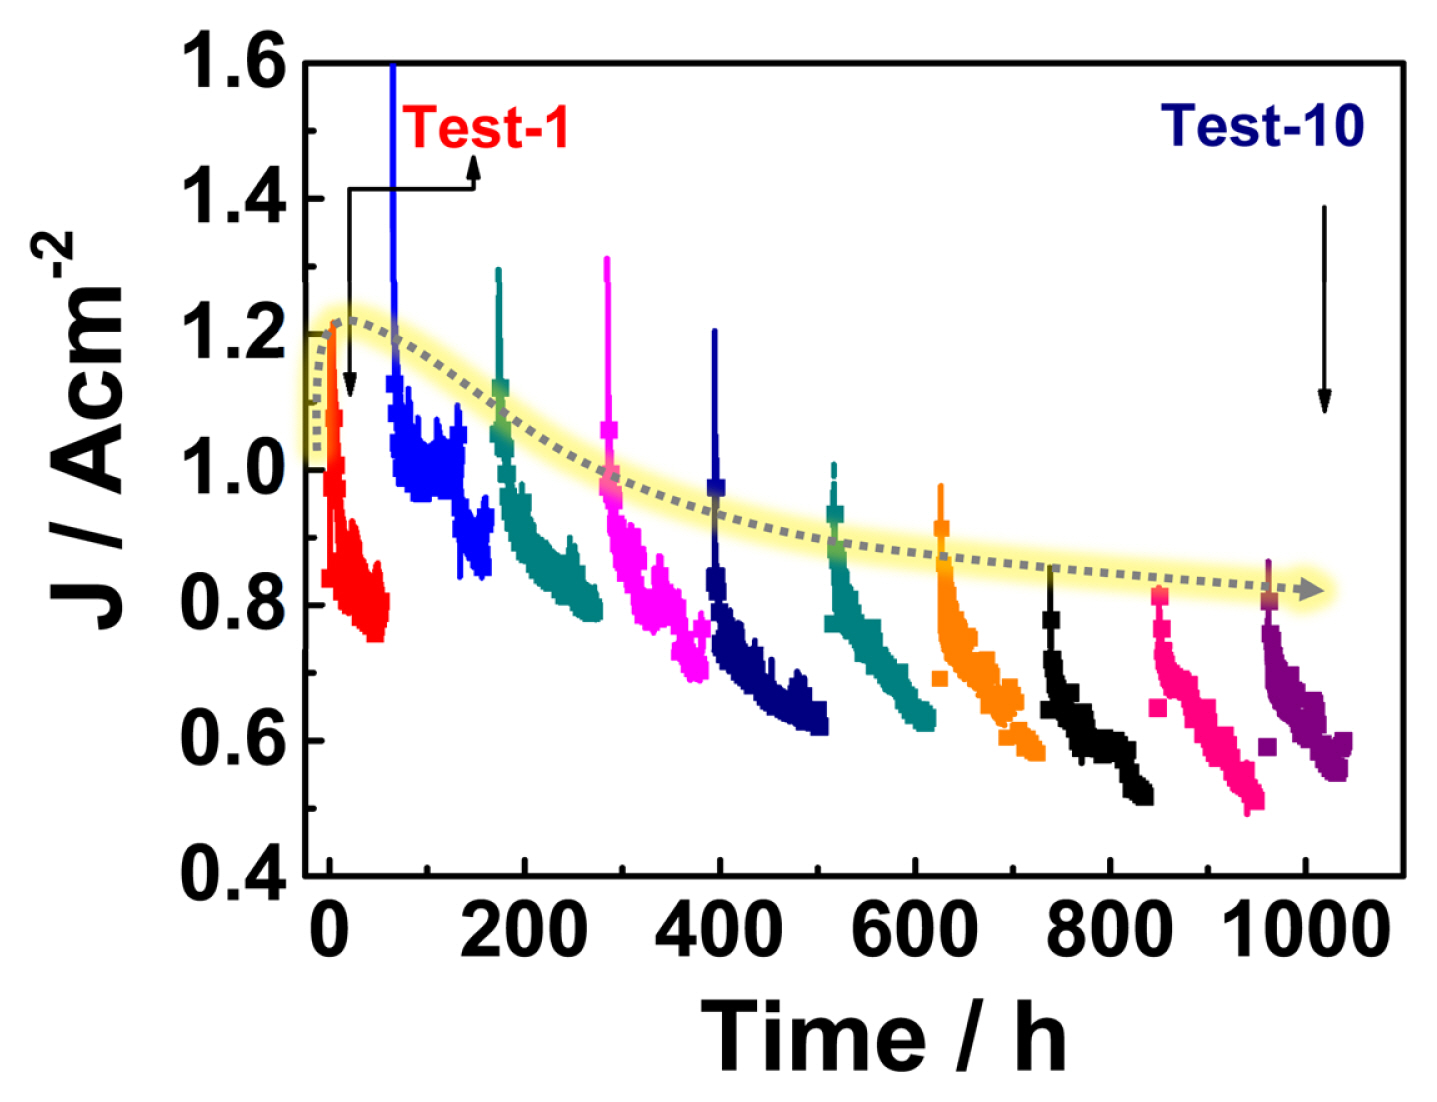
Fig. 4 shows the current density variation with time at a voltage bias of 1.95 V for ~ 1000 h in which we conducted a total of 10 short-term tests (from ŌĆśTest-1ŌĆÖ to ŌĆśTest-10ŌĆÖ). The current density gradually decreased within each short-term test (like Fig. 2). However, after the rest time, we observed that the current density was recovered to close to the initial value of the previous test. This recovery was due to the removal of the effects of bubble resistance during the rest time, as discussed above. By adopting a test protocol that included rest times, we were able to distinguish the non-permanent resistance (which can partially disappear without voltage bias) from the permanent resistance directly related to the cell components.
We measured I-V curves at the beginning and after the final rest time, as shown in Fig. 5(a). We can see there was no significant change in the polarization curves in the comparison between the initial and the final values. Fig. 5(b) compares impedance spectra at the beginning and the end. It can be seen that the final total ASR (0.402 ╬®cm2) was about the same as the initial one (0.411 ╬®cm2). A possible equivalent circuit and fitting results are shown in the inset; the ohmic ASR (R0) increased while the non-ohmic ASR (R1+R2) decreased. If we had measured the total resistance or I-V curves only at the beginning and the end, this could have led us to the wrong conclusion, that the cell was stable and there were no changes in the cell resistance during the test. However, the ohmic ASR increased and the non-ohmic ASR decreased, as shown in Fig. 5(b). Impedance was regularly measured during the long-term test by measuring impedance spectra about every 100 h (after each rest time) to obtain more detailed information on the cell resistance changes as a function of time, as shown in Fig. 6(a). The corresponding total, ohmic and non-ohmic ASRs were plotted as a function of time, as shown in Fig. 6(b). We can see the initial improvement (the MEA activation) was associated with both the ohmic and non-ohmic ASRs. After the activation, the total ASR increased with time and was dominated by the ohmic ASR rather than the nonohmic ASR. The non-ohmic ASR measured after the first rest time was ~ 0.153 ╬®cm2, and it increased to only 0.175 ╬®cm2 at end of the final rest time. On the other hand, the ohmic ASR increased from 0.101 to 0.227 ╬®cm2 within the same time section. Thus, the ohmic ASR changes had more of an effect on the overall cell performance, and it was the main contributor to performance degradation after the initial activation. We can see that the ohmic ASR has an increasing trend in Fig. 6(b); thus we can deduce that the cell performance would be further degraded with an experiment time longer than 1000 h. On the other hand, there was no trend for the non-ohmic ASR, and the fluctuation can be explained by the bubble resistance effect [26,32ŌĆō33]. Fig. 6(c) shows the ohmic ASR changes as a function of time; closed and open symbols correspond to the ohmic ASRs measured after the voltage bias tests and after the rest times, respectively. There was no increasing trend in the ohmic ASR from ŌĆśafter restŌĆÖ to ŌĆśafter biasŌĆÖ (in a period of the voltage bias test). On the other hand, we can see an increasing trend in the ohmic ASR from ŌĆśafter biasŌĆÖ to ŌĆśafter restŌĆÖ (in a period of the rest time without solution feeding).
After the long-term test, the membrane was disassembled from the MEA, and then the ionic conductivity (impedance spectra) of the tested membrane itself was measured at 50┬░C using the specially designed test fixture. Fig. 7(a) shows photographs of the test fixture and a schematic of its structure. The test fixture consisted of two platinum electrodes, and each active area was 0.785 cm2. For comparison, we also prepared a new membrane to measure ionic conductivity in the same way. First, the conductivity of the 1M KOH solution was measured using two Pt electrodes in the test fixture without a membrane. As shown in Fig. 7(b), the high frequency (~ 67 kHz) intercept of the arc on the real axis was ~ 0.667 ╬®cm2. A new membrane was placed between the two Pt electrodes of the test fixture, and then it was immersed into the 1M KOH solution for the conductivity measurement. The ohmic ASR was 0.849 ╬®cm2, which corresponded to the sum of the ionic ASR of the membrane and the solution. By subtracting the solutionŌĆÖs ionic ASR from that value, we determined the ionic ASR of the new membrane, which was ~ 0.182 ╬®cm2. In the same way, the ASR of the tested membrane was determined to be ~ 0.208 ╬®cm2. These two values were very similar to the initial and final ohmic ASR values obtained from Fig. 6(b). Liu et al. used the same membrane as ours, and their MEA showed negligible performance degradation when it was continuously operated without rest times for ~ 1950 h [18]. Thus, we can say that the slight degradation after the activation was due to membrane degradation, which was related to the de-humidification effect on the membrane during the rest time [34ŌĆō36]. The membrane deterioration would be significant with more frequent and longer rest times without the solution feeding [26]. Thus, it can be said that the rest time had a negative effect with respect to membrane stability while it had a positive effect with respect to the removal of the bubble resistance. Therefore, to protect the membrane, we suggest that the solution be kept feeding to the cell even when the cell is electrically in the rest time (no voltage bias).
4. Summary
In this study, we operated an AEMWE cell for a long-term stability test of 1000 h. We regularly measured the impedance spectra every 100 h and traced the changes in the ohmic and non-ohmic ASRs as a function of time. The results gave us detailed information on the electrochemical behavior of the AEMWE cell during the long-term test: 1) both the ohmic and non-ohmic resistance decreased in the initial activation process; 2) the bubble resistance increased with a continuous voltage bias, but it almost disappeared under open-circuit conditions; 3) the membrane was slowly degraded by the dehumidification at the rest times, which increased the ohmic resistance. The regular test protocol used in this study provided clear insights into the performance degradation (or improvement) mechanism of AEMWE cells.