1. Introduction
Petroleum hydrocarbons (PH) pollutants have been recognized as an environmental issue [1,2] When it is discharged into a river sediment native bacteria can degrade, at different biodegradation rates, PH pollutants under both approaches: aerobic and anaerobic biodegradation [3]. In both cases, when a critical PH quantity is reached the river sediment is considered polluted because the PH-degrading bacteria are seriously affected. Moreover, the biodiversity of indigenous bacteria groups decreases in the presence of high PH concentration [4]. Under anaerobic conditions, the biodegradation activity becomes low or negligible [5,6]. Although the biochemical mechanism of the anaerobic PH biodegradation is not clear, what is very clear is that the PH aerobic biodegradation rate is higher compared with anaerobic biodegradation rate [7]. According to the PH concentration in the river sediment, the oil-contaminated sediments (OCS) are considered among viable and highly refractory biodegradable organic matter. Consequently, the addition of petroleum-degrading bacteria, external growth medium, biosurfactants, electron acceptors and other additives are necessary to boost the biodegradation rate [8]. Despite such inconvenient and considering that several physicochemical methods for OCS remediation are accessible [3], PH biodegradation is one of the best cost-effective approaches available [2,9].
The versatile bio-electrochemical system (BES) approach can minimize environmental problems caused by OCS by using a biodegradation process. Indeed, one of the most important BES configurations was the microbial fuel cell (MFC). Such configuration was applied to convert the chemical energy contained in marine sediments into electric energy in 1999 without chemical mediators. Since then, an exponential academic interest in MFC was developed [10]. During the last decade MFC were modified to be adapted to different technological activities. Consequently, the acronym MXC (where X denotes different applications) stands for the MFC focused to different uses: production of energy rich chemicals [11,12], water desalination [13], metal recovery [14], electrosynthesis [15] among others. OCS can be abated by implementing either bioremediation [16–18] or energy recovery [19] processes. Both can be carried out using different BES configurations [10]. In most natural sediments or unmodified OCS, oligotrophic conditions prevail. Consequently a poor biodegradation rate generate a low power density (PD) output (~12 mW m−2) in SMFCs [20–22]. However, biodegradation activity can be dramatically boosted by applying the methods of bioaugmentation [23] or biostimulation [24,25]. As a result, the biodegradation rate of OCS and the power output of SMFC are improved. In a more structured classification, the main parameters that limits BES performance in terms of bioremediation and energy recovery are electrochemical and biological factors [26,27]. In the first set we have electrodes and current collector materials [28,29], anode/cathode catalyst [30–32], separators [28,33], bioanodes and BES configuration [10,34–36], operating conditions (electrolytic conductivity, pH) [37,38]. In the second set, it can be mentioned main indigenous bacteria groups that carry out the biodegradation activity [39], a deficiency in the ability of bacteria to transfer electrons from the anode to the cathode [40,41] can worsen biodegradation activity. The electron transfer, from a substrate to the SMFC anode surface, via anodic colonization of specific microorganisms is carried out thru two main exoelectrogenic mechanisms: nanowire and flavin (electron shuttle). For instance, G. sulfurreducens PCA belongs to the first one and S. oneidensis MR-1 to the second one. Each exoelectrogenic mechanisms develops a complex and specific resistance (charge transfer coupled with a capacitance) at the electrode-electrolyte interface. Such resistance is lower when the nanowire mechanism is favored [42]. Therefore, the identification of bacteria is a key parameter to ensure an OCS biodegradation process [9,43]. Furthermore, the anolyte pH [44], the quantity and quality of PH concentration in OCS play an important role as well [45,46]. Consequently, main parameters that limits SMFC performance are linked to its total internal resistance (Rint). The SMFC performance is described by a set of two curves: polarization and PD curves [32,47]. Therefore, the identification and minimization of the main factors that decrease the energy production will allow to decrease Rint and increase biodegradation activity, improving SMFC PD production [32,48]. The observed voltage of a SMFC (VSMFC) can be expressed by eq. 1 [48,49]:
Where OCV is the open circuit voltage (V), and I is the current (A). When current is not flowing, the OCV is a deviation from the thermodynamic standard voltage. Such deviations are strongly linked to the main electrochemical reaction that occurs in both electrodes and represent the main losses to be minimized. On the anode side, when bacteria have colonized the anode surface, they take some energy conversion [50]. Such biotransformation leads to a decrease in SMFC voltage and is included in OCV. On the cathode side, a complete ORR requires the transfer of four protons and four electrons, and it can be performed in two sluggish kinetic pathways, depending on cathode material. Both can be described by several mechanism and require high energy to be performed on a cathode surface [51]. Therefore, oxygen cathodic reduction is one of the main hurdles to be overcome in electrochemistry, including SMFC [52,53]. Although Pt-cathodes can dramatically reduce cathode overpotential, their general use in SMFC is limited by various factors. Consequently, the quest for an efficient but Pt-free catalyst to improve the ORR on SMFC cathode is justified [54]. Recently, a summary of the main catalytic approaches including simple metals (Ni, Ag), different types of carbon, carbon-metal hybrids, semiconductors, enzymes and microorganisms were discussed [55]. A reliable material named metal organic frameworks (MOF), mainly focused to the development of supercapacitors [56], has recently been used as a catalyst to improve cathodic ORR in a single chamber MFC [57]. The power densities obtained (4203 mW m−2) were due to the combination of activated carbon and MOF. Moreover, the thermodynamic conditions in the catholyte (i.e., high conductivity, pH 2) can improve further the cathodic oxygen reduction [31,47]. The minimization of the cathodic oxygen reduction overpotential is a measure of the efficiency of the cathodic catalyst. Although the mechanism of cathodic oxygen reduction under catalytic conditions becomes more complex, several electrochemical techniques can be applied to better understand it [58].
As soon as the current begins to flow, the VSMFC decreases due to various irreversible losses represented by Rint. Although Rint can be divided into several parameters [31,50] most of them can be grouped into three main losses: overpotential of both electrodes (they dependent on current and include bacterial metabolism), all ohmic overpotentials (divided in two parts, one of them current dependent) and concentration losses (current dependent). There are several methods available to quantify the principal components of Rint, among them the electrochemical impedance spectroscopy (IES) is one of the best [59]. However, at low frequencies, IES is unstable [49]. When the performance of an SMFC is well described by eq. 1, a part of Rint (ohmic losses) can be easily evaluated using the polarization slope and the peak power density [47]. The novelty of this work is to find out, for a given OCS, which is the PH maximum quantity to be added for improving the anaerobic biodegradation rate of the indigenous bacteria groups. The ability of the indigenous bacteria groups to convert PH chemical energy to electric energy will be assessed by the SMFC power output. A simple and systematic procedure is applied to increase the output of PD from SMFC addressing the following two main issues: 1) improving the microbial activity of indigenous populations in the anolyte by the biostimulation method, and 2) in the catholyte, accelerating the ORR on a catalyzed cathode. In the first case, the addition of PH pollutants (gasoline and kerosene) to the initial OCS increased the biodegradation rate without the addition of an external growth medium. In the second case, the catholyte properties (tap water, 0.8 M Na2SO4, pH 2) boost the ORR by a birnessite/CF. All changes were made gradually to identify the main factors that increase both OCV and PD output while minimizing SMFC Rint. SMFC performance was evaluated by eq. 1, the maximum power selection (MPP) and the polarization curve [47,49]. Rint was estimated based on VSMFC, OCV and external resistance (Rext). Under the best experimental conditions, when the I-VSMFC curve shifted to the largest current/voltage direction, a high PD output was obtained, and the main microbial population was identified.
2. Materials and Methods
2.1 Sampling and substrate
From the Coatzacoalcos River (594 km southeast of Mexico City) OCS at a depth of 15 cm, 20 L of sediment sample was taken (pH 6.7). The first 3 cm of the surface sludge was discarded, the rest was homogenized and kept in a cold, clean, plastic container without further amendments (i.e., buffer solution, culture medium), until its use in the laboratory. The indigenous microbial populations were taken as the only inoculum. The initial amount of organic matter was not measured, but for some experiments, the OCS were amended with known amounts of gasoline or kerosene as the only additional source of carbon, near the anode surface.
2.2 SMFC electrodes
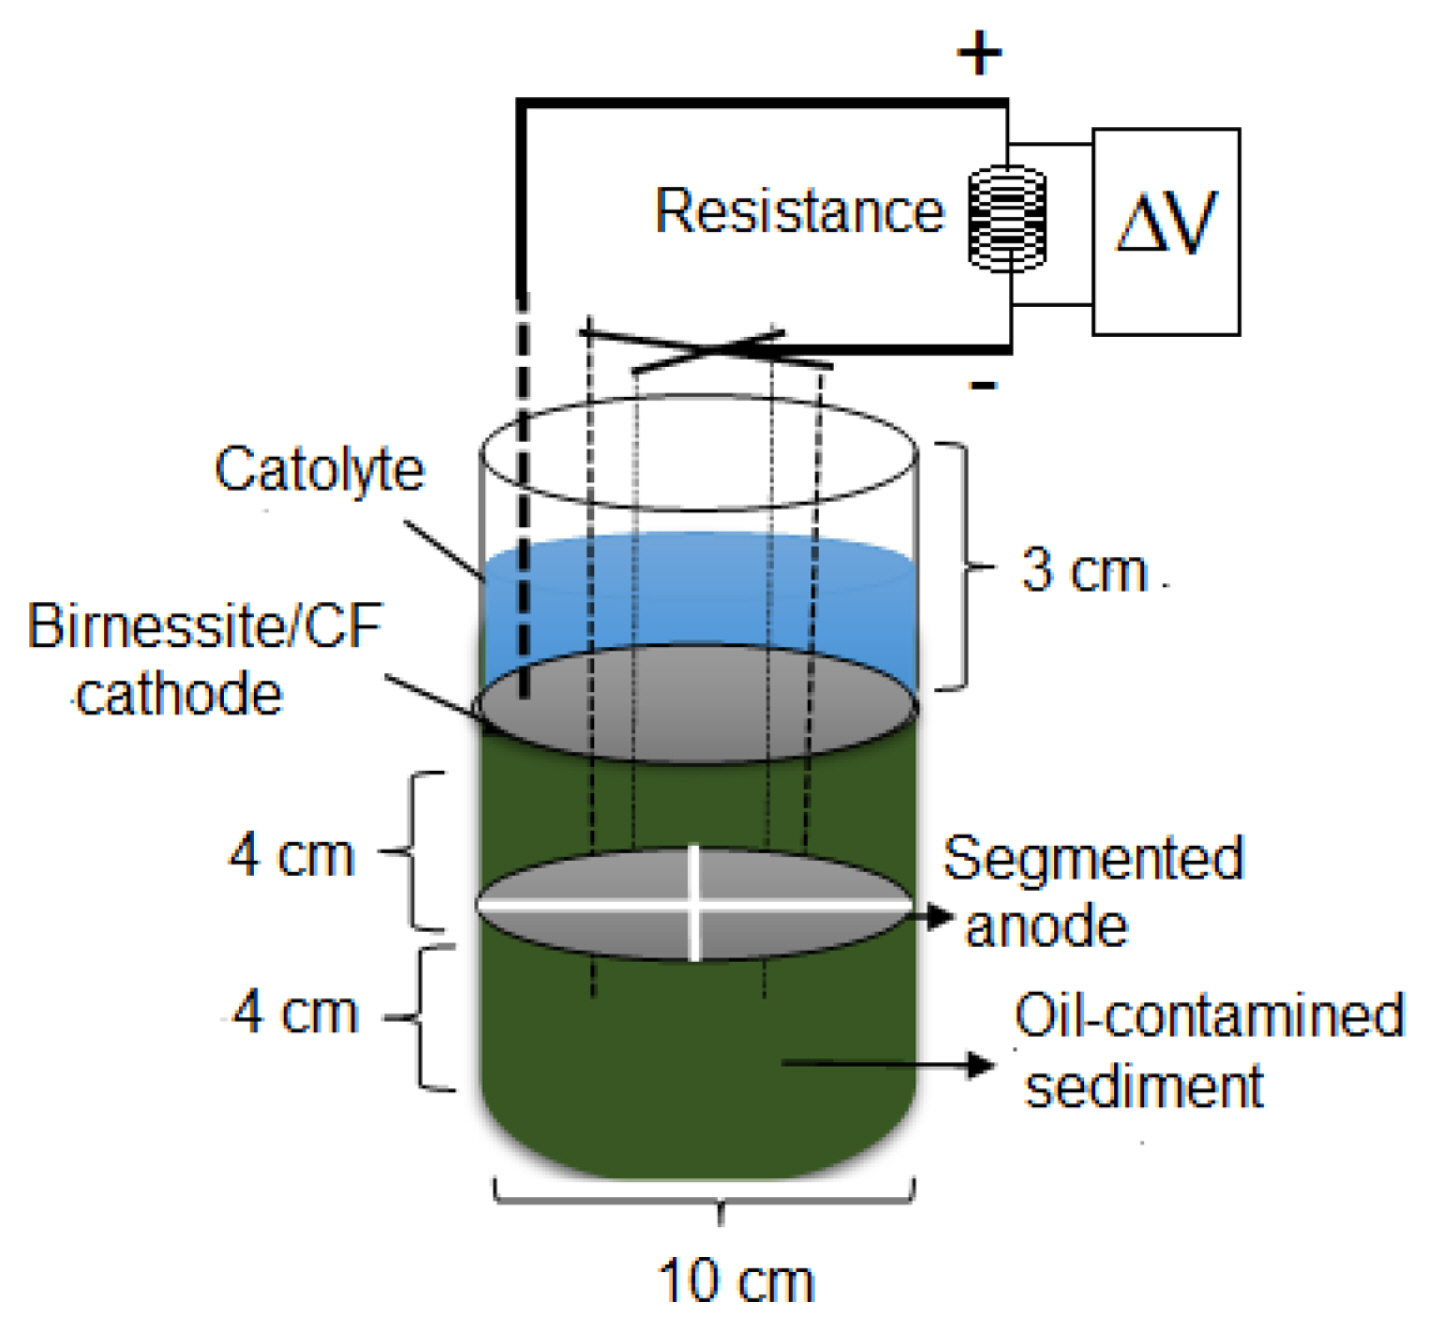
Both electrodes were made of a circular piece CF (Fibre Glast Development Corp; 0.1 m diameter). To improve power generation and reduce bioturbation events [60–62], the anode was segmented into 4 pieces (Fig. 1). However, some experiments were carried out (in section 3.3, for an OCS amended with 3 g of kerosene) with two pieces of said anode (anode area of double size). In general, ORR is catalyzed on Pt-based cathodes; however, MnO2 has been used as a cost-effective alternative to Pt-cathodes in fuel cells [63]. The MnO2 electrocatalytic properties towards the ORR are strongly linked to its morphology [64]. Nevertheless, one of the best morphologies is birnessite [65] and it can be synthetized by different methods [66,67]. Most of the published works using birnessite were addressed for battery/power related issues, but SMFC topics were not included. For this work, birnessite/CF was easily synthetized employing a simple procedure well documented elsewhere [68,69]. This procedure is concisely described here. All chemicals used in this procedure were analytical grade and were not further purified. A piece of CF was immersed in a 0.1 M KMnO4 solution (pH 2) at 70°C for 5 h. During this time, the birnessite phase formed spontaneously by MnO2 precipitation on CF surface. Thereafter, the catalyzed surface was gradually dried, first at room temperature for 30 min and finally in an oven at 90°C for 2 h. The birnessite/CF was then ready to be fixed in the SMFC. In recent works [68,70] the main results of the characterization of cathodes (CF and birnessite/CF) were published. They included surface morphology (field emission scanning electron microscopy and X-ray spectrum) and linear voltammetry (ORR analysis). The main findings suggest the formation of the birnessite phase on the surface of the CF. Moreover, the ORR was confirmed to be birnessite/CF catalyzed, so it is highly likely that it proceeds via a 4e− pathway.
2.3 SMFC design
The SMFC design used in this work is represented in Fig. 1. It is made of 0.16 m of cylindrical PVC material (0.10 m inner diameter). The SMFC can be filled with OCS (6.93×10⁻⁴ m3, anolyte compartment) and laboratory tap water, pH 8 (4.33×10⁻⁴ m3, catholyte compartment). Inevitably, part of the organic matter that comes from the OCS is transported and dissolved into the catholyte. Its volume was kept constant by tap water additions to compensate for the catholyte evaporation. An O2 saturated catholyte was secured by bubbling air during experimentation. The cathode (CF or birnessite/CF) was placed on the OCS surface. The segmented anode was buried 0.04 m below the sediment-water interface. Current collector area and types of materials play an important role in BES performance [71]. SS wire is a reliable material and when it is used as current collector the charge transfer resistance of the electrode is minimized [72]; in this study, it was used as a current collector for both electrodes. The segmented anodes (with an insulated SS wire) were connected to an external resistance and finally to the cathode. For some experiments, some SMFCs were run simultaneously. Otherwise, catholyte modifications were made gradually in the same SNFC and the experiments were performed sequentially.
2.4 Calculations, data acquisition and electrochemical analysis
Before the polarization curve is obtained, the SMFC steady conditions (maximum OCV or the start-up time) should be attained. However, such conditions are very difficult to obtain and a pseudo-steady condition is achieved instead. There is no standard procedure to achieve OVC because it depends on several operating conditions [26,73,74]. In this work, when the anode and cathode of the SMFC were electrically linked to an external load (38 kΩ) a ΔV (OCV) gradually developed over 3 or 10 days, until reaching a maximum constant value. Such ΔV was considered the SMFC OCV that resulted from an anode colonized by a consistent bacterial community. This procedure has previously been accepted as a criterion for deciding that the BES pseudo-steady conditions were reached [68,73]. A set of different Rext, from 38 kΩ to 250 Ω, was connected sequentially between SMFC electrodes to obtain the polarization curve for a given experimental conditions. From this curve the power vs current curve was derived, following the procedure described elsewhere [68]. Some key experiments were performed three times and then averaged. All experimental errors were assumed to be similar to those found for triplicate experiments. When necessary, the power and current density (j) curves were normalized to the apparent SMFC cathode surface. During the experiments, all ΔV were measured, recorded, and managed using a commercial microcontroller board (Arduino UNO) coupled to a PC. Combining eq. 1 and the law of Ohm (Rext = VSMFC /I) the Rint can be expressed as a function of the Rext by eq. 2.
When the Rint values obtained were combined with their corresponding experimental current values in eq. 1, the SMFC polarization curve is obtained, and it coincides with the experimental SMFC polarization curve.
2.5 Microbial identification
At the end of the best experiments, two sediment samples (0.25 g each) were collected, with a sterile spatula, from the anode biofilm and the anodic sediment. A third sample was taken from the initial OCS. All samples were processed for DNA extraction using the Power Soli DNA extraction kit (MoBio) according to the manufacturer’s instructions. An amplicon based on the 16S rRNA gene was made using the V3–V4 region and Next-generation sequencing with the MiSeq Illumina sequencing platform (Illumina Inc., CA, USA). Paired-end reading data exported in FASTQ format was pooled and quality verified with Quantitative Insights into Microbial Ecology (QIIME 2) software [75] and SILVA 138 was used as a sequence reference to assignment.
3. Results and Discussion
3.1 Power generation from the initial OCS
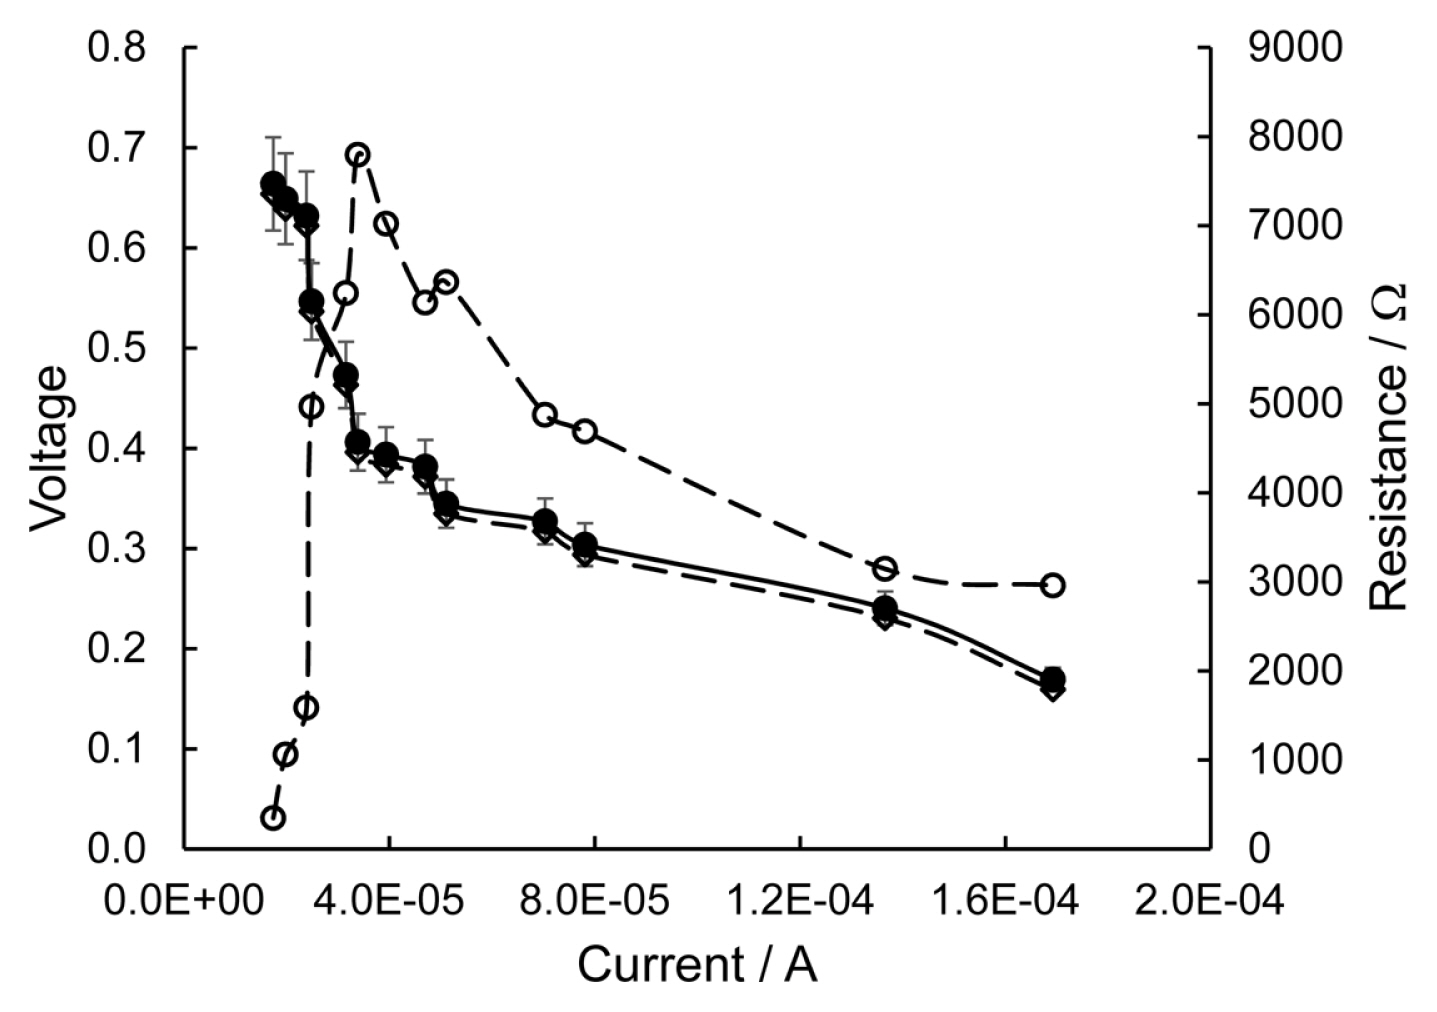
Fig. 2 shows an experimental polarization curve (●), obtained from a SMFC (CF-cathode) loaded with initial OCS and laboratory tap water (pH 8) as catholyte. In the same graph, the variation of the Rint (○) and the polarization curve evaluated by eq. 1 (⋄) are also represented. A relatively high OCV was observed (0.66 ± 0.06 V). However, as soon as some low current (from 1.8×10⁻⁵ A to 3.4×10⁻⁵ A) was withdrawn from the SMFC, the Rint increased dramatically, from 350 Ω to 7800 Ω. Consequently, the VSMFC drops to 0.40 V due to major drive losses. As current continues to flow (from 3.4×10⁻⁵ A to 1.4×10⁻⁴ A) both parameters, VSMFC and Rint start to slowly decrease, steadily due to ohmic losses, until reaching 0.24 V and 3145 Ω, respectively. Finally, concentration losses limit current (1.7×10⁻⁴ A) and voltage (0.17 V) SMFC outputs.
The power vs current curve was obtained from the polarization curve (not shown in this work). The maximum PD output (~4 mW m−2) was evaluated from the MPP. In the following runs (not shown in this paper), the catholyte concentration was systematically increased to reach 0.8M Na2SO4. However, the maximum PD output was essentially the same ~5 mW m−2. In the last run of this series, the CF-cathode was changed to birnessite/C-cathode. But the change had a small effect and a low SMFC performance of ~6 mW m−2 at 3.5×10⁻⁴ A was observed. The poor PD output is due to the high Rint mainly represented by four losses: i) OCV, the SMFC thermodynamic standard voltage deviation; ii) activation losses; iii) ohmic losses; iv) concentration losses. Consequently, a high Rint (8000 Ω to 3000 Ω) was observed (○, Fig. 2) throughout the recorded SMFC current. SMFC Rint can be minimized by properly tackling such major losses and such a strategy is discussed in the following sections.
3.2 Power generation from the OCS amended with gasoline
In generally, when the source of organic carbon increases, the rate of biodegradation also increases. However, an excess of organic carbon can limit the biodegradation rate due to several factors [76,77]. From an environmental point of view, gasoline is considered a toxic mixture of compounds (known as BTEX) that has a low rate of biodegradability [78]. Nevertheless, we hypothesized that those indigenous bacteria, which come in the initial OCS, could biodegrade gasoline in the SMFC anolyte improving its performance (in terms of PD production and reducing Rint). Several OCS representative samples were amended with three different concentrations (15 g, 9 g, and 3 g) of gasoline (biostimulation procedure) close to the anode surface. Simultaneously, the catholyte was improved with different Na2SO4 concentrations and pH values, the cathode was birnessite/CF. As a result, the main losses of the SMFC were reduced. In all figures, the polarization and PD curves were represented by solid and dashed lines, respectively.
3.2.1 15 g of gasoline
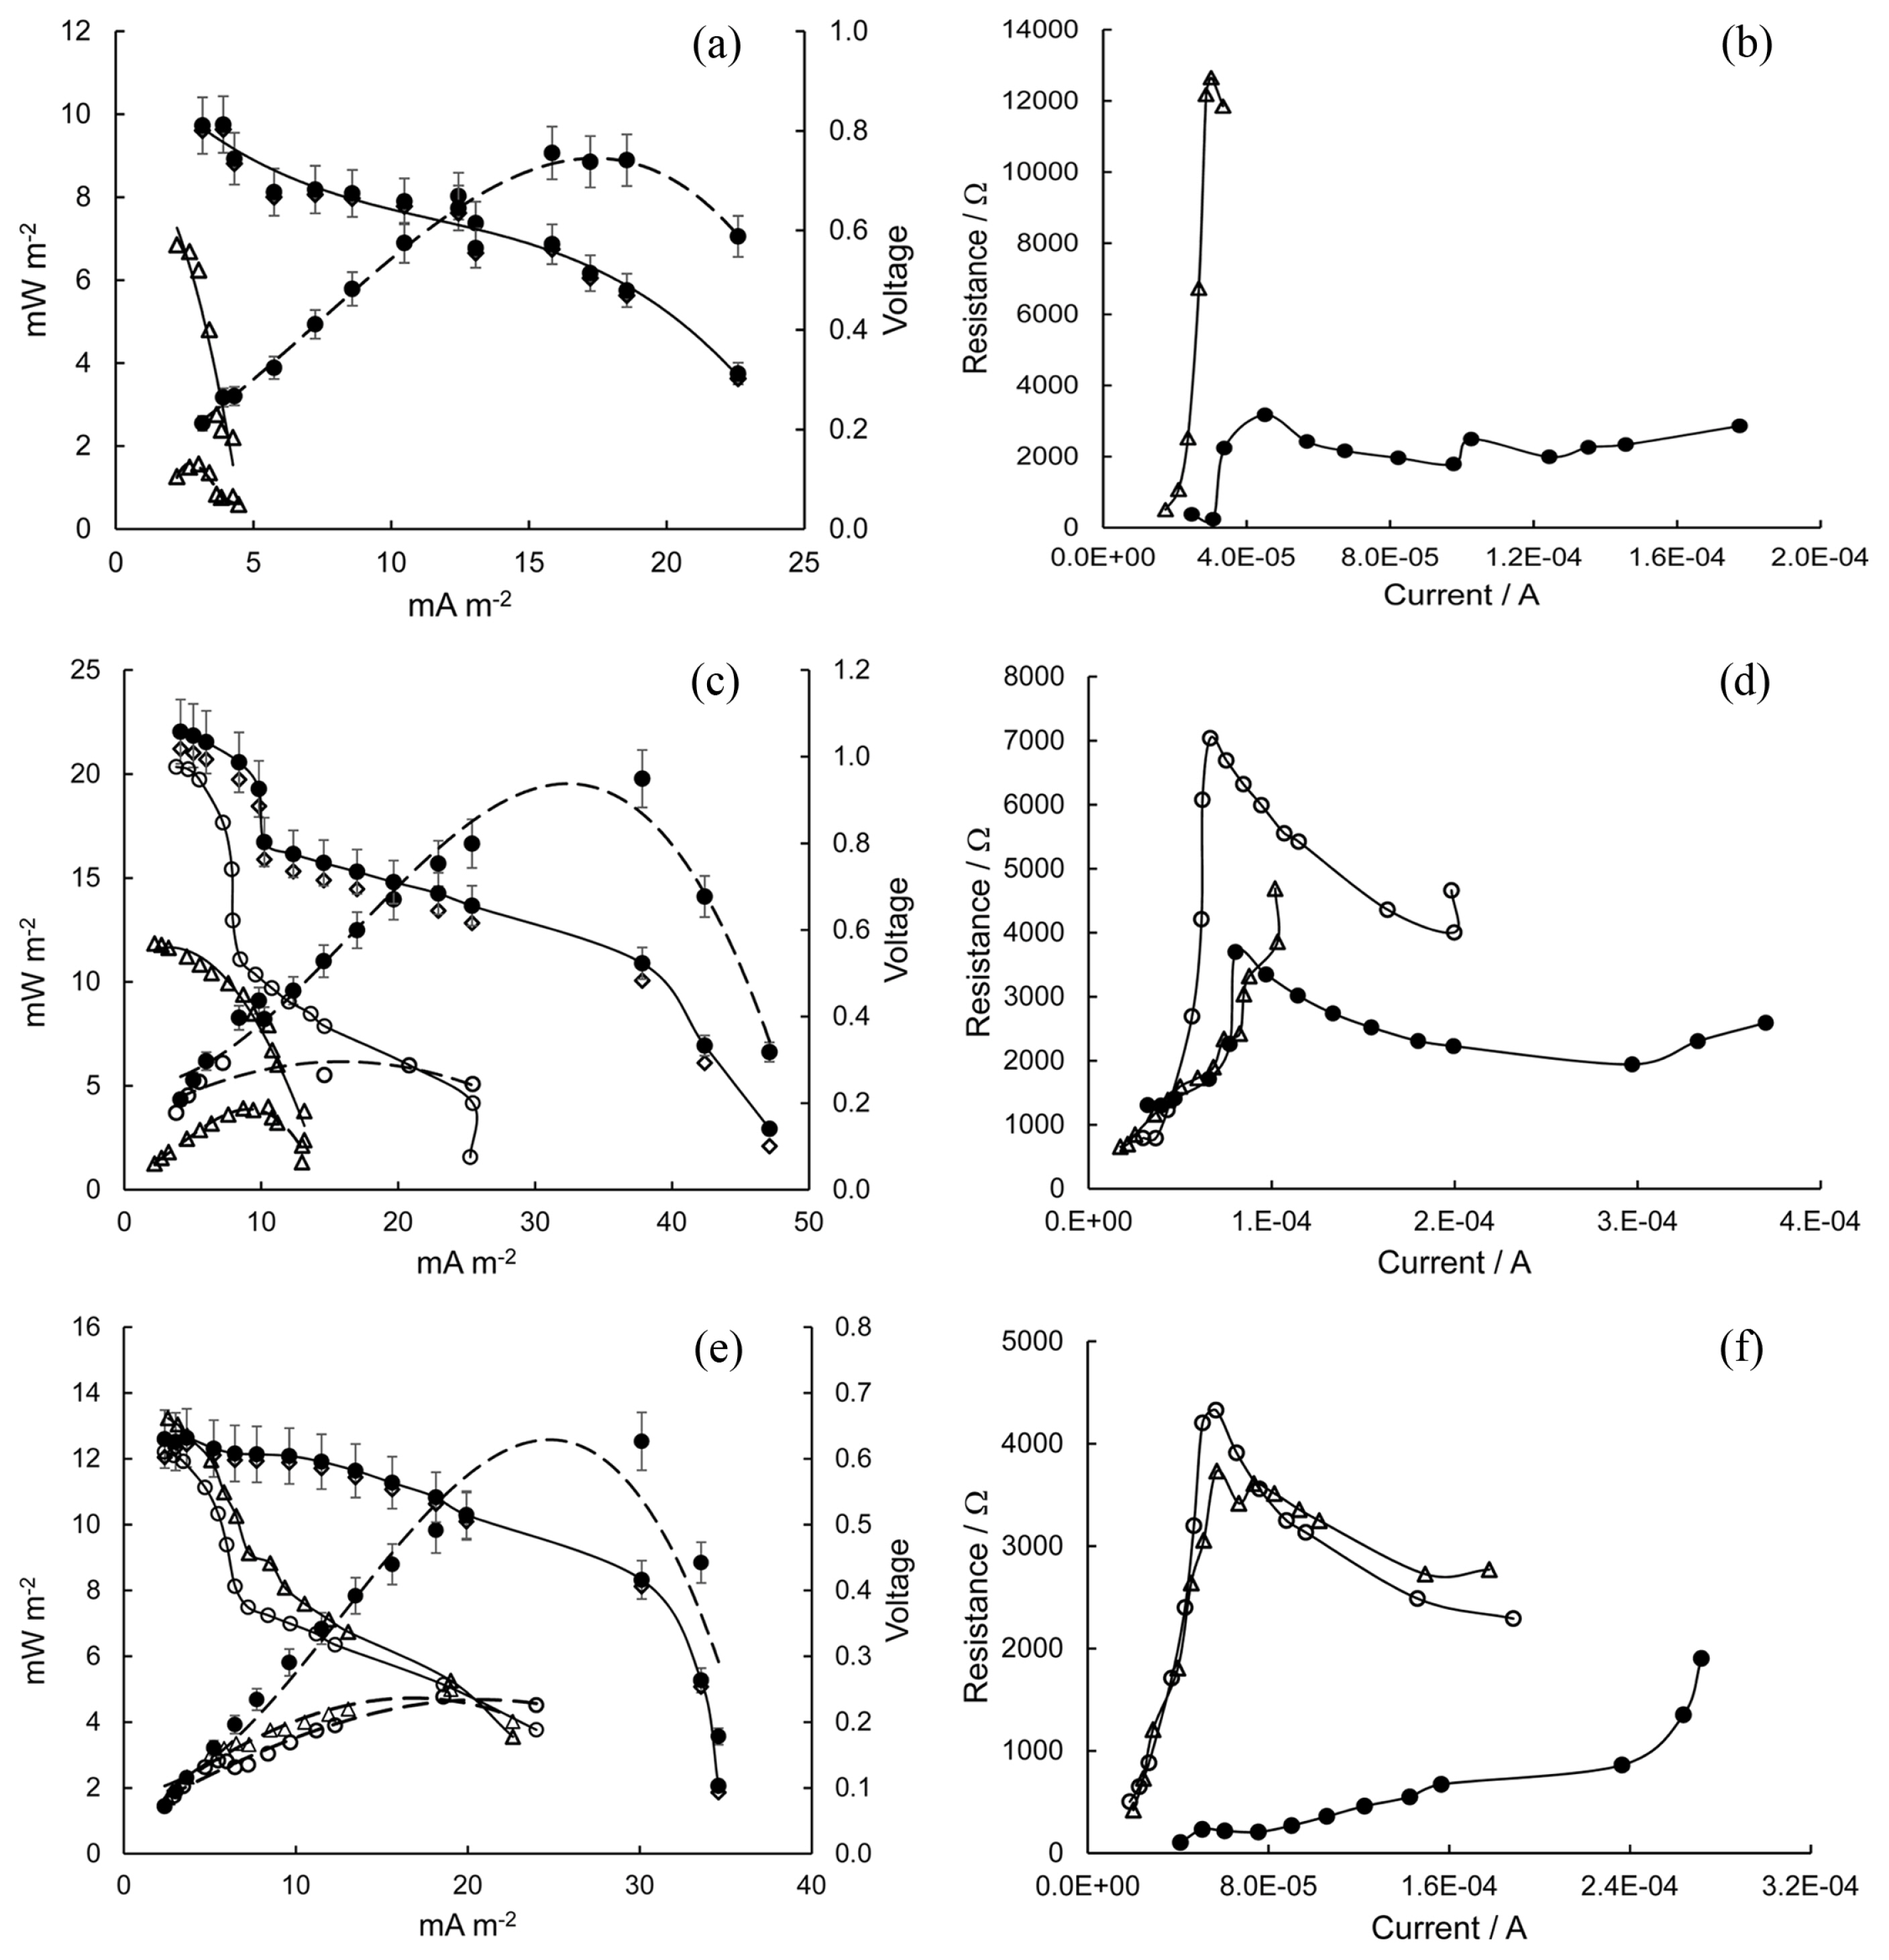
Fig. 3a shows the polarization and PD curves. For a tap water catholyte (pH 8) and a CF-cathode, the SMFC OCV was 0.57 V (Δ) and such a low value can be associated with the catalyst properties of both electrodes [50]. Although the organic content was increased, the maximum PD output was very low (Δ, 1.6 mW m−2). The corresponding polarization curve (Δ) shows that the VSMFC was quickly consumed by a sharply increase in Rint (Fig. 3b, Δ: 500 Ω to 12600 Ω) at low currents (from 1.8×10⁻⁵ A to 3×10⁻⁵ A) which represents the activation losses. When the SMFC cathode was changed to birnessite/CF and the catholyte was adjusted (0.8 M Na2SO4, pH 2) the SMFC OCV increased until reaching 0.81 V (●). This suggests that ORR reduced losses to zero current at the cathode. Furthermore, the main losses (activation losses, ohmic losses, minimized internal currents) were reduced. Consequently, the polarization curve (●) shifted towards more positive potentials. However, the maximum PD output was 9 mW m−2 (●). Although the Rint variation with current (●, Fig. 3b) was better than in the previous case, it is still high and therefore the PD output of SMFC was limited. The polarization curve estimated by (eq. 1) is marked with (⋄).
3.2.2 9 g of gasoline
Fig. 3c shows the polarization and PD curves. For a tap water catholyte (pH 8) and a CF-cathode, the SMFC OCV was 0.57 V (Δ). Although the organic content was reduced, with respect to the previous experiment, the maximum PD output was increased slightly (Δ, 4 mW m−2). The link between biodegradation activity and the amount of organic matter available is unclear. However, the presence of some by-products during biodegradation (including some organic acids) can inhibit the activity of bacteria [77,79]. A critical concentration of PAH in the OCS may also alter the biodegradation activity/rate [5]. The polarization curve (Δ) shows that the activation losses consume a significant fraction of the generated voltage (VSMFC). At low currents (< 7×10⁻⁵ A), the Rint (Δ, in Fig. 3d) increased rapidly. When the cathode from SMFC was changed to birnessite/CF and catholyte was adjusted (0.8 M Na2SO4, pH 8), the OCV of SMFC was 0.98 V (○). This suggest that the losses at zero current in the cathode were reduced and ~0.40 V were recovered. However, the polarization curve (○) and the Rint variation (○) at low and medium currents indicate that the VSMFC was consumed by activation and ohmic losses. Therefore, the maximum PD output was still limited (○, 6 mW m−2). By changing the catholyte pH to 2, the SMFC OCV increased to 1.06 V (●). This confirms that ORR improves at low pH values on catalyzed cathodes. From the polarization curve (●) and the Rint variation (●, Fig 3d) at low, medium, and high currents, all losses were minimized. Therefore, the maximum PD output (●, 20 mW m−2) was improved. But Rint is still high (3700 Ω to 2000 Ω). The polarization estimated by (eq. 1) is marked with (⋄).
3.2.3 3 g of gasoline
Fig. 3e shows the polarization and PD curves. For a tap water catholyte (pH 8), CF-cathode, and the presence of lower organic content, with respect to the previous experiment, the OCV (Δ, 0.66 V) was slightly increased. However, due to activation losses (mainly due to ORR) at low currents (Fig. 3f, Δ, Rint), the polarization curve shows that the VSMFC decreased rapidly (Δ). Consequently, the maximum PD output was low (Δ, 5 mW m−2). When the SMFC cathode was changed to birnessite/CF and the catholyte was adjusted (0.8 M Na2SO4, pH 8), the OCV of SMFC (○, 0.61 V) decreased slightly. Nevertheless, both the polarization curve (○) and the activation losses (○, Fig. 3f) were very similar to those obtained in the previous experiment, limiting the maximum PD output (○, 5 mW m−2). When the catholyte pH was set to 2, the SMFC OCV did not changed to much (●, 0.63 V). This suggests poor biodegradation activity at the SMFC anode. Consequently, at high currents, the development of the maximum PD output (●, 12 mW m−2) was limited by concentration losses. However, the activation and ohmic loses were minimized (●, Fig. 3f), shifting the polarization curve (●) towards more positive potentials. In summary, SMFC performance can be improved (in terms of PD output and Rint reduction) when the following modifications were made. Anolyte: OCS amended with a moderate amount (9 g) of gasoline improves the biodegradation activity of the indigenous bacteria group without the addition of any additional growth medium. Catholyte: ORR is carried out in birnessite/CF in a medium of 0.8 M Na2SO4, pH 2. In contrast, poor performance of SMFC occurs when the OCS is amended with 3 g or 15 g of gasoline close to the anode surface. Similarly, by keeping the birnessite/CF, SMFC performance worsens if catholyte pH 2 gradually changes to higher values. Nonetheless, in all gasoline cases, bioremediation of gasoline-containing OCS could be a feasibly approach.
3.3 Power generation from kerosene-amended OCS
Kerosene is composed mainly of medium chain alkanes and is considered an easier biodegradable pollutant than gasoline [80–82]. Consequently, we hypothesize that indigenous bacteria can enhance their biodegradation activity when OCS is amended with kerosene instead of gasoline. Therefore, SMFC performance (in terms of PD output and Rint reduction) is expected to improve. Several representative samples of OCS were amended with three different concentrations (15 g, 9 g, and 3 g) of kerosene (biostimulation procedure), near the anode surface. Simultaneously, the catholyte was improved with different Na2SO4 concentrations and pH values, the cathode was birnessite/CF. As a result, SMFC main losses were reduced. In all figures, the polarization and PD curves were represented by solid and dashed lines, respectively. For simplicity, the polarization curves evaluated by eq. 1 were not included in the graphs.
3.3.1 15 g of kerosene
Fig. 4a shows the polarization and PD curves for the following conditions: (⋄) tap water catholyte (pH 8) and a CF-cathode; the following tests have in common a catholyte of 0.8 M Na2SO4 and a birnessite/CF but different pH values such as (◆) pH 8, (▲) pH 6, (○) pH 4, (●) pH 2. As soon as the catholyte became more acidic, the OCV gradually shifted in a higher voltage direction, from 0.62 V to 1.20 V. Consequently, the polarization curves moved in the same direction. At different ranges of current, low, medium, and high, their corresponding losses were systematically reduced (Fig. 4b with the same symbols as before). However, in acidic catholytes, the SMFC Rint was still high (> 1000 Ω). The available kerosene chemical energy was converted to energy more efficiently as the catholyte pH gradually decreased from 8 to 2. Under the best conditions, the maximum PD output was 40 mW m−2. This compares with the 9 mW m−2 obtained for 15 g of gasoline. This confirm that kerosene is a pollutant that biodegrades more easily than gasoline.
3.3.2 9 g of kerosene
The polarization and PD curves, shown in Fig. 4c, were obtained under the following conditions: (⋄) tap water catholyte (pH 8) and a CF-cathode; the following tests have in common a catholyte of 0.8 M Na2SO4 and a birnessite/CF but different pH values: (◆) pH 8, (▲) pH 6, (○) pH 4, (●) pH 2. The SMFC performance was improved as a function of catholyte pH. The OCV was moved from 0.63 V to 1.23 V. With respect to the current axis, the polarization curves rose towards a more positive voltage direction, minimizing main losses (Fig. 4d) and generating more power. In acidic catholytes, the SMFC Rint was ~400 Ω. At pH 2, the maximum PD output was 100 mW m−2. This compares with 20 mW m−2, obtained for 9 g of gasoline. This again confirms that kerosene is a pollutant that biodegrades more easily than gasoline.
3.3.3 3 g of kerosene
For this set of experiments, the SMFC anode area was increased (see section 2.2). Fig. 4e shows the polarization and PD curves for the following conditions: 0.8 M Na2SO4 catholyte and birnessite/CF but different pH values. (⋄) pH 8, (◆) pH 6, (○) pH 4, (●) pH 2. A gradual decrease in catholyte pH improves the following SMFC parameters: OVC increases from 0.62 V to 0.92 V, the SMFC power output increases from 23 mW m−2 to 187 mW m−2, the polarization curves were raised towards a more positive voltage direction, minimizing the main losses (Fig. 4f). In this case, a higher anode area allowed a higher SMFC power output while the Rint was minimized (<300 Ω) across the recorded SMFC current, something similar was noted earlier [83,84]. In summary, the SMFC performance improved considerably when 9 g of gasoline was exchanged for 3 g of kerosene and the anode area of SMFC was increased. As in the previous case of gasoline, the addition of a different amount of kerosene improves the biodegradation activity (without the addition of any additional growth medium) of the indigenous bacteria group, making both SMFC strategies feasible: bioremediation or generation of power.
3.4 Analysis of the composition of the microbial communities (initial sediment, anode biofilm and anodic sediment)
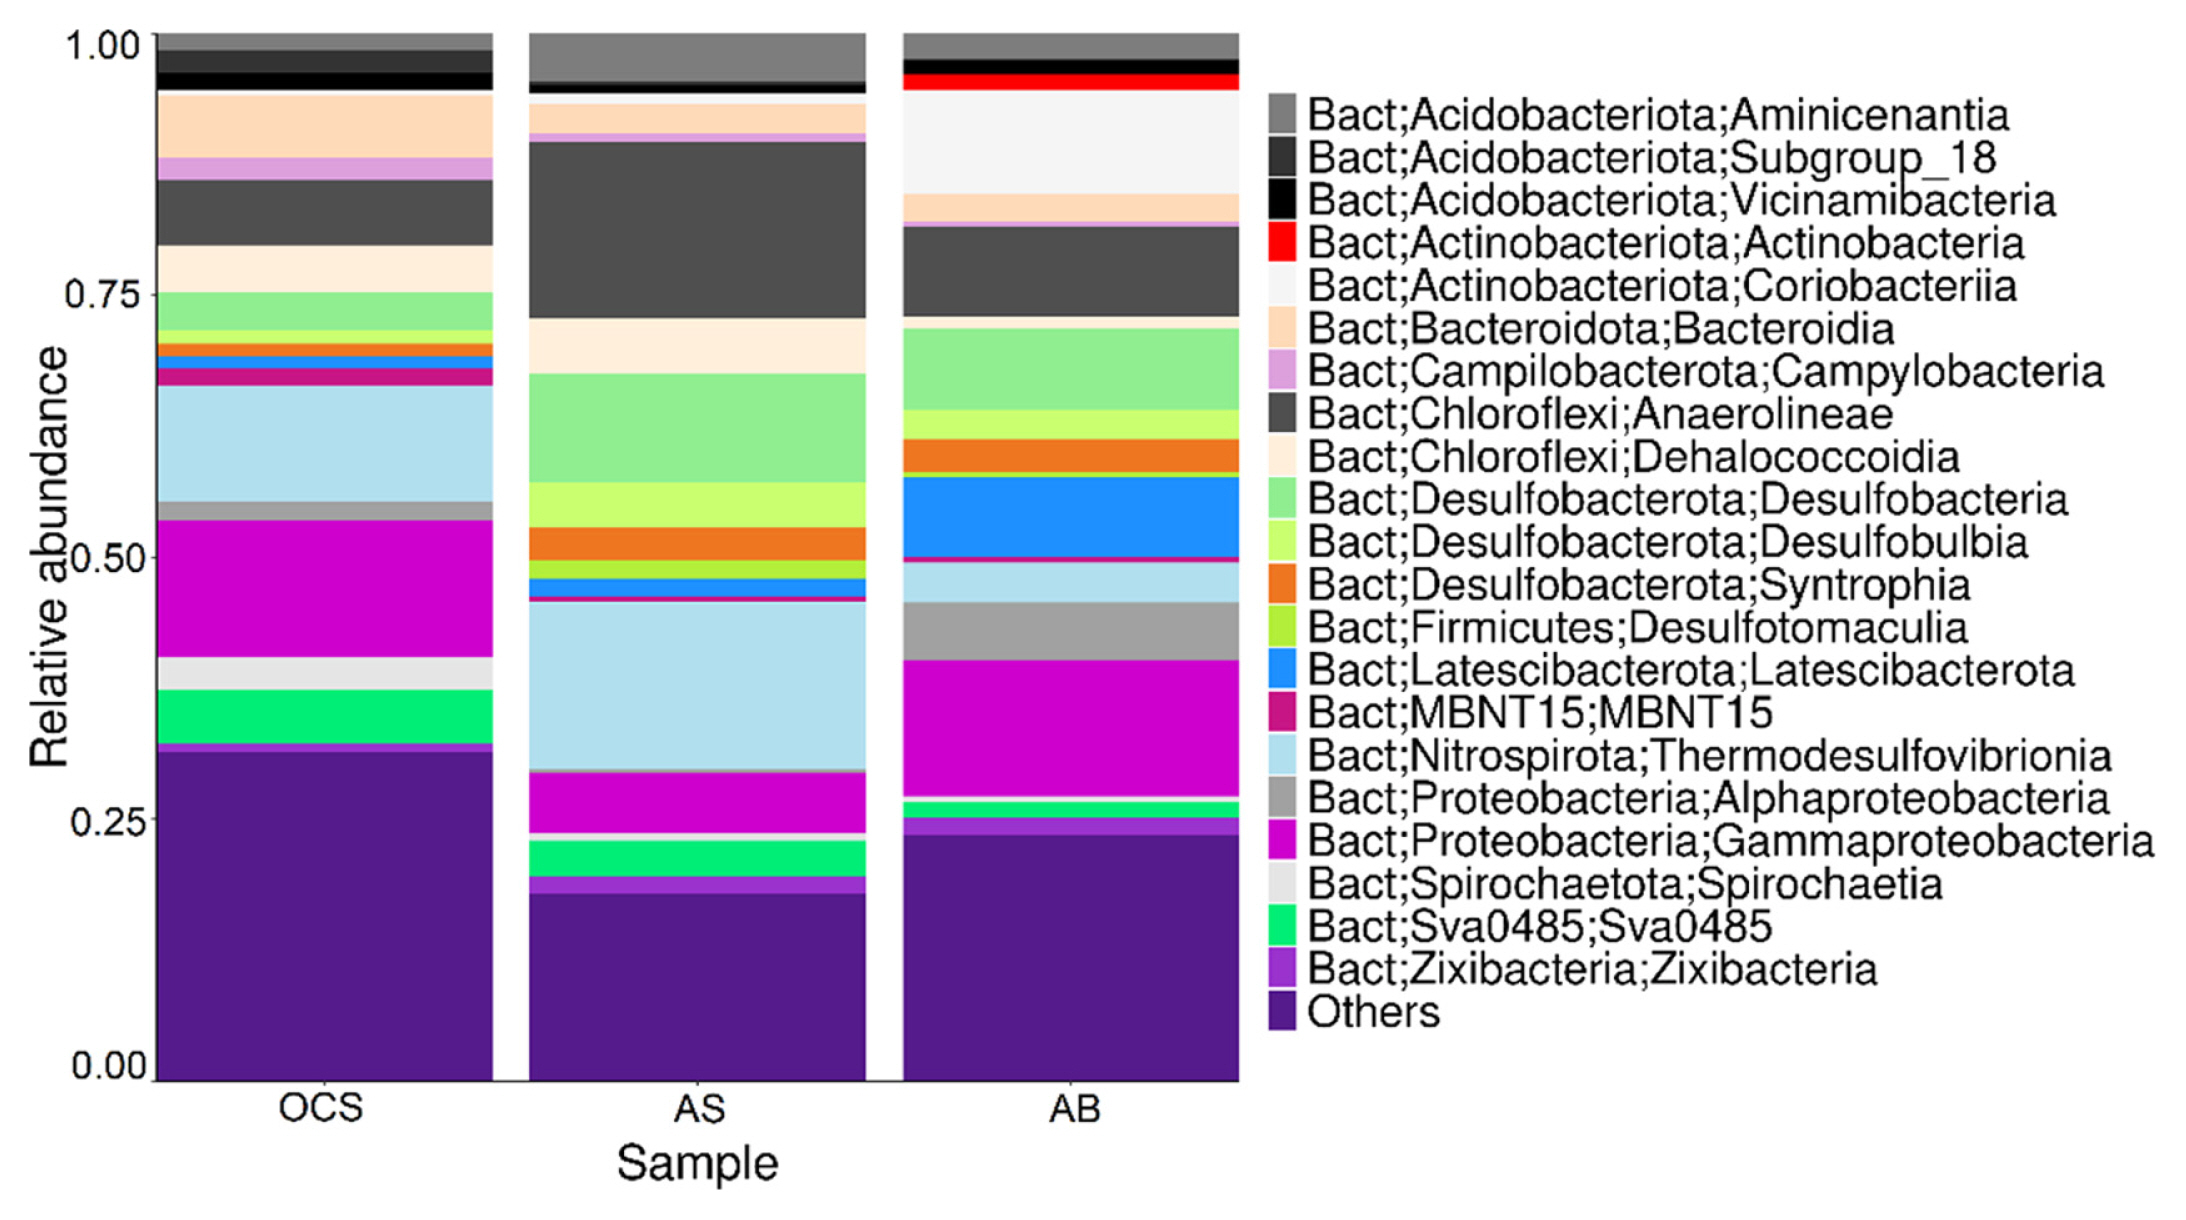
The presence, composition and dynamic diversity of microbial flora depends on the chemical concentration/composition of the OCS [62,85], the applied Rext [86], the pH near the anode surface [79], among other parameters. Therefore, the SMFC performance depends on the exoelectrogenic community evolution on the anode surface. The diversity of indigenous bacteria is expected to change from its initial composition and abundance when anaerobic biodegradation occurs in the anode compartment of SMFC. The microbial diversity in the anode biofilm (AB) and anodic sediment (AS) was analyzed and compared with the initial microbial composition present in OCS to understand the putative metabolic activities to degrade kerosene and organic material from sediment.
Fig. 5, represents the relative abundance at class level of the three samples, as can be seen, some groups were enriched from the OCS in the AB and in the AS. In the AB, the class Latescibacteria (~7.5%), Coriobacteriia (~10%), and Gammaproteobacteria (~12.5%) were the most abundant. These groups have versatile metabolisms, Coriobactreriia and Gammaproteobacteria are reported to have electroactive members. Coriobacteriia have the potential to interact with metal surfaces via direct interspecies or extracellular electron transfer and could degrade oil. Latesibacteria is a new proposed class with a poorly studied metabolism, found in environments rich in Fe oxides. In addition, the classes Actinobacteria and Alphaproteobacteria only increased in AB, both classes with electroactive members. In AS, the class Anaerolileae (Phylum Chloroflexi), Thermodesulfovibrionia (Phylum Nitrospirota), and the class Desulfobacteria were the most abundant. These bacterial groups present various metabolic pathways and oxidize all organic matter and kerosene and perform the electron transfer to the anode. Chloroflexi has a diverse electrogenic microorganism and a high metabolic diversity. In recent and similar works, [85,87] after OCS treatment of SMFC, groups as Gamaproteobacteria, Actinobacteria, Alphaproteobacteria, Anaerolileae, Bacteroidia and Sphongobacteria were found in both AS and AB, a class level. These results agree with those obtained in this work. Fig. 6 shows the relative abundance of the 25 most represented bacteria at the genus level and the comparison between samples. It should be noted that unknown and uncultured microorganisms that do not reach the genus level were identified in SMFC samples, their association at a higher taxonomic level are shown in Fig. 6. However, due to their high abundance it is important to take them in account, to elucidate their metabolic role in this complex microbiome. After OCS SMFC treatment [85], uncultured Aanaerolineaceae has been enriched and coincides with the main groups reported in Figure 6. The uncultured OPB41 from (Coriobacteriia) has been found in environments with oil contamination and was highly enriched in anodic biofilm [88,89]. In the OCS and AS, Nitrospirota (Thermodesulfovibrionia) was the most abundant group, this bacterial group is characterized by anaerobic sulfate reducing metabolism [90,91]. Dyella, Smithella, Desulfusarcinaceae, Aminicenantales were bacteria enriched in AB and AS with members of electroactive bacteria found in MFC, some of them are also sulfate reducers [92–94].
4. Conclusions
Low PD (~4 mW m−2) can be recovered from initial OCS in SMFC anolyte while ORR is performed on CF-cathode in tap water at pH 8. PD output is limited by a high SMFC Rint which depends on two key factors: the amount and quality of the organic matter content and the catholyte properties (ion strength, pH cathode material). When Rint is properly tackled, the SMFC PD output increases dramatically, nearly 50 times. The indigenous bacteria group that comes in the initial OCS can be adapted/enriched, without any addition of growth medium, to biodegrade gasoline (maximum 9 g) or kerosene (maximum 3 g) in the SMFC anolyte. At the class level, major microbial groups (Gammaproteobacteria, Coriobacteriia, Actinobacteria, Alphaproteobacteria) with electroactive members can effectively biodegrade kerosene, converting chemical energy into electrical energy while minimizing the internal resistance of SMFC. The uncultured OPB41 from (Coriobacteriia) was highly enriched in anodic biofilm and has been found in environments with oil contamination. However, gasoline is more difficult to biodegrade than kerosene. In both cases, SMFC biodegradation activity and potency production increase when ORR is performed on birnessite/CF in 0.8 M Na2SO4 at pH 2. The work discussed here can focus on bioremediation or energy production in future work.