1. Introduction
As a consequence of industrialization, the emission of greenhouse gases from the combustion of fossil fuels has continuously increased at an alarming rate in the past 800,000 years, reaching above 409 ppm in 2019 [1,2]. The accumulation of atmospheric carbon dioxide (CO2), one of the major greenhouse gases, has caused serious climatic changes owing to which unpredictable and extreme weather events have occurred more frequently [3,4]. For this reason, the reduction of carbon dioxide emissions is currently a global concern [5]. Carbon capture, utilization, and storage (CCUS) is an important process for reducing the greenhouse gas concentration by utilizing the waste CO2 from industrialized facilities [6–9].
The electrochemical CO2 reduction reaction (e-CORR) is a CCUS technology used to produce value-added chemicals, including CO, alcohols, and hydrocarbons using waste CO2 and electricity [10,11]. In particular, CO is an invaluable stock material used for the Fischer–Tropsch process to produce various liquid hydrocarbons [12]. Synthesis gas (syngas) is a gaseous mixture of CO and H2 used to produce a variety of chemicals, depending on the mixture composition, such as hydrogen (H2/CO≥50), ethanol (H2/CO≤1), and methanol (H2/CO = 2) [13]. The e-CORR catalyst has been rigorously developed with metal catalysts, such as Au [14–19], Ag [20], Zn [21,22], Cu [23], Ag-Cu [24], Ag-Sn [25], Cu-Au [26], and Cu-Pd [27]. Among them, Au and Ag nanoparticles have been reported to have higher selectivity toward CO production, where the weak CO adsorption onto the surfaces generates CO as the major product of e-CORR [14]. For example, Au nanoparticles with a size of 8 nm showed significant faradaic efficiency up to 90% for CO production at −0.67 VRHE [15]. Despite the active discovery of e-CORR catalysts, limited studies have been reported on the construction of electrochemical apparatus for practical and continuous CO production through e-CORR.
The effective incorporation of e-CORR catalysts into applicable devices and their stable operation is essential for the use of CCUS as a climate remediation technology. Certain previous studies have demonstrated the production of CO using gas-diffusion electrodes and e-CORR catalysts [28–31]. The apparent device performance depends on three factors: i) mass transport of CO2 to the electrode surface, ii) electron and ion conductivities through the supporting electrode or electrolyte to the active catalyst, and iii) favorable reaction kinetics at the catalyst surface with an appropriate chemical environment, such as pH, regulating the reaction activity and selectivity. Different cell configurations and operation methods have been suggested to control the operational factors for practical e-CORR.
For example, Delacourt et al. suggested the importance of a small gap between the membrane separator and e-CORR cathode of the e-CORR device, named Egap in this study; therefore, the presence of a buffered electrolyte near the active catalyst is important for the supply of CO2 and to adjust the local pH [28,29]. However, in the report, the product composition, that is, the ratio of CO to H2 produced by the e-CORR device, significantly changed over a few hours of continuous operation, and therefore, was inappropriate for practical applications [28]. The effect of operational parameters, such as CO2 gas pressure, catholyte flow rate, cell temperature, and applied current density, was investigated to control the syngas ratio produced by the device [30,31]. Longer time duration and stable operation up to 5 h was demonstrated with different H2:CO ratios, where the product composition or syngas ratio (H2:CO) was mainly modified from 1.5 to 2 by changing the device voltage from approximately 3 to 4 V [30]. In most of the previous reports on e-CORR device operation, the production rate, that is, the operating current and device voltage had to be changed simultaneously to control the product composition.
Herein, we demonstrate that the H2:CO ratio produced by the e-CORR device can be controlled by simply adjusting the mechanical parameters of the device. The e-CORR device has been reported to exhibit stable and continuous syngas production for over 23 h. By manipulating the Egap, that is, the distance between the cathode and ion-conducting separator, the faradaic efficiency of CO production was changed in addition to the voltage changes. The e-CORR device demonstrated in this study suggests a simple mechanical design factor to control the syngas ratio and total production rate.
2. Experimental
2.1 Electrode Preparation
Au nanoparticles (NPs) were synthesized in the presence of polyethylenimine (PEI-Au/C) as an e- CORR catalyst [32]. Briefly, the PEI-Au/C powder was synthesized by the chemical reduction of HAu-Cl4·3H2O (Sigma-Aldrich, St. Louis, MO, USA, 99.9%) using NaBH4 (Sigma-Aldrich, 99%,) in the presence of PEI (Sigma-Aldrich, 50 wt.% in water, Mw~2000) in an ethanol solution. The e-CORR catalyst was supported on porous carbon powder (Cabot Corporation, Boston, Massachusetts, USA, Vulcan XC-72). The e-CORR and oxygen evolution reaction (OER) catalysts were coated onto the supporting electrode, that is, carbon paper (Toray Industries Inc., Tokyo, Japan, TGP-H-090 porosity 78%) and titanium paper (Bekaert Inc., Zwevegem, Belgium, Tipaper250), respectively, for making up the cathode and anode. The loading amount of the catalyst at the cathode and anode was maintained at approximately 1 mg cm−2. the electrode layered with the catalyst, 1 mg of PEI-Au/C NPs was mixed with 8.57 mg of Nafion ionomer solution (Sigma-Aldrich, 5 wt.% in lower aliphatic alcohols and 15–20% water) and 61.86 mg of isopropyl alcohol (Honeywell, Charlotte, North Carolina, USA, Meet ACS Specifications, 99.9%) to form a catalyst solution. The Nafion ionomer content was 30 wt.% of the total solid content in the catalyst solution. After dispersion of the solution via ultrasonication for 30 min, the mixture was sprayed onto one side of the carbon paper using the hand spray method. For the OER, 1 mg of IrO2 NPs (Alfa Aesar Inc., Haverhill, Massachusetts, USA, Iridium(IV) oxide, 99.99%) was mixed with 1.08 mg of Nafion ionomer solution and 50.63 mg of isopropyl alcohol to form the catalyst solution. The Nafion ionomer content was 5.15 wt.% of the total solid content of the catalyst solution. The mixture was sonicated for 30 min and subsequently, the solution was sprayed onto the titanium paper surface using the hand spray method.
2.2 Half-cell Measurements
PEI-Au/C electrode was inserted into a 0.5 M KHCO3 aqueous solution (Sigma-Aldrich, 99.7%) saturated with CO2 (Sinyang Oxygen, Seoul, Korea, 99.99%) or Ar (Sinyang Oxygen, 99.999%). Deionized water was used as the solvent. An Ag/AgCl electrode or a saturated calomel electrode (SCE) and a Pt mesh were used as the reference and counter electrodes, respectively. Nafion Membrane NRE-212 (DuPont Inc., Wilmington, Delaware, USA, H+ form) was used as the separator between the cathode and anode in a three-electrode H-type cell. The relationship between the potential difference and current was measured using a potentiostat (BioLogic, Seyssinet-Pariset, France, HCP-803).
2.3 Device Assembly
The electrochemical cell used for CO production was fabricated as described below. A homemade graphite block with a serpentine flow channel served as the cathode flow plate and current collector, while a titanium block with a flow channel was used as the anode current collector. To ensure the chemical and electrochemical stabilities of the anode under oxidative OER environment, titanium paper and titanium block were used as the gas-diffusion layer (GDL) and current collector, respectively. A membrane electrode assembly (MEA) with a geometric surface area of 9 cm2 was fabricated by placing the anode and cathode on both sides of the proton conducting membrane (Nafion membrane, NRE-212, DuPoint Inc.). A polytetrafluoroethylene (PTFE) rubber gasket with a specific thickness of 100 or 200 μm was inserted, whenever necessary, between the cathode and polymer separator of the MEA to control the Egap. Thereafter, the MEA was inserted between the anode and cathode current collector.
2.4 Device Operation
An aqueous solution of 0.5 M KHCO3 (Sigma- Aldrich, 90%) and 0.5 M KOH (Sigma-Aldrich, 90%) were used as the catholyte and anolyte, respectively, for the e-CORR device operation. 0.5 M KHCO3 aqueous solution saturated with CO2 (Sinyang Oxygen, 99.99%) and gaseous CO2 at atmospheric pressure was mixed and fed into the cathode through a Y-shaped tube connector at a flow rate of 10 mL/min for both the gas and liquid. 0.5 M KOH solution was supplied to the anode at a flow rate of 10 mL/min. The flow was controlled using a peristaltic pump (Masterflex Inc., Gelsenkirchen, Germany, model no. 07523–90). The cell voltage was regulated from −1.8 to −3.0 V using a potentiostat (HCP-803) while measuring the device current, and the electrochemical impedance spectroscopy (EIS) data were collected in the frequency range of 100 kHz – 50 mHz with a voltage amplitude of 10 mV.
2.5 Characterization
The products of the CO2 reduction reactions in both the half-cell and full-cell experiments were analyzed using a gas chromatograph (GC, Agilent Technologies Inc., 7890B GC) equipped with a thermal conductivity detector (TCD) and a methanizer-flame ionization detector (methanizer-FID). The GC was calibrated for CO, H2, CH4, CO2, and N2. Ar was used as the carrier gas for GC measurements. A digital flow meter (Agilent Technologies Inc., ADM2000) was employed to quantify the flow rate at the outlet of the GC equipment. The amount of CO produced and the CO partial current density were estimated by the gas flow rate and CO concentration obtained from GC. Field emission scanning electron microscopy (FE-SEM) images of the prepared GDE were recorded with an S-4200 (Hitachi Inc., Ibaraki, Japan). Transmission electron microscopy (TEM, FEI TITANTM 80–300) was used to observe the asprepared PEI-Au/C catalyst. X-ray diffraction (XRD) measurements were performed using a D/Max 2500 v/PC (Rigaku Co., Tokyo Japan) with Cu-Kα radiation (40 kV, 1.5406 Å). Thermogravimetric analysis (TGA, Q50, TA Instruments) was conducted in air at a ramp rate of 10 K/min.
3. Results and Discussion
3.1 Half-cell measurement
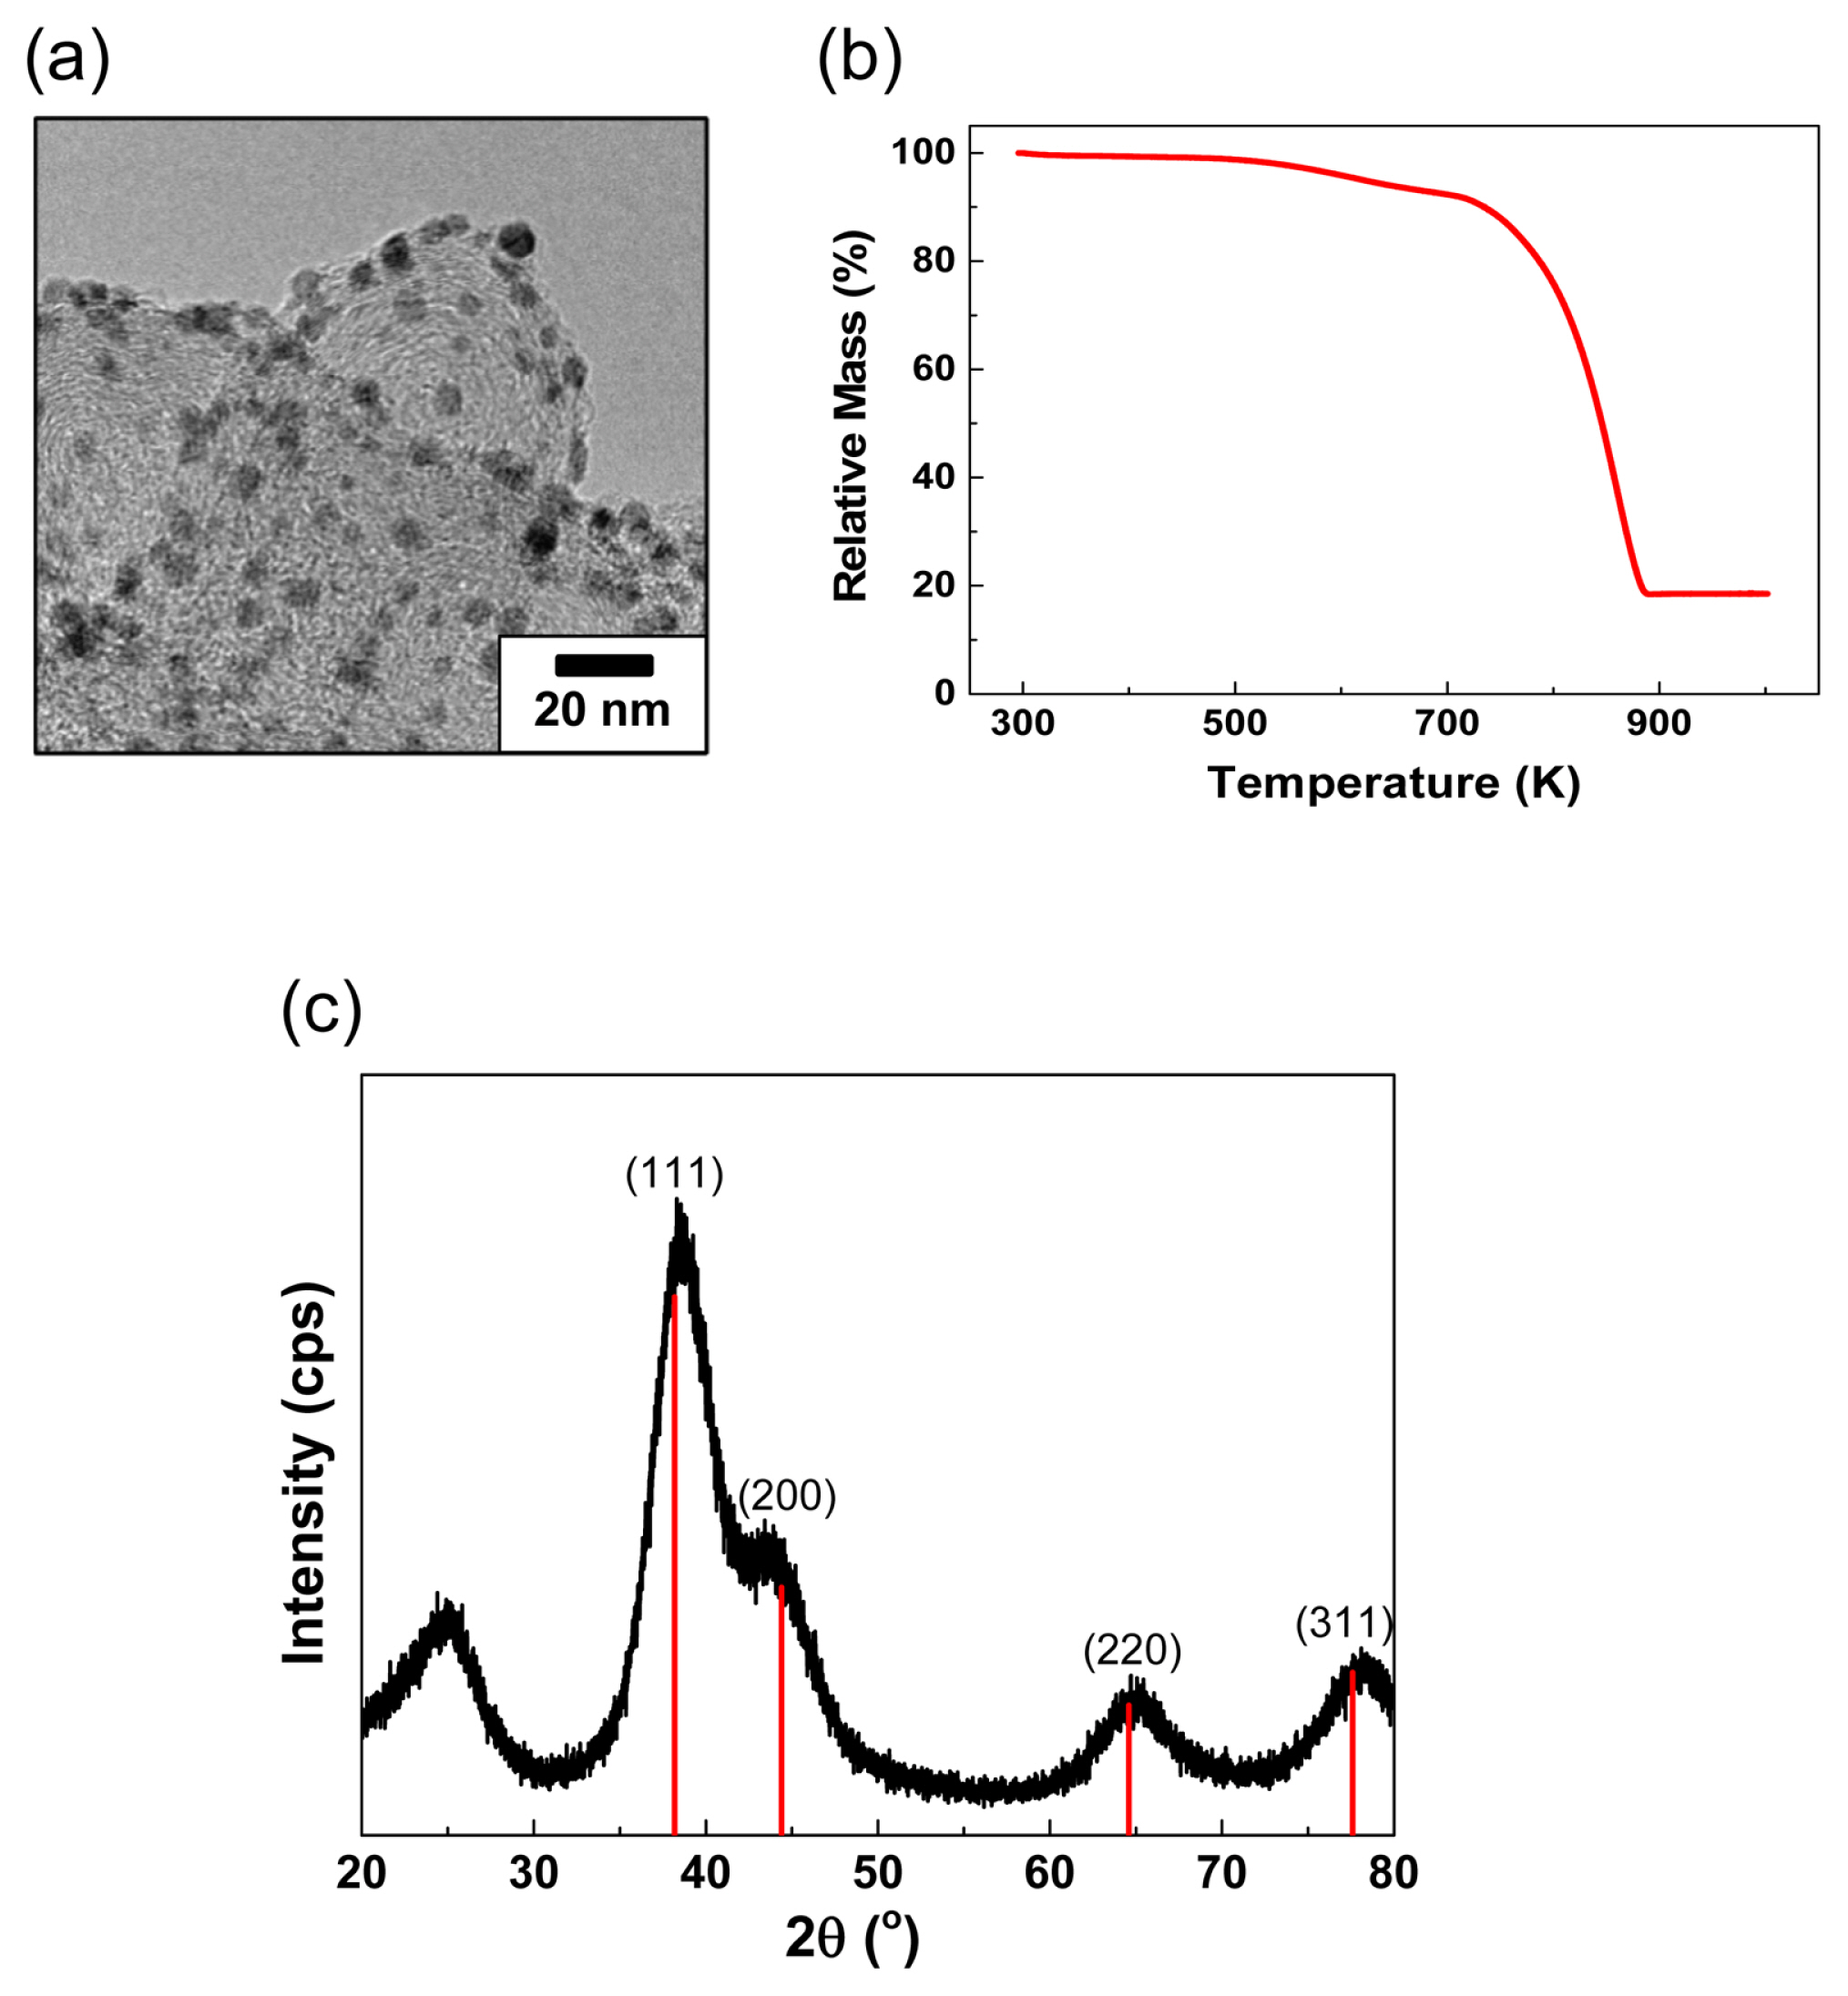
PEI-Au/C was selected as the e-CORR catalyst [32,33]. As reported previously, Au NPs synthesized in the presence of PEI have a smaller size of 3 nm for enhanced CO2 reduction activity [32]. The catalyst NPs supported on a highly conductive carbon presented a uniform size distribution (size of approximately 100 nm), as shown in the TEM image (Fig. 1a). The amount of the active catalyst was adjusted to approximately 20 wt.% as evidenced from the TGA analysis (Fig. 1b). In the TGA analysis, PEI and carbon were completely oxidized at 923.15 K, while the Au NPs remained. Further, the crystal size of the Au NPs, as estimated by the Scherrer equation, and calculated using the (220) peak broadening of the face-centered cubic Au crystals in the XRD patterns, was found to be approximately 2 nm, which is in good agreement with the apparent size observed under the microscope (Fig. 1a and c). This implies that the NPs layered on the carbon support form a solid crystal with insignificant particle agglomerations.
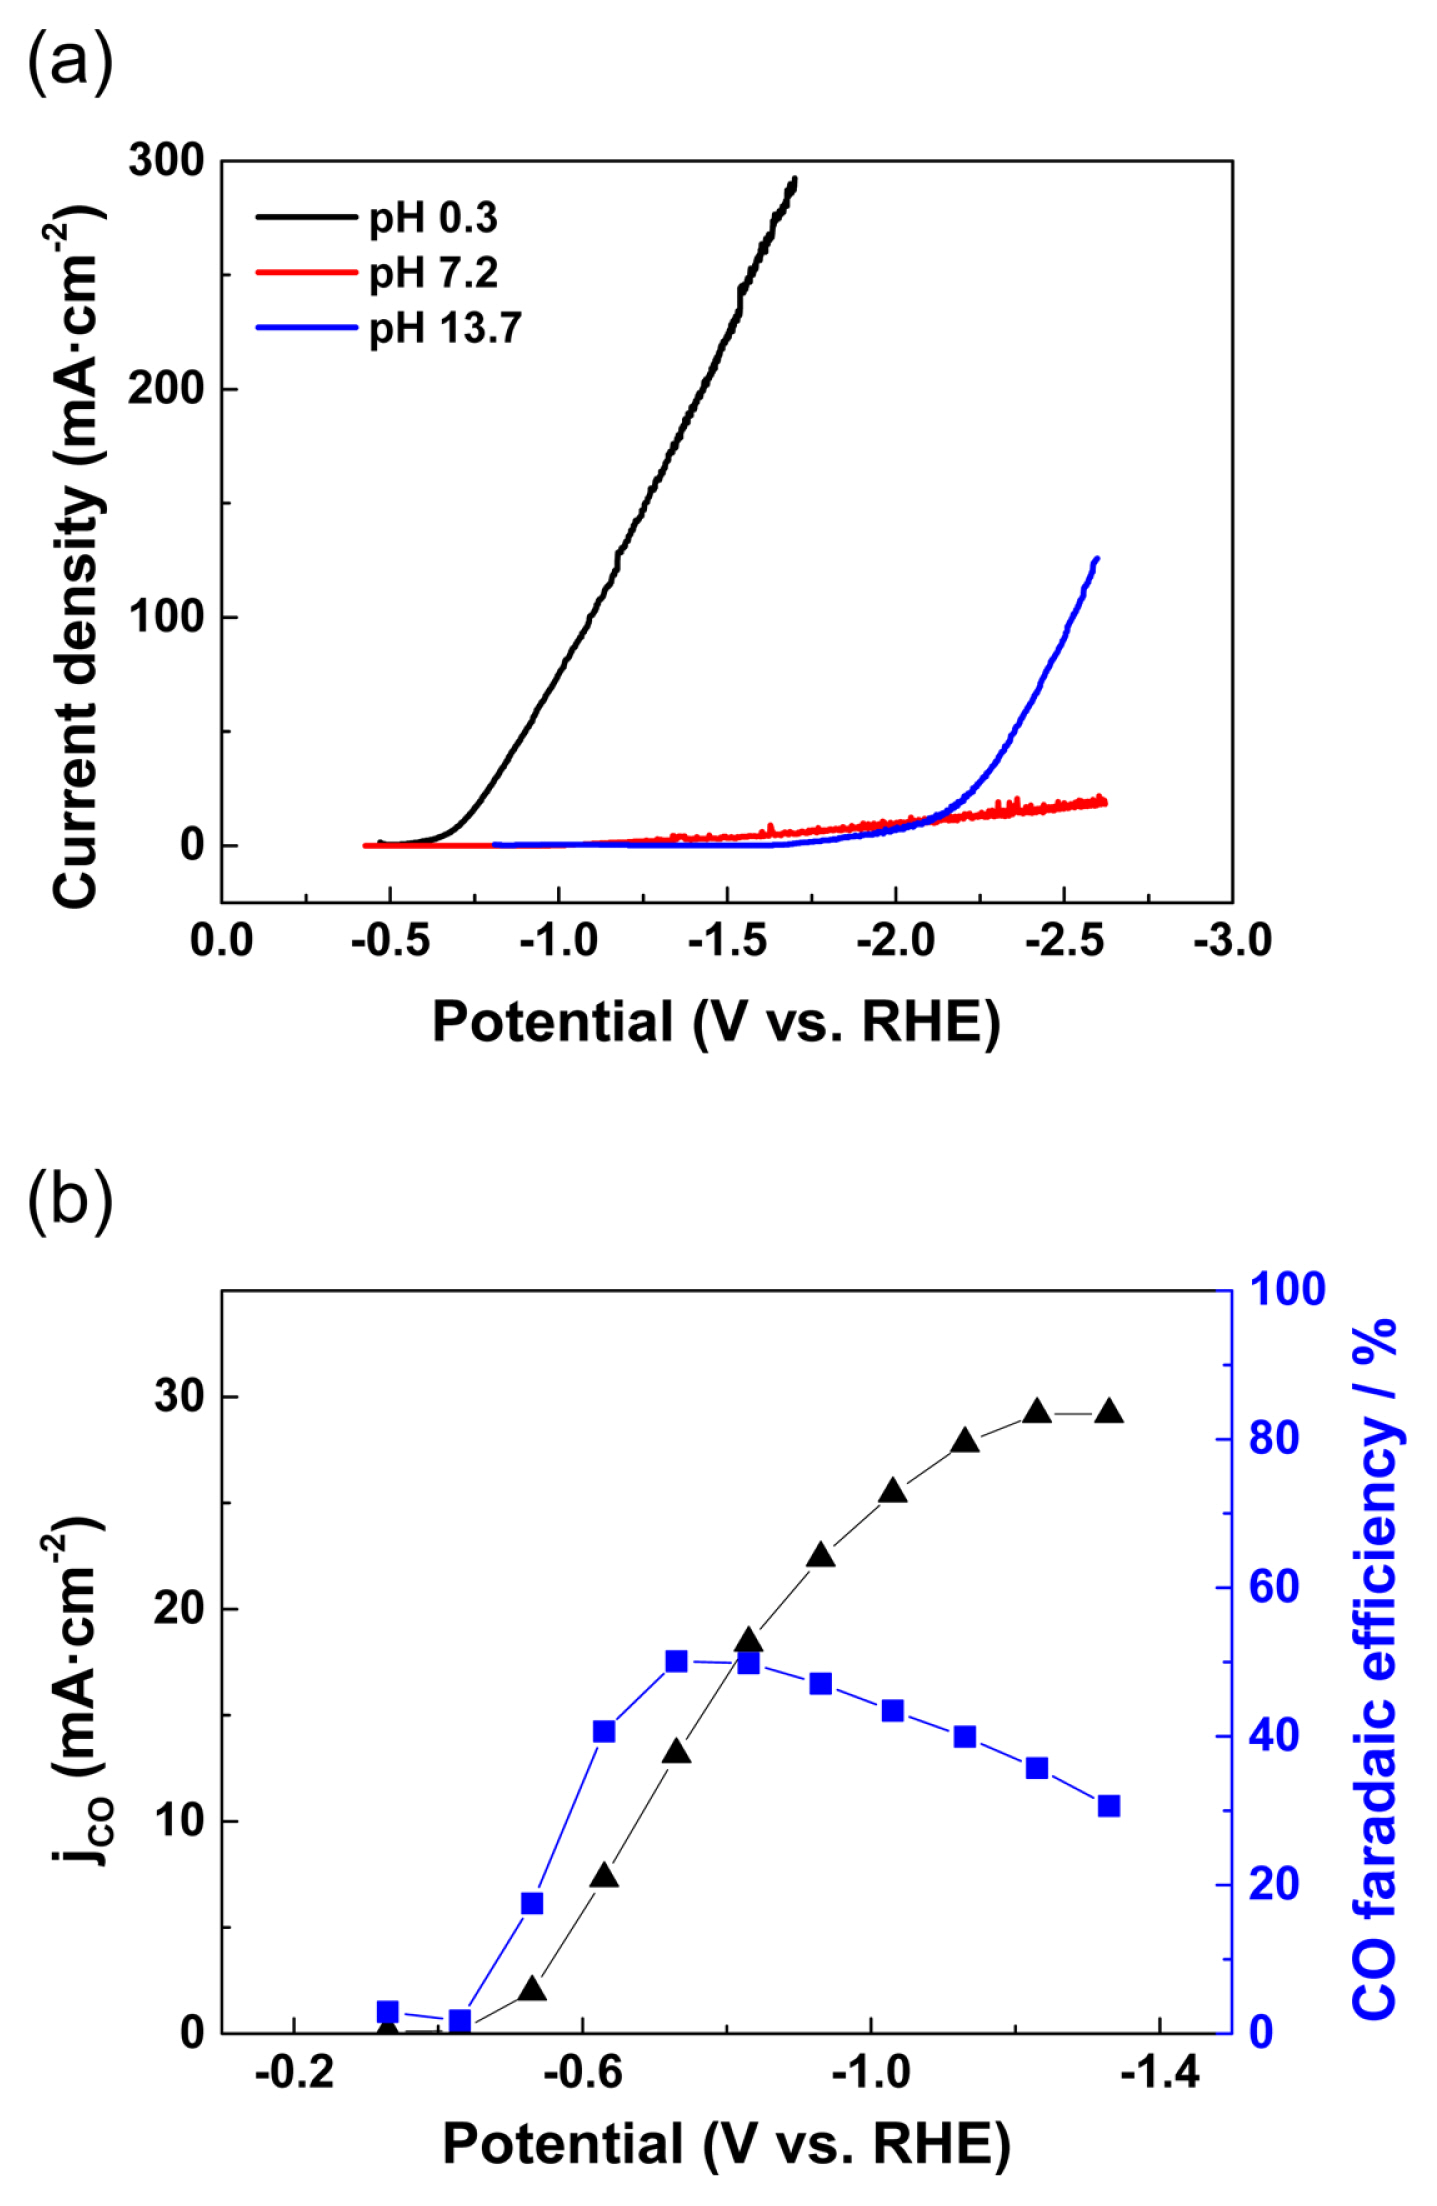
The electrochemical proton reduction activity of the PEI-Au/C catalyst was first investigated in three different aqueous electrolyte solutions under an Ar atmosphere (Fig. 2a, stationary electrode). As expected, the Au catalyst showed significant overpotential for the proton reduction reaction. It is essential to have an overpotential greater than 0.5 V to initiate the Hydrogen evolution reaction (HER) even in a strongly acidic solution, that is, 0.5 M H2SO4 solution (pH 0.3), and approximately 2 V for a strong basic solution (pH 13.7, 1 M KOH, Fig. 2a). Furthermore, no exponential increase of the HER current was observed up to a cathode potential of −2.5 VRHE at the PEI-Au/C catalyst in a neutral aqueous solution (pH 7.2, 0.5 M KHCO3). As the mitigation of HER activity is important for e-CORR catalysis, it was decided to use 0.5 M KHCO3 aqueous solution as the CO2 reduction medium for further experiments.
In the CO2 saturated 0.5 M KHCO3 aqueous solution, the PEI-Au/C catalyst exhibited significant e-CORR activity at potentials more negative than −0.4 VRHE (Fig. 2b, rotating ring-disk electrode (RRDE) measurement). The on-set potential of the e-CORR at the PEI-Au/C catalyst was approximately −0.4 VRHE, and the current density exponentially increased at a potential up to −1.3 VRHE; subsequently, it reached a saturation current density of approximately 30 mA/cm2. A volcano-shaped CO faradaic efficiency was observed at the PEI-Au/C electrode, and the maximum CO faradaic efficiency was approximately 45% at −0.7 VRHE. The faradaic efficiency continuously decreased when the potential was shifted to values more negative than −0.7 VRHE, which facilitated HER activity.
Based on the fundamental investigation of the PEI-Au/C electrode in half-cell experiments, a CO2 saturated neutral aqueous electrolyte was selected as the catholyte for facile e-CORR without dominant HER activity for the two-electrode full-cell device. 0.5 M KOH aqueous solution and IrO2 catalyst were selected as the anolyte and OER catalyst, respectively, for the device.
3.2 Device measurement
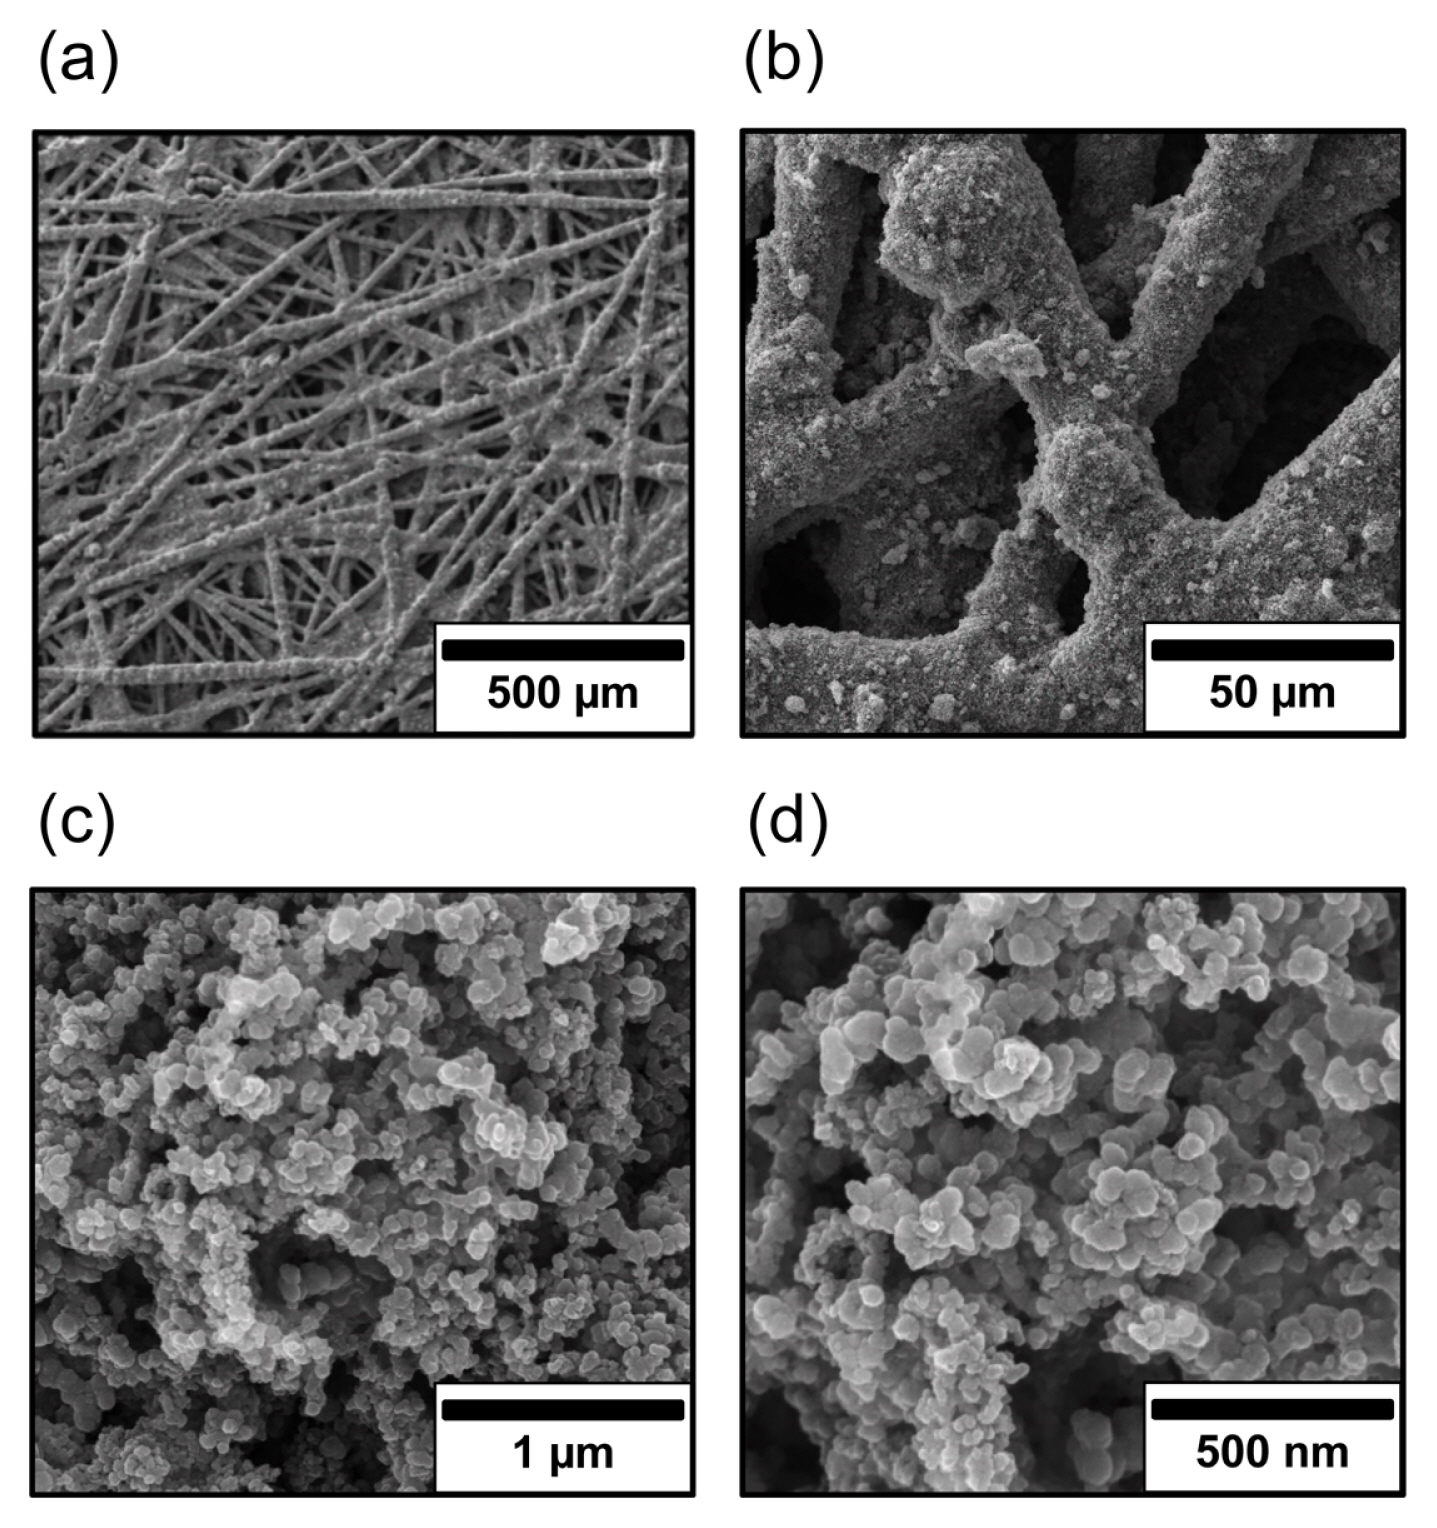
Fig. 3 reveals the images of porous GDE coated with the PEI-Au/C catalyst on the surfaces. The carbon paper is composed of a carbon fiber with a length of hundreds of micrometers and PTFE resin (5 wt.%), and large pores are formed between the carbon fibers for appropriate mass transportation of the liquid electrolyte (Fig. 3a). It is also clearly visible that the PEI-Au/C catalyst was uniformly layered on the carbon fiber surfaces, where no large agglomeration of the catalyst was observed (Fig. 3b). The catalyst layer itself contains sub-micro pores between the catalyst particles, thus providing a large surface area for the e-CORR (Figs. 3c and d). The microscopic images exhibited an evenly distributed catalyst on carbon paper using the hand spray method on the GDE.
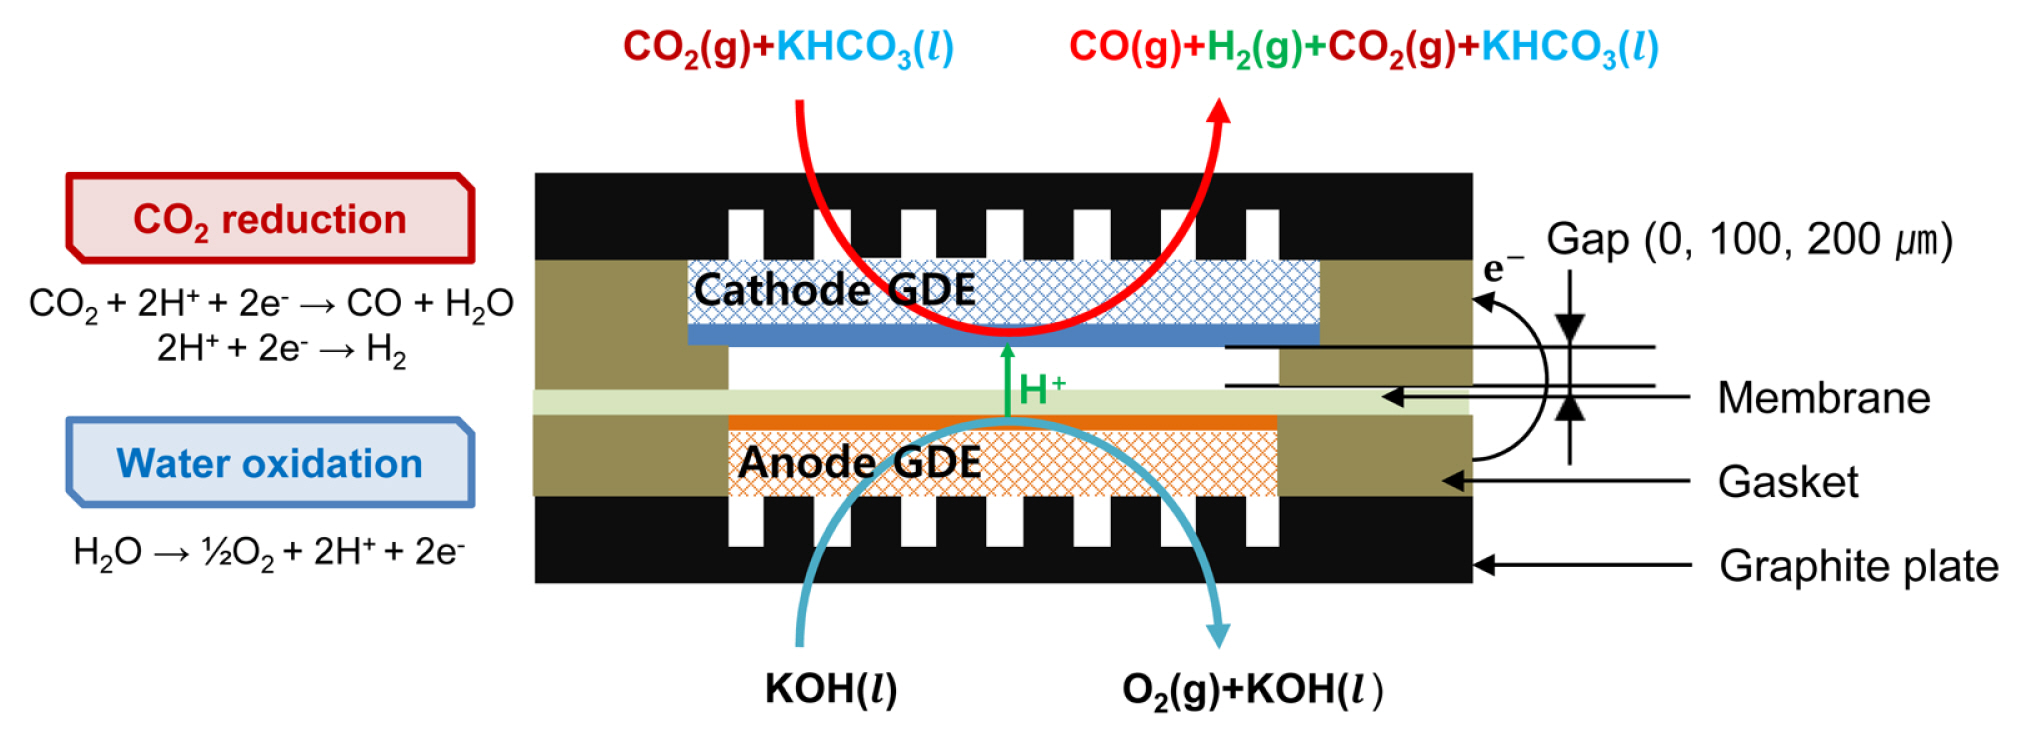
Using the PEI-Au/C-coated GDE and IrO2/Ti-PTL electrodes, an e-CORR device was constructed (Scheme 1). The cathode and anode were placed on either sides of the ion-conducting perfluorinated membrane. The anode was closely attached to the membrane, while the Egap was controlled between 0 and 200 μm. In particular, the Egap was modified by inserting a PTFE spacer with thicknesses of 0, 100, and 200 μm. As discussed above, the cathode structure examined in this study was previously introduced by Delacourt et al.; therefore, the Egap affects the buffer capacity of the electrolyte around the electrode, resulting in different CO faradaic efficiencies as a function of the gap distance [28]. However, a fixed amount of electrolyte was impregnated into the cathode before the device operation, and the device was only operated for a limited duration in the previous report. In this study, the same cathode structure was adopted with three different gap distances, that is, 0, 100, and 200 μm; however, the electrolyte was continuously supplied to the flow cell. Without the electrolyte supply to the reactor, the surface pH of the cathode should be constantly changed as the reaction proceeds in the confined electrolyte, such as in bulk electrolysis. The flow cell, shown in Scheme 1, was operated for stable and longer duration electrolysis at steady state in this study, as discussed below.
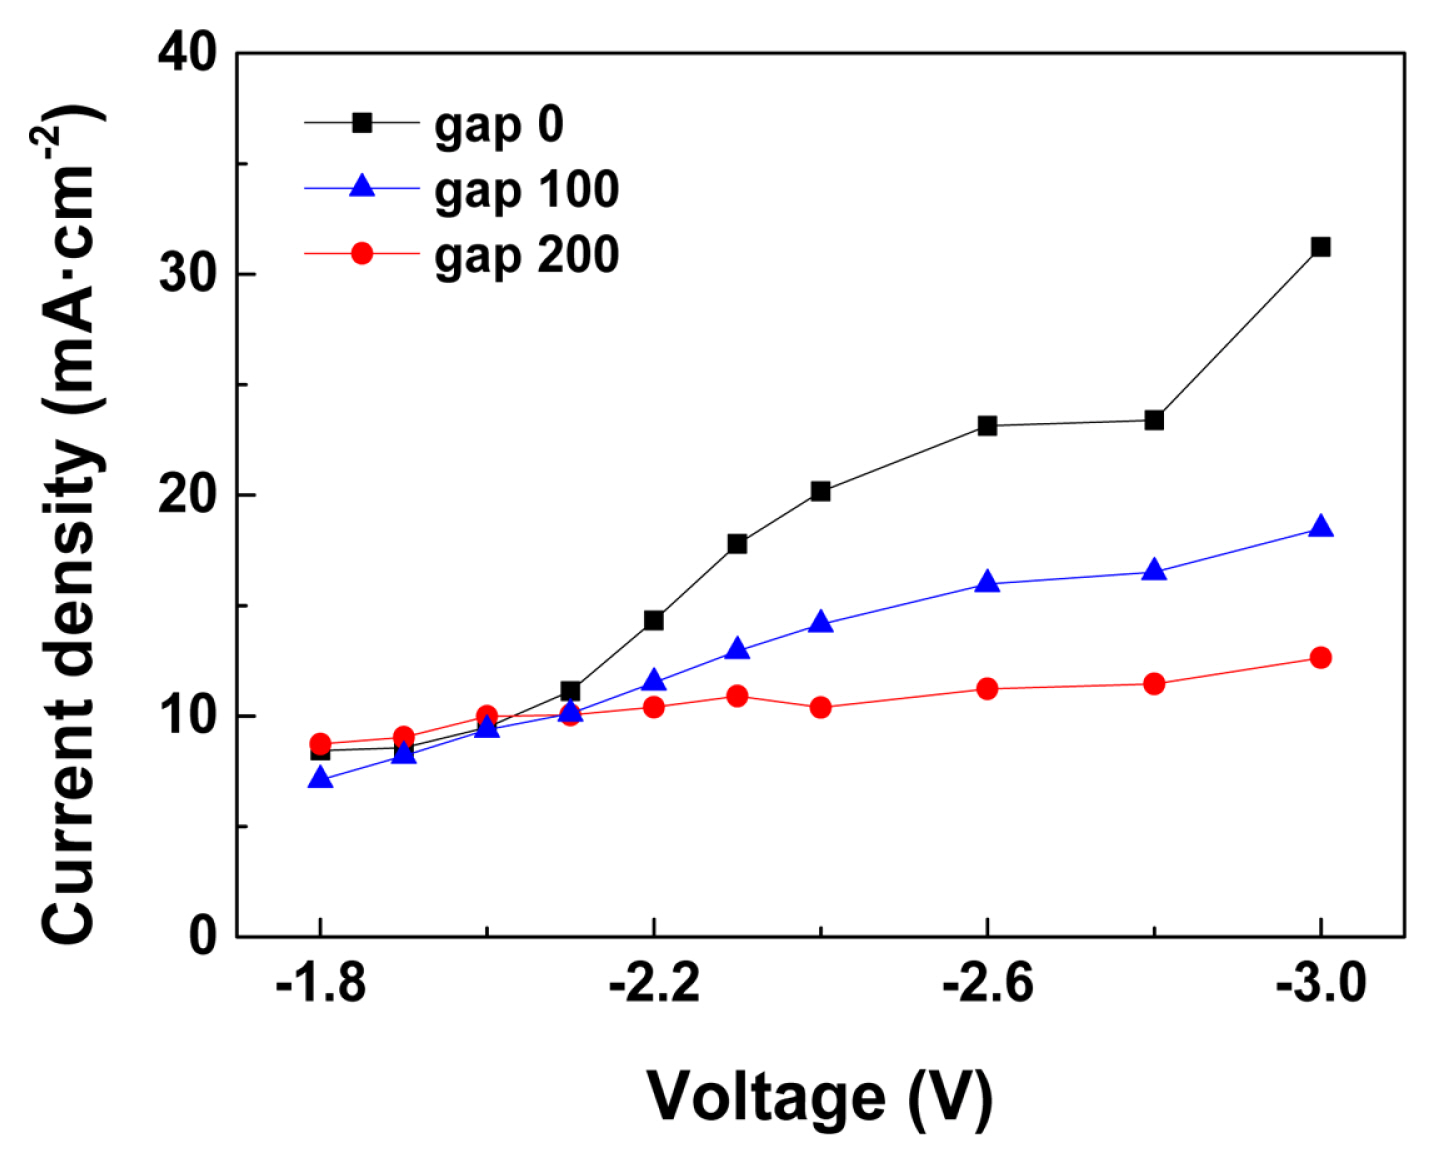
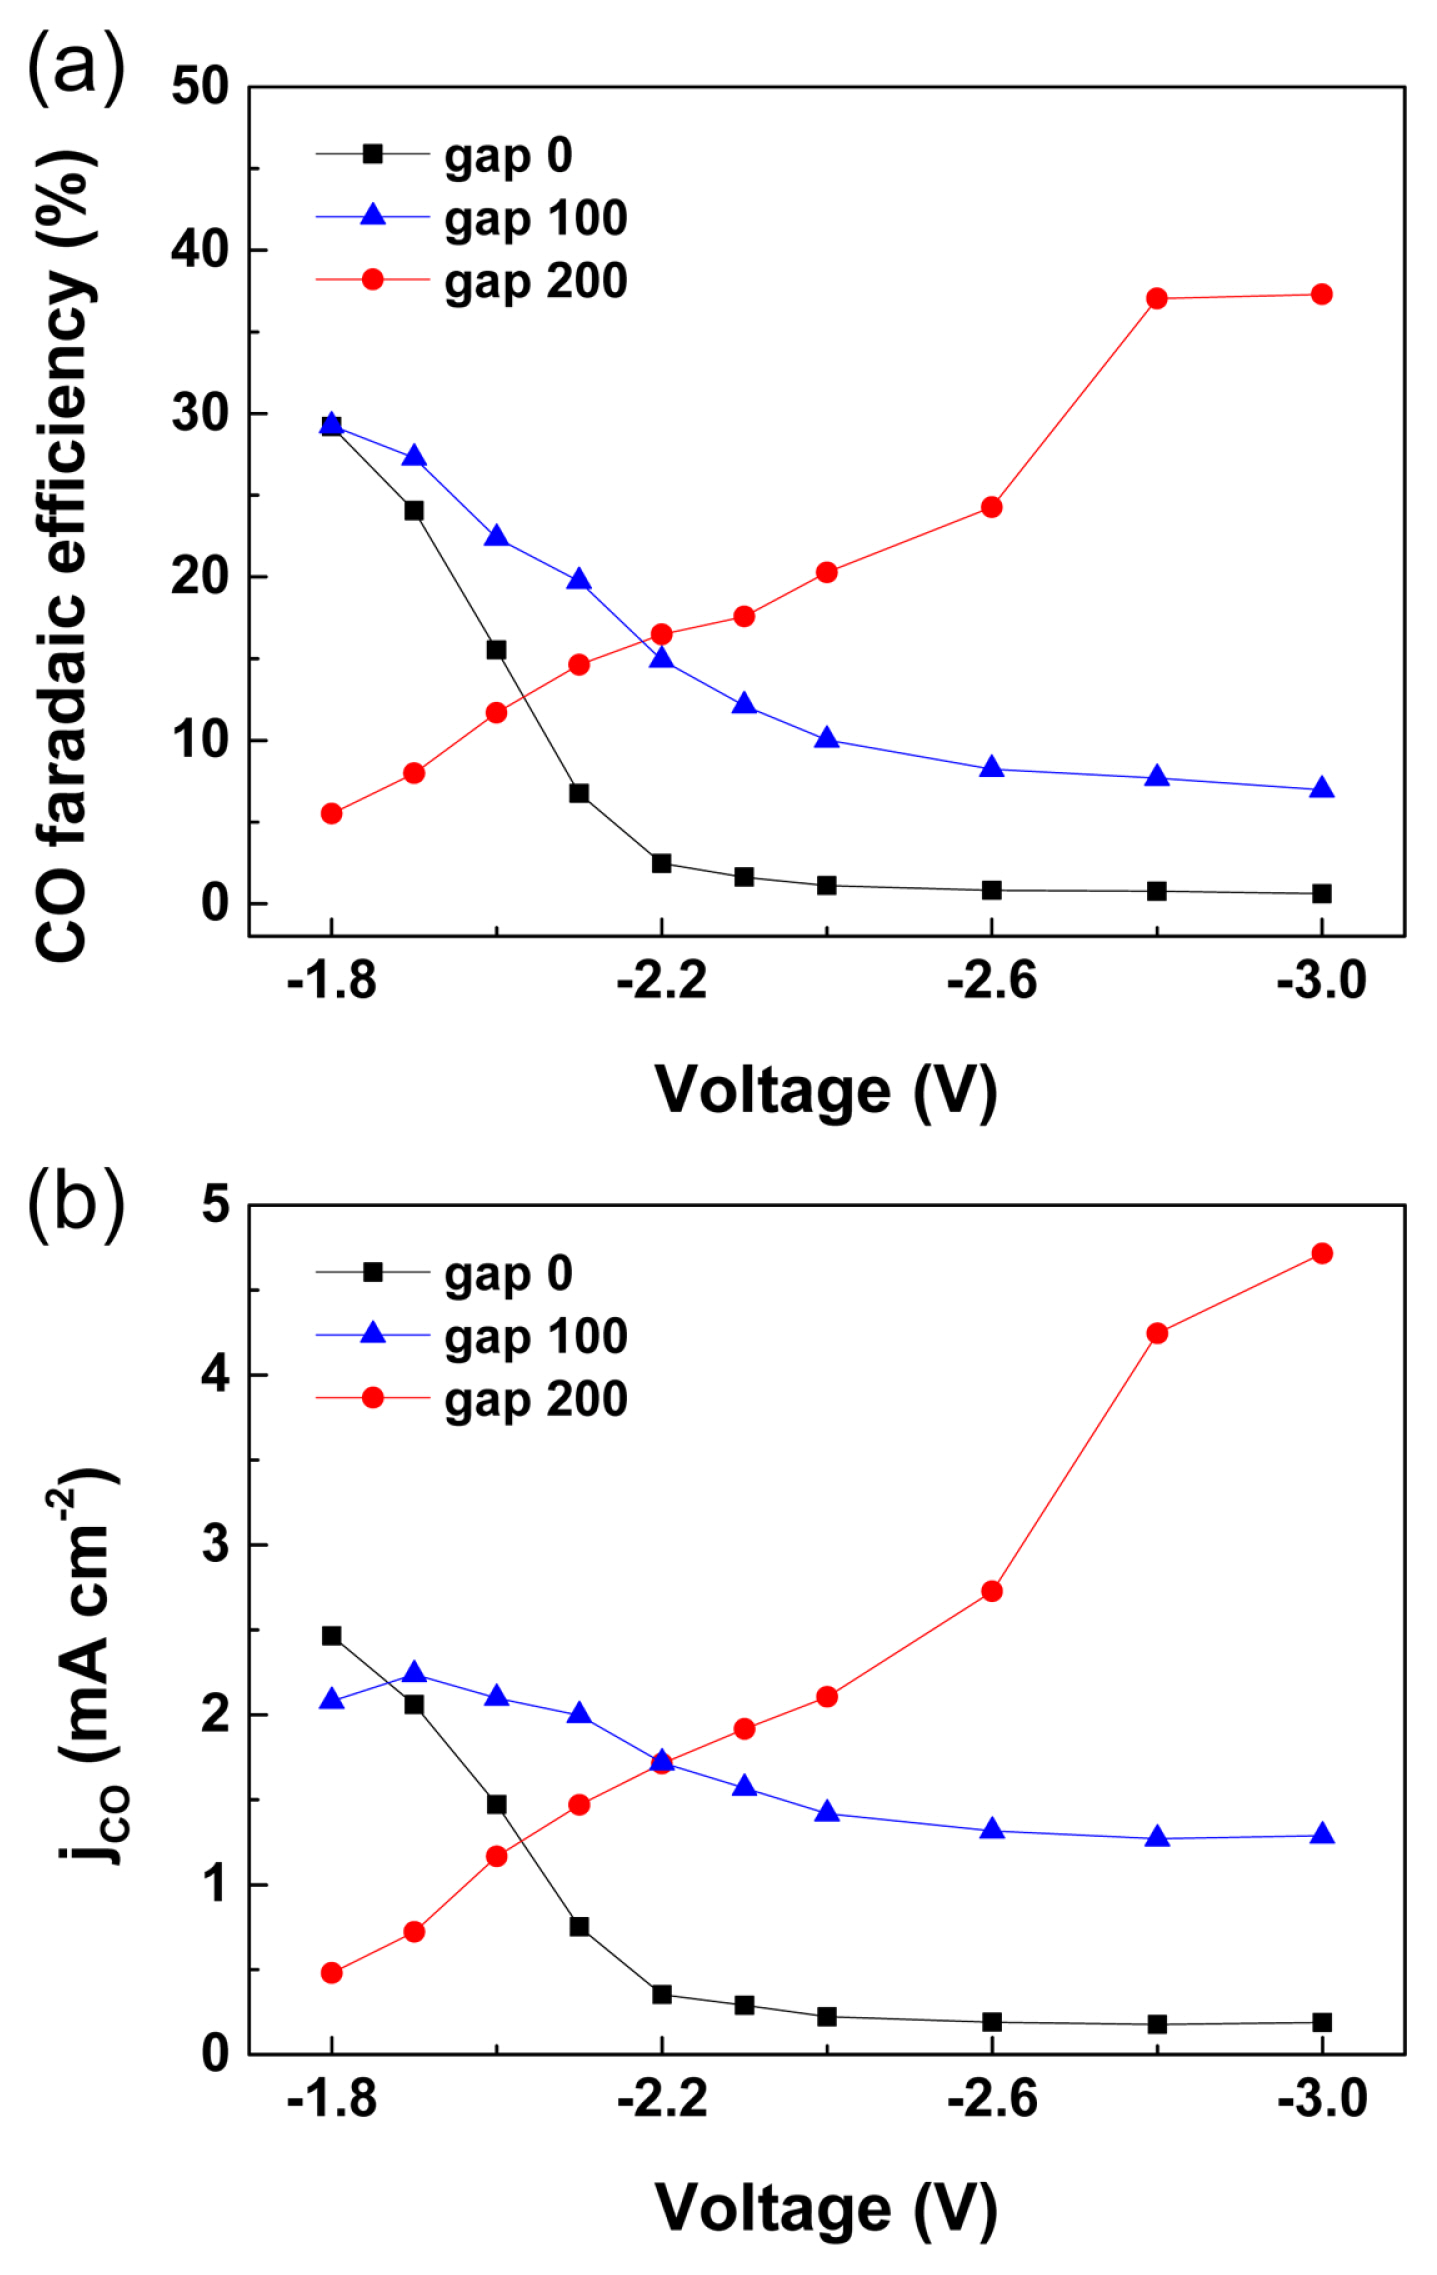
The current density-voltage relationship, or I-V curves, of the e-CORR devices in 0.5 M KHCO3 catholyte are plotted in Fig. 4. To construct the I-V curves, chronoamperometry was performed for 30 min at voltages ranging between −1.8 and −3.0 V, and the average total current density at each voltage can be obtained from the curves. As the electromotive force, or the device voltage increased, the total current for both proton and CO2 reduction reactions also increased for all the devices with different Egap values. The current densities of the different devices at voltages lower than −2.0 V were similar, that is, approximately 10 mA/cm2. However, the total current density increments with increased cell voltages were different with different Egap; therefore, the total current density reached higher than 30 mA/cm2 at Egap = 0 μm, and decreased to 16 and 12 mA/cm2 at an Egap of 100 and 200 μm, respectively, at −3.0 VRHE.
More importantly, the reaction selectivity toward CO2 reduction was significantly affected by the Egap. The CO faradaic efficiency decreased as the device voltage increased beyond −1.9 V when the Egap was less than 100 μm; however, the CO faradaic efficiency increased from approximately 5 to 37.3% as the voltage increased from −1.8 to −3.0 V for Egap = 200 μm. The decreased CO production selectivity at large overpotentials is often explained by the rapidly facilitated proton reduction reactions at further negative potentials, compared to that of CO2 reduction reactions, as observed in the case of Egap = 0 and 100 μm [34]. However, the proton reduction reaction was effectively reduced at Egap = 200 μm. In the e-CORR device, the excess protons present in the cathode are generated at the oxygen evolution anode and transported through the ion-conducting membrane to the cathode surface. As the Egap is increased, the excess protons from the anode are washed out by the catholyte and the surface acidity of cathode is regulated to pH 7.2 (0.5 M KHCO3, equation 1) [28].
As shown in Fig. 2, the proton reduction kinetics are influenced dominantly by pH, and they are significantly mitigated in the neutral carbonate electrolyte. The Egap calculated by Delacourt et al. to maintain a neutral pH at the cathode surface was greater than 200 μm, which supports the experimental results shown in this study [29]. In addition, CO2 produced from the reaction between the protons and carbonate electrolyte can be further used in e-CORR. In the device with Egap = 200 μm, the CO faradaic efficiency and CO production current successfully increased at a large device voltage, that is, approximately 5 mA/cm2 at −3.0 V, whereas, current values of only 0.2 and 1.3 mA/cm2 were obtained at Egap = 0 and 100 μm, respectively, (Fig. 5b)
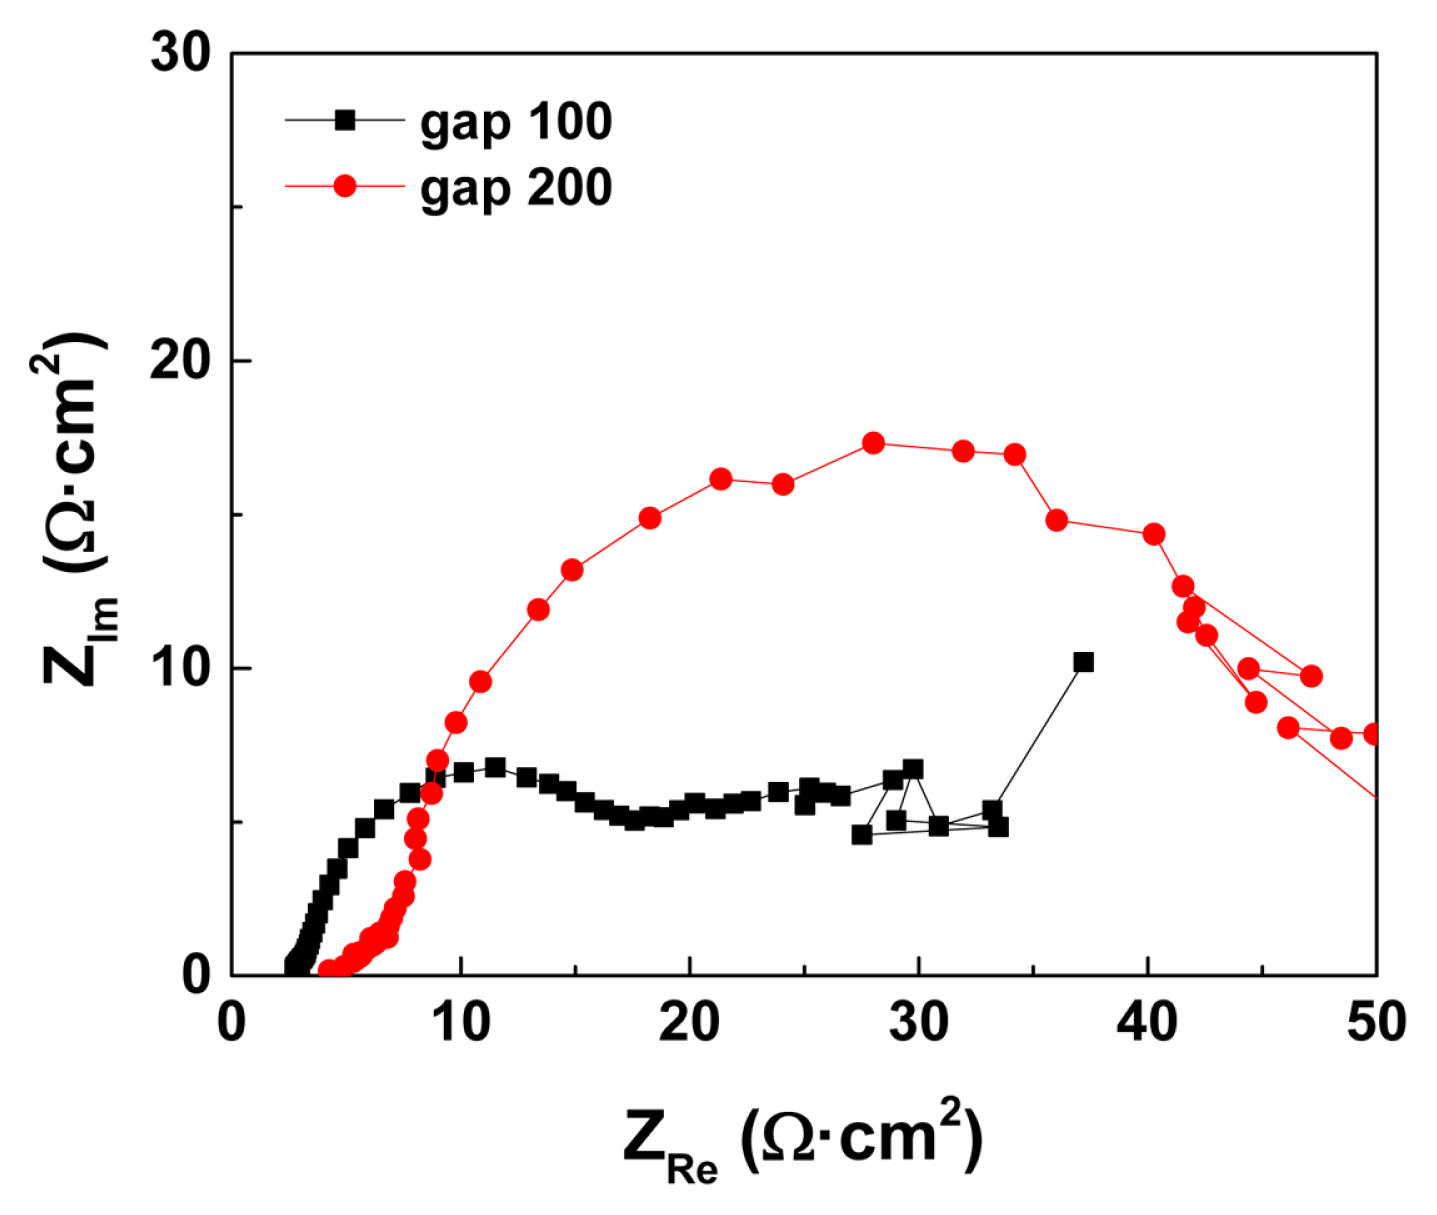
An additional effect caused by the large Egap is the rise in the ohmic voltage drop owing to the increased ion-transfer resistance between the electrodes [35]. The ion-transfer resistance was measured using EIS (Fig. 6). High frequency resistance increased slightly with an increase in the Egap, that is, from 3 to 4.3 ohm cm2 for Egap of 100 and 200 μm, respectively, at −2.4 V (Fig. 6). However, the ohmic voltage drop increase caused by the ion-transfer resistance at different Egap values was less than a few tens of mV at a total current density of less than 30 mA/cm2; hence, it is not the main factor affecting the I-V curves with different Egap values. In contrast, the charge transfer resistance significantly increased with enlarged Egap (Fig. 6 black square and red circle for Egap of 100 and 200 μm, respectively), which is in good agreement with the reduced proton reduction kinetics at the large Egap.
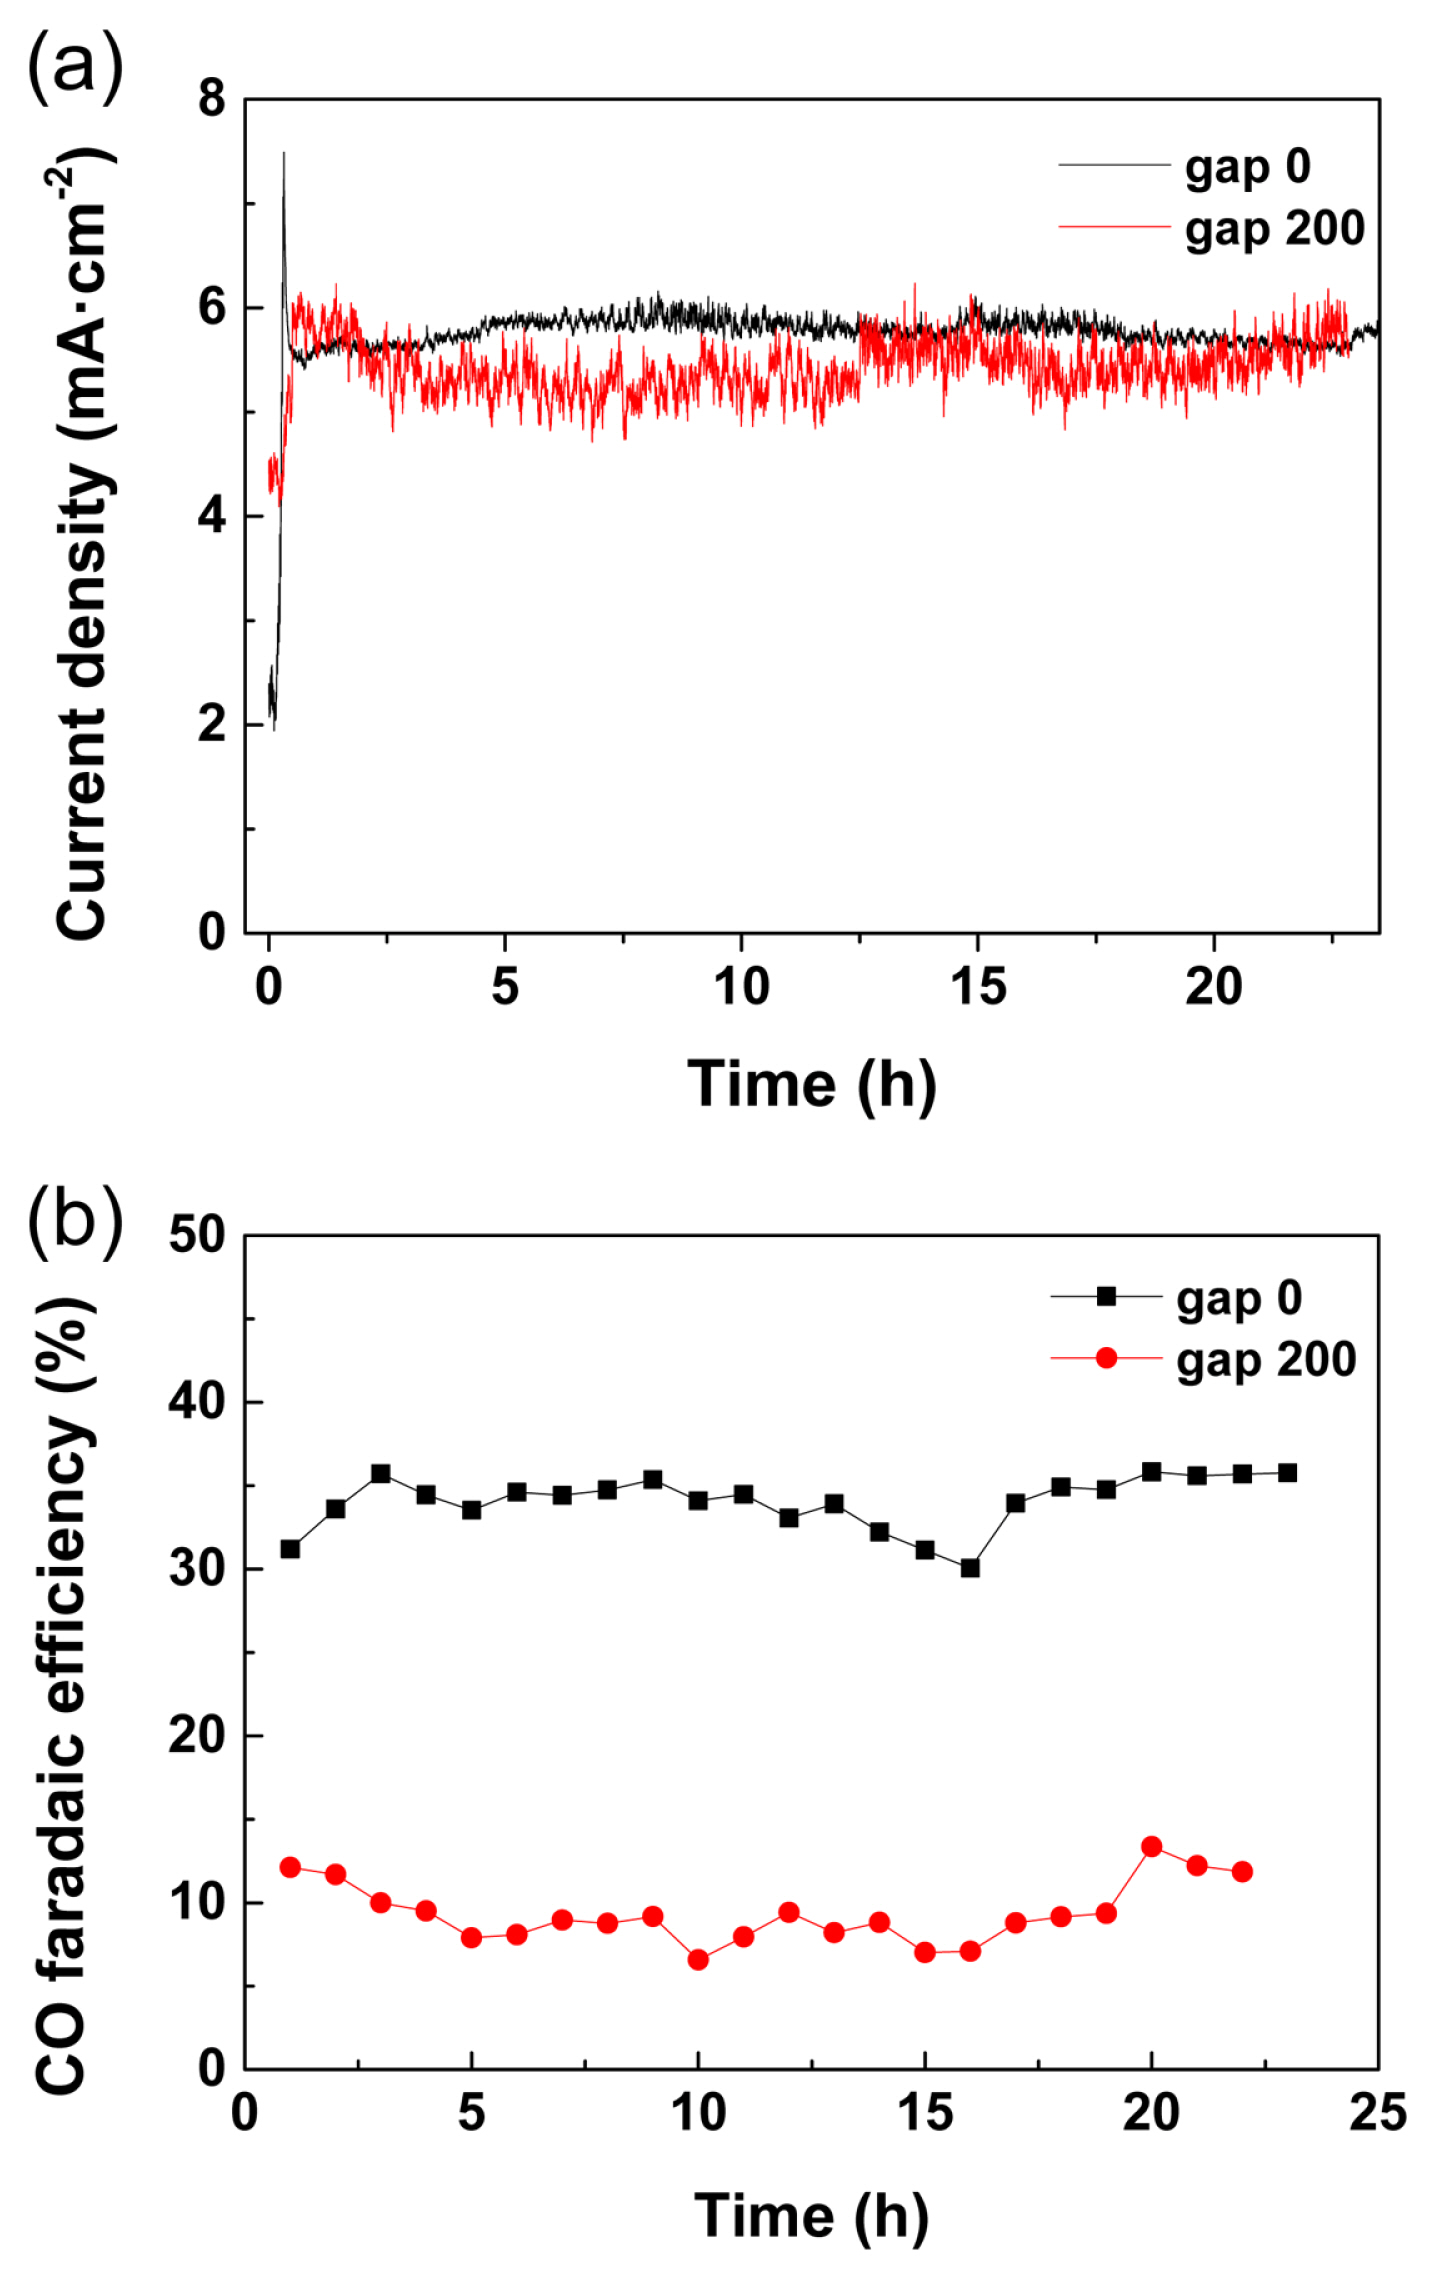
Finally, the e-CORR device with different Egap values was operated for more than 23 h to demonstrate practical syngas production. In Fig. 7, the mechanical operation factor, that is, the Egap, was controlled to 0 and 200 μm for two different H2:CO ratios of the product gas stream, while the total registered current density was maintained between 5 and 6 mA cm−2 at −2.0 V. For the devices with Egap = 0 and 200 μm, respectively, CO faradaic efficiency was maintained at approximately 37 and 10% for more than 23 h. The different CO faradaic efficiencies at −2.0 V with different Egap in longer term operations are actually explained with those obtained at approximately − 1.8 V in Fig. 5 for short period analysis. We believe the discrepancy between Fig. 5 and 7 was from experimental errors, such as insignificant difference in the cell assemble pressure or the difference in gasket compressibility for different measurements resulting in few tens μm changes of the gap. However, it is still clear that the cathode-membrane gap is one of the important control factors affecting the faradaic efficiency in both Fig. 5 and 7. Further, the modification of CO faradaic efficiency at different Egap should be more obvious given the cell voltage increased as estimated in Fig. 5. The control of syngas production with different H2/CO values is important for thermochemical hydrocarbon production through the Fischer–Tropsch process. For example, the syngas ratio of H2/CO = 2 with Egap = 0 μm can be used for low temperature Fischer–Tropsch process (LTFT), and syngas ratio of H2/CO = 9 with Egap = 200 μm is suitable for the high-temperature Fischer–Tropsch process (HTFT) for methane production [12].
In this study, it was demonstrated that the H2/CO value is modulated by controlling the Egap, a mechanical design factor of the e-CORR device, while the total current density and device voltage were conserved at the same value. Although Delacourt et al. utilized the same cathode structure with Egap = 800 μm in a previous report, the operation was unstable as the CO faradaic efficiency decreased from 82 to 61% in 7 h without a continuous supply of the catholyte to the cathode. [28]. Herein, notably, it was a long-term operation with stable CO faradaic efficiency and current flow achieved for the first time by using a flow cell device with tunable Egap.
4. Conclusion
The effect of the gap between the cathode and the membrane on the e-CORR was investigated in a full-cell device. By controlling the mechanical aspect of the electrochemical device, the syngas composition and CO faradaic efficiency were controlled from 10% to 37%. The electrolyte flow between the cathode and membrane can modulate the acidity and proton reduction kinetics at the cathode; therefore, proton reduction was effectively suppressed with Egap = 200 μm. The e-CORR device was continuously operated for more than 23 h at two different Egap values, that is, 0 and 200 μm, and stable syngas production was demonstrated with a CO faradaic efficiency of approximately 37 and 10% for the LTFT and HTFT, respectively. The cell structure presented in this study is appropriate for large-scale e-CORR devices with versatile mechanical operation factors, such as Egap, to regulate the syngas composition.