1. Introduction
Water electrolysis is considered as the most effective approach to generate pure hydrogen and oxygen [1–6]. Large-scale commercialization of water electrolysis is highly dependent on the development of electrocatalysts with very high efficiency, low cost, good durability and stability for the electrocatalytic water splitting [3–11]. So far, platinum-based metals have been deemed the most effective hydrogen evolution reaction (HER) catalyst and, equally, iridium and ruthenium dioxides are widely used materials as the best catalyst to accelerate oxygen evolution reaction (OER) due to their low overpotential and superior stability and catalytic activity which has already been put into practical application [2,9–18].
However, some critical issues are associated with water-splitting technologies, like the use of expensive materials, their low cyclic stability, and low ionic conductivity, which hindering their practical effectuation [16–20]. In addition, the same catalysts were not good enough for HER and OER both. Therefore, it is highly desired to develop new alternative catalysts which could accelerate sluggish kinetics by fast electron transfer with very scalable performance at optimum cost. The bifunctional catalysts could play a key role in the production of hydrogen and oxygen for the clean and sustainable energy.
In the past few years, some advances have been made by transition metal based compounds as capable of good electrocatalytic activity. Nevertheless, few of electrocatalysts possess good performance of HER and OER simultaneously [1–3,5]. However, two-dimensional transitional metal dichalcogenides, for example, molybdenum disulfides (MoS2), tungsten disulfide (WS2) and molybdenum diselenide (MoSe2), had been expected to have good performance of both HER and OER [1,2,5,6]. They are two-dimensional layered compounds connected by the van der-Waals forces between layers [6]. Such a special layered structure can provide more permeable channels for ions and accelerate charge transfer rate, thus speed up the electrochemical reaction. These favorable properties emerge from its unique graphene-like layered structure of catalytically active S atoms on the Mo edges for MoS2 [6,9]. More precisely, cheap and earth-abundant MoS2 in particular are considered promising to be shown remarkable catalytic activity and favorable electrocatalyst for both HER and OER. MoS2 is highly stable in acidic media and has advantageous of the energy band gap which is larger than the hydrogen redox potential. Therefore, it is worth to investigate HER and OER performance of MoS2 as well as the size effect on the performances. MoS2 of small size has more surface and edge sites compared to MoS2 of large size, expecting higher catalytic activity than MoS2 of large size.
Here we investigate the catalytic HER and OER performance of different sizes of MoS2 in 0.5 M H2SO4 electrolyte. It was found that the smallest size (90 nm) of MoS2 particles showed better HER and OER activity based on low overpotential, low Tafel slope, high capacitive behavior, and good stability. The high bifunctional HER and OER performances are attribute to high electrochemical active surface area with edge sites and low charge transfer resistance due to the nanosize of MoS2.
2. Experimental
Molybdenum disulfide (MoS2, powder, 99%, > 90 nm), MoS2 (powder, 98%, > 2000 nm), MoS2 (powder, 95%, > 6000 nm), and sulfuric acid (H2SO4, 98%) were purchased from Merck. All the reagents are analytical grade and used without any further purification. Three different sizes of the commercial MoS2 powder samples were named as 90 nm, 2000 nm, and 6000 nm, and directly used for characterizations without any modification.
Field emission scanning electron microscopy (FE-SEM, S-4300, Hitachi, Japan) was used to examine surface morphology with energy dispersive X-ray spectroscopy (EDS, S-4300, JEOL) for elemental composition. X-ray diffraction spectrometer (XRD, D/MAX-2500/PC, Rigaku, Japan) at 40 kV with Cu Kα (λ = 1.54 Å) and Raman spectroscopy (Horiba scientific Ltd, with a laser excitation of 532 nm) was used to investigate crystallinity and vibration modes of samples. The chemical composition and configuration were investigated by using X-ray photoelectron spectroscopy (XPS, Thermo scientific, Kα, Al anode, 20 eV of pass energy).
The electrochemical properties of the samples were investigated with a three-electrode cell system, using potentiostat/galvanostat with impedance spectroscopy (Bio-Logic, SP-150, France). Ag/AgCl (3M KCl saturated) was used as the reference electrode, and platinum wire was used as the counter electrode with 0.5 M H2SO4. The working electrodes were prepared as followings; The glassy carbon electrode (GCE, OD: 6 mm, ID: 3 mm) was polished by using alumina powder and washed properly with deionized (DI) water followed by a sonication in the ethanol and water each for 10 min. The GCE was completely dried in a room temperature. 5 mg of each sample (90 nm, 2000 nm, and 6000 nm) was dispersed separately in 2 ml of isopropyl alcohol, and then 5 μL of the homogeneous suspension obtained by sonication was drop casted on the GCE to form the working electrode.
Chronocoulometry (CC), potentio electrochemical impedance spectroscopy (PEIS), cyclic voltammetry (CV), and linear sweep voltammetry (LSV) measurements were performed to investigate electrochemical properties of the samples. CC was used to know the active electrochemical surface area of the sample as described elsewhere [21–23]. CV was done at the scan rate of 10, 20, 50, 100, and 200 mVs−1 to look into capacitive performance of materials. PEIS, performed at the amplitude of 5 mV in the frequency range of 100 mHz to 500 kHz, was to know charge transfer resistance and other equivalent impedance behavior. LSV was used to record the polarization curves (j-V plots) at the sweep rate of 10 mVs−1. All measurements were conducted relative to the Ag/AgCl reference electrode, and potentials versus reversible hydrogen electrode (RHE) were calculated by the following equation [2,4,5].
, where EAg/AgCl is the measured potential, and EoAg/AgCl (0.210 V) is the standard potential of Ag/AgCl (3 M KCl) at 25°C in 0.5 M H2SO4 electrolyte. CC was used to determine the electrochemically available surface area, using 0.1 M K3[Fe(CN)6] containing 1 M KCl as model complex. The nitrogen purge was performed for 2 min before every electrochemical measurement.
3. Results and Discussion
Fig. 1 shows SEM images of three different size of MoS2. The two dimensional layered structure of MoS2 was clearly shown, and the layered structure becomes smaller as the sample size decreases. The 2000 nm and 90 nm samples were further characterized by using TEM measurement. It clearly shows that the 90 nm samples is smaller than the 2000 nm sample, as shown in Fig. S1. Size distribution was also statistically evaluated for the 90 nm and 2000 nm samples, and the results are in Fig. S1(e–f). The elemental data of the samples from EDS is summarized in Table 1. The MoS2 sample of 6000 nm consists of 49 at% of S, 29 at% of Mo, 17 at% of C, and 5 at% of O, and the 2000 nm sample has 46 at% of S, 26 at% of Mo, 24 at% of C, and 4 at% of O. Similarly, the 90 nm sample presented 43 at% of S, 24 at% of Mo, 31 at% of C, and 2 at% of O. The three commercial MoS2 has proper atomic ratio of MoS2 within the specified purity and the resolution of EDS.
XRD results in Fig. 2a also show similar diffraction patterns of three samples. Only difference is the intensity of the peaks because of the size effect. Most intense (002) peak was centered at 14.4°, and other diffraction peaks from the (004), (100), (101), (102), (103), (006), (105), (110) and (008) planes were observed at higher angles [2], demonstrating the characteristic of polycrystalline MoS2.
Raman spectroscopy was also used to characterize the samples with a laser excitation of 532 nm, and the typical Raman spectral features of MoS2 can be identified, associated with
E 2 g 1 E 2 g 1
The elemental composition of the samples was characterized by XPS survey spectra (Fig. 3a) over a wide energy range, displaying S 2p, Mo 3d, C 1s, Mo 3p, and O 1s at the binding energy of 161.8, 229.1, 284.1, 412.7, and 530.2 eV, respectively, without any other contamination peaks. Detail XPS S 2p, Mo 3d, C 1s, and O 1s spectra in the high-resolution mode were shown in Fig. 3b, 3c, 3d, and Fig. S1, respectively. The S 2p spectra were deconvoluted into the two peaks at 162.2 eV and 163.4 eV, which are the characteristic peaks of S 2p3/2 and S 2p1/2, respectively, in Fig. 3b. The Mo 3d spectra were also deconvoluted into the two peaks in Fig. 3c at 229.4 eV (Mo 3d5/2) and 232.5 eV (Mo 3d3/2), suggesting the formation of Mo-S bonding [11]. The S 2p peak at 226.5 eV was also shown in Fig. 3c. The C 1s and O 1s peaks were presented in Fig. 3d and Fig. S2, respectively. The XPS C 1s spectra deconvoluted into the four peaks are 284.4 eV (sp2), 285.9 eV (C-OH), 286.7 (C=O-C), and 288.3 eV (C=O), and the O 1s deconvoluted spectra are C=O/M-O, C-O-C, and C-OH peaks at 530.3 531.8 and 533.1 eV, respectively. The presence of C and O elements is associated with hydrocarbon on the surface. It is concluded that three samples have similar chemical configuration, elemental composition, and crystal structure from XPS, EDS, SEM, and XRD.
Electrochemical active surface area was obtained from the CC measurement. Fig. 4a shows the CC result in which the slope is proportional to the active surface area [22,23]. The obtained surface area of the 6000 nm, 2000 nm, and 90 nm sample was 9 × 10⁻⁵, 2 × 10⁻⁴, and 6 × 10⁻⁴ cm2, respectively. The 90 nm sample shows the largest surface area compared to the others, and it was more than six times higher than that of the 6000 nm sample. The large surface area, which plays the importance role for catalyst [2,5], of the 90 nm sample is expected better catalytic performance compared to the others.
Electrochemical impedance is also highly related with the catalytic performance. Fig. 4b shows Nyquist plot (-Im |Z| as a function of Re |Z|) with the inset, showing the modified Randal’s equivalent circuit [24,25]. It is consisting of internal resistance (Rs), double layer capacitance (CDL), Warburg component (W), and charge-transfer resistance (RCT). The diameter of the semicircle is corresponding to the charge-transfer resistance. The equivalent circuit parameters of Rs and RCT were obtained as 45.1 Ω and 49.2 Ω for the 6000 nm sample, 23.9 Ω and 24.5 Ω for the 2000 nm sample, and 13.4 Ω and 18.1 Ω for the 90 nm sample by a fitting program [25,26], confirming that the 90 nm sample has the lowest charge-transfer resistance. Therefore, the 90 nm sample again is expected to give the best performance of the catalyst compared to the others.
Fig. 4c shows the CV performance of the samples at the scan rate of 50 mVs−1 and potential window of −0.5 to 0.8 V. The 90 nm sample shows the highest current density response compared to the others, expected from the largest surface area and lowest charge-transfer resistance. The scan rate dependent CV results from 10 to 200 mVs−1 were shown in Fig. S3. The CV current rises upon increasing the scan rate, implying a good rate capability for the samples. The double layer capacitances (Cdl) could be calculated from the CV results, which is known to be directly proportional to the surface area, by plotting the ΔJ = Ja – Jc at a given potential (0.5 V) as a function of the scan rates, as shown in Fig. 4d [5]. The Ja and Jc are the anode (oxidation) and cathode (reduction) current at 0.5V from the CV results. The 90 nm sample provided the highest capacitance of 546 mFcm−2, which was almost five times higher than that of the 6000 nm sample, as shown in Fig. 4d. The capacitances of the 2000 nm and 6000 nm sample were also found to be 347 and 118 mFcm−2, respectively. The large capacitance is attributed to the large surface area and low charge transfer resistance, which originally from the size effect.
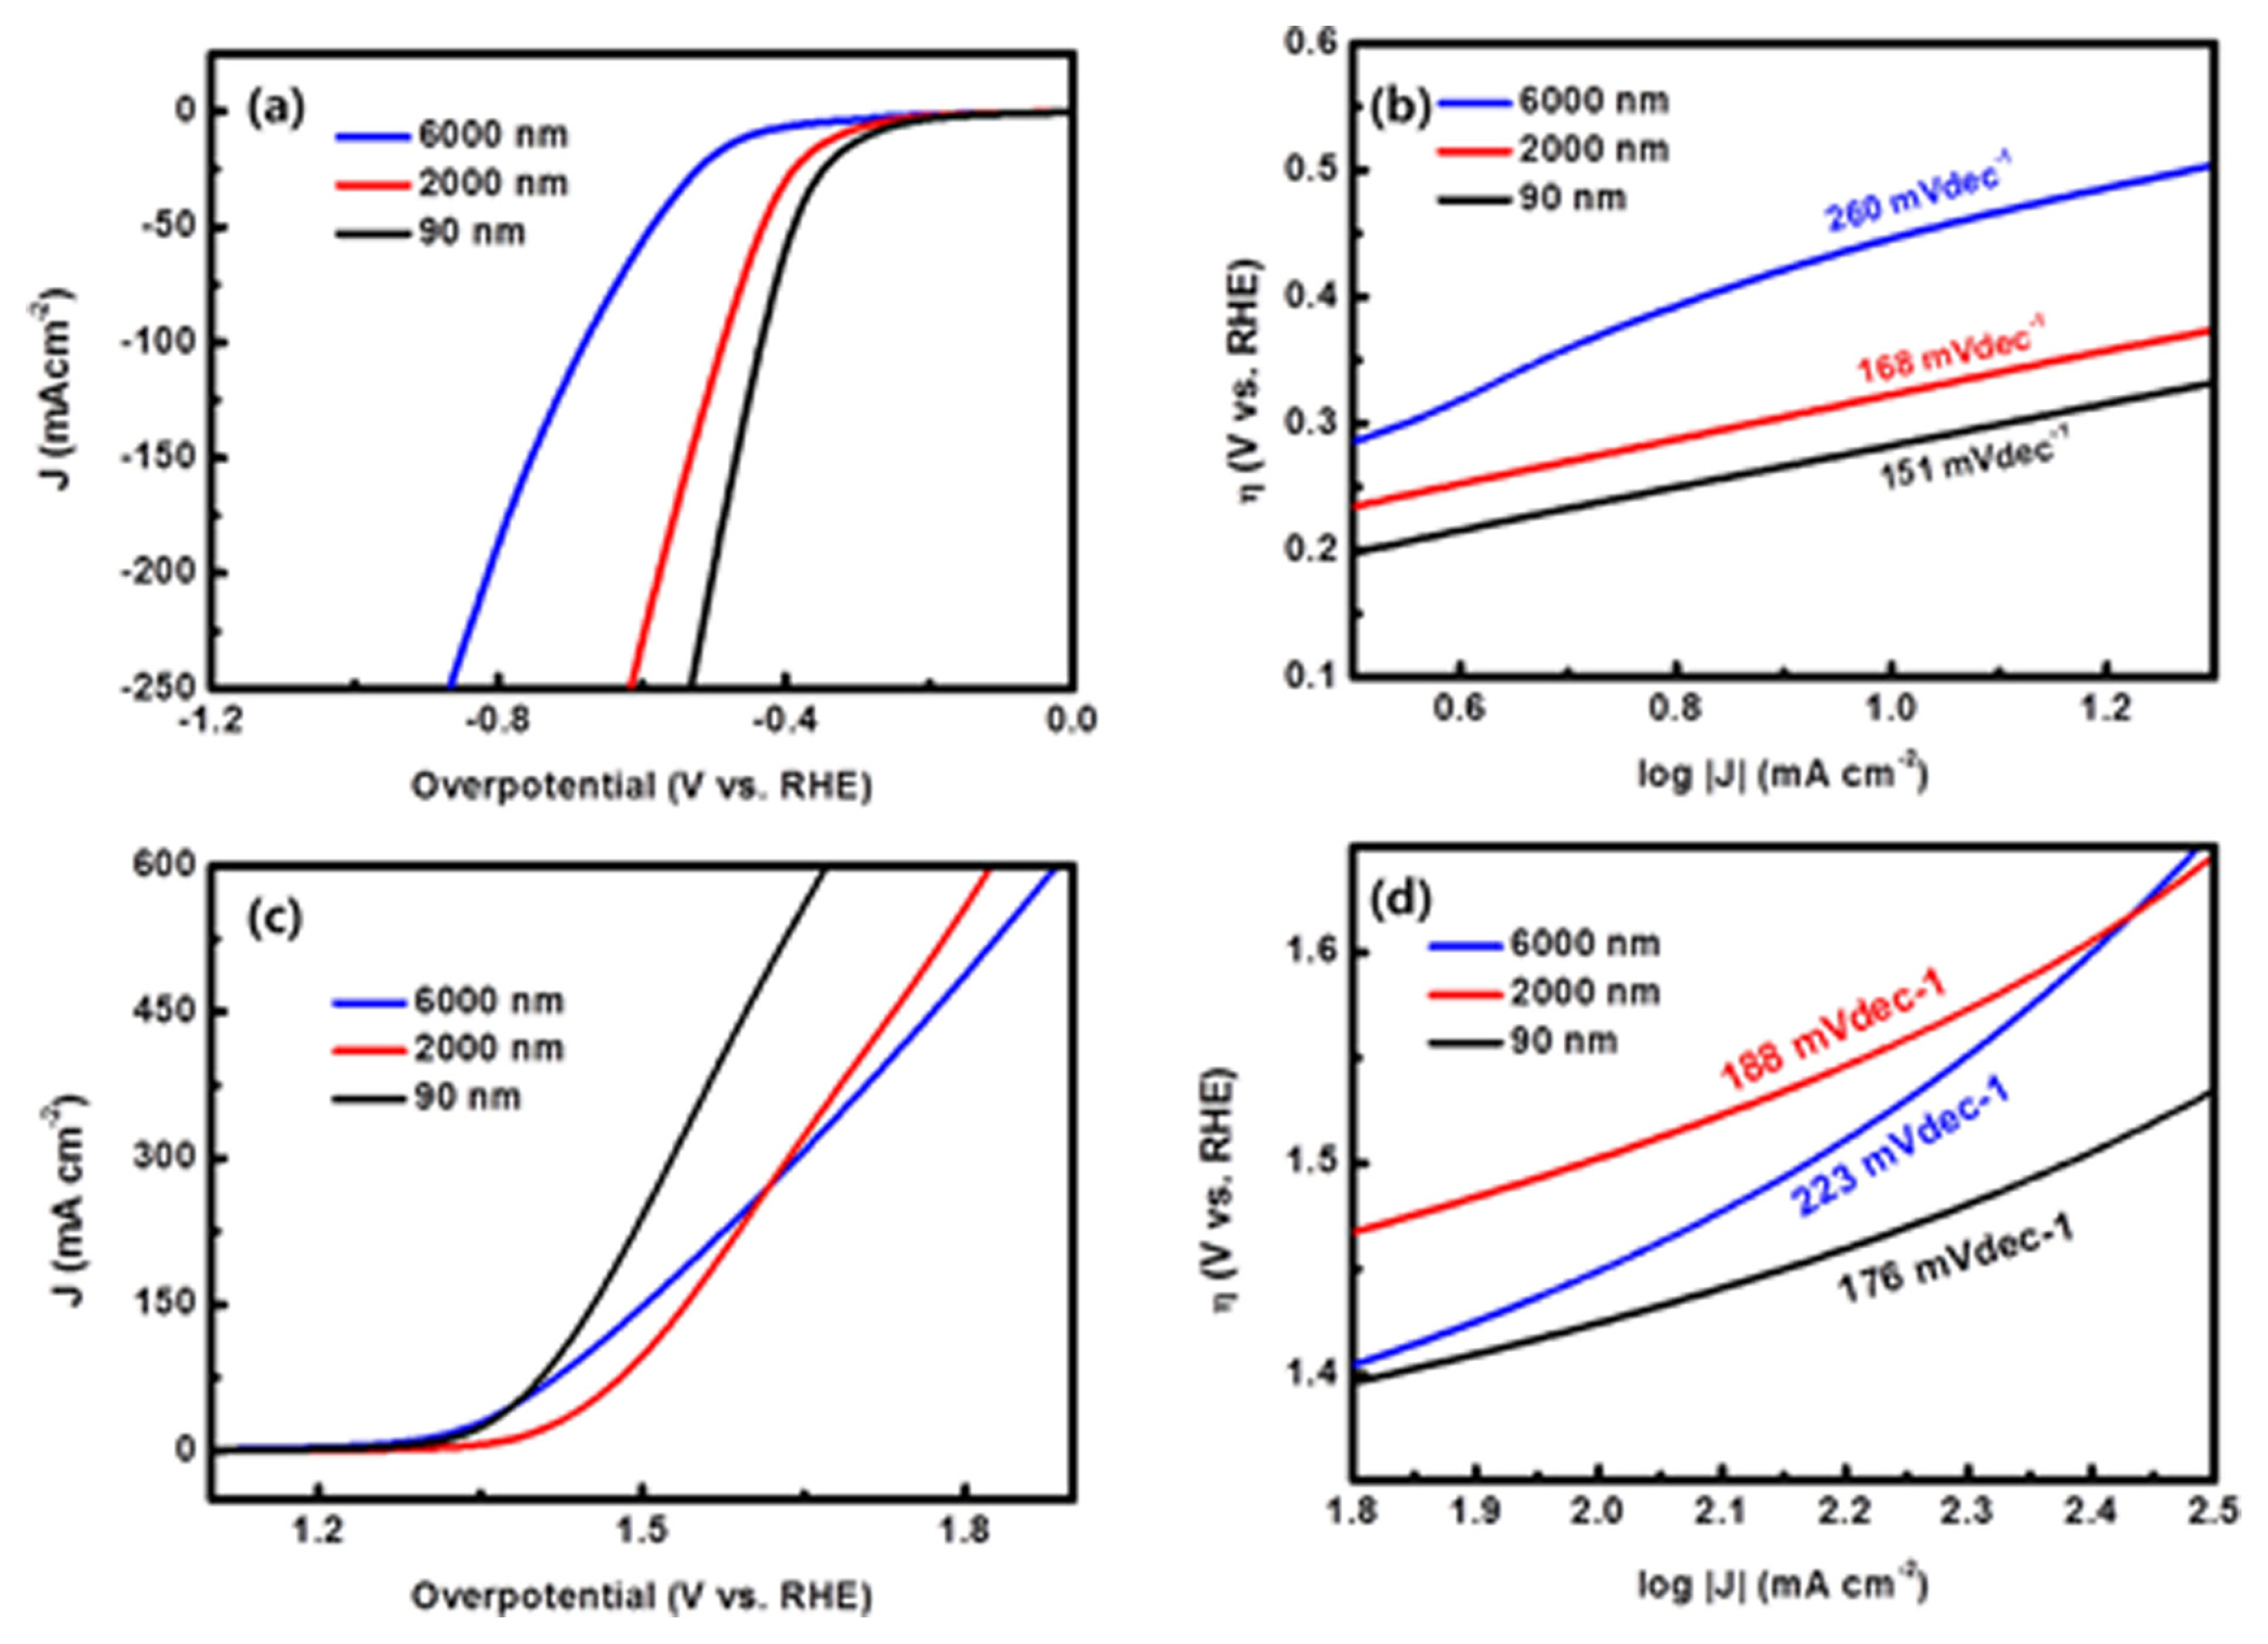
To investigate the catalytic activity of the samples, LSV was performed in 0.5 M H2SO4 at the scan rate of 5 mVs−1 and shown in Fig. 5. The HER performance of samples was shown in Fig. 5a, and the 90 nm MoS2 exhibited the lowest overpotential (−0.28 V), meaning good catalytic behavior, at 10 mAcm−2 followed by the 2000 nm (−0.33 V) and 6000 nm (−0.44 V) sample, respectively. Tafel plot was used to evaluate the efficiency of the catalytic reaction, and it shows the potential difference necessary to increase or decrease the current density. The Tafel equation as follows was used to show the connection between the current and potential at certain overpotential (η) [27,28].
, where j is the current density, jo is the exchange current density, and b is the Tafel slope. The corresponding Tafel plots are shown in Fig. 5b, and the obtained Tafel slopes are 260, 168 and 151 mVdec−1 for 6000 nm, 2000 nm, and 90 nm, respectively. The 90 nm sample has the fastest electron transfer rate compared the other samples since the small Tafel slope indicates the fast electron transfer rate.
The OER activity of the samples is also investigated, and the results are shown in Fig. 5c. The overpotentials of the samples at the current density of 300 mAcm−2 are 1.64 V (6000 nm), 1.62 V (200 nm), and 1.52 V (90 nm), and the corresponding Tafel plots are shown in Fig 5d, resulting in Tafel slopes of 223, 188, and 176 mVdec−1 for the 6000 nm, 2000 nm and 90 nm sample, respectively. The size-dependent OER activity seems not to be appeared in the low potential region, but the renormalized OER data clearly show the size-dependent OER activity, as shown in Fig. S4. The 90 nm MoS2 sample exhibited again the highest OER activity in comparison with other samples, confirming that MoS2 of the smallest size has the best HER as well as OER catalytic performance.
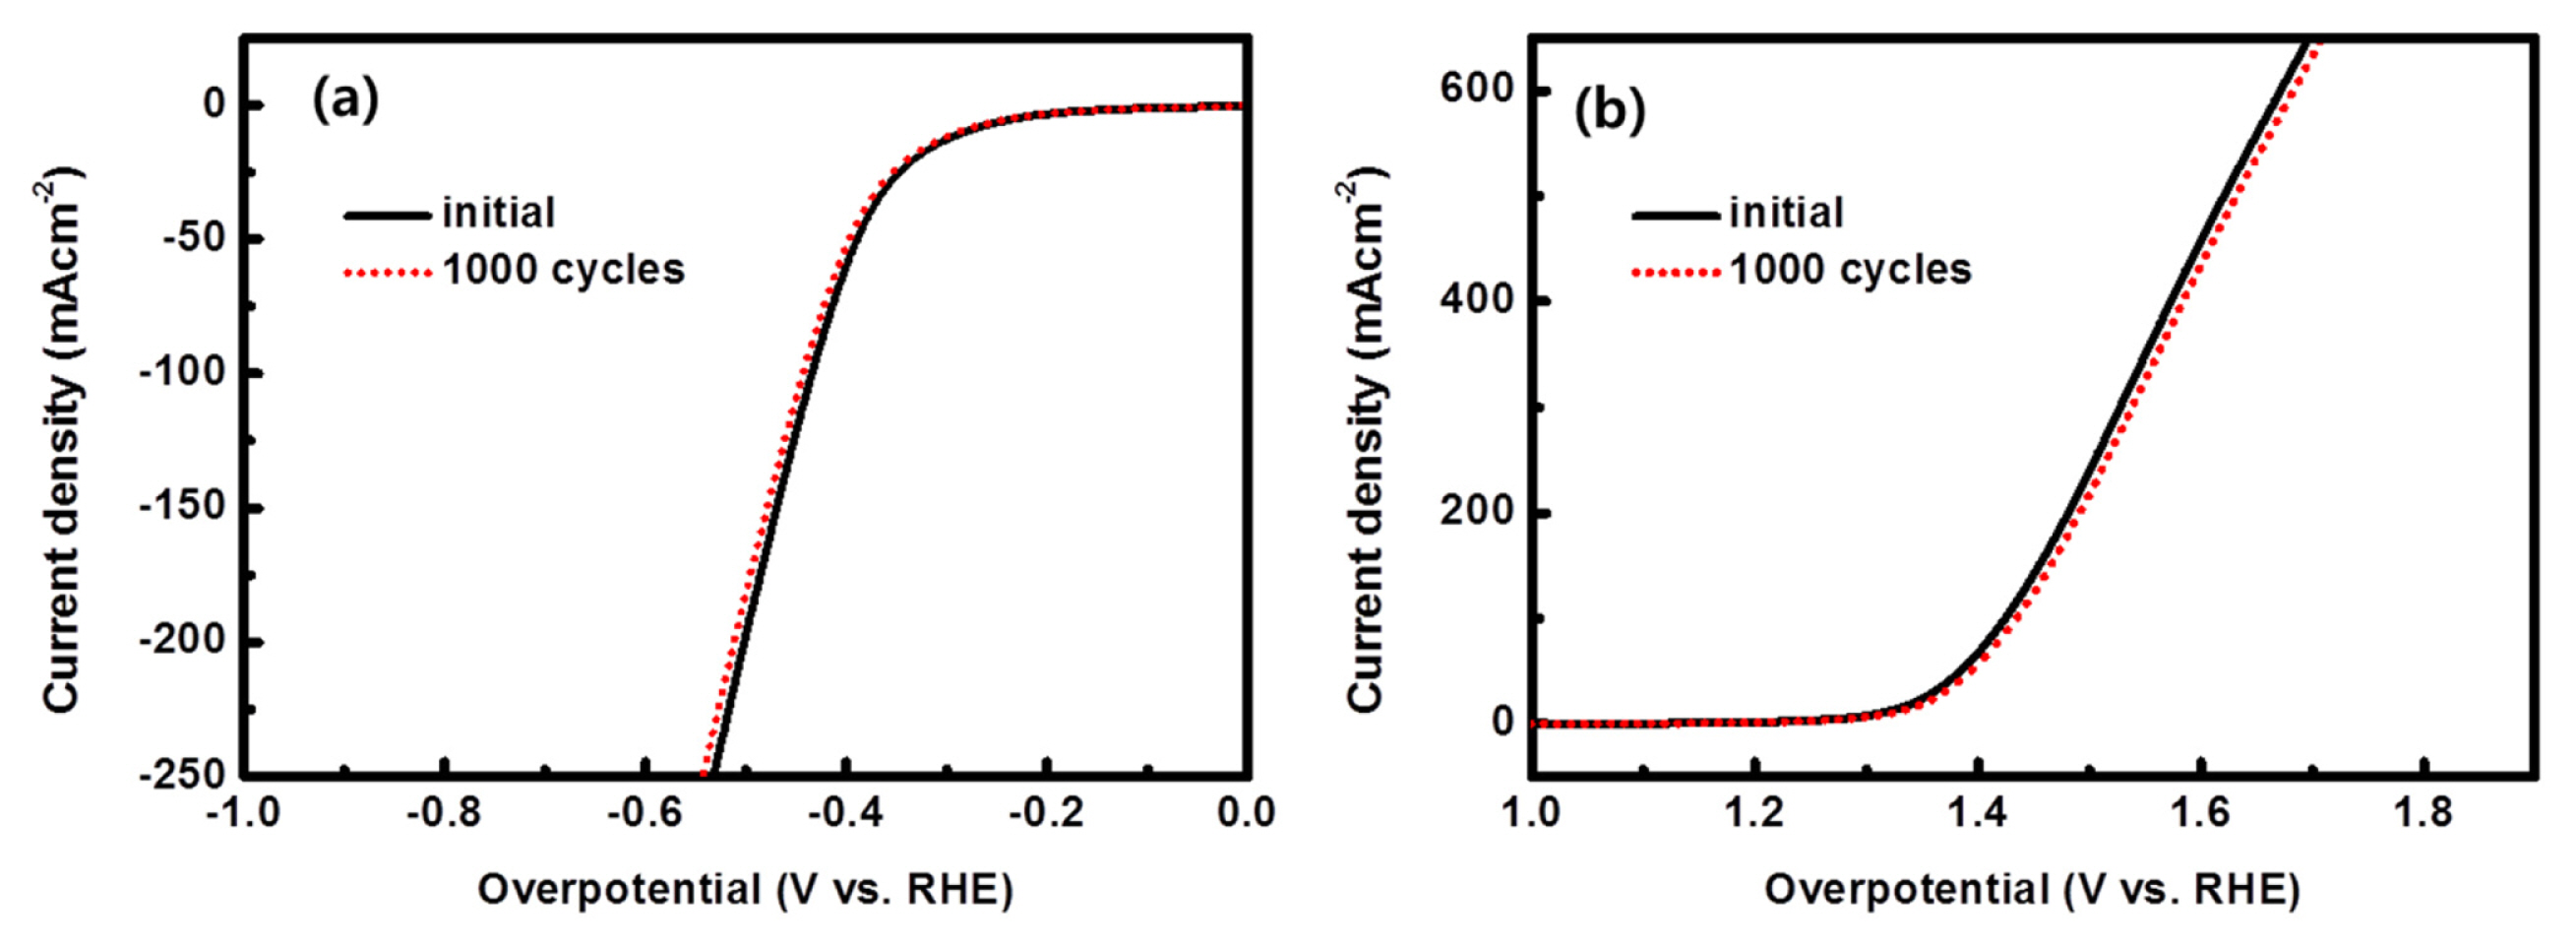
Aside from the requirement for high activity, good stability and durability are also important factors for the electrocatalysts. Stability test of the 90 nm sample was performed at the scanning rate of 5 mVs−1 by continuous 1,000 cycles in the acidic media for both HER (Fig. 6a) and OER (Fig. 6b). The polarization curves remain almost same for HER and OER after 1,000 cycles. The durability test of the samples was also performed at the scanning rate of 5 mVs−1 for HER in Fig S5(a–c) and OER in Fig. S5(d–f). The reliable durability was observed after 24 hrs for HER and OER performance.
4. Conclusions
The size effect of MoS2 (6000 nm, 2000 nm and 90 nm) on HER and OER performance was investigated. The smallest sample (90 nm) exhibited the highest HER and OER activities with the lowest overpotential of −0.28 V at −10 mAcm−2 and 1.52 V at 300 mAcm−2. The corresponding Tafel slopes were 151 and 176 mVdec−1 for HER and OER, respectively, which is the lowest slopes compared to the other samples. The MoS2 sample also exhibited good stability and reliable durability after 1,000 cycles and 24 hrs. The high HER and OER performance of the 90 nm MoS2 is attributed to the large surface area with edge sites and low charge transfer resistance, which factors can play very important role for good HER and OER performance, resulting in high capacitance, fast electron transfer, and high catalytic behavior. It is concluded that MoS2 of the smallest size has the best HER as well as OER catalytic performance.