Introduction
Lamotrigine (LAM) is a new generation classified antiepileptic drug used for managing refractory partial seizures in patients with or without secondary generalization [1,2]. It has been increasingly used as monotherapy in the management of tonic-clonic seizures [2–5]. This phenyl triazine class anticonvulsant drug is also found effective against childhood epilepsy and bipolar disorder in adults and duly approved by the Food and Drug administration of the U.S. (FDA) [2,4,6–10]. It acts on voltage-sensitive neuronal membranes and inhibited the excitatory amino acid neurotransmitters release which plays a key role in the reproduction and spread of epileptic seizures [11].
LAM N2-glucuronide (LMG-N2G) is claimed as the primary metabolite of LAM (at a concentration of up to 1μg/L) in treated wastewater and in the environmental samples. Though it is pharmacologically inactive, can be deconjugated in water to form its parent compound [12–16]. In the hospital effluents the presence of LAM can be related to two things: firstly due to excretion by human metabolism in which excretion of LAM in the urine occurs in its glucuronide form (only approximately 15% is excreted as the parent compound); and secondly due to deconjugation of LAM N2-glucuronide to its parent compound LAM because of the presence of b-glucuronidase enzymes [7,16] A recent study confirmed the presence of LAM in 94% of samples of which is strongly affected by wastewater at an average concentration of 488 ng/L [12]. In another study, the presence of LAM is reported at the concentrations of ng/L in treated wastewater and wastewater contaminated freshwater [14]. LAM was also reported in relatively high concentrations in the range of 17 to 488 ng/L [16], and in south Africa, LAM was present in 64% of surface water samples, at a mean concentration of 190 ng/L [17].
LAM is having neuroactive properties that make it potentially hazardous to aquatic life similar to other pharmaceuticals of psychoactive nature that have impacted aquatic life by affecting its predator-prey relationships [18]. Moreover, in humans, LAM is also having toxic interactions with carbamazepine - a metabolite commonly present in wastewater affected streams, by reacting to its 10–11-epoxides [19–20]. The harmful effects of LAM are; fever, headache, fatigue and diarrhoea [8,21–23] whilst the overdose can cause life-threatening skin rashes, such as steven-johnson syndrome characterized by painful blistering of mucous membranes and the skin, and is often fatal [24,25].
In a recent study [20], in LAM the presence of amino groups and electron-donating nitrogen atoms have resulted in C-Cl bond stabilization and explained the photostability of LAM. Previously [26], under simulated sunlight dose of 500 mJ/cm2, LAM transformation has been confirmed by its parent compound isomerization and products. In LAM degradation, a reaction with hydroxyl radical is found much more effective than direct photolysis. Based on their previous study [27] full mineralization is unlikely, at this transformation level of the parent molecule. The persistent presence of LAM in environmental samples indicated its remarkable stability in conventional water treatment processes and the environment, moreover, it is quite resistant to advanced treatment processes like photolysis and ozonation. LAM reacts rapidly with hydroxyl radicals, howbeit, its reaction rate is reported to slow in comparison to most organic micropollutants [28], which makes LAM one of the more resistant pharmaceutical micropollutants in the removal by these processes [20]. As per another recent study [7], LAM oxidation by ozonation mainly forms N-oxide as an oxidation product. For N-oxide, no significant removal was seen in bench-scale experiments on biodegradation with activated sludge [29]. No treatment is able to completely degrade the derivatives of LAM. Though 96% removal of LAM is reported, many metabolites which are conjugates were detected [7]. LMG-N2-G was degraded by approximately 90% at pH 7 in an 8-hour duration of activated sludge treatment [16]. It was suggested in one study that in wastewater treatment plants the degradation of LMG-N2-G would proceed preferably through biotic pathway. In surface water, the rate of biotic degradation is suggested to be dependent on the concentration of biomass whilst the abiotic route is mainly dependent on the pH. In the human body LAM is broadly metabolized by glucuronide (> 85%), its high environmental concentration could be reduced by pH enhancement of the LMG-N2-G containing wastewaters. However, this would yield OXO-LMG through deconjugation [16].
To the best of the authors’ knowledge and based on literature, no previous study is reported on the electrochemical advanced oxidation of LAM at Ti/DSA (Ta2O5-Ir2O5) anode and Stainless Steel (SS) anode. In electrochemical oxidation treatment of wastewater containing refractory molecules, Ti/DSA electrodes were demonstrated both high efficiency and stability [30]. SS is selected as electrode material for EAOP for the combined process, i.e., electro-oxidation and electro-coagulation. Its efficacy is indicated in the previous study on mineralization of diclofenac sodium by the combined process of electro-oxidation and electro-coagulation [31]. EAOP, though demanding in respect of electrical energy, is an attractive treatment method because no outside oxidant is required to be added. Further, overall energy consumption can also be reduced by utilizing cathodic hydrogen via process integration [32].
This study reports the electrochemical advanced oxidation of LAM using the anodes of Ti/DSA (Ta2O5-Ir2O5) and SS. In EAOPs at Ti/DSA anode, degradation and mineralization kinetics are reported by electro-oxidation process alone, whereas in EAOPs at SS anode, degradation and mineralization kinetics are reported by combined process of electrooxidation and electro-coagulation. The effect of different parameters on the process is also studied. The effectiveness of two anodes is compared during the EAOPs in degrading and mineralizing LAM and the energy dynamics.
2. Experimental
2.1. Chemicals and materials
Pharmaceutical standard LAM (C9H7Cl2N5), used as a target organic pollutant in the study, was warmly donated by M/s IOLCP, Barnala, India. It was used as the target organic pollutant. SS 304 (50 mm × 45mm × 1mm thick with Hook 60mm × 8mm × 1mm thick) were purchased from a local metal shop, Sangrur, India. Ti/DSA (Ta2O5-Ir2O5) plates (50 mm × 45 mm × 1 mm thick with Hook 60 mm × 8 mm × 1 mm thick) were purchased from Ti Anode Fabricator Pvt. Ltd., Chennai, India. Sodium hydrogen carbonate (NaHCO3) and sodium carbonate anhydrous (Na2CO3) of AR grades were procured from CDH, Mumbai, India. HPLC grade Methanol and Potassium dihydrogen orthophosphate (KH2PO4) purified was purchased from SDFCL, Mumbai, India. Potassium hydrogen phthalate (C8H5KO4) and Orthophosphoric acid (H3PO4) of HPLC grade were purchased from Loba Chemie Pvt. Ltd., Mumbai, India. Anhydrous Sodium sulphate of SQ grade was procured from Thermo Fisher Scientific India Pvt. Ltd, Mumbai, India. Ultrapure deionised water obtained from the Millipore water purification system (Merck progard ® TS2) was used in the preparation of all the solutions.
2.2 Cyclic Voltammetry
Electrochemical measurements were performed using an 80 mL capacity conventional three-electrode cell in combination with a fully computer-controlled potentiostat-galvanostat (Biologic make, model SP-150 with EC Lab V10.33 software). Working electrodes of Ti/DSA and SS-304, each having an operative surface area of 2 cm2 were used in the study. Counter electrode of the platinum wire coil and the reference electrode of Mercury/Mercurous sulphate (MMS) was also used for the purpose. Cyclic Voltammetric experiments were carried out in unstirred solutions at the different scan rates of 10, 50, 100 and 200 mv/s. Cyclic Voltammograms were recorded after 10 cycles.
2.3 Batch EAOP experiments
The EAOP experiments were performed on LAM to carry out degradation and mineralization kinetics in a 250 mL glass reactor. In EAOP on Ti/DSA anode, Ti/DSA electrode acted as an anode and SS-304 electrode was the cathode for the process of electro-oxidation, whereas, in EAOP on SS anode, SS-304 electrode was acted as both anode and cathode for the combined process of electro-oxidation and electro-coagulation. Both electrodes were rectangle carved with each having an operating area of 90 cm2 and an inter-electrode gap of 5 mm.
All experiments were performed applying 200 mL synthetic wastewater consisting of 50 ppm of LAM at 3 different current densities of 1.11, 1.38 and 1.58 mA/cm2 at three concentrations of supporting electrolyte of Na2SO4 (50, 75 and 100 ppm). 2mL samples were drawn out by syringe filter at distinct intervals and used for analysis. All experiments were carried out in duplicate and the mean results were reported.
2.4. Analytical methods
Determination of total organic carbon was made by a TOC analyser (TOC-L Shimadzu), based on combustion catalytic oxidation. After the treatment concentration of LAM was quantified by an HPLC system made up of a pump (Waters 1515 isocratic pump). Waters 2487 (dual λ detector) was used as a detector. The wavelength was fixed at 270 nm and Breeze software was used for data acquisition and analysis. The column used was X-Bridge (C18 5 μm 4.6 × 250 mm) working based on reverse phase chromatography. The mobile phase contained methanol (65%) and 50 mM potassium dihydrogen orthophosphate (35%) on a v/v basis. The pH of the mobile phase was adjusted to 4.5 by dilute orthophosphoric acid. The mobile phase was run in an isocratic manner and the flow rate was of 1.0 mL/min was maintained. 20 μL Injection volumes were used.
3. Results and Discussion
3.1. Cyclic voltammetry
3.1.1. Ti/DSA (Ta2O5-Ir2O5) anode
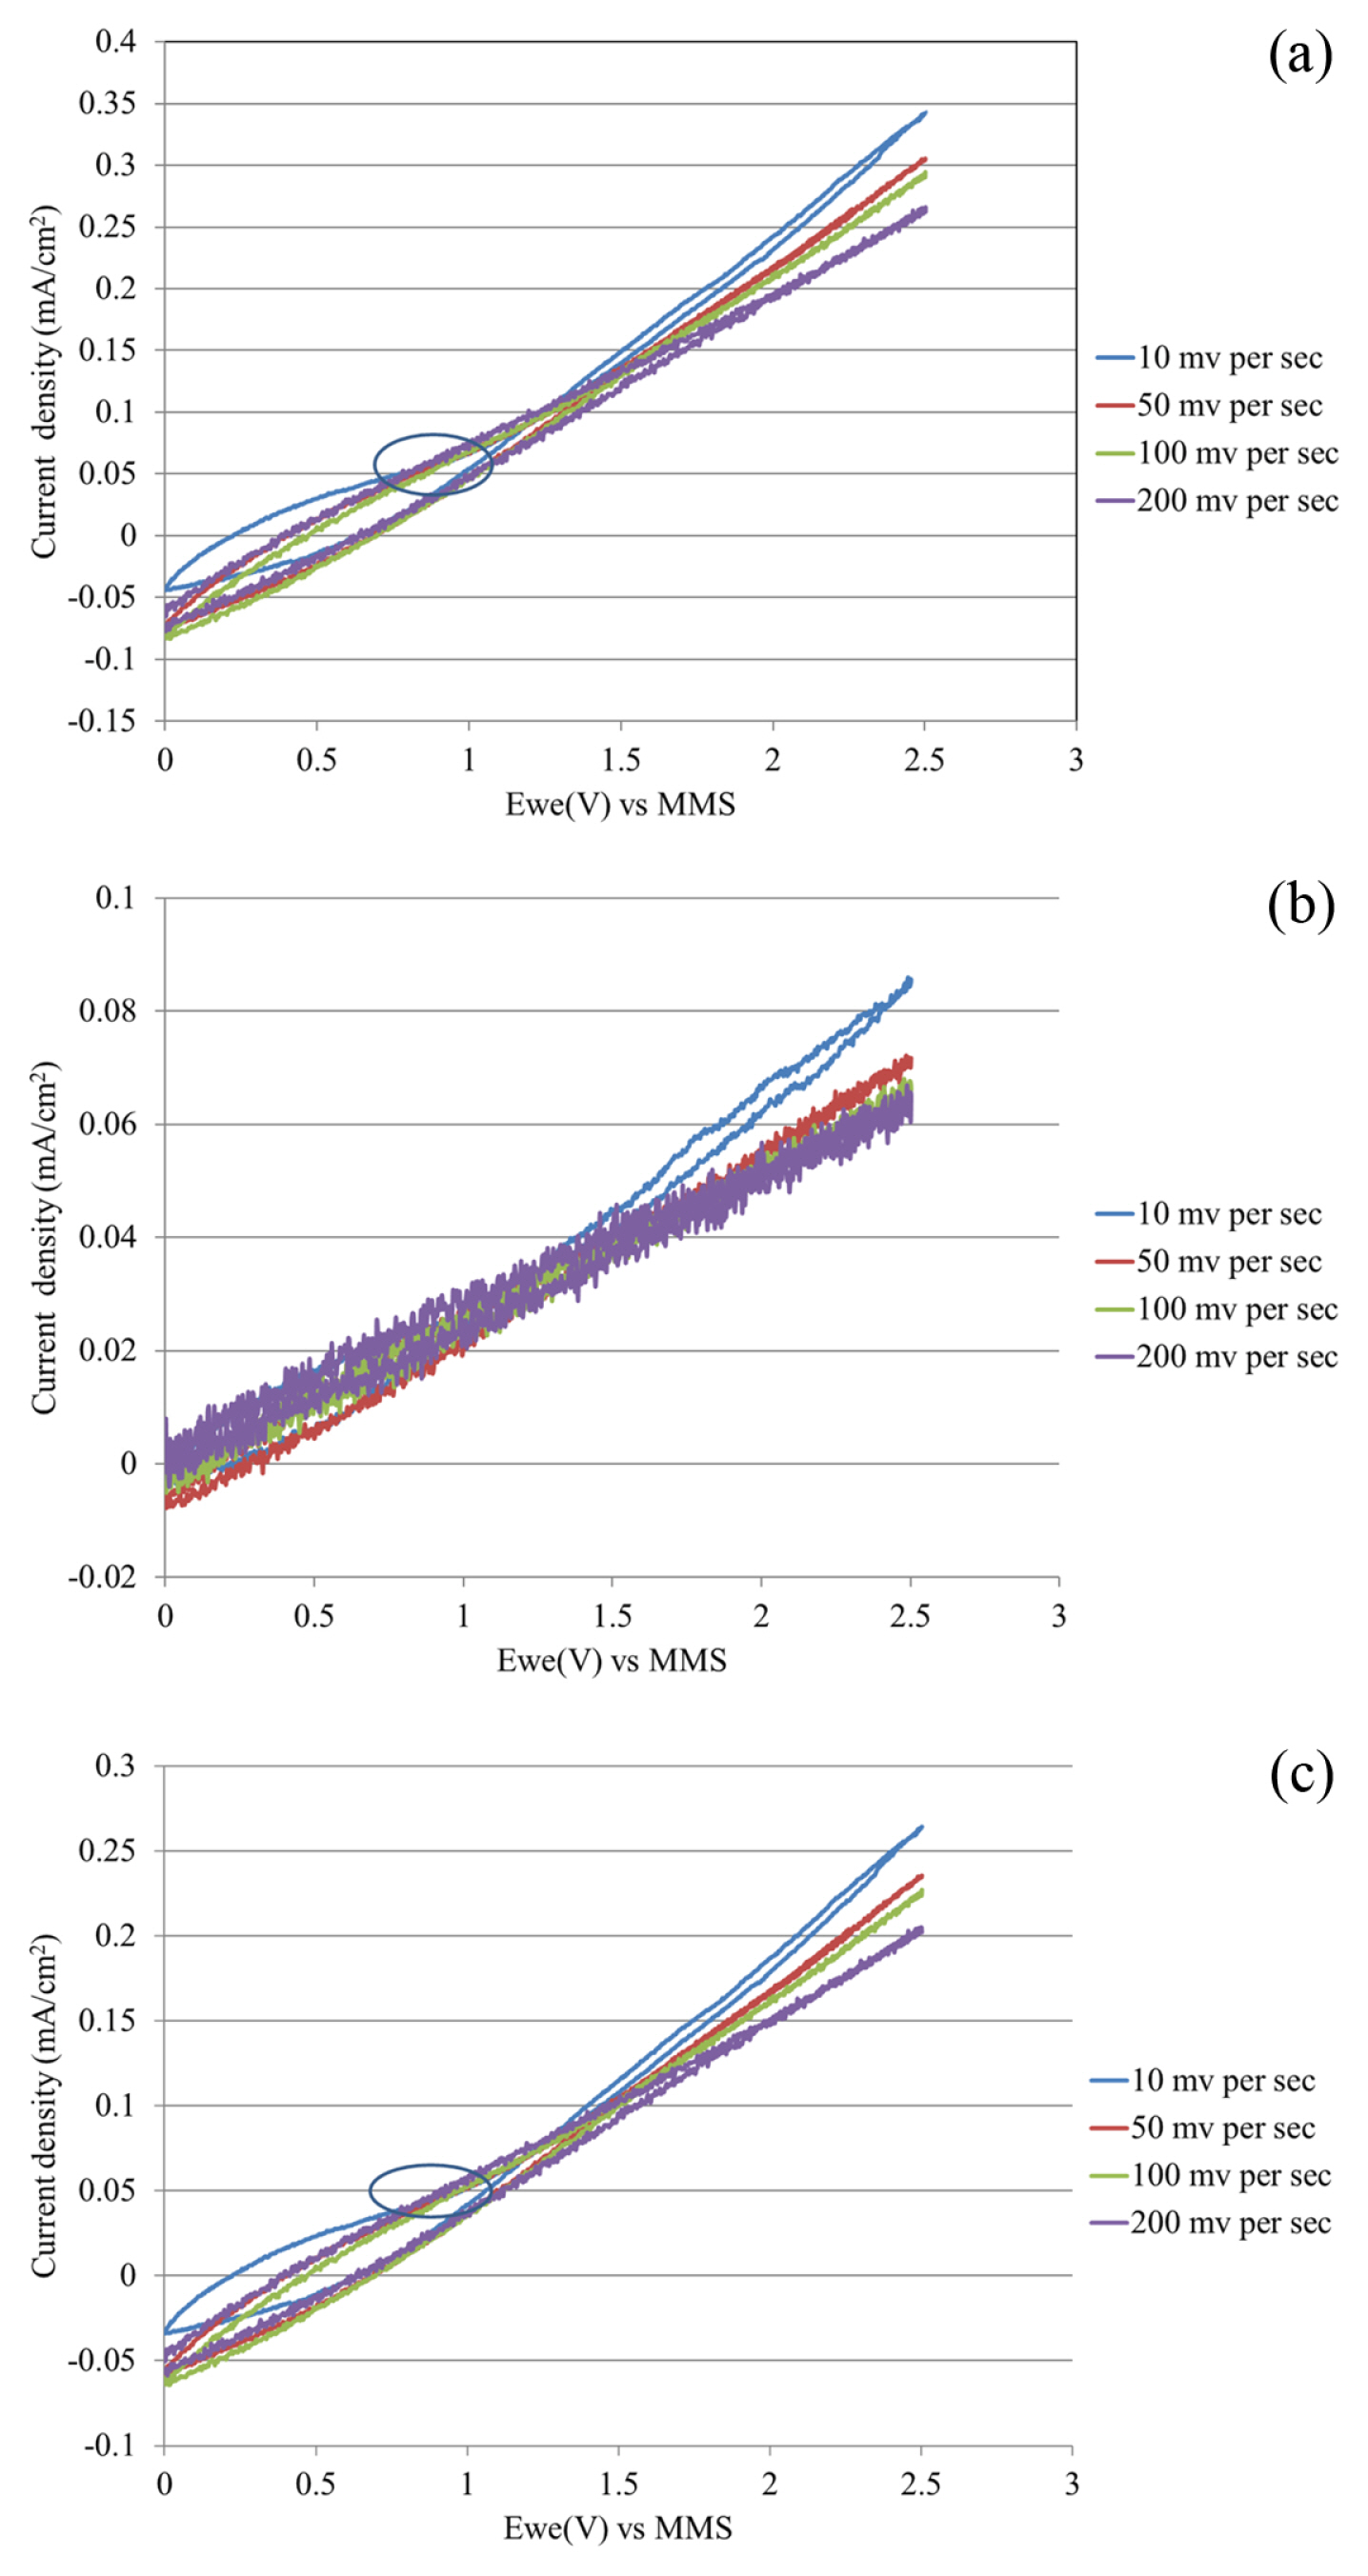
Determination of potential window and the oxygen evolution reaction by electrochemical measurements at the Ti/DSA (Ta2O5-Ir2O5) electrode are important for its characterisation. The cyclic voltam-metric experiments in potential range from 0 to 2.5 V vs MMS reference electrode were conducted to ascertain the exact mechanism of electro-oxidation (direct/indirect). The selection of potential range was made based on reported studies in which Na2SO4 as supporting electrolyte was used in electro-oxidation systems [33] and on the reported studies in which oxidation of LAM was carried out on Ag/AgCl reference electrode [8,34]. The obtained cyclic voltam-metric curves were shown in Fig. 1 in aqueous solutions of (i) 50 ppm Na2SO4, (ii) 50 ppm LAM, (iii) 50 ppm Na2SO4 and 50 ppm LAM; at different scan rates of 10, 50, 100 and 200 mV/sec.
No peaks were observed for all 3 samples at all four different scan rates. In the case of 50 ppm LAM solution (Fig. 1b), the electrochemical current density is very less, due to the absence of an electrolyte, resulting in very low solution conductivity. The current increases monotonously with increasing potential. In Fig. 1a and Fig. 1c, an anodic shoulder is observed between 0.7 to 1.1 V vs MMS reference electrode (Circled in figure 1 a and c). In an aqueous system SO42− is weekly hydrolysed as:
Therefore, the electrochemical system consists of the ions SO42−, HSO4−, OH− and water which is present in excess. These will compete for charge transfer at the anode according to the reactions.
The reactions (2), (3), (4) and (5) are energetically favoured in that order considering the activation overpotentials [35]. Therefore, oxidation of SO42− occurs at lesser potential followed by the oxidation of HSO4− than that required for water oxidation. The ion radical SO4•− further dimerises to produce S2O82− according to the reaction:
The reactions (2), (3) and (6) together attributes to the formation of an anodic shoulder as observed in the voltammogram. At higher potential water oxidation predominates as it is present in large excess. This results in a large increase in current density at higher potentials and the evolution of gaseous oxygen [33,35,36].
It was also shown in Fig. 1 that the current density value has reached up to ~0.35, ~0.085 and ~0.27 mA/cm2 when (i) 50 ppm Na2SO4, (ii) 50 ppm LAM, (iii) 50 ppm Na2SO4 and 50 ppm LAM; were used respectively, as the presence of Na2SO4 increased the conductivity of the solution. Cyclic voltammograms of LAM and Na2SO4 on Ti/DSA anode are not reported in the literature.
3.1.2. SS anode
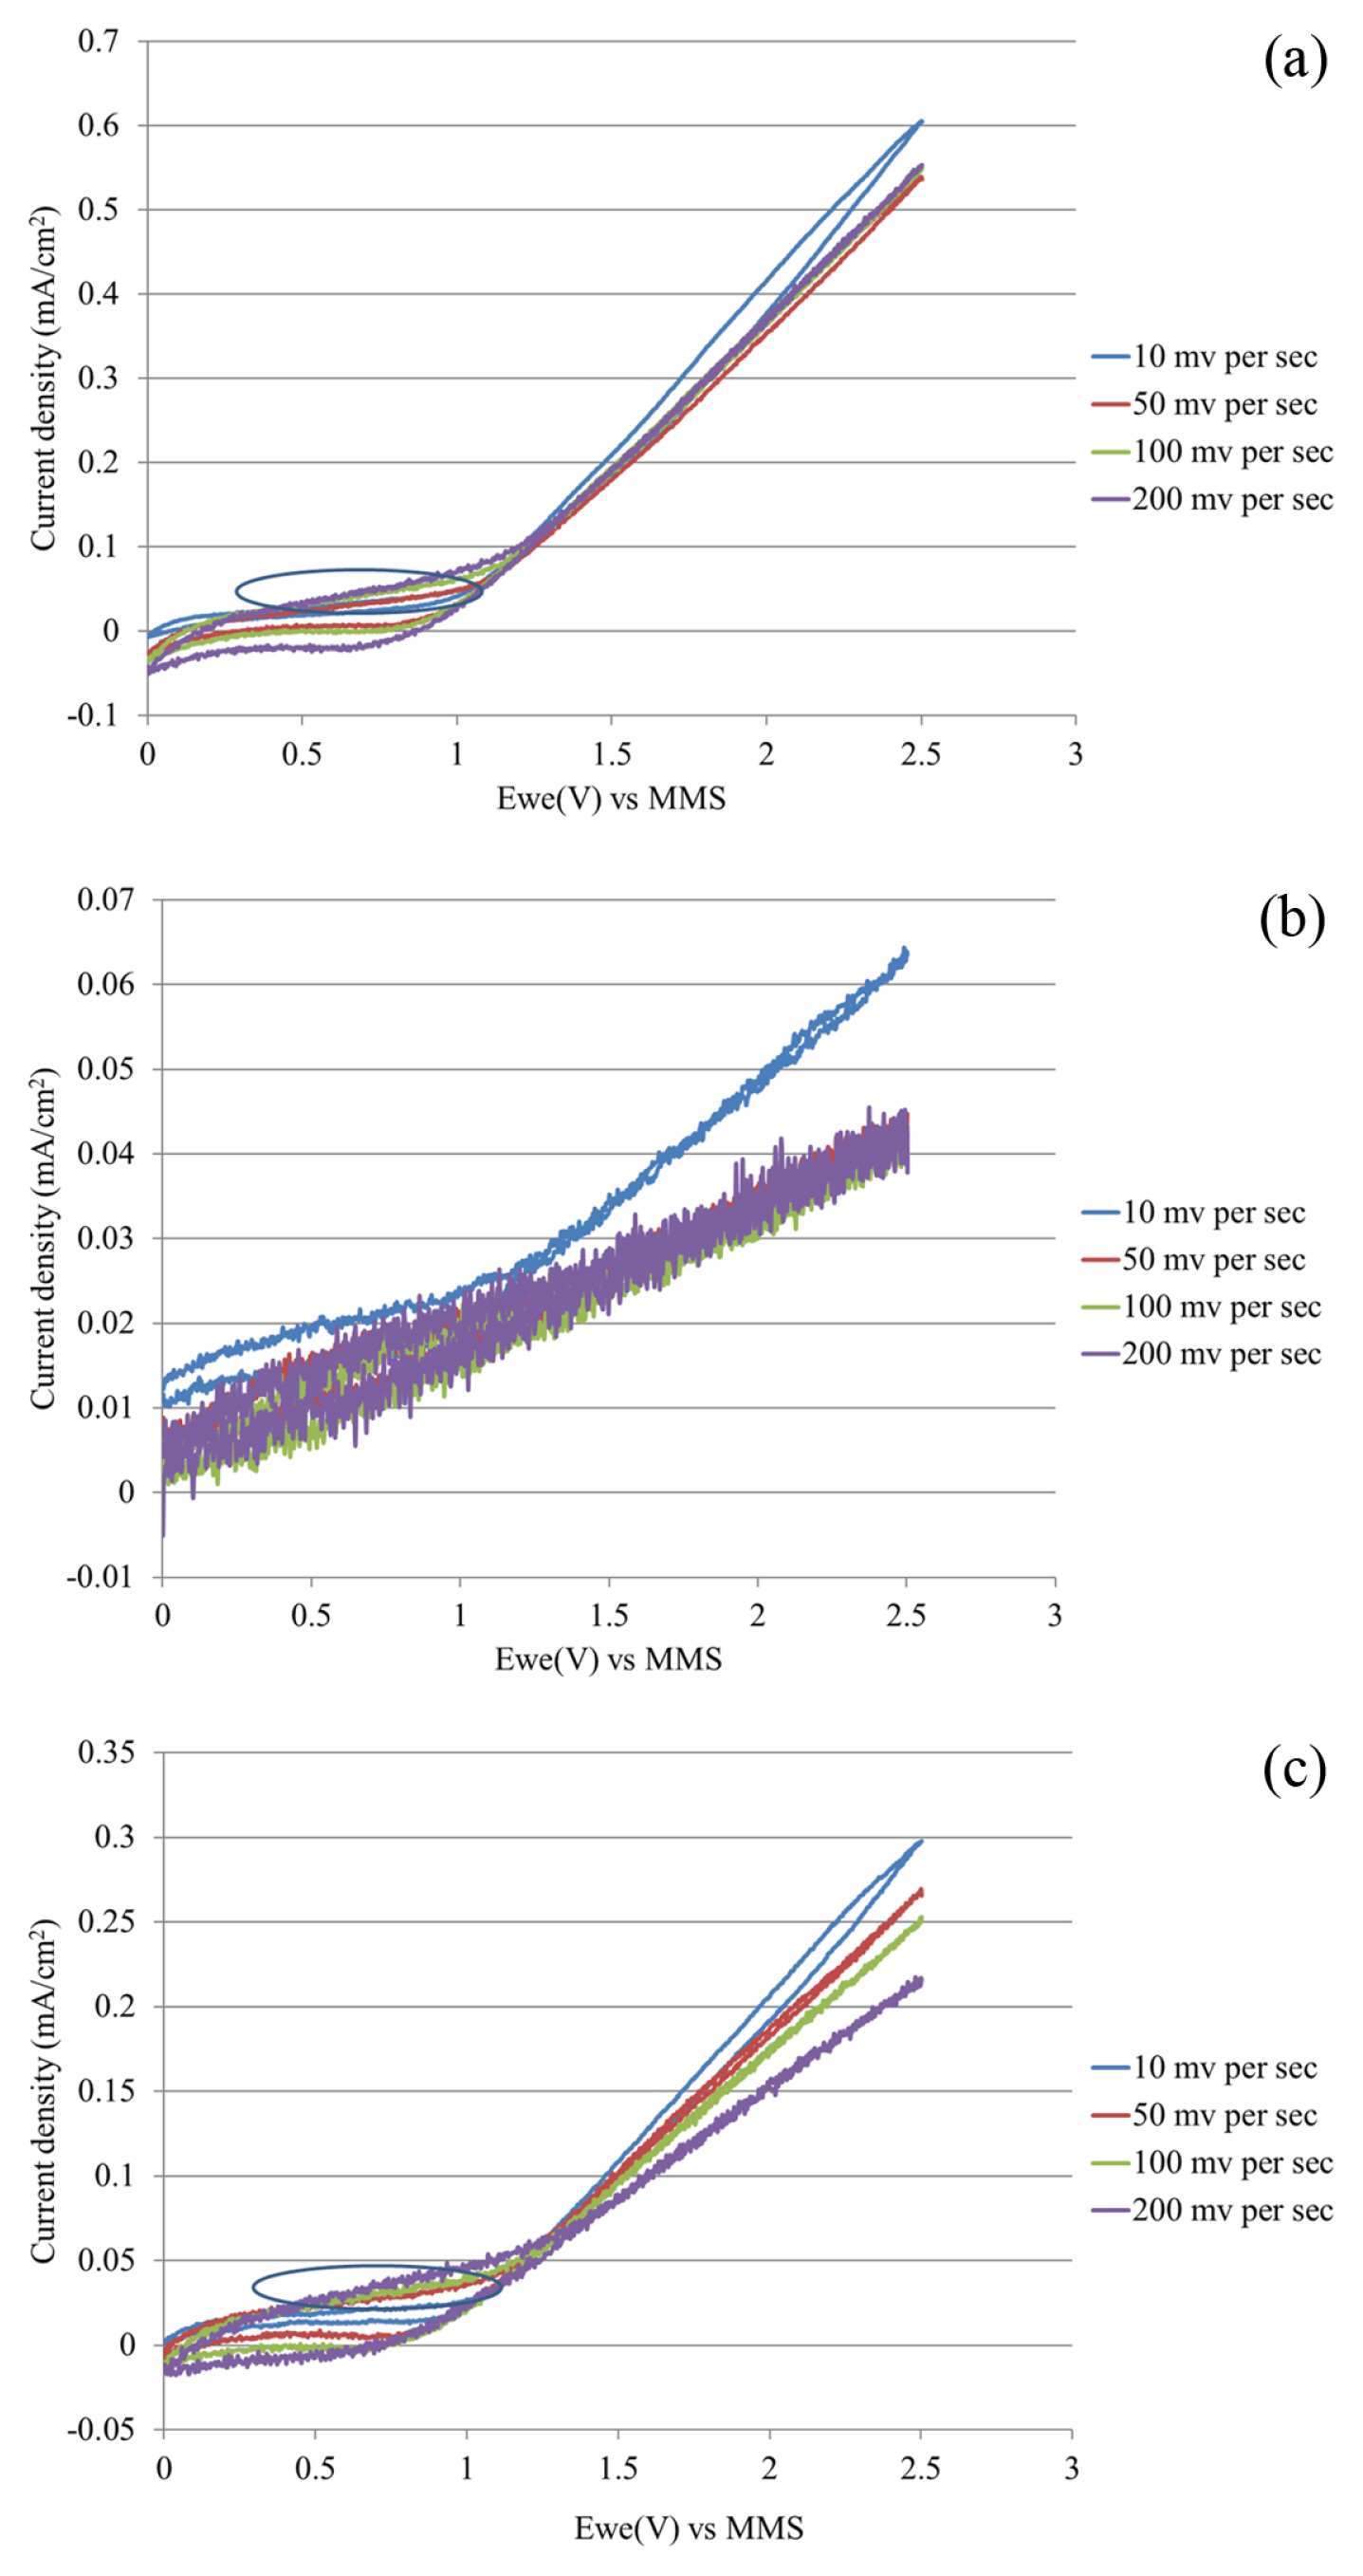
Cyclic voltammetry was accomplished on SS anode to find out the mechanism (direct or indirect) of LAM combined electro-oxidation and electrocoagulation. The selection of potential range from 0 to 2.5 V vs MMS reference electrode was made based on a previous study on Na2SO4 electrochemical oxidation [33] and the earlier work on LAM electrochemical oxidation on Ag/AgCl reference electrode [8,34]. The obtained three sets of cyclic voltammograms shown in Fig. 2 are each for aqueous solutions of (i) 50 ppm Na2SO4, (ii) 50 ppm LAM, (iii) 50 ppm Na2SO4 and 50 ppm LAM; at different scan rates of 10, 50, 100, and 200 mV/sec.
Similar to voltammogram for Ti/DSA (Fig. 1b), the voltammogram at SS anode for 50 ppm LAM solution (Fig. 2b), shows minimal electrochemical current density and almost monotonous increase with potential. This is again because of very low solution conductivity in the absence of an electrolyte. In Fig. 2 a and c, an anodic shoulder is observed between 0.3 to 1.1 V vs. MMS reference electrode (Circled in Fig. 2 a and c). In the case of SS anode, in addition to the reactions (1) to (6), oxidation of ferrous species also takes place according to reactions [32]
The reactions (7) and (8) are energetically even more favoured and would occur at potentials lesser than that required for reactions (2) and (3). The combination of reactions (2),(3),(6),(7) and (8) is responsible for the observed anodic shoulder in the voltammogram for SS anode. Finally, like Ti/DSA, oxygen evolution reaction took place and a sharp increase in current density occurred with increasing potential. It may also be noted that the onset of the shoulder, in this case, shifts to lower potential compared to Ti/DSA. This is mainly because of the reactions (7) and (8) occurring on SS anode but not on Ti/DSA.
In the context of degradation and mineralization of LAM, reactions (7) and (8) are important for in situ generations of coagulation of coagulants Fe2+ and Fe3+ contributing to organics removal by electrocoagulation.
Activation of persulphate ion by ferrous ion resulting in the formation of free radicals is also reported [37]
Fig. 2 also display that the value of current density has reached up to ~0.60, ~0.063 and ~0.30 mA/cm2 when (i) 50 ppm Na2SO4, (ii) 50 ppm LAM, (iii) 50 ppm Na2SO4 and 50 ppm LAM; were used respectively, as the presence of Na2SO4 increased the conductivity of the solution. Moreover, these current densities are higher than those observed for Ti/DSA indicating that SS is electro catalytically more facile towards oxidation. This would be energetically important as SS anode has to be at less potential for the same current density compared to Ti/DSA.
3.2. Degradation kinetics of LAM
3.2.1. Ti/DSA (Ta2O5-Ir2O5) anode
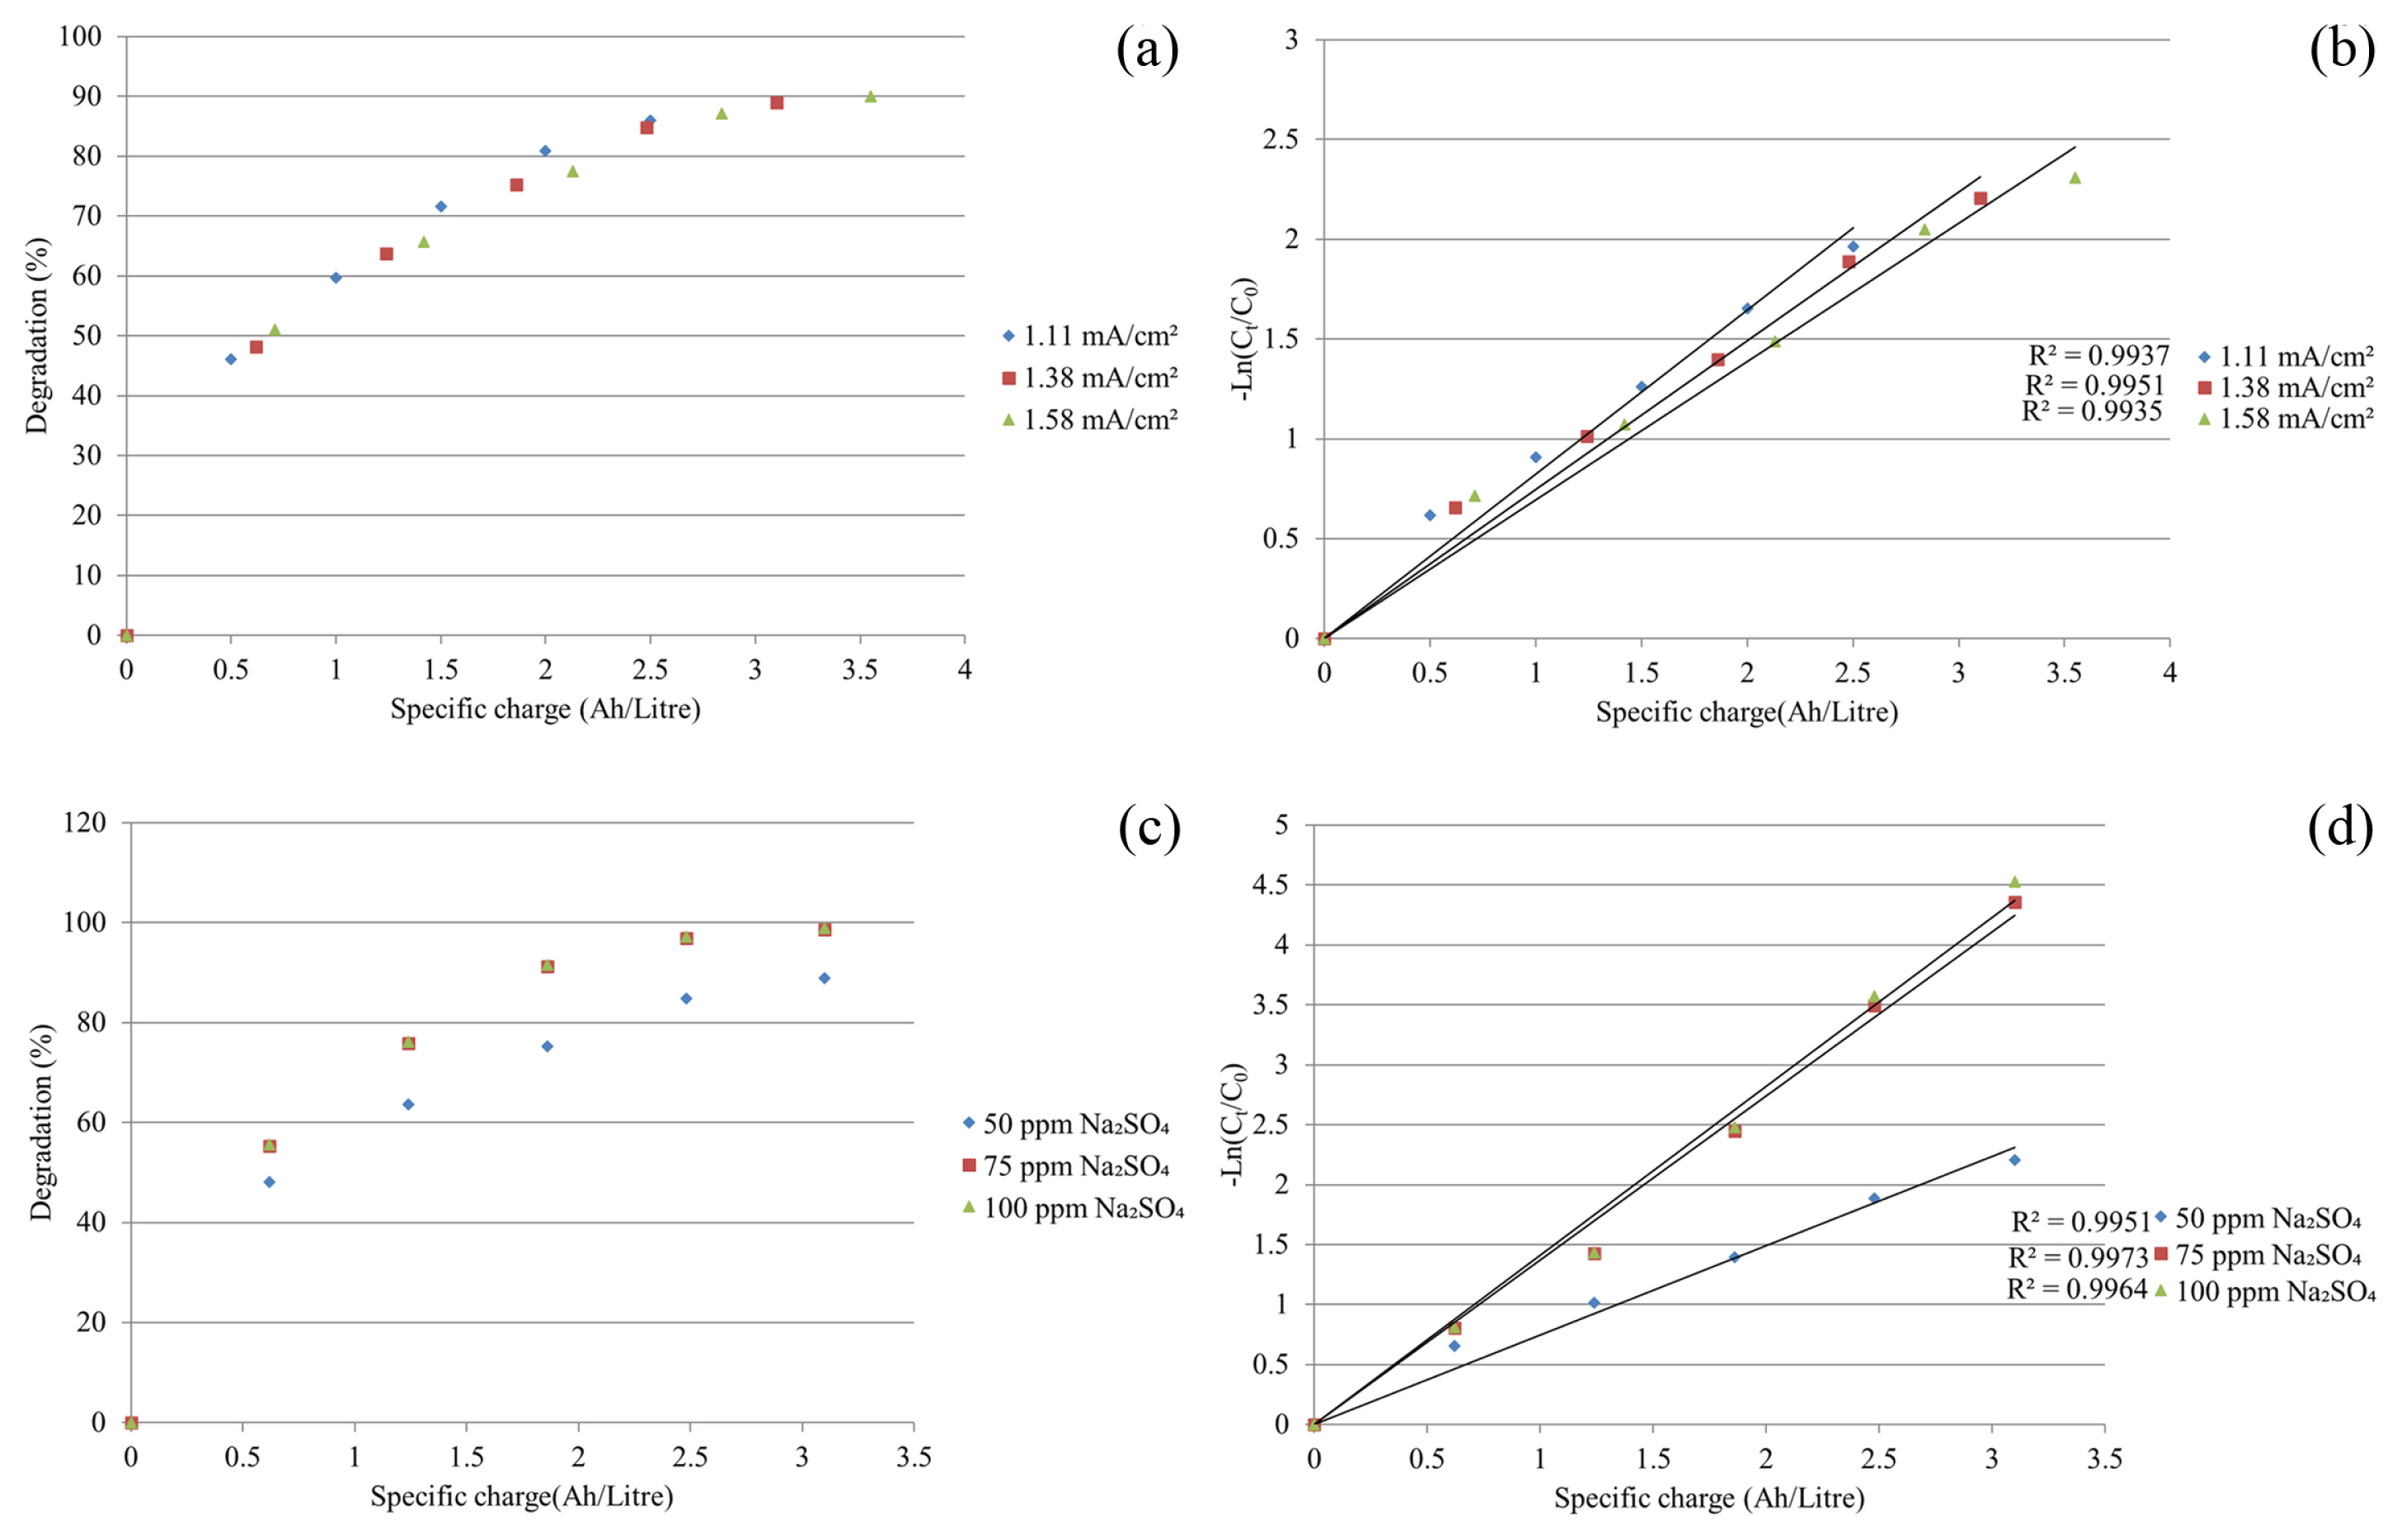
Effect of current density on the decay of the Ct/Co of LAM over specific charge (Ah/litre) for the Ti/DSA anode is displayed in Fig. 3a. Fig. 3b shows the effect of the current density on the varying natural logarithm of Ct/Co over Specific charge (Ah/litre) for the Ti/DSA anode. An excellent linear plot between the natural logarithm of Ct/Co and Specific charge (Ah/litre) confirms that degradation proceeds through pseudo first-order kinetics. In the beginning of EAOP (moderate values of specific charge) on Ti/DSA, high rates of degradation were achieved at each current density that indicated efficient utilization of electrogenerated oxidant radicals. Degradation rate observed decreasing with a specific charge, mainly due to the continually decreasing residual concentration of LAM. Degradation of LAM increased continuously in reference to specific charge at each current density, for the entire duration of EAOP. The decay of LAM depended on the current density. Degradation was seen increasing from 58.46% to 66.96% as current density increased from 1.11 mA/cm2 to 1.38 mA/cm2 after accompanying specific charge values of 2.5 and 3.1 (Ah/litre), respectively. The degradation further increased from 66.96% to 68.68% as current density increased from 1.38 mA/cm2 to 1.58 mA/cm2 after accompanying specific charge values of 3.1 and 3.55 (Ah/litre) respectively. For kinetics analysis, the LAM removal rate was evaluated by a pseudo-first-order equation as follows [37]:
Here,
Ct = residual LAM concentration
C0 = initial LAM concentration
k = pseudo first order rate constant (Litre/Ah)
Q = specific charge (Ah/litre)
The degradation rate constant of the pseudo-first order was noticed increasing, with current density increase from 1.11 to 1.38 mA/cm2, howbeit it was seen decreasing with further current density increase from 1.38 to 1.58 mA/cm2. These are displayed in Table 1. This highlights the gravity of the parasitic reaction of oxygen evolution if the current density surpasses a threshold.
The effect of Na2SO4 concentration on LAM degradation is shown in Fig. 3c. For the Ti/DSA anode, the kinetics was illustrated by the integral method of analysis and given in Fig. 3d that displays the effect of the Na2SO4 concentration on the natural logarithm of Ct/Co over Specific charge (Ah/litre). In this case also, when we plot the natural logarithm of Ct/Co vs Specific charge (Ah/litre), the straight-line functionality with a high correlation coefficient is obtained that confirm pseudo first-order kinetics. For all supporting electrolyte concentrations, the degradation rate continuously decreased with a specific charge. The decay of the LAM depended on the concentration of supporting electrolytes. Degradation was seen increasing from 66.96% to 73.80% as Na2SO4 concentration increased from 50 ppm to 75 ppm after an associated specific charge of 3.1 (Ah/litre). Likewise, the degradation was further seen increasing from 73.80% to 75.42% as Na2SO4 concentration increased from 75 ppm to 100 ppm after an associated specific charge of 3.1 (Ah/litre). The movement of ions is favoured, as the conductivity of the solution increases with Na2SO4 concentration. The pseudo first-order degradation rate constant was continuously increased with an increase in Na2SO4 concentration from 50 to 100 ppm. These rate constants are displayed in Table 1.
3.2.2. SS anode
One of the striking features of electrochemical treatment on SS anode is the formation of sludge that is distinctly brownish-red in colour. Without doubt, these solids are made up of ferric species and substantiate the occurrence of reactions (7) and (8). Therefore, EAOP on SS anode is a combination of electro-oxidation and electro-coagulation. Progressive degradation of LAM on SS anode is given in Fig. 4a - a plot of relative LAM concentration over Specific charge (Ah/litre) - at different current densities. Integrated pseudo first-order degradation rate equation - linear plots of the natural logarithm of Ct/Co over Specific charge - are displayed in Fig. 4b. A good correlation is obtained between Experimental values and regression straight lines. It is confirmed that degradation of LAM follows the kinetics of pseudo first-order even in the EAOP on SS anode. Degradation of LAM increased continuously in regard to specific charge at each current density, for the entire duration of EAOP. The decay of LAM depended on the current density. Degradation was marked increasing from 85.96% to 88.98% as current density increased from 1.11 mA/cm2 to 1.38 mA/cm2 after accompanying specific charge values of 2.5 and 3.1 (Ah/litre), respectively. The degradation increased further from 88.98% to 90.06% as current density increased from 1.38 mA/cm2 to 1.58 mA/cm2 after accompanying specific charge values of 3.1 and 3.55 (Ah/litre), respectively.
A continuous decrease was noticed in the kinetic rate constant of the pseudo-first order when we first increased the current density from 1.11 mA/cm2 to 1.38 mA/cm2 and then to 1.58 mA/cm2. These are displayed in Table 2. Here, there is an evident paradox. As we increase the current density, the formation of oxidant radicals will take place rapidly. Simultaneously, the EAOP will be accomplished at increased potentials as represented in Fig. 4. This would advance oxygen evolution as a subsidiary reaction. As a result, the net rate of production of electro-generated oxidant radicals is lowered, causing a fall in the rate constant.
The effect of Na2SO4 concentration on LAM degradation is shown in Fig. 4c. At different Na2SO4 concentrations, Fig. 4d displays the linear regression plots of ln (Ct/Co) over Specific charge as a tool to validate pseudo first-order degradation kinetics. R2 values are significant for all regressions. Degradation of LAM increased continuously with a specific charge, at every Na2SO4 concentration for the complete duration of EAOP. The decay of the LAM depended on the concentration of supporting electrolytes. Degradation was marked increasing from 88.98% to 98.72% as Na2SO4 concentration increased from 50 ppm to 75 ppm after associated specific charge of 3.1 (Ah/litre). But thereafter degradation did not increase for all practical purposes as Na2SO4 concentration increased from 75 ppm to 100 ppm after an associated specific charge of 3.1 (Ah/litre). The reason for this increase is an enhancement in solution conductivity and consequent ease in movement of ions. The pseudo first-order degradation rate constant was found continuously increasing over an entire studied range of Na2SO4 concentration, but the increase was only marginal when the Na2SO4 increased from 75 ppm to 100 ppm. These rate constants are displayed in Table 2.
When we made a comparison of EAOPs on both the anodes, it emerges that EAOP at Ti/DSA anode occurs by electro-oxidation mechanism, where oxidation of LAM is occurred by hydroxyl radicals, whilst EAOP at SS anode occurs by combined electro-oxidation and electro-coagulation mechanism, where oxidation of LAM is complemented due to its removal via ferrous and ferric ions.
It is evident that EAOP on SS anode is far more efficient than Ti/DSA for reducing the LAM concentration in an aqueous solution. With SS anode, maximum degradation of LAM was close to 99% at 1.38 mA/cm2 current density and 100 ppm Na2SO4 as supporting electrolyte. Contrary to this, EAOP at Ti/DSA anode could achieve only 75% LAM degradation at 1.38 mA/cm2 current density and 100 ppm Na2SO4 concentration. The higher degradation could be ascribed due to liberation of Fe2+ and Fe3+ ions by SS anode which worked as coagulating agents in the electro-coagulation which worked synergistically with electro-oxidation.
3.3. Mineralization kinetics of LAM
3.3.1. Ti/DSA (Ta2O5-Ir2O5) anode
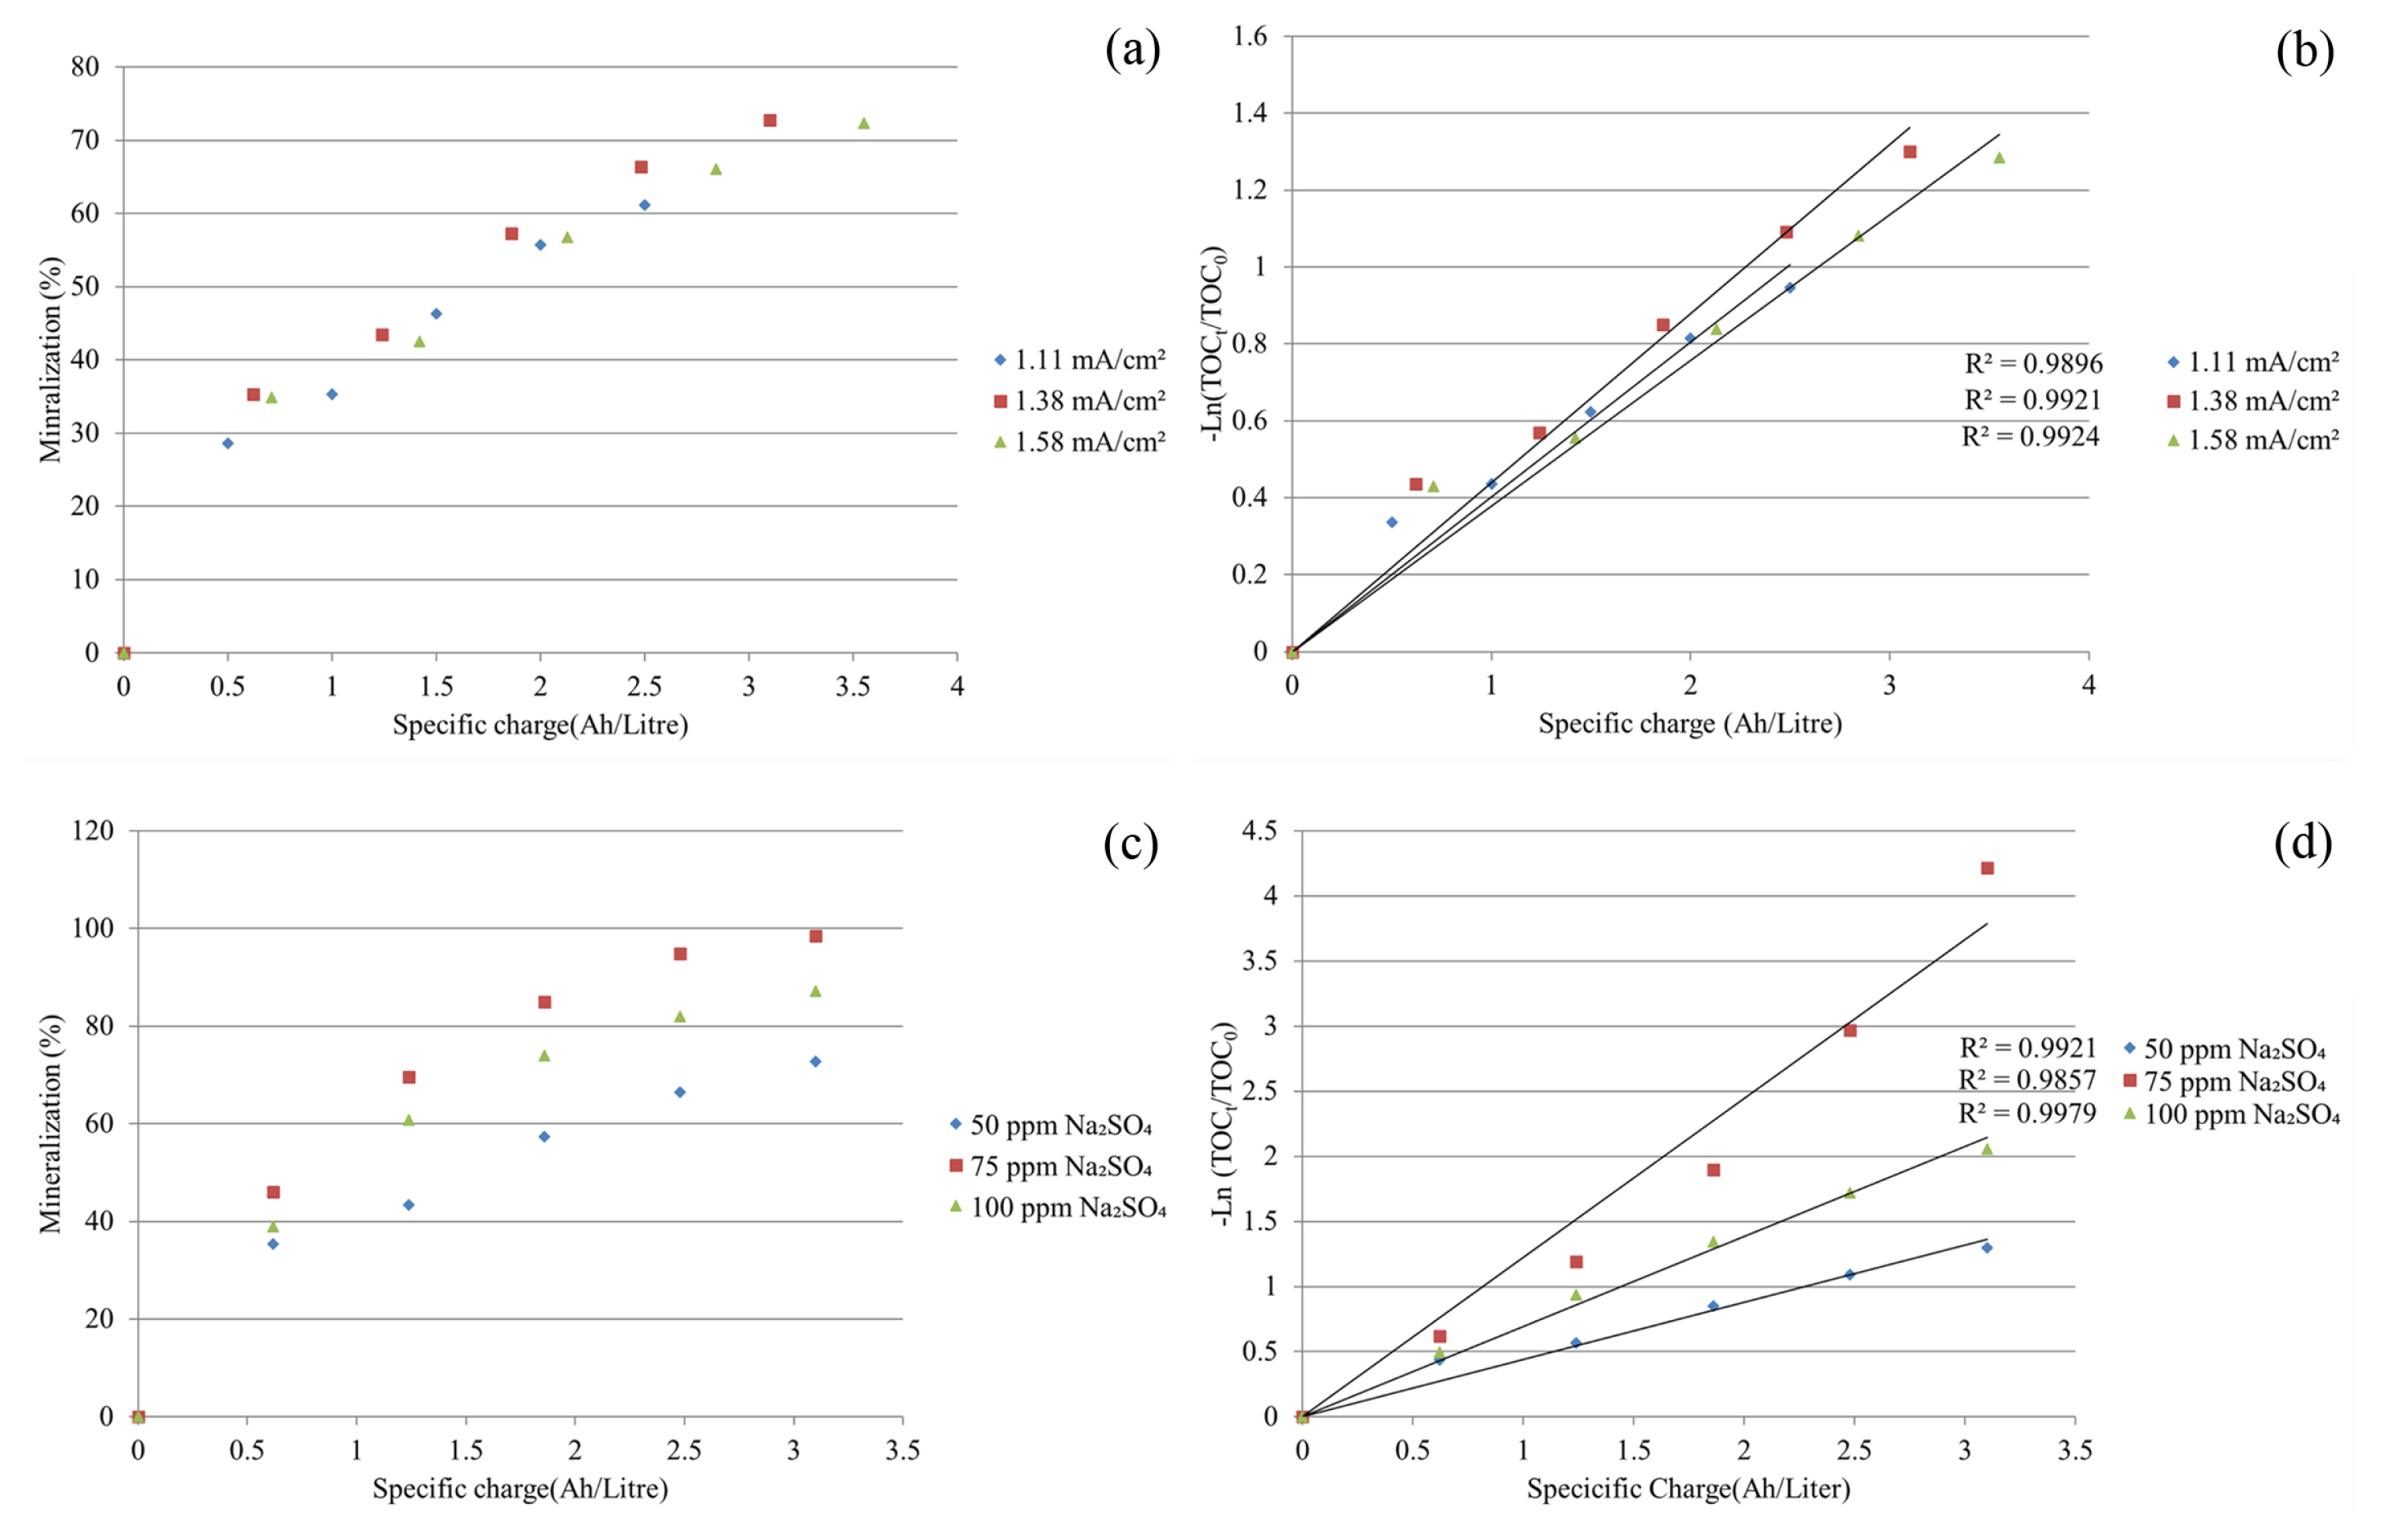
Fig. 5a displays the effect of current density on the decay of the TOCt/TOC0 of LAM over a specific charge (Ah/litre) for the Ti/DSA anode. Fig. 5b shows the effect of the current density on the varying natural logarithm of TOCt/TOC0 over Specific charge (Ah/litre) for the Ti/DSA anode. Here as well, the kinetics of mineralization is strictly adhering to the pseudo-first order. The decay of TOCt/TOC0 of LAM depended on the current density. LAM mineralization was seen increasing from 33.55% to 44.83% when current density increased from 1.11 mA/cm2 to 1.38 mA/cm2 after corresponding specific charge values of 2.5 and 3.1 (Ah/litre) respectively. Howbeit, mineralization of LAM was noticed decreasing from 44.83 to 35.55% with further increase of current density from 1.38 mA/cm2 to 1.58 mA/cm2 after corresponding specific charge values of 3.1 and 3.55 (Ah/litre) respectively. The mineralization rate constant of the pseudo-first order was noticed increasing, with current density increase from 1.11 to 1.38 mA/cm2, howbeit it was seen decreasing with further current density increase from 1.38 to 1.58 mA/cm2. These are displayed in Table 1. Hence, it is noteworthy to record that once the current density surpasses a certain value - in the present case 1.38 mA/cm2 - the corresponding mineralization efficiency (TOC removal) and the mineralization rate constant (pseudo-first order) decreases. This is due to the favouritism of occurrence of oxygen evolution reaction.
A Larger amount of gas produced at the surface also cover-up the active sites of the anode [38], further restraining the hydroxyl radical generation.
The effect of Na2SO4 concentration on the kinetics of LAM mineralization was examined by the integral method. For the Ti/DSA anode, a plot of the TOCt/TOC0 over Specific charge (Ah/litre) is displayed in Fig. 5c. Pseudo first-order rate equation over specific charge in integral form is shown in Fig. 5d. High values of correlation coefficients obtained on Ti/DSA anode confirm pseudo first-order kinetics. Mineralization, as measured by the TOCt/TOC0, was seen decreasing from 44.83% to 39.57% while Na2SO4 concentration was increased from 50 ppm to 75 ppm at an associated specific charge of 3.1 (Ah/litre). In a similar manner, mineralization further decreased from 39.57% to 36.16% while Na2SO4 concentration increased from 75 ppm to 100 ppm: related specific charge being 3.1 (Ah/litre). Accordingly, a continuous decrease was noticed in the mineralization rate constant when we first increased Na2SO4 concentration from 50 ppm to 75 ppm and then to 100 ppm. These are displayed in Table 1. Here, there is an evident paradox. With the increase in Na2SO4 concentration, the solution conductivity also increases and facilitates the movement of ions. However, reactions (2) to (5) represents the competition between different species for charge transfer. At higher Na2SO4 concentrations, reactions (2) and (3) would be favoured at the cost of reaction (5). While reactions (2) and (3) combined with reaction (6) produce oxidant species SO4•− and S2O82−, these have lesser power than •OH, which would be produced from reaction (5). Thus, at higher Na2SO4 concentrations, the increase in solution conductivity is more than offset by suppression of production of •OH in favour of SO4•− and S2O82−. As a result, the mineralization is decreased at higher Na2SO4 concentrations.
3.3.2. SS anode
Mineralization of LAM on SS anode was quantified by plotting TOCt/TOC0 vs Specific charge over different current densities and displayed in Fig. 6a. Fig. 6b displays linear regression of the natural logarithm of TOCt/TOC0 over Specific charge with different current density and associated correlation coefficients in each case. Here as well, the kinetics of mineralization is strictly adhering to the pseudo-first order. Mineralization of LAM depended on the current density. Here, it was seen increasing from 61.18% to 72.75% with a current density increase from 1.11 mA/cm2 to 1.38 mA/cm2 after accompanying specific charge values of 2.5 and 3.1 (Ah/litre), respectively. A proportionate increase in the correspondent pseudo first-order mineralization rate constant was noticed, as displayed in Table 2. According to eqn (5), increasing current density enhances the formation of •OH that subsequently increases mineralization of LAM too. Howbeit mineralization of LAM practically remained unchanged - 72.75% to 72.32% - with further current density increase from 1.38 mA/cm2 to 1.58 mA/cm2 after accompanying specific charge values of 3.1 and 3.55 (Ah/litre), respectively. Consequently, with increasing current density in this range, the pseudo first-order mineralization rate constant was marked decreasing. These are displayed in Table 2. This is due to the more oxygen evolution at the expense of hydroxyl radical generation. A Larger amount of gas produced at the surface also cover-up the active sites of the anode [38], further restraining the hydroxyl radicals generation. Moreover, a portion of a specific charge is also used to oxidize Fe to Fe2+ as per eqn (7). Hence the mediated oxidation owing to electro-generated HO• by the water decomposition is less favoured.
The effect of Na2SO4 concentration on the kinetics of LAM mineralization was examined by the integral method. For the SS anode, a plot of the TOCt/TOC0 over Specific charge (Ah/litre) is displayed in Fig. 6c. Pseudo first-order rate equation over specific charge in integral form is shown in Fig. 6d. High values of correlation coefficients confirm pseudo first-order kinetics. Mineralization, as measured by the TOCt/TOC0, was seen increasing from 72.75% to 98.53% while Na2SO4 concentration was increased from 50 ppm to 75 ppm at an associated specific charge of 3.1 (Ah/litre). A proportionate increase in the correspondent pseudo first-order mineralization rate constant was noticed, as displayed in Table 2. In all likelihood [36]. This is because of more SO42− generation at SS anode with increasing Na2SO4 concentration, which contributed to the mineralization of LAM. In contrary to this, mineralization was seen decreasing from 98.53% to 87.52% while Na2SO4 concentration increased from 75 ppm to 100 ppm: related specific charge being 3.1 (Ah/litre). Accordingly, a decrease was noticed in the mineralization rate constant when we increased Na2SO4 concentration from 75 ppm to 100 ppm. These are displayed in Table 2. TOC abatement of LAM was decreased with an increase in Na2SO4 concentration beyond 75 ppm because SO42− will rather compete than complement with water splitting for electrolytic charge transfer.
Mineralization of LAM on SS anode is by far more efficient than Ti/DSA. With SS anode, maximum mineralization of LAM was 98% at 1.38 mA/cm2 current density and 75 ppm Na2SO4 as supporting electrolyte with a specific charge of 3.1 Ah/litre. On the other hand, EAOP at Ti/DSA anode could achieve only about 45% LAM mineralization at 1.38 mA/cm2 current density and 50 ppm Na2SO4 concentration with a specific charge of 3.1 Ah/litre. The higher mineralization could be ascribed due to liberation of Fe2+ and Fe3+ ions by SS anode which worked as coagulating agents in the electro-coagulation which worked synergistically with electro-oxidation.
3.4. Energy Consumption and Mineralization Current Efficiency
3.4.1. Ti/DSA (Ta2O5-Ir2O5) anode
The Ti/DSA anode effect of the current density on energy consumption is displayed in Fig. 7a, by plotting against Specific charge (Ah/litre). EC (kWh/kgTOC) calculation was made according to eqn (12) [36].
In which,
I = applied current (A)
U = cell voltage (V)
t = time of reaction (h)
V = volume of the cell (L)
TOC0 = the initial concentration of TOC (mg/L)
TOCt = concentration of TOC at time t (mg/L)
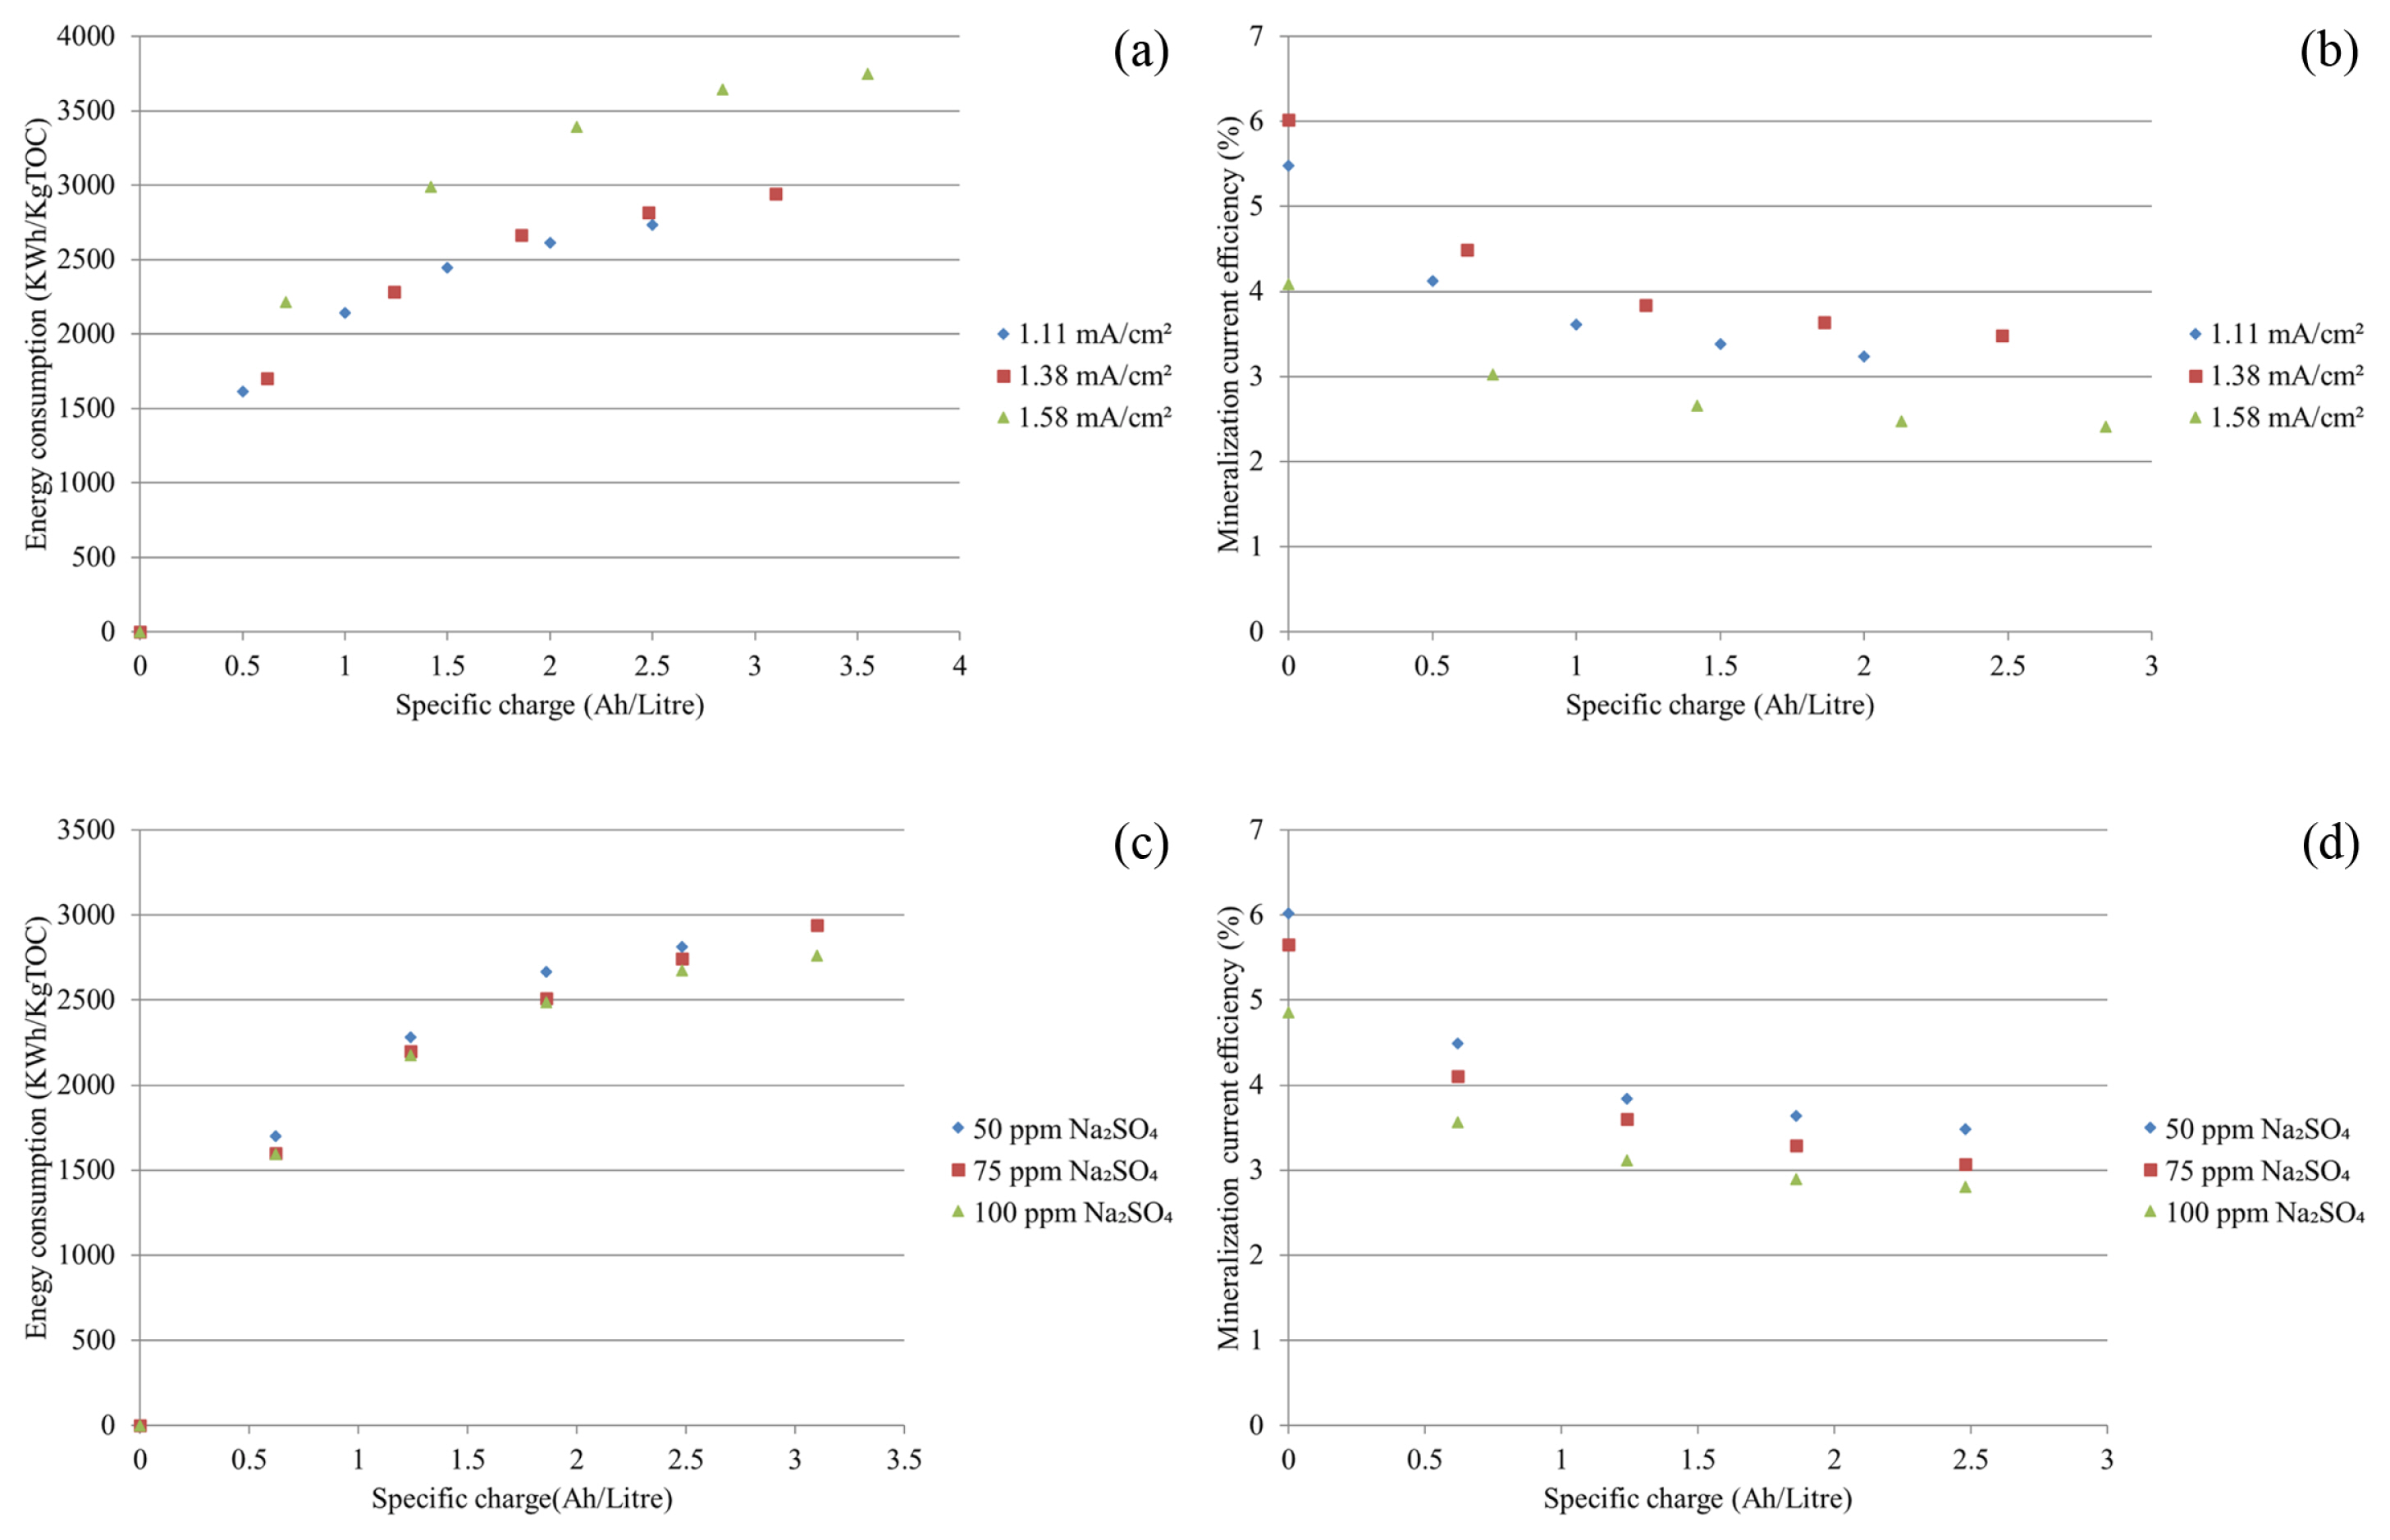
EC increased continuously over specific charges at every current density for the entire duration of EAOP. With the increase in current density from 1.11 mA/cm2 to 1.38 mA/cm2, the EC too increased from 2733.05 to 2942.71 kWh/kgTOC after accompanying specific charge values of 2.5 and 3.1 (Ah/litre), respectively. Likewise, with a further increase in current density from 1.38 mA/cm2 to 1.58 mA/cm2 the EC too increased from 2942.71 to 3748.80 kWh/kg TOC after accompanying specific charge values of 3.1 and 3.55 (Ah/litre), respectively. The higher current density required higher inter-electrode potential which accelerated the side reactions such as the formation of O2 by eqn (11), leading to a larger proportion of specific charge being consumed in these side reactions. It is reflected with the appearance of higher EC [39,40].
For the Ti/DSA anode effect of the current density on mineralization current efficiency (MCE) is displayed in Fig. 7b, by plotting against Specific charge (Ah/litre). The percentage MCE calculation was made according to eqn (13) [36]
In which
N = number of electrons consumed per molecule of LAM into CO2 and NO3− in eqn (14) is 46.
F = constant of Faraday (96487 C/mol)
V = volume of the solution (L)
4.32×107 = conversion factor [3600 (s/h) × 12000 mg of (C/mol)]
M = number of carbon atom of LAM (9 C atoms)
Here, ΔTOC is the measured TOC removal (mg/L) after a certain time t (h).
MCE decreased with a cumulative increase in a specific charge for Ti/DSA electrode. This is the result of decreasing concentration of LAM. At each current density, MCE decreased for a specific charge. With increasing current density from 1.11 mA/cm2 to 1.38 mA/cm2 the final MCE value slightly increased from 3.23% to 3.48% after accompanying specific charge values of 2.5 and MCE 3.1 (Ah/litre), respectively. This is due to the accelerated increase in TOC removal from 55.27% to 70.64% for the corresponding increase in current density. Howbeit, with a further increase in current density from 1.38 mA/cm2 to 1.58 mA/cm2 the final MCE value decreased from 3.48% to 2.41% after accompanying specific charge values of 3.1 and 3.55 (Ah/litre), respectively. The reason behind this is the rapid destruction of formed hydroxyl radicals, by side reactions that resulted in its lesser availability for the reaction with organics and consequent MCE decreased. These reactions can be expressed as [41]
The Ti/DSA anode effect of Na2SO4 concentration is displayed in Fig. 7c, by plotting EC against Specific charge (Ah/litre). EC increased steadily in relation to specific charge at every Na2SO4 concentration, for a total duration of EAOP. As we increased the Na2SO4 concentration from 50 to 75 ppm, the EC was decreased marginally from 2942.71 to 2940.36 kWh/kg TOC at an associated specific charge of 3.1 (Ah/Litre). Likewise, with further increase of Na2SO4 concentration from 75 to 100 ppm, the EC was further decreased from 2940.36 to 2762.78 kWh/kg TOC at an associated specific charge of 3.1 (Ah/Litre). To maintain a particular current density, the lower cell voltage is required at a higher Na2SO4 concentrations. This renders into reduced EC.
At different Na2SO4 concentrations, the variation of MCE over Specific charge (Ah/litre) for the Ti/DSA anode is displayed in Fig. 7d. With an increase in Na2SO4 concentration from 50 to 75 ppm the MCE was decreased from 3.48% to 3.07% after an associated specific charge of 3.1 (Ah/litre). Likewise, with a further increase in Na2SO4 concentration from 75 to 100 ppm, MCE was also decreased from 3.07% to 2.81% after an associated specific charge of 3.1 (Ah/litre). The generation of hydroxyl radical was restrained due to higher Na2SO4 concentration because of SO42− ions competitive tendency towards the transferred charge and the water-splitting reaction. This was the reason for the limited availability of this radical towards the reaction with organics [41] and the consequent decrease in MCE. In sum, it is worthy to record that increasing Na2SO4 concentration, suppress the mineralization rate and MCE both, but at the reduced EC. This can be of great significance for the plant economics.
3.4.2. SS anodes
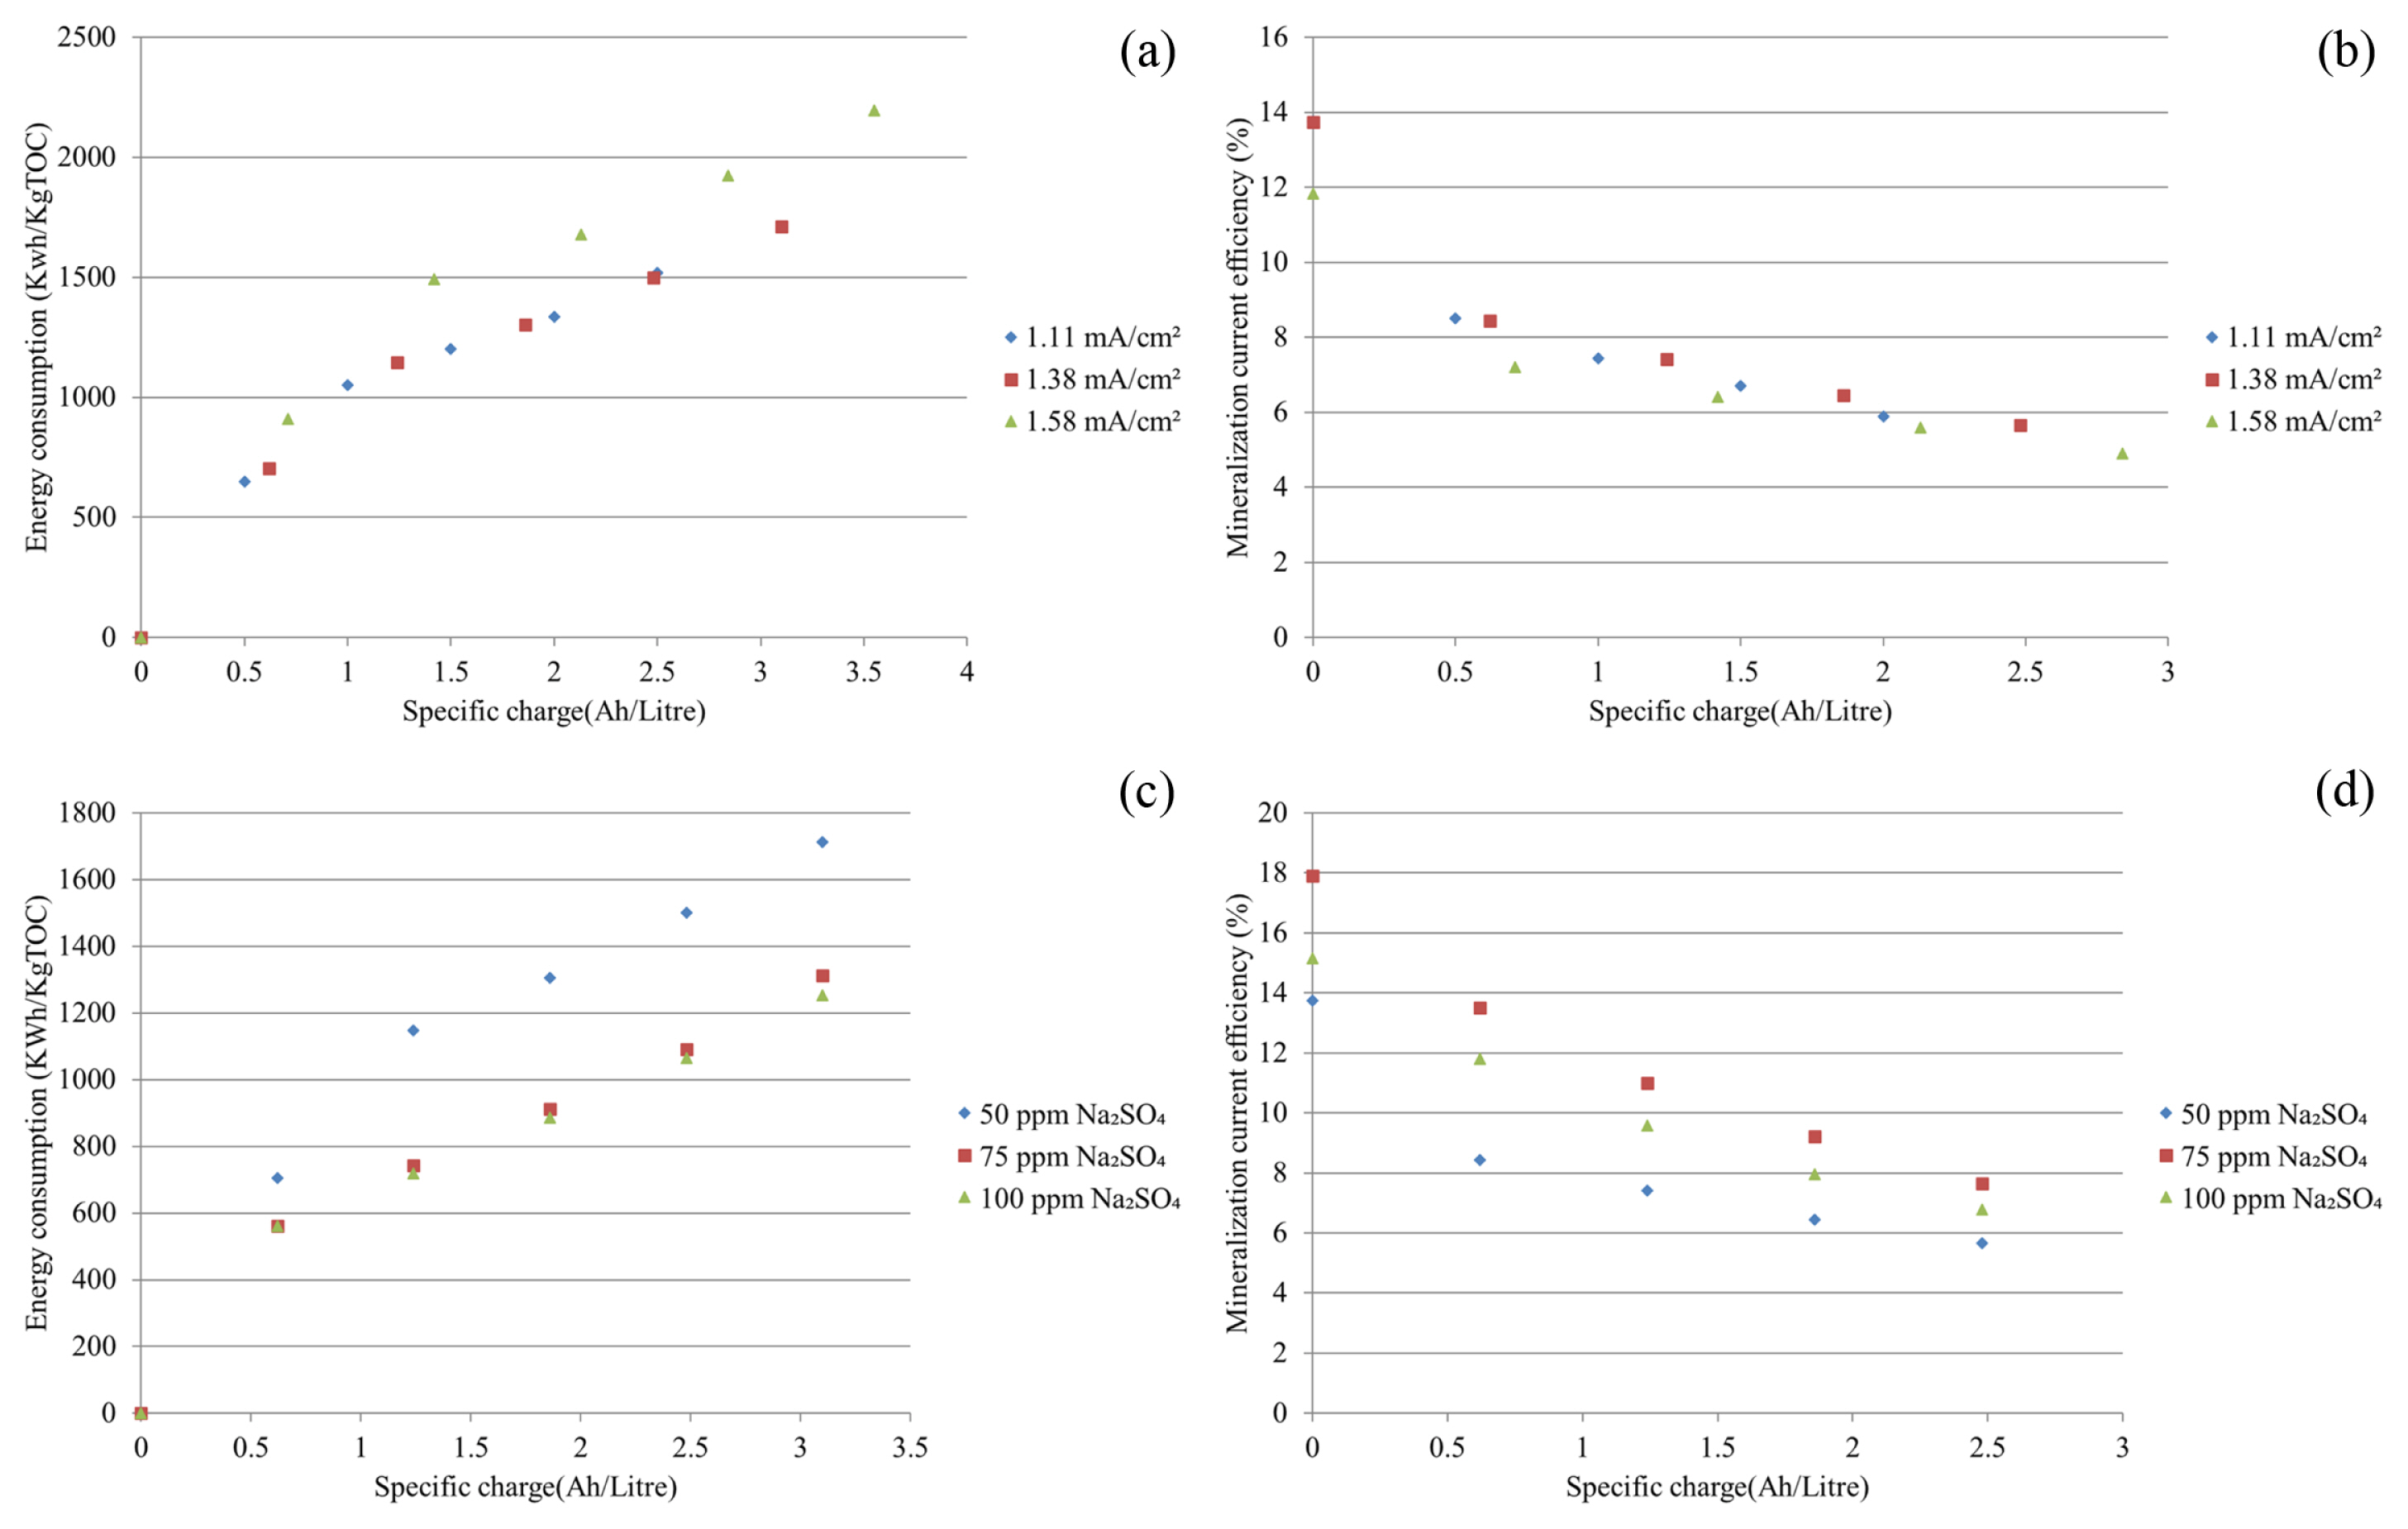
The SS anode effect of the current density is shown in Fig.8a, by plotting energy consumption (EC) against Specific charges (Ah/litre). EC increased steadily over specific charge at every current density for the entire duration of EAOP. With the increase in current density from 1.11 mA/cm2 to 1.38 mA/cm2, the EC too increased from 1518.20 to 1712.57 kWh/kgTOC after accompanying specific charge values of 2.5 and 3.1 (Ah/litre), respectively. Likewise, with a further increase in current density from 1.38 mA/cm2 to 1.58 mA/cm2 the EC too increased from 1712.57 to 2196.07 kWh/kg TOC after accompanying specific charge values of 3.1 and 3.55 (Ah/litre), respectively. Higher current density accelerated the side reactions like the formation of O2 by eqn (11), leading to a larger proportion of electrolyte charge being consumed in these side reactions. It is reflected with the appearance of higher EC [40,42].
For the SS anode effect of the current density on MCE is displayed in Fig.8b, MCE is decreased with a cumulative increase in the specific charge for SS electrode at every current density. This is the result of decreasing concentration of LAM and increasing recalcitrance of its intermediates products as well as accelerated side reactions [41,42]. With increasing current density from 1.11 mA/cm2 to 1.38 mA/cm2 the final MCE value decreased from 5.90% to 5.65% after accompanying specific charge values of 2.5 and 3.1 (Ah/litre), respectively. Likewise, with a further increase in current density from 1.38 mA/cm2 to 1.58 mA/cm2 the final MCE too decreased from 5.65% to 4.91% after accompanying specific charge values of 3.1 and 3.55 (Ah/litre), respectively.
The SS anode effect of Na2SO4 concentration is displayed in Fig.8c, by plotting EC against Specific charge (Ah/litre). EC increased steadily in relation to specific charges at every Na2SO4 concentration. As we increased the Na2SO4 concentration from 50 to 75 ppm, the EC was decreased from 1712.57 to 1312.17 kWh/kg TOC at an associated specific charge of 3.1 (Ah/Litre). Likewise, with a further increase of Na2SO4 concentration from 75 to 100 ppm, the EC was further decreased from 1312.17 to 1252.80 kWh/kg TOC at an associated specific charge of 3.1 (Ah/Litre). To maintain a particular current density, the lower cell voltage is required at higher Na2SO4 concentration due to higher solution conductivity. This renders into reduced EC.
At different Na2SO4 concentrations, the variation of MCE over Specific charge (Ah/litre) for the SS anode is displayed in Fig. 8d. With an increase in Na2SO4 concentration from 50 to 75 ppm the MCE was increased from 5.65% to 7.66% after the associated specific charge of 3.1 (Ah/litre). This is mainly due to an increase in solution conductivity and an accelerated increase in TOC removal from 61.18% to 72.75% for the corresponding increase in current density. Howbeit, with a further increase in Na2SO4 concentration from 75 to 100 ppm, MCE decreased from 7.66% to 6.78% after the associated specific charge of 3.1 (Ah/litre). The generation of hydroxyl radical was restrained due to higher Na2SO4 concentration because of SO42− ions competitive tendency towards the transferred charge and the water-splitting reaction. This was the reason for the limited availability of this radical towards the reaction with organics [41] and the consequent decrease in MCE.
If we compare the energetics of the two anodes (Fig. 7, and Fig. 8), we find that under comparable conditions, EC for SS anode is significantly less than that required for Ti/DSA. This, along with higher LAM degradation and mineralization on SS anode, makes this the anode of choice between the two-anode studied. This notion is also strengthened by a comparison of the MCE values for the two anodes. The highest MCE obtained on SS anode is 7.66% (1.38 mA/cm2 current density, 75 ppm Na2SO4, and 3.1 Ah/Litre of specific charge) which is 120% higher than the highest obtained on Ti/DSA (1.38 mA/cm2 current density, 50 ppm Na2SO4, and 3.1 Ah/Litre specific of charge).
4. Conclusions
The EAOP kinetics of degradation and mineralization of LAM relied on the type of anodes. Both Ti/DSA and SS anodes are capable of degrading and mineralizing LAM. Howbeit, LAM degradation was 75.42% on Ti/DSA anode was lower than the 98.92% degradation attained with SS anode. Similarly, mineralization (44.83%) was lower with Ti/DSA in comparison to mineralization with SS (98.53%). EAOP on SS anode comprising combined electro-oxidation and electro-coagulation was energetically more encouraged than EAOP on Ti/DSA anode comprising electro-oxidation alone that reflected in the EC of 1312.17 and 2942.71 kWh/kgTOC, respectively, for the two cases. SS anode was more effective than Ti/DSA for making use of the transferred electrolytic charge with regard to pollutant mineralization in an aqueous environment as illustrated by the related final MCE of 7.66% and 3.07%. Kinetics of degradation and mineralization followed pseudo-first order on both the anodes during EAOP. The addition of Na2SO4 being supporting electrolytes in moderate quantity could expedite degradation and mineralization, and lower EC.