1. Introduction
Solar energy is a promising source of renewable energy due to its abundance and potential to generate an infinite amount of energy. To make the most of this energy source, extensive research has been carried out to develop efficient photovoltaic (PV) cells that can convert solar energy into electrical energy. Currently, crystalline Si-based PV cells occupy almost 90% of the commercial PV cell market, as they provide high efficiency and stability at a reasonable cost [1]. However, large-scale electricity generation through PV cells is still not cost-competitive with cheap thermal power generation, hindering the global utilization of solar energy. In recognition of the need to reduce costs, the US Department of Energy has set a goal to lower the levelized cost of energy of utility-scale PV cells to $0.03/kWh by 2030 [2]. The manufacture of conventional crystalline Si-based PV cells involves three main processes: Si wafering, cell processing, and module conversion. Si wafering, which includes the production of solar-grade Si, crystal growth, and wafer sawing, accounts for 30ŌĆō40% of the overall manufacturing cost [3]. The high cost is mainly due to the considerable initial capital investment, energy consumption for the production of solar-grade Si, and substantial Si loss during wafer sawing.
Developing a low-cost process for producing solar-grade Si is crucial for addressing the cost issue associated with Si-based PV cell manufacturing. The formation of solar-grade Si films via electrodeposition is highly attractive in the PV cell industry. The successful electrodeposition of a solar-grade Si film can combine Si production and wafer sawing into a single step. This eliminates the need for wafer sawing, saving a considerable amount of Si that would otherwise be lost as fragments during the sawing process. Moreover, electrodeposition simplifies the fabrication of PV cells because the deposition substrate serves as a back-contact material. Numerous researchers have investigated the electrodeposition of Si films using naturally abundant Si compounds, such as K2SiF6 and SiO2. Cohen et al. electrodeposited a Si film from molten KF-LiF containing K2SiF6 [4]. Utilizing K2SiF6 as a Si source is advantageous for Si electrodeposition because K2SiF6 dissociates into ionic compounds in molten salts. This has led to extensive research on K2SiF6-molten fluoride systems [5ŌĆō7]. SiO2 is another source that is abundant on Earth. Nohira et al. were the first to report the direct electrochemical reduction of bulk SiO2 in molten CaCl2 [8]. They demonstrated that a non-conducting oxide can be electrochemically reduced at the three-phase interface where the insulator (SiO2), conductor (electrode), and electrolyte meet.
However, there are some limitations to the electrochemical reduction of bulk SiO2 [9,10]. Reduction always has to start at the surface where a three-phase interface is established, and then it spreads into the bulk. This makes it difficult to achieve a complete reduction of the entire SiO2 because it is challenging to form 3-phase interfaces inside the bulk SiO2 even though the deoxidized SiO2 exhibits a porous form due to oxygen extraction. The slow diffusion of the oxygen ions (O2ŌłÆ) extracted from SiO2 also makes the electrochemical reduction of SiO2 challenging. The continuous reduction of SiO2 results in the production of oxygen ions, which accumulate near the three-phase interface, hindering its further reduction [11,12].
Recently, there have been reports on electrodeposition of polycrystalline Si films in molten CaCl2 containing SiO2 nanoparticles [13,14]. The use of SiO2 nanoparticles as the Si source enables the direct formation of a compact and fully reduced Si films on the substrate. However, the formation of aggregates of SiO2 nanoparticles hinders their diffusion to the electrode, leading to low electrodeposition efficiency. To solve this problem, SiO2 was dissolved in molten CaCl2 in an ionic state by adding CaO, which reacts with SiO2 to form various silicate ions [15,16]. However, the addition of extra substances to the molten CaCl2 inevitably increases the amount of impurities, negatively affecting the purity of the electrodeposited Si. In this study, a pulse electrodeposition was used instead of CaO. In pulse electrodeposition, a potential or current is applied in periodic pulses of equal amplitude separated by a zero current. Each pulse consists of an on-time (Ton), which is the time when the current (or potential) is applied, and an off-time (Toff), which is the time when zero current is applied. One of the advantages of pulse electrodeposition is that electrochemical reactants are supplemented during Toff. During Toff, the electrochemical reactants migrate to the diffusion layer established during Ton, thereby alleviating the depletion of reactants near the electrode surface. Using this method, we successfully achieved a high current efficiency for Si electrodeposition and obtained a uniform Si film.
2. Experimental
A quartz tube electrochemical cell was used in this study, as shown in Fig. 1. The cell was composed of a quartz tube with one end sealed and a stainless-steel cap. Throughout the experiment, the interior of the cell was purged with Ar gas (99.9%) to prevent the inflow of oxygen and water. Electrochemical measurements were performed using a potentiostat (PGSTAT302N, Metrohm) in a 3-electrode configuration. The working (WE) and counter (CE) electrodes were a graphite plate (area: 2 cm2) and graphite rod with a diameter of 5 mm, respectively. The reference electrode (RE) was a quartz-sealed Ag/AgCl electrode (1 mol% AgCl in CaCl2) [17,18]. A mixture of SiO2 nanoparticles and CaCl2 was used as the electrolyte (molten salt) for the electrodeposition. To prepare the electrolyte, CaCl2┬Ę2H2O was dried overnight at 200┬░C under vacuum. Next, 50 g of dried CaCl2 was mixed with 0.5 g of SiO2 nanoparticles (10ŌĆō20 nm in size, Sigma-Aldrich). The mixture (SiO2/CaCl2) was loaded into the electrochemical cell and dried again at 400┬░C in a vacuum for 3 h to remove residual water. After the drying, the cell temperature was increased to 850┬░C with a ramp rate of 6┬░C minŌłÆ1. Once the temperature reached 850┬░C, preelectrolysis was performed by applying 6 mA cmŌłÆ2 of a cathodic current density for 30 h before electrodeposition. The Si film was prepared by direct current (DC) electrodeposition and pulsed-current electrodeposition, with a fixed cathodic current density of 6 mA cmŌłÆ2. In pulsed-current electrodeposition, the effect of Ton was studied while Toff was fixed at 5 min. A reference electrode was not used to avoid contamination by Ag ions during the electrodeposition of the Si films. All experiments were performed at 850┬░C.
The surface morphology and cross-section of the Si film were observed using a field-emission scanning electron microscope (FE-SEM; GeminiSEM 300, Zeiss). The crystalline structure of the Si films was examined using an X-ray diffractometer (XRD; D2 Phaser, Bruker).
3. Results and Discussion
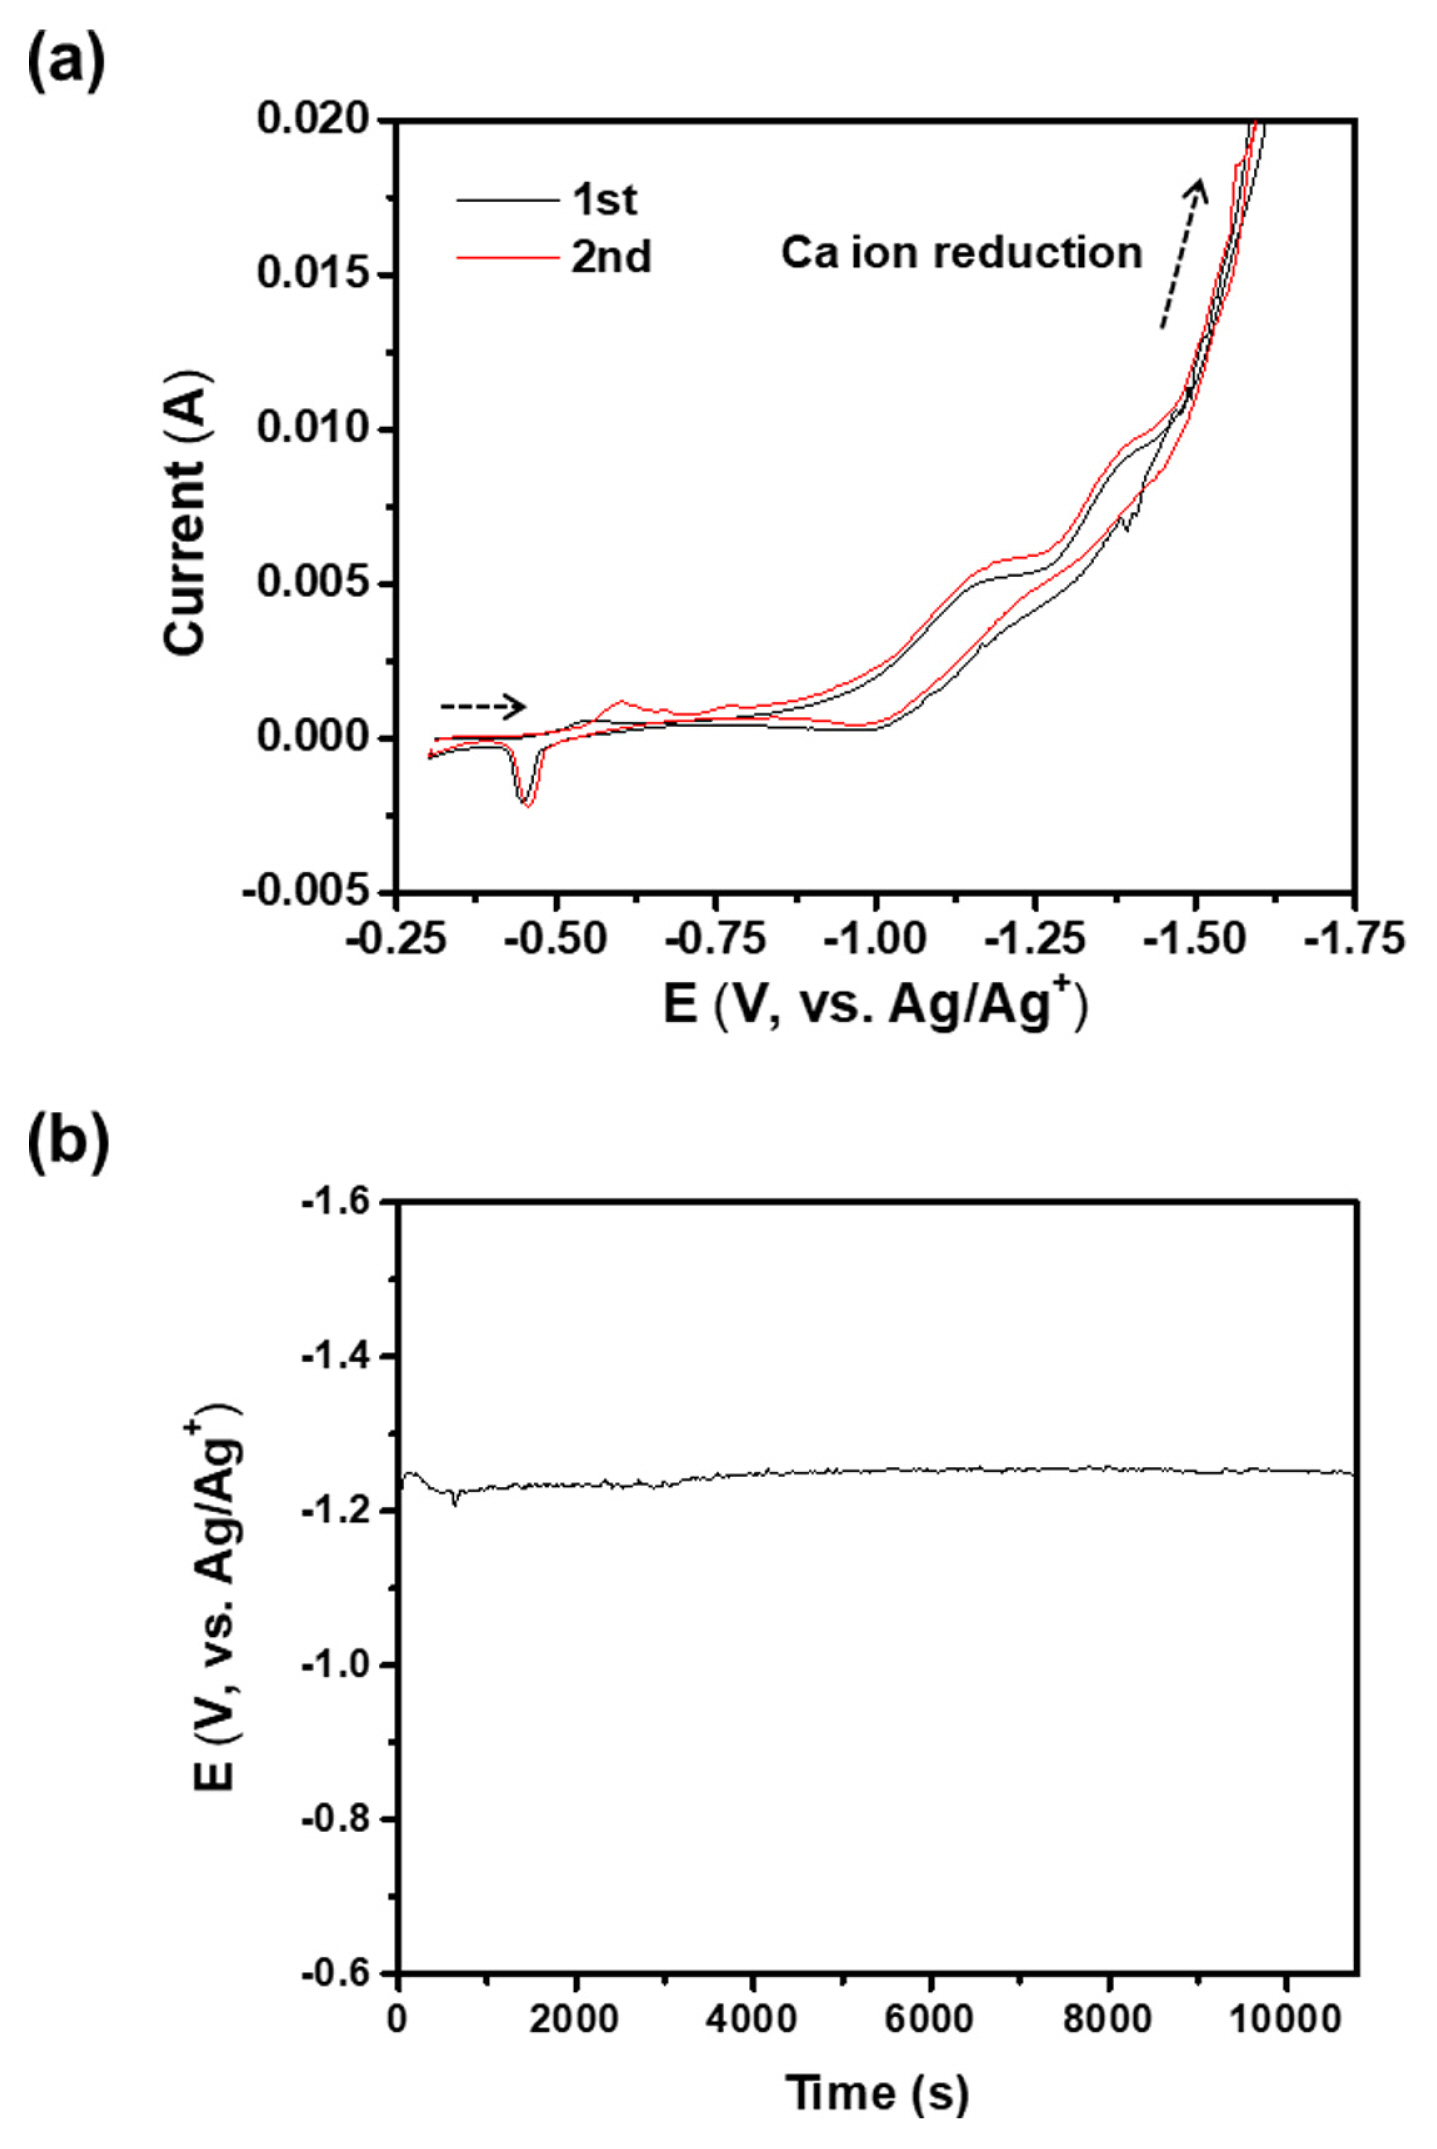
In Fig. 2(a), the potential-current curves of the graphite electrode in the SiO2/CaCl2 molten salt are presented. During the first scan, two cathodic peaks were observed at ŌłÆ1.18 and ŌłÆ1.40 V, which were associated with the reduction of SiO2 nanoparticles and the formation of CaSi alloy, respectively. The anodic peak at ŌłÆ0.45 V was attributed to the surface oxidation of the Si on the graphite electrode, which was deposited during the first cathodic scan. These findings suggest that the SiO2 nanoparticles were directly reduced to Si in the molten CaCl2. The small cathodic peak observed at ŌłÆ0.6 V in the second scan was due to the reduction of surface SiO2, which was formed during the first anodic scan. These results were consistent with a prior report [19]. Si was electrodeposited galvanostatically at a current density of 6 mA cmŌłÆ2, as show in Fig. 2(b). The potential-time curve during the deposition at 6 mA cmŌłÆ2 indicates that the applied potential was kept relatively stable between ŌłÆ1.20 and ŌłÆ1.25 V, where the SiO2 reduction was predominant. At current densities of less than 6 mA cmŌłÆ2 or more than 6 mA cmŌłÆ2, a uniform Si film was not obtained because of the low overpotential or the formation of the CaSi alloy, respectively.
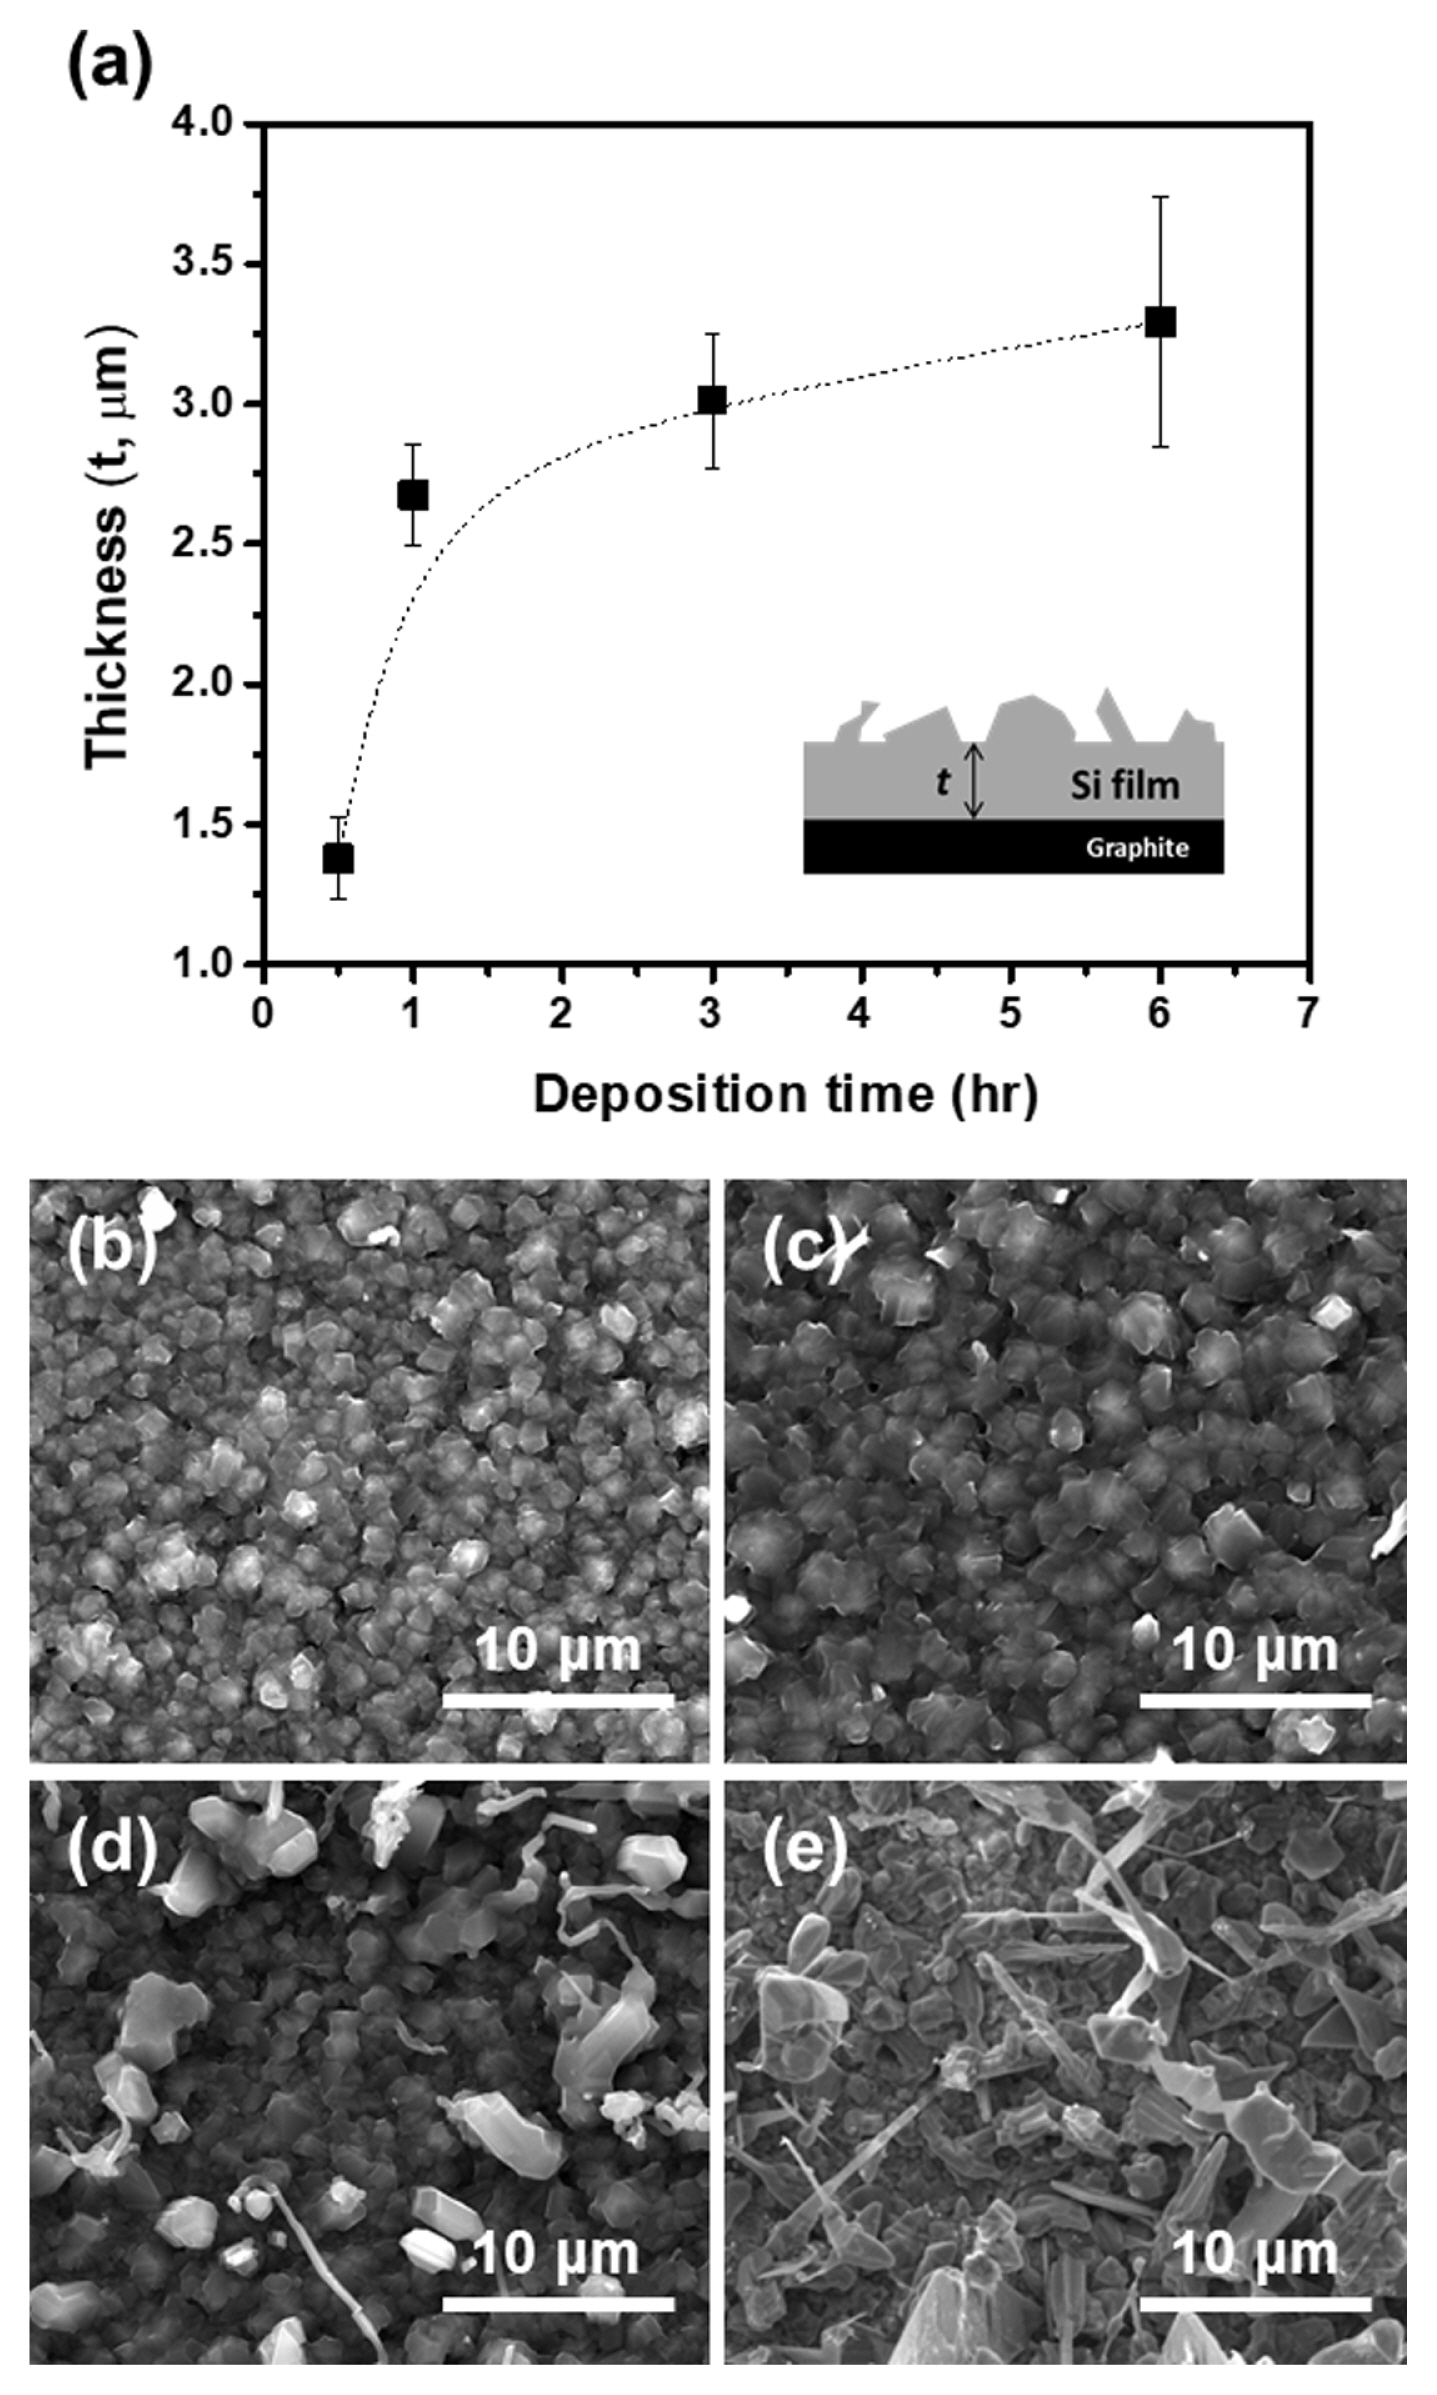
In Fig. 3, the thickness of the electrodeposited Si film is presented as a function of deposition time. The observed trend indicates that the thickness of the film increases with deposition time; however, the increment is not linear. Theoretical calculations predict that if the current efficiency were 100%, the Si film thickness would be 6.7 ╬╝m after an hour of deposition at 6 mA cmŌłÆ2. The measured film thickness was only 2.7 (┬▒0.2) ╬╝m, indicating that the current efficiency for the electrodeposition was 40%. After a prolonged deposition time of 6 h, the current efficiency decreased to 8%. The remarkably low current efficiency was primarily due to the poor mass transfer of the SiO2 nanoparticles. When the supplementation of SiO2 nanoparticles onto the electrode surface is not facile during deposition, the formation of a CaSi alloy and/or the reduction of Ca ions becomes dominant, leading to a decrease in current efficiency. This phenomenon promotes the non-uniform deposition of Si. As shown in Fig. 3(bŌĆōe), the surface of the Si film appeared relatively uniform until the deposition time of 1 h. However, irregular protrusions and dendrites began to form after 3 h of deposition, and after 6 h of deposition, the surface became considerably uneven due to their growth. Thus, the reduction in current efficiency not only limited the thickness of the electrodeposited Si film, but also had a negative effect on its surface quality. The formation of CaO near the electrode surface during deposition can also contribute to a decrease in current efficiency. The formation of CaO is unavoidable because oxygen ions formed during SiO2 reduction, reacting with Ca ions. The concentration of CaO near the electrode surface can be temporarily very high because of continuous SiO2 reduction, which impedes facile SiO2 reduction and leads to the formation of a CaSi alloy. However, the contribution of CaO to low current efficiency is believed to be minor because of the high solubility of CaO in molten CaCl2, which is 19 mol% at 900┬░C [8,20].
Fig. 4 illustrates the growth of the Si film depending on the deposition time in DC electrodeposition. In the early stages of deposition (1 min), small Si nuclei formed on the graphite substrate and grew as the deposition progressed, ultimately resulting in the formation of a continuous Si film after 1 h. However, with an extended deposition time, the mass transfer of the SiO2 nanoparticles gradually become inadequate, leading to the formation of Si protrusions and dendrites instead of a continuous film growth (6 h). This results in a rough and uneven surface with a slight increase in the film thickness. The pronounced surface irregularity and limited thickness in Si films inevitably have a detrimental impact on the fabrication of Si solar cells. Specifically, the irregular protrusions and dendrites on Si surface can be significant obstacles in the formation of pŌĆōn junctions and electrical contacts for Si solar cells [21,22].
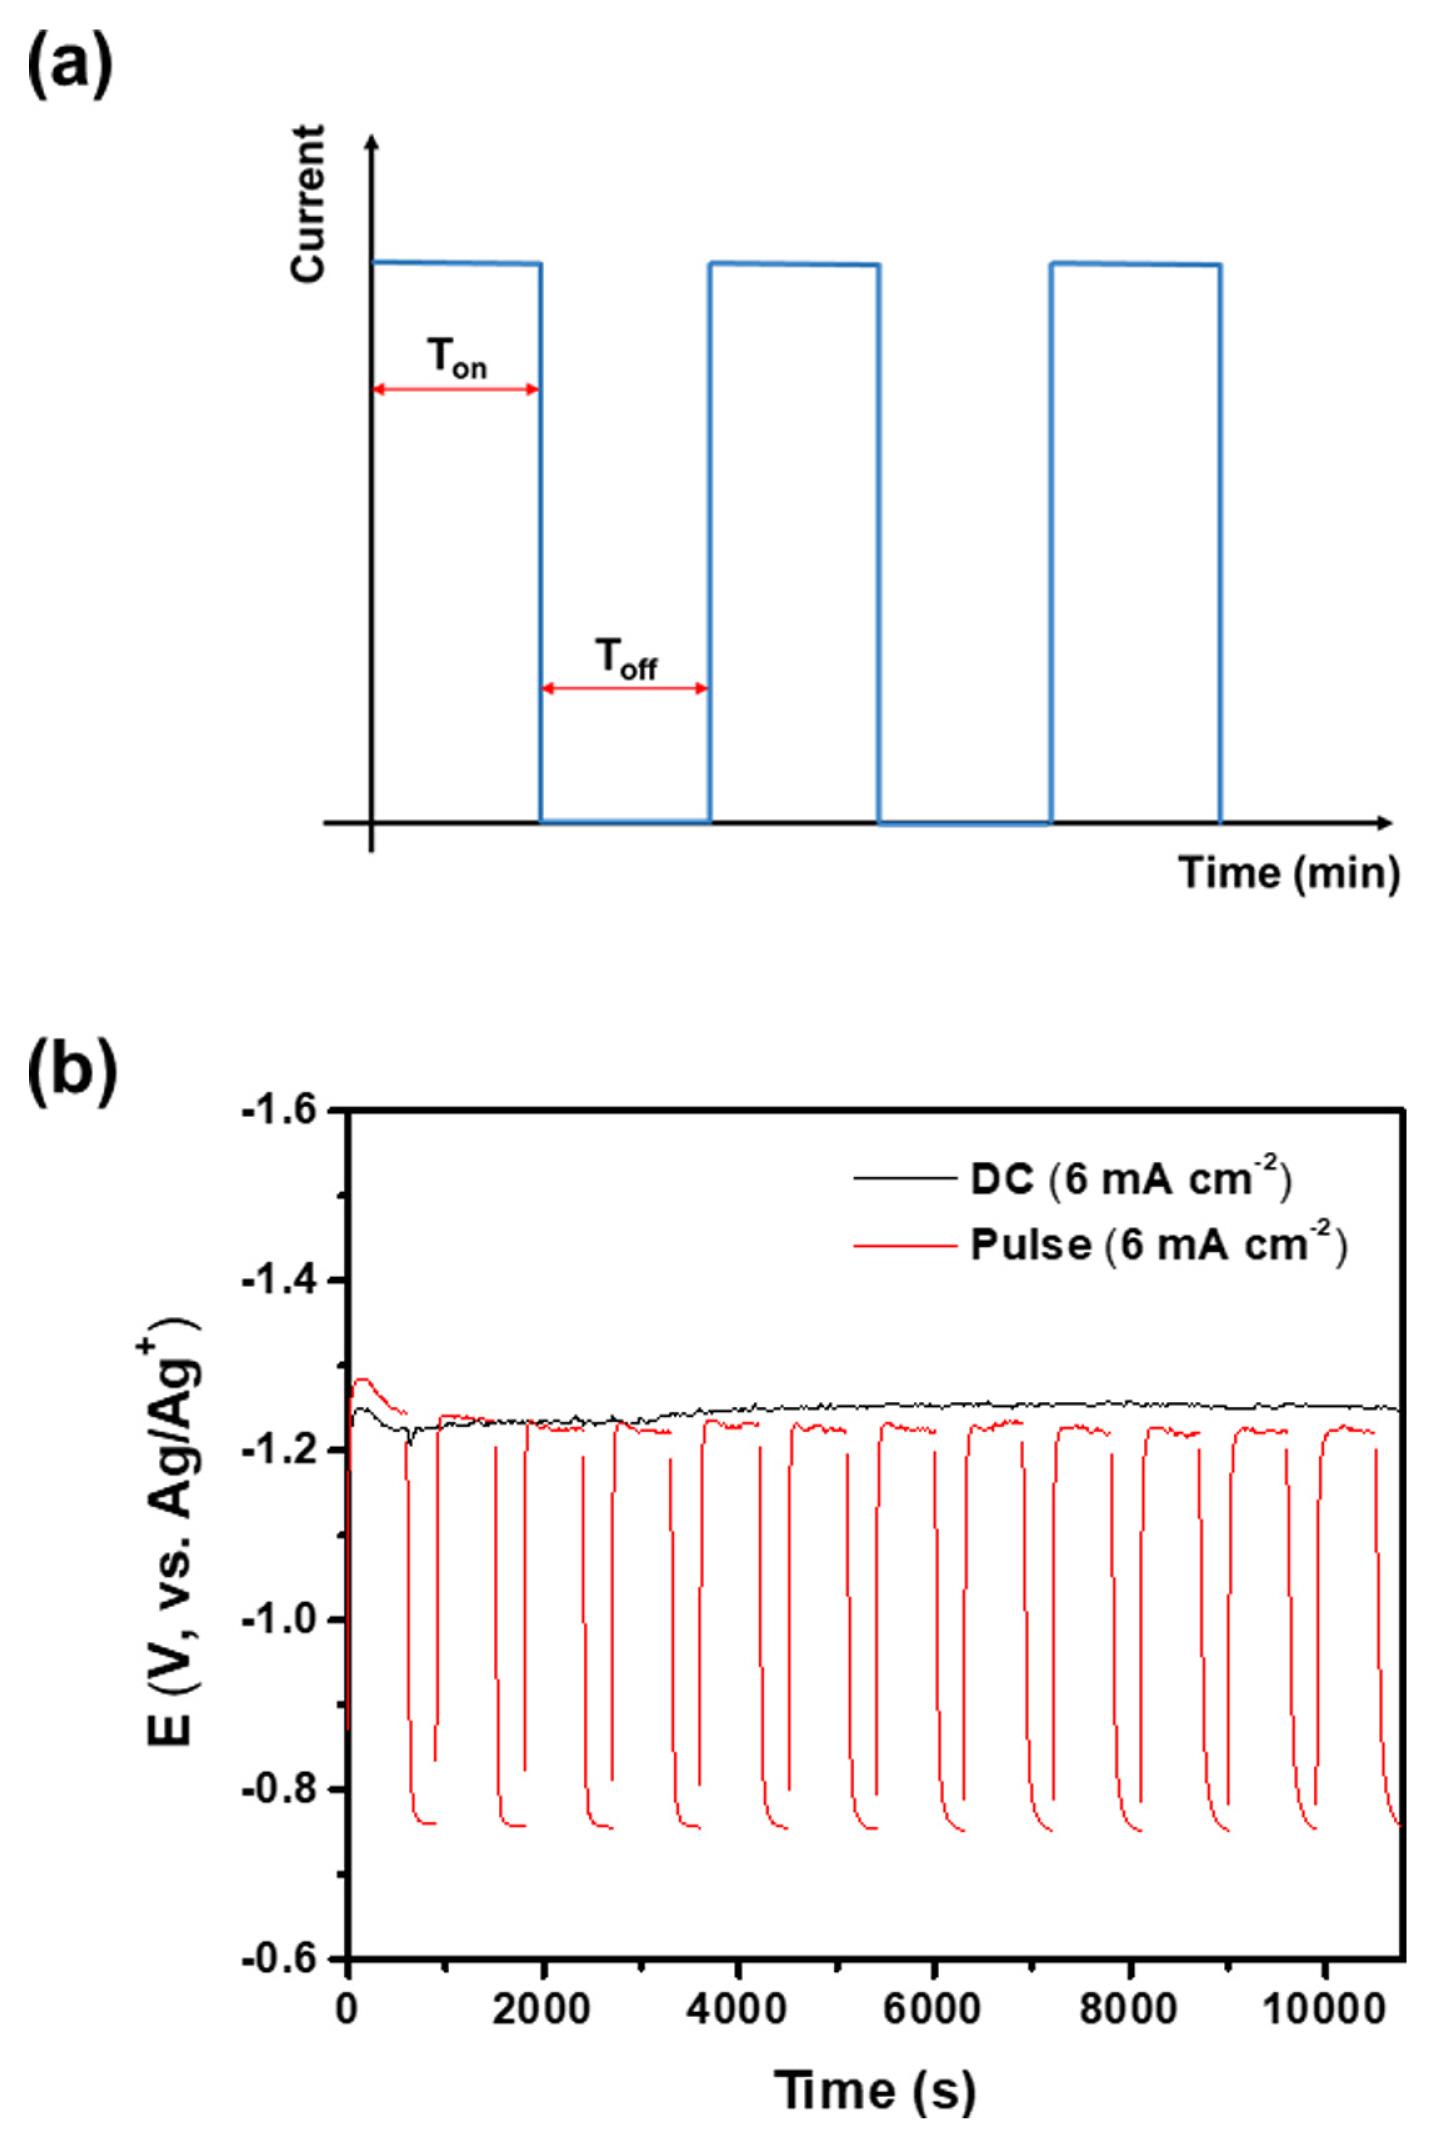
In order to address the issues associated with the poor mass transfer of SiO2 nanoparticles during electrodeposition, a pulsed-current electrodeposition technique was implemented. This method helps to prevent the depletion of reactants by supplying them during Toff. As shown in Fig. 5(a), a step cathodic current density of 6 mA cmŌłÆ2 was applied during Ton, and Toff was set to 5 min. The potential-time profile of the pulsed-current electrodeposition with 10 min of Ton is shown in Fig. 5(b). The electrode potential of pulsed-current deposition was slightly lower than that of DC deposition, suggesting an improvement in SiO2 supplementation during Toff. Notably, a relatively long Toff is necessary to stabilize the electrode potential after Ton, which is longer than the typical pulse electrodeposition duration [23,24]. This suggests that the process of stabilizing the electrode, including the supplementation of SiO2 nanoparticles by diffusion, was slow. Using the Stokes-Einstein relationship and assuming the viscosity of molten CaCl2 at 850┬░C was 1 cP [25], the diffusion coefficient of a single SiO2 nanoparticle (diameter: ~15 nm) in molten CaCl2 was calculated to be approximately 1├Ś10ŌłÆ10 m2 sŌłÆ1. This value is comparable to those of ordinary molecules (or ions) in water at room temperature (~10ŌłÆ10 to 10ŌłÆ9 m2 sŌłÆ1) [26]. This implies that the potential stabilization by SiO2 supplementation would have been rapid if the SiO2 nanoparticles were well dispersed in the molten salt. However, this was not the case in reality, indicating that the SiO2 nanoparticles may have formed agglomerates in the molten salt. For example, the diffusion coefficient of a 150-nm-sized SiO2 aggregate is approximately 1├Ś10ŌłÆ11 m2 sŌłÆ1, which is ten times lower than that of a single SiO2 nanoparticle. The reduction of Ca ions, which is a side reaction during deposition, may also retard the potential stabilization. The deposition of metallic Ca results in the electro-calciothermic reduction of SiO2 nanoparticles as follows [10]:
Fig. 6 shows the thicknesses of the Si films deposited by pulsed-current electrodeposition with varying Ton (Toff = 5 min). The total deposition charge was fixed at 64.8 C cmŌłÆ2, corresponding to an Si film of about 20.2 ╬╝m thickness at 100% current efficiency. The thickness of the Si film produced through DC deposition was 3.0 (┬▒0.2) ╬╝m and the current efficiency for the deposition was only 15%. No significant change in thickness was observed at Ton of 30 min compared to DC deposition. However, the thickness abruptly increased from 3.1 to 6.2 ╬╝m between Ton of 30 min and 10 min. It is assumed that the increase in film thickness at a Ton of 10 min was due to the sufficient supply of SiO2 nanoparticles during Toff, suppressing side reactions such as Ca-ion reduction. No further increase in thickness was observed at a Ton shorter than 10 min, indicating that a Toff of 5 min was adequate for a Ton of less than 10 min. The current efficiency for pulsed-current electrodeposition with a 10 min Ton was 31%, which is double the current efficiency for DC electrodeposition. For Ton longer than 10 min, the depletion of SiO2 nanoparticles near the electrode surface occurred severely, reducing the current efficiency for deposition. The effect of this reduced current efficiency on the surface morphology of the Si film can be observed in Fig. 6(b,c). When Ton was set to 30 min, the surface exhibited protrusions and dendrites that resembled those formed during DC electrodeposition. However, when Ton was 10 minutes or less, there was a significant reduction in the presence of protrusions and dendrites, resulting in a more uniform surface, as observed in Fig. 6(d,e).
Fig. 7 shows cross-sectional images of the Si films deposited using DC electrodeposition and pulsed-current electrodeposition (with a Ton of 10 min), while maintaining the same deposition charge of 64.8 C cmŌłÆ2. Upon introducing pulsed-current electrodeposition, the number of protrusions and dendrites on the Si film was noticeably reduced. Furthermore, it is evident that the implementation of pulsed-current electrodeposition increases the thickness of the Si film.
Fig. 8 displays the XRD pattern of the Si film prepared by pulsed-current electrodeposition with a Ton of 10 min. The most prominent diffraction peak is observed at 28.4┬░, corresponding to Si(111). Additionally, there are distinct peaks at 47.3┬░, 56.1┬░, 69.0┬░, and 76.0┬░, which are attributed to Si(220), Si(311), Si(400), and Si(331), respectively [27]. These results indicate that the Si film is polycrystalline.
4. Conclusions
A pulsed-current electrodeposition technique was implemented for Si electrodeposition in molten CaCl2 containing SiO2 nanoparticles. This method facilitated the supplementation of SiO2 nanoparticles to the electrode during Toff and reduced side reactions, such as CaSi alloy formation and Ca-ion reduction, resulting in a higher current efficiency for Si electrodeposition compared to DC deposition. Consequently, a more uniform and thicker Si film was obtained by pulsed-current electrodeposition than by DC deposition.