


1. Introduction
Mild steel has been used widely in petroleum field and industrial applications [1]. The mild steel resistance towards the attack of oilfield formation water with high salinity is very low so the use of the inhibitors can increase this resistance and decrease the pitting attack [2]. Due to the presence of chlorine salts in oilfield formation water, the corrosion is a serious and big issue in oil and gas production and transportation systems. In addition, it causes an important economic loss to oil and gas producers every year. The corrosion of the pipe wall frequently causes failure of oil and gas pipelines [3]. These breakdowns are followed by ecological disasters and environmental pollution [4]. Formation water is water trapped in underground formations that is found along with oil or gas. It is considered by-product or waste stream associated with oil and gas production. There are inorganic and organic compounds dissolved in formation water. It is considered as the most corrosive media in oilfield industry due to the presence of large quantities of corrosive hydrogen sulfide, carbon dioxide and other aggressive salts such as sulfate and chloride [5]. Formation water also has a small amount of oxygen that could enter into the sour brine system. One of the most effective measures for protecting metal surfaces against corrosion is the use of corrosion inhibitors [6,7].
Inhibitor molecules may adsorb on a corroding metal surface physically or chemically. In any case, a good protective film formed on the metal surface as a result of absorption which it isolates the metal surface from aggressive media [8-10]. Several papers investigated the chemical adsorption and formation a protective film which consists of Fe2+–Ligand complex and M(OH)2 causes by metal complexes [11-13]. The metals are formed coordinate-covalent bonds with compounds containing heteroatoms such as O, N, S which have free electron pairs [14]. Organic compounds having π-bonds also generally exhibit good inhibitive properties due to an interaction between metal surface and π-orbital [15]. Organic compounds containing an imine (CH=N) linkage have both the above features combined with their structure which make them effective potential corrosion inhibitors [16,17]. Schiff bases (imine) are important compounds and their metal complexes have been investigated in literature as corrosion inhibitors [18–20]. And also, thiosemicarbazide derivative compounds show a special affinity to inhibit corrosion of metals [21,22]. The mechanism of corrosion inhibition has been explained recently by quantum chemical studies, which have been proved to be a very powerful tool for studying the mechanism [23-25].
In experimental part of this study, it was performed polarization studies, the protective film analysis by fourier transform infrared (FTIR), UV-Visible spectral techniques and the analysis of surface morphology by scanning electron microscope (SEM) for studied inhibitors.
In theoretical part of this study, it was calculated frontier molecular orbitals (FMO) energies of the inhibitors, including highest occupied molecular orbital (HOMO) and lowest unoccupied molecular orbital (LUMO) and the other parameters such as electronegativity, chemical potential, global hardness, global softness, global electrophilicity index and fractions of electrons transferred because these parameters are closely linked to reactive ability of inhibitors. Density functional theory (DFT) was used to calculate these quantum chemical parameters which can assist in the interpretation of inhibition process. Finally, the obtained experimental and theoretical results were compared with the correlation study.
This is the first experimental and computational study on corrosion inhibition activity of the ligand salicylaldehyde thiosemicarbazone (STSC) and its metal complexes (Cu+2, Ni+2, Zn+2).
2. Experimental
2.1. Materials
2.1.1. Specimens
The mild steel specimens were tested at Tabbin Institute for Metallurgical studies, Cairo. The analysis results for the specimens are as follows (wt. %): C 0.17 %, Si 0.022 %, Mn 0.71 %, P 0.010 %, Cr 0.045 %, Ni 0.072 %, Al 0.0017 %, Cu 0.182 %, Sn 0.011 %, F 0.022 %, Mo 0.011 % and Fe 98.74 %. Firstly, the obvious electrodes in the test solution each of them was prepared by polishing with emery paper from 1000 to 1400 grade to obtain a smooth surface. Then, it was washed with distilled water and degreased with acetone about 5 minutes. And finally, it was washed again with distilled water then dried using filter papers.
2.1.2 Test solution
In this study, oilfield formation water (ayoun) supplied from General petroleum company (G.P.Co.) Eastern Desert fields (Egypt) was used as test solution. The chemical content of this test solution was analyzed and given in Table 1.

2.1.3 Preparation of ligand and metal complexes
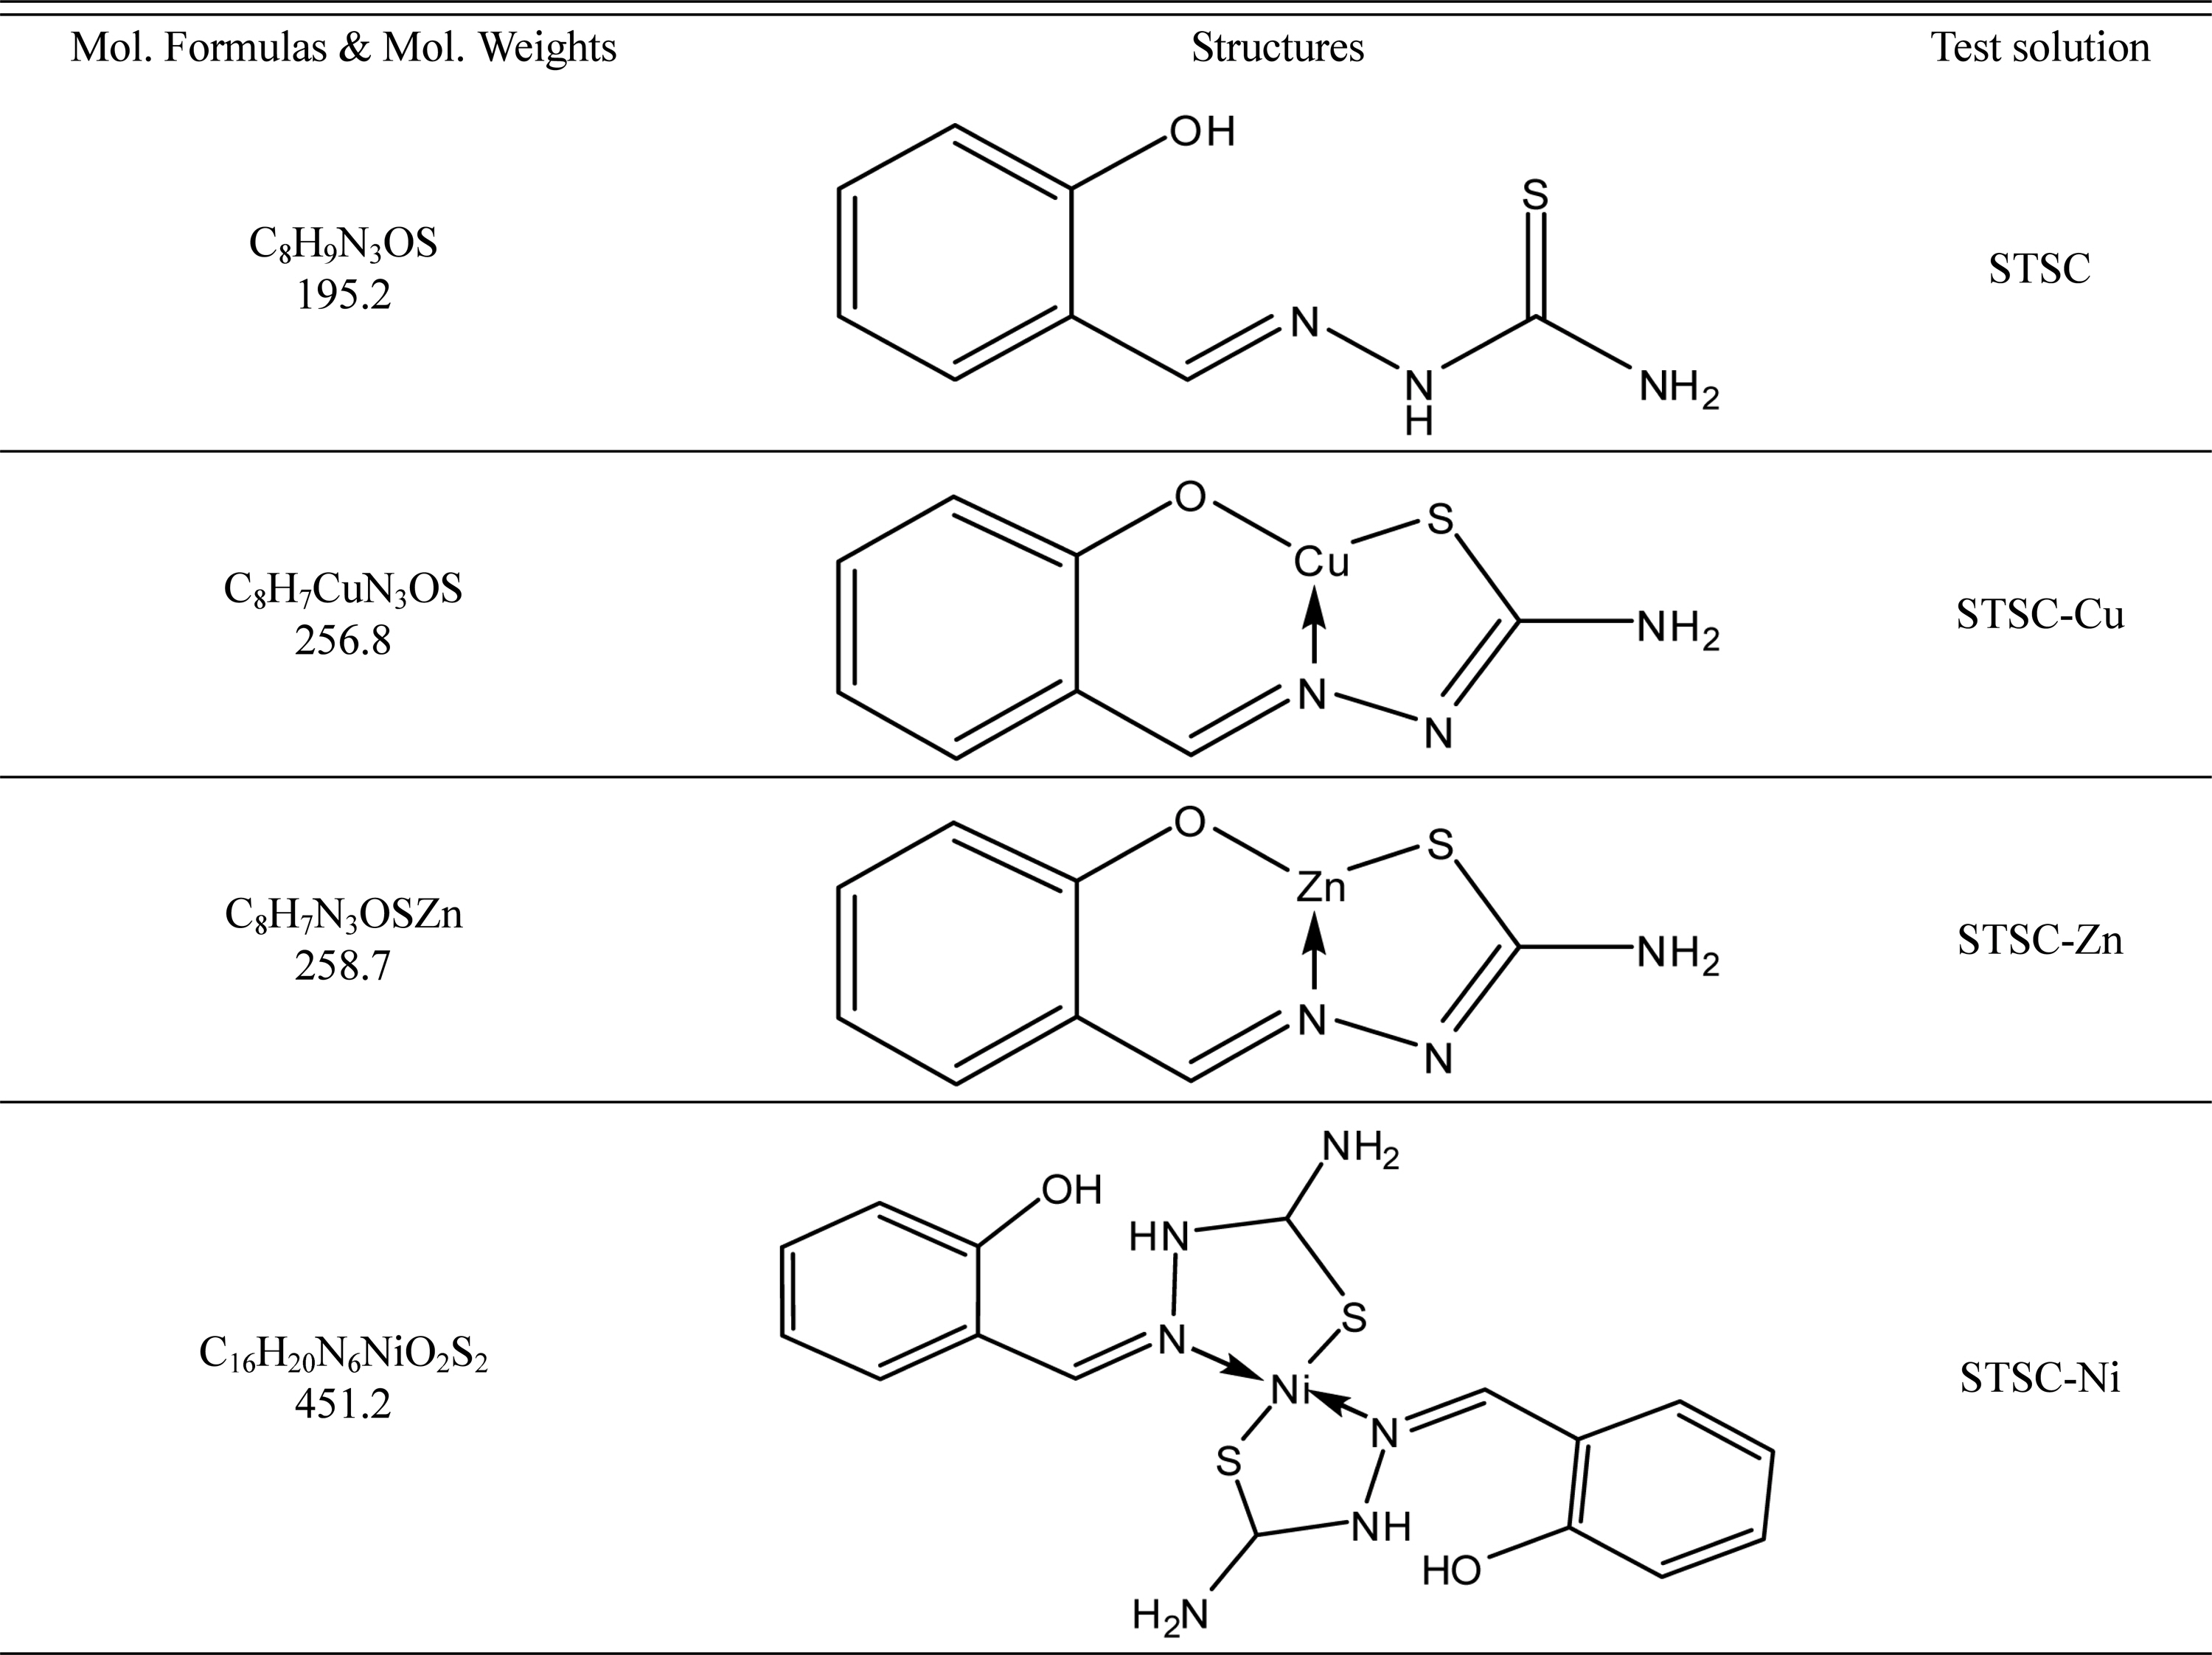
The ligand salicylaldehyde thiosemicarbazone (STSC) was prepared by mixing equimolecular amounts of thiosemicarbazide and salicylaldehyde in absolute ethanol and refluxing on a water bath for three hours. The condensation products were filtered off and then crystallized from ethanol, and dried under vacuum.
The metal complexes were prepared by mixing 1:2 molar ratios of metal ions salts (Cu+2, Ni+2, Zn+2) and the ligand STSC in absolute ethanol. The mixtures were refluxed on a water bath for two hours. Then the formed complexes were filtered off, washed several times with pure dry ethanol, and dried under vacuum [26]. The resulting ligand and its metal complexes were presented in Table 2.
2.2 Methods
2.2.1. Surface examination study
The mild steel specimens were immersed in various test solutions for a period of one day and next day the specimens were removed and dried. Then, the nature of the film formed on the surface of the specimens was analyzed by using FTIR, UV-Vis and Scanning Electron Microscope (SEM) techniques.
2.2.1.1. FTIR spectra
The characterization of the compounds carried out by FTIR spectroscopy. FTIR spectra were recorded in Jasco-FTIR-480 plus (Japan) (Al-Azhar University-Assiut Branch) which extended from 4000 to 400 cm-1, using the KBr disk technique.
2.2.1.2. UV-Vis. spectra
The absorption spectra of ethanol solution of the ligand STSC and its metal complexes were recorded on (Lambda 35) computerized spectrophotometer (Al-Azhar University - Assiut Branch) equipped with one cm matched quartz cells.
2.2.1.3. Surface examination techniques using Scanning Electron Microscope (SEM)
The SEM is a type of electron microscope that images the sample surface scanning it with a high-energy beam of in a raster scan pattern, and the SEM images should confirm the electrode surface. The specimens were washed before immersion in different solutions. This SEM analysis was carried out at the unit of electron microscopy of Assiut University.
2.2.2 Electrochemical measurements
Electrochemical corrosion cell containing three electrodes: mild steel as working electrode, saturated calomel electrode (SCE) as reference electrode and a platinum wire as counter electrode. The exposed area of working electrode to solutions was 1 cm2. The electrochemical studies were performed by using model 352/252 corrosion measurement system, which consists of EG & G potentiostat/galvanostat model 273A driven by software under computer control. In this study, open circuit potential (OCP) and potentiodynamic polarizations (linear and Tafel plots polarizations) were used as electrochemical techniques. Measurements of polarization curves were started after immersion working electrode (mild steel) in the used solutions for about 120 min, where the values of OCP (Ecorr) become stable. The linear polarization (LP) was measured from +20 mV up to - 20 mV vs. Ecorr at a scan rate was 0.166 mV/s. The Tafel polarization (TP) was measured from -250 mV to +250 mV vs. Ecorr at a scan rate was 0.3 mV/s.
2.2.3. Quantum chemical calculations
Theoretical calculations of the ligand STSC and its metal complexes were made using Gaussian 03W program package [27]. The molecular structures of studied inhibitors were optimized using the Universal Force Field (UFF) [28], which has been developed for characterization of inorganic complexes [29]. Frontier molecular orbital (HOMO-LUMO) energies of studied inhibitors were calculated by DFT (B3LYP) level with the 6-311G** basis set. The calculated quantum chemical parameters are the total energy (ETotal) and dipole moment (Dm), highest occupied molecular orbital energy (EHOMO), the lowest unoccupied molecular orbital energy (ELUMO), the energy gap between ELUMO and EHOMO (ΔE), ionization potential (I), electron affinity (A), electronegativity (χ), global hardness (η), softness (S), the global electrophilicity (ω) and the fraction of electrons transferred (ΔN).
3. Results and Discussion
3.1. Open Circuit Potential Measurements
The OCP describes the relation between potential (mV) and time (sec), the potentials of mild steel electrodes immersed in oilfield formation water were measured as a function of immersion time in the presence of different concentration of the selected Schiff base STSC (100, 200, 300 and 500 ppm) alone and with metals (Cu+2, Ni+2, Zn+2, 5 ppm). The obtained potential-time curves were shown in Fig. 1. All measurements were carried out until steady state potentials were established. The steady state represents an equilibrium state at which oxidation reactions equal reduction reactions. It is clear that the potential of the mild steel electrode immersed in formation water (blank curve) tends towards more negative potential first, giving rise to a short step. The addition of inhibitor molecules to the aggressive medium produces a slightly positive shift in steady state potential (Ess) owing to the formation layer of particles of inhibitor on the mild steel surface. The values of immersion potential (Eim) and Ess obtained for mild steel at different concentrations of STSC and its metal complexes were presented in Table 3. The table shows that the values of Eim were measured as -642 for STSC, -493 for STSC+Cu, -552 for STSC+Ni and - 444 mV for STSC+Zn. The Ess values for the inhibitor solutions were measured as -662, -555, -597 and - 609 mV, respectively.


3.2. Potentiodynamic polarization measurements
The potentiodynamic polarization curves for the mild steel immersed in oilfield formation water in the presence and absence of the inhibitors were given in Fig. 2 and the corrosion parameters obtained were presented in Table 4. When mild steel was immersed in oil field formation water, the corrosion potential was measured as -705.0 mV. When the STSC (500 ppm) was added to the above system alone and with metals (Cu+2, Ni+2, Zn+2 as 5 ppm), the corrosion potentials (Ecorr) were shifted to the noble side, i.e. to -670.0 for STSC, -555.7 for Cu+2, -611.4 for Ni+2, -578.4 mV for Zn+2. It indicates that a film is formed on anodic sites of the mild steel surface. It controls the anodic reaction of metal dissolution by forming Fe2+-STSC complex on the anodic sites of the mild steel surface. The Ecorr shift to anodic region, hence, ligand STSC and its metal complexes acted as anodic type inhibitor. The inhibition efficiency (IE %) values of mild steel in oilfield formation water solution containing different concentrations of inhibitors were calculated from the Tafel plots polarization by corrosion current density (Icorr). data as using equation (1):

Where Icorr(inh) and Icorr(uninh) are the corrosion current density with and without inhibitor presence, respectively. The change in IE % of the various complexes at different concentrations (100-500 ppm) was shown Table 4. From here, it is seen that variation of the IE % of STSC and its metal complexes (Cu+2, Ni+2, Zn+2) with their concentration in oilfield formation water are 66.9, 74.11, 73.42, and 68.95 % at 100 ppm, and 77.13, 88.77, 87.96 and 85.13 % at 500 ppm for STSC, STSC-Cu+2, STSC-Ni+2 and STSC-Zn+2, respectively. Thus, the IE % increase with increase test solution concentration as in Fig. 3 (a) and corrosion rate (CR) decrease with increase test solution concentration as in Fig. 3 (b). The values of IE % obtained from polarization measurements have the following order: STSC-Cu+2>STSC-Ni+2>STSC-Zn+2>STSC. This indicates that the metal ion plays an important role on the inhibition efficiencies of the metal complexes. The polarization resistance (RP) value increases from 82.55 ohm to 203.0 ohm for ligand STSC and 349.0 333.0, 287.0 ohm for metal complexes (Cu+2, Ni+2, Zn+2), respectively; the Icorr decreases from 506.0 μA cm-2 to 115.7 for STSC, 56.8 for Cu+2, 60.9 for Ni+2, 75.2 μA cm-2 for Zn+2.
Fig. 2.
Tafel polarization curves for mild steel corrosion in oilfield formation water (Ayoun) with various concentrations (100, 200, 300, 500 ppm for STSC and 5 ppm for metal ions) of (a) STSC, (b) STSC + Cu+2, (c) STSC + Ni+2, (d) STSC + Zn+2


3.3. Adsorption isotherm
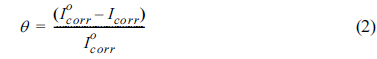
Basic information on the interaction between an inhibitor and mild steel surface can be provided by the use of adsorption isotherms [30]. To obtain the adsorption isotherm, the degree of surface coverage, θ, for different concentrations of the inhibitor in oil-field formation water solutions is evaluated using the following equation (2) [31]:
The values of θ were given in Table 5. According to the Langmuir isotherm, the θ value is related to inhibitor concentration (C) by the following equation (3) [31]:
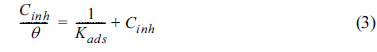
where Kads is the equilibrium constant of the inhibitor adsorption process. The Kads can be obtained from the intercept lines on the Cinh/θ-axis. Fig. 4 shows that the plot of Cinh/θ versus Cinh yields a straight line with a correlation coefficient more than 0.99. This indicates that the adsorption of inhibitors studies in oilfield formation water is fitted with Langmuir adsorption isotherm. The linear correlation coefficients at 25°C were found as 0.999, 0.997, 0.996 and 0.996, are almost equal to 1, for STSC and STSC-Cu+2, STSC-Ni+2, STSC-Zn+2, respectively. The slopes values at 25 °C were found to be 1.23 for STSC, 1.05 for STSC-Cu+2, 1.06 for STSC-Ni+2 and 1.09 for STSC-Zn+2, are close to 1, which confirms the assumption that the adsorption of the STSC and its metal complexes on the steel surface obeys Langmuir adsorption isotherm. The values of the standard adsorption free energy (ΔG°ads) and log Kads calculated by Langmuir adsorption isotherm were presented presented in Table 5. The large and negative values of ΔG°ads show the spontaneous adsorption of inhibitors, STSC and STSC-Cu+2, STSC-Ni+2, STSC-Zn+2 on steel surface and are accompanied by a highly efficient adsorption. It is well known that the ΔG°ads is related to the equilibrium constant of adsorption (Kads), and the ΔG°ads can be obtained using the following equation (4) [32]:
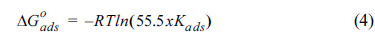
where R is the gas constant (8.314 J K-1 mol-1), and T (K) is the absolute temperature. The constant value of 55.5 is the concentration of water in solution in mol/L. The ΔG°ads values illustrated that the adsorption of STSC and STSC-Cu+2, STSC-Ni+2, STSC-Zn+2 on surface of the mild steel is not a pure one (i.e. physisorption and chemisorption).
Table 5.
Values of Langmiur adsorption parameters at exposed mild steel at different concentration of STSC and its metal complexes in oilfield formation water.
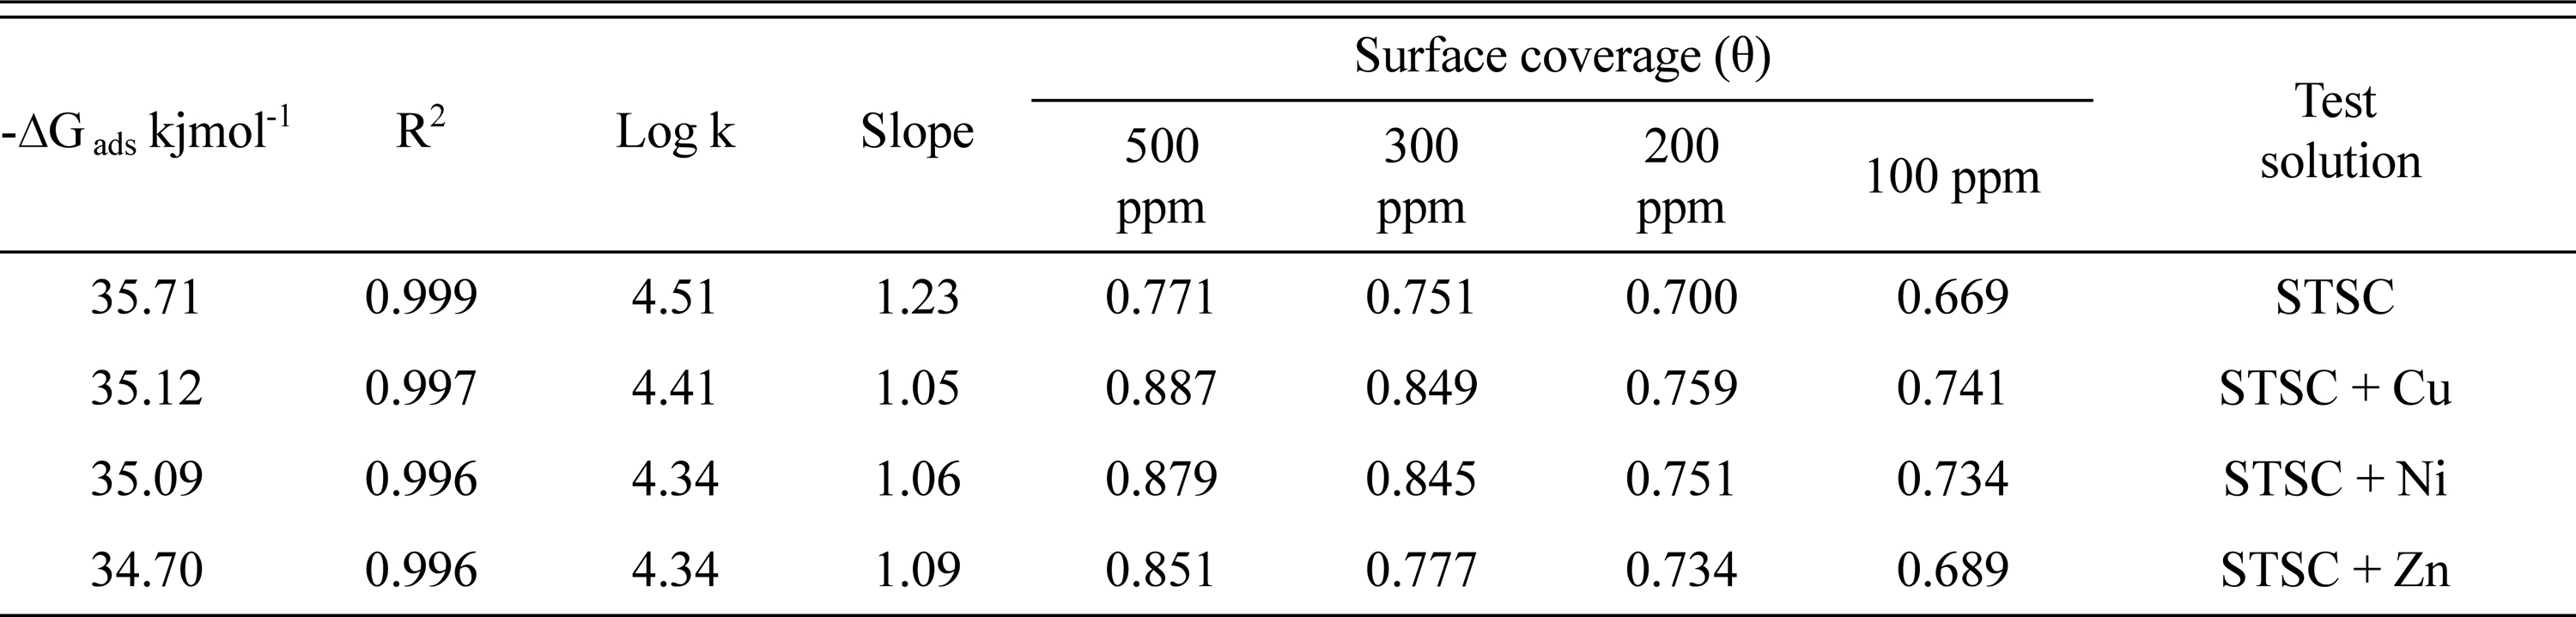
Fig. 4.
The relationship between Cinh/θ and Cinh for STSC and its metal complexes on the surface of mild steel in oilfield formation water.

A negative value of ΔG°ads up tu -20 kJ mol−1 are associated with electrostatic interaction exists between the inhibitor molecule and the charged metal surface (physisorption).
The ΔG°ads values more negative than -40 kJ mol-1 that a charge sharing or transferring from organic molecules to the metal surface occurs to form a coordinate type of bond (chemisorption) [33]. In our present study, values of the ΔG°ads obtained for the STSC, STSC-Cu+2, STSC-Ni+2 and STSC-Zn+2 in oilfield formation water solution are -35.71, -35.12, -35.09 and -34.70 kJ mol-1, respectively. It is seen that these values are between -40 and -20 kJ mol-1. Thus this shows that the adsorption is neither a typical physisorption nor a typical chemisorption but it is a complex mixed type. The values of Kads confirmed that STSC and its metal complexes adsorbed on the surface of the mild steel in a strong way and hence imply better inhibition.
3.4. Examination analysis of metal surface
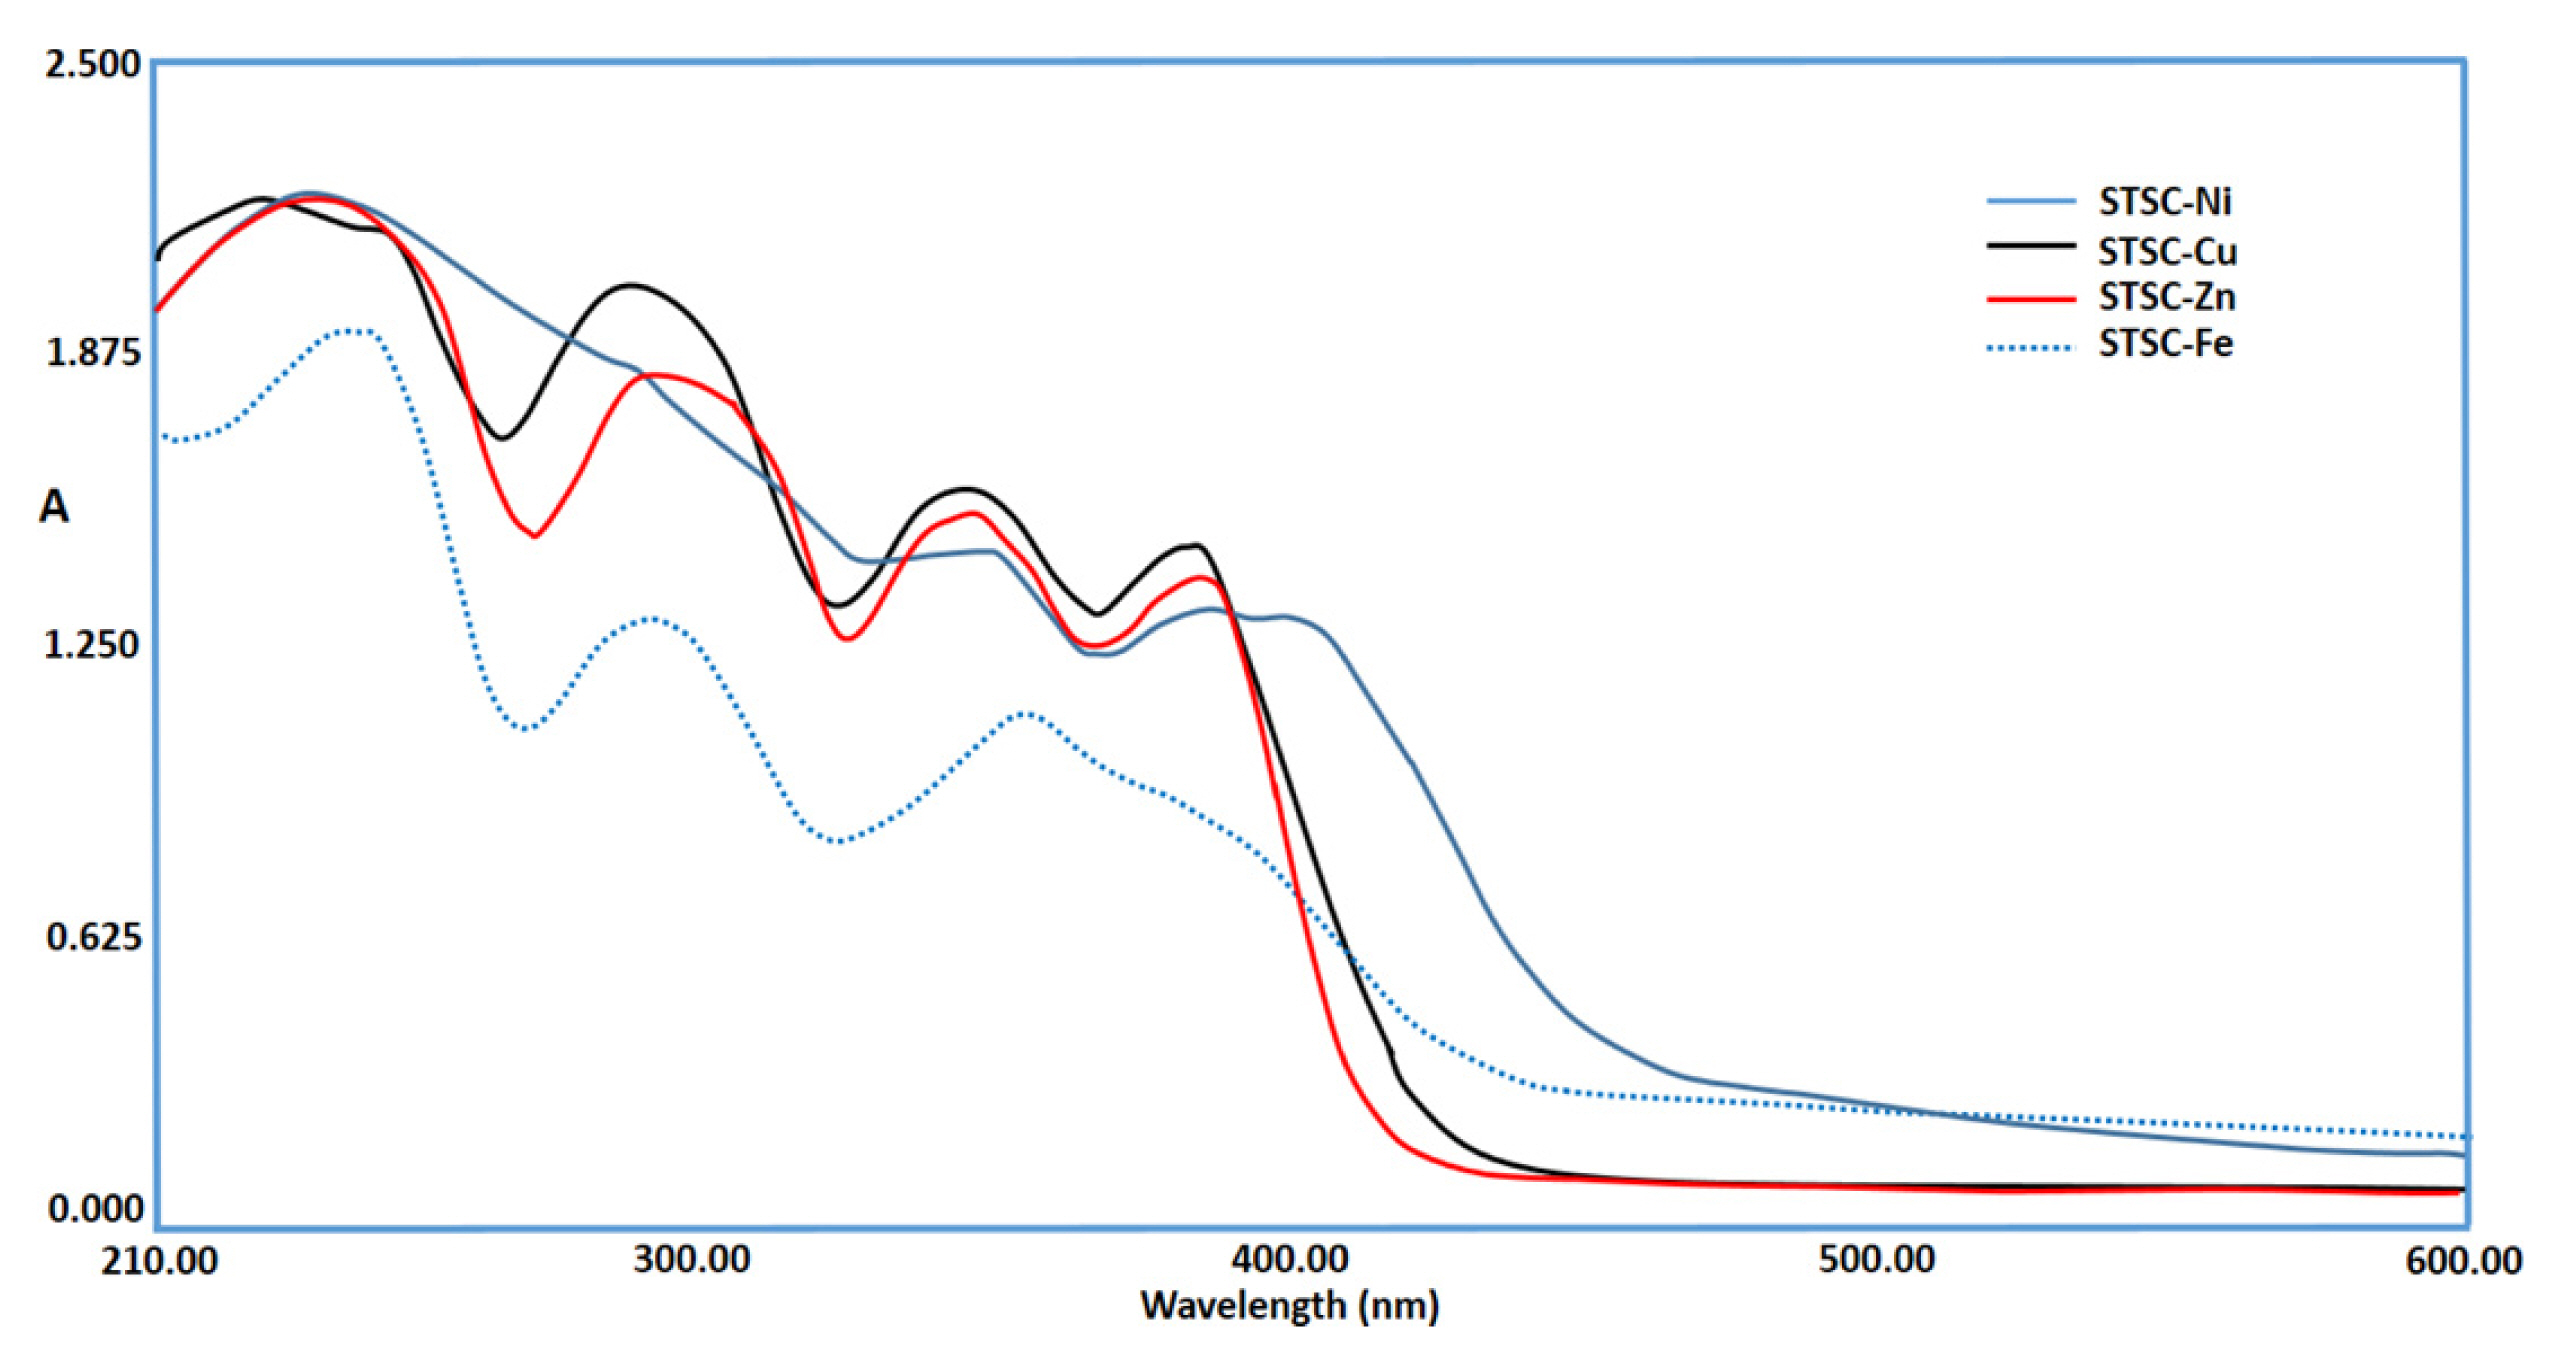
3.4.1. Analysis of the UV-Visible spectra
The UV-Visible absorption spectra of aqueous solutions containing STSC-Cu+2, STSC-Ni+2 and STSC-Zn+2 complexes were shown in Fig. 5. The peaks were appeared at 377, 346, 289 and 235 nm for STSC-Cu+2, 405, 390, 352 and 237 nm for STSC-Ni+2 and 387, 347, 295 and 237 nm for STSC-Zn+2. When mild steel surface was immersed to the solution, the wavelength of that solution was observed at about 354 nm as shown in Fig. 5. This peak was due to formation of STSC-Fe+2 complex in solution [34,35]. The other peaks for STSC-Fe+2 complex were observed at about 298 and 240 nm.
3.4.2. Analysis of the FTIR spectra
To analyze the protective film formed on the mild steel surface, the FTIR spectra have been used [36–38]. The FTIR spectra and data for ligand STSC and its metal complexes (Cu, Ni, Zn) were shown in Fig. 6(a-d) and presented in Table 6. The OH stretching frequency appears at 3443 cm-1 and 3450 cm-1 for STSC and STSC-Ni+2 while it disappeared in STSC-Zn+2 and STSC-Cu+2. So it can said that phenolic OH, C=N and C=S were coordinated to Zn and Cu to form STSC-Zn and STSC-Cu complex while C=N and C=S were coordinated to Ni to form STSC-Ni. A film was formed on the surface after the metal was immersed in the oilfield formation water containing 500 ppm of ligand STSC and 5 ppm of metal ions. The FTIR spectrum of surface film was given in Fig. 6e. This shows that the OH stretching frequency has shifted to 3441 cm-1. It is inferred that the C=N and C=S have coordinated with Fe2+, resulting in the formation of Fe2+-STSC complex, formed on the anodic sites of the mild steel surface. These results confirm the presence of M(OH)2 deposited on the cathodic sites of the mild steel surface [39]. Hence, FTIR spectral study leads to the conclusion that the protective film consists of Fe2+-STSC complex and M(OH)2.


3.4.3. SEM study of mild steel surface
The SEM analysis provides a pictorial representation of a surface. That helps to understand the nature of the surface film in the absence and presence of the inhibitors and the extent of corrosion of the mild steel. The SEM images of the mild steel specimen immersed in oilfield formation water for 1 day in the absence and presence of the inhibitor system were given in Fig. 7(a-c).
The SEM micrographs were shown in Fig. 7a for the mild steel surface polished, in Fig. 7b for the mild steel surface immersed in oilfield formation water in the absence of the inhibitor (blank) and in Fig. 7c for mild steel surface in the presence of the inhibitor. Fig. 7b shows the absence of any corrosion products (or) inhibitor complex formed on the mild steel surface. Fig. 7c shows that the corrosion rate is suppressed in the presence of the inhibitor (STSC (500 ppm) + Cu2+ (5 ppm)), as can be seen from the decrease of corroded areas. The surface of the mild steel is almost free from corrosion because of the formation of an insoluble complex on its surface.
Fig. 7.
SEM analysis of: (a) polished mild steel, (b) mild steel immersed in oilfield formation water (Blank) and (c) mild steel immersed in oilfield formation water + 500 ppm of STSC + 5 ppm of Cu2+.

Consequently, it is understood that the surface of metal was covered by a thin layer of inhibitor (STSC and Cu2+) which adequately controls the dissolution of the mild steel.
3.5. Corrosion inhibition mechanism
The results of our study show that the formulation consisting of 500 ppm STSC and 5 ppm of M2+ (Ni+2, Cu+2, Zn+2) has 87.95, 88.77 and 85.13 % IE, respectively in controlling corrosion of mild steel in oilfield formation water. It has been found that there is a synergistic effect between M2+ (Zn+2, Cu+2, Ni+2) and ligand STSC. Polarization study showed that this formulation functions as an anodic inhibitor. It is seen from the FTIR spectral analysis that the protective film consists of Fe2+-STSC complex and M(OH)2. As a result, the following mechanism of corrosion inhibition has been proposed to explain these facts [40].
1. When the solution containing oilfield formation water, 5 ppm of M2+ and 500 ppm of STSC are prepared, the formulation of M2+-STSC complex forms in solution medium.
2. When the mild steel is immersed in this solution, the M2+-STSC complex diffuses from the bulk of the solution towards the mild steel surface.
3. On the surface, M2+-STSC complex is converted into a Fe2+-STSC complex on the anodic sites, which is more stable than M2+-STSC complex [41] and during this conversion, the M2+ is released.
4. The released M2+ combines with OH- to form M(OH)2 on the cathodic sites.
5. Hence the protective film consists of Fe2+-STSC complex and M(OH)2.
6. The SEM micrographs images confirm the formation of a protective layer on the mild steel surface.
3.6. Quantum Chemical calculation
The calculated chemical parameters such as total energy (ETotal) and dipole moment (Dm), frontier molecular orbital energies (EHOMO and ELUMO), electron affinity (A), ionization potential (P), electronegativity (χ), chemical potential (μ), global hardness (η), global softness (S), global electrophilicity index (ω) and fractions of electrons transferred (ΔN) [42,43] were listed in Table 7.
Table 7.
Calculated quantum chemical parameters and experimental IE (%) for ligand (STSC) and its metal complex using DFT/ B3LYP/ 6-311G** basis set method.

In this study, the quantum chemical parameters were calculated using the following equations:


The EHOMO and ELUMO energies of the ligand STCS and its complexes were calculated to evaluate the global reactivity descriptors as electronegativity, chemical hardness, chemical softness, electrochemical potential and electrophilicity. The calculation of molecular orbital coefficients indicates that the possible coordination sites of the ligand are -N-N- and C=S group that binds the metal ion as in Fig. 8. The values of EHOMO and ELUMO were found negative that indicate the ligand and its complexes were stable [44,45]. The energy gap (ΔE) between EHOMO and ELUMO is an important parameter to determine the chemical reactivity and chemical stability of a molecule [46]. The ΔE explains the charge transfer interaction within the molecule. Lower value of ΔE will render a good inhibition activity, since the energy needed to remove an electron from the HOMO will be low.
Fig. 8.
The HOMO and LUMO images of the investigated ligand STSC and its metal complexes using DFT/ B3LYP/ 6-311G ** basis set method.

It illustrates that the order of decreasing the ΔE, 1.187<2.157<4.178 eV for STSC-Cu+2, STSC-Ni+2, STSC-Zn+2, respectively with the molecule increases leading to increase in the IE % (88.77, 87.96 and 85.13). The data show that the ω values of the complexes are more than the free ligand STCS, so the complexes are more reactive than the ligand. According to minimum electrophilicity principle, lesser is the electrophilicity of a compound, more will be its stability. Hence the order of reactivity of the complexes are STSC-Cu>STSC-Ni>STSC-Zn>STSC. The S values of the complexes are almost higher than the ligand STCS, therefore, it reacts effectively and gives high inhibition efficiency than ligand. This trend agrees with experimental results.
It can consider that the ΔE may play the main role in corrosion inhibition efficiency (Table 7). It has been seen that there is a very strong negative correlation between the ΔE and IE (%) and the determination coefficient, R2, is 0.988. The correlation graph between them was shown in Fig. 9. No effective relationship was found for other parameters and a correlation study was not performed for the parameters derived from the ΔE.

4. Conclusions
The following conclusions could be drawn from the experimental and quantum chemical investigation:
1. The inhibition efficiencies of ligand STSC and its metal complexes were evaluated in controlling corrosion of steel in oil field formation water, in the absence and presence of metal ions. The STSC-Cu+2 was determined as the most effective corrosion inhibitor.
2. The mechanistic aspects of corrosion inhibition have been discovered by electrochemical studies like polarization study.
3. The protective film analyze was performed using by FTIR and UV-Visible techniques. The film formed on the surface was found to consist of the STSC-Fe+2 complex.
4. The surface morphology was analyzed by SEM method. It has been found that the metal surface is covered with a thin layer of inhibitor.
5. A suitable mechanism for corrosion inhibition based on the results of the above study is proposed.
6. Some quantum chemical parameters which will assist in the interpretation of inhibition process, were calculated. The AE parameter was found to be closely related to the inhibition efficiencies of inhibitors.
7. The correlation graph between the ΔE and experimental inhibition efficiency (IE %) was obtained. The experimental and the theoretical results were in good agreement.


