Analysis of Cell Performance with Varied Electrolyte Species and Amounts in a Molten Carbonate Fuel Cell
Article information
Abstract
This study evaluated the performance characteristics of varied electrolyte species and amounts in a molten carbonate fuel cell (MCFC). Coin-type MCFCs were used at the condition of 650℃ and 1 atm. In order to measure the effects of varied electrolyte species and amounts, electrolytes of (Li+K)2CO3 and (Li+Na)2CO3 were selected and the amounts of 1.5 g, 2.0 g, 3.0 g, and 4.0 g were used. Insignificant performance differences were observed in the cell using different electrolytes, but the cell performance was sensitive to the amount of the electrolyte used. The pore-filling ratio (PFR), a ratio of pore filling in the components by the liquid carbonate electrolytes, was used to determine the optimum performance range. Consequently, 77% PFR demonstrated the optimum performance for both electrolytes. Thus, the MCFC had a permissible but narrow optimum performance range. The remaining amounts of electrolyte in the cells were determined using the weight reduction ratio (WRR) method after several hours of cell operation. The WRR used the relationship between the initial loaded amount of electrolyte and weight reduction of components in 10 wt% acetic acid. The relationships were linear and identical between the two electrolyte species.
1. Introduction
The molten carbonate fuel cell (MCFC) is one of the fuel cell systems that directly convert chemical energy into electrical energy. The main feature of the MCFC is the production of clean and efficient energy at high temperatures between 600 and 700℃. Other advantages include more flexibility in fuel choices and lower required catalyst amounts as compared to those with other fuel cells [1-6].
A characteristic property of a molten carbonate is its ability to change into a liquid at high temperatures, i.e., over 500℃; in addition, it can conduct electricity as an electrolyte. The melted carbonate easily impregnates porous materials and blocks leakage of the cell components, thereby preventing leakage of the fuel gas [7-8]. Therefore, the molten salt electrolyte is an important material in MCFCs. However, the problem of electrolyte consumption exists at the high-temperature operation conditions over 600℃. In a previous study, it was reported that electrolyte degradation increases the internal resistance and polarization resistance [9]. This means that, as the amount of electrolyte decreases, the cell performance and lifetime both decrease. Thus, the electrolyte in the cell has significant effects on the cell performance and lifetime of the MCFC. Therefore, if the optimum electrolyte is used in the cell, the maximum performance and longest cell life can be obtained.
In the MCFC, the electrolyte impregnates porous materials such as the anode, cathode, and matrix. The anode, comprising a Ni-Al alloy, has low wettability and a high contact angle with molten carbonates. Therefore, the anode is covered with a thin layer of the electrolyte. The Li-doped NiO cathode is the opposite of the anode. This implies that a thick layer of electrolyte covers the surface of the cathode, causing an increase in diffusion resistance in the reactive area. Therefore, when excess electrolyte is filled in the cell component, the diffusion resistance is increased by the flooding phenomenon. According to Selman, the cell performance was dependent on the amount of electrolyte filled in the cathode, and the optimal operating conditions were ~15-30% of filling the voids by electrolyte [10].
In this study, two carbonate electrolytes of (Li+Na)2CO3 and (Li+K)2CO3 were employed in order to investigate the cell performance dependence on the electrolyte species and amount. According to Morita et al., the Li-Na electrolyte has high cell performance compared with that of Li-K and can be used as a replacement for the Li-K electrolyte [11]. Selman et al. also reported that the Li-K (62:38 mol%) and Li-Na (52:48 mol%) electrolytes, with compositions near the eutectic point range, have almost equal densities of 1.96 and 1.94 g/cm3, respectively [12]. However, the ionic conductivity of the Li-Na electrolyte is 2.4 S/cm, higher than the 1.65 S/cm conductivity of the Li-K electrolyte. This means that the Li-Na electrolyte has a lower internal resistance than the Li-K electrolyte. It is known that the O2 solubility in the Li-Na electrolyte is one order of magnitude lower than that in the Li-K electrolyte, and thus the diffusion resistance against O2 in the cathode is larger for the Li-Na electrolyte. The Li-Na electrolyte has a higher surface tension of 243 mN/m than the 217 mN/m surface tension of the Li-K electrolyte, which implies that the Li-Na electrolyte has a lower wettability than the Li-K electrolyte, which may increase the contact angle. This would increase the overpotential at each electrode.
Therefore, the performances of the Li-K and Li-Na electrolytes were investigated, and the optimum amount of electrolyte was determined for each electrolyte in this research work.
2. Experimental
In this study, a coin-type MCFC was used to measure the performances of the two types of electrolytes. The anode was made of a porous Ni-Al alloy, the cathode was in situ-oxidized NiO, and the matrix was LiAlO2. All the electrode materials were made by the Korea Institute of Science and Technology (KIST). The electrode diameter was approximately 3 cm. The anode was supplied with H2:CO2:H2O in the ratio 72:14:14 mol% and the cathode was fed with a mixture of air and CO2 gas (70:30 mol%). All cells were operated and measured at 650 °C under atmospheric pressure. Two kinds of electrolyte, (Li+K)2CO3 and (Li+Na)2CO3, were used. The (Li+K)2CO3 was prepared in a ratio of 62:38 mol% and the (Li+Na)2CO3 was prepared in a ratio of 52:48 mol%. In order to compare the performance characteristics based on the amount of electrolyte, each electrolyte was tested twice under conditions of 1.5, 2.0, 3.0, and 4.0 g of electrolyte per cell. The experiment was performed with reference to the previous work [13].
Electrochemical analysis methods such as steady-state polarization (SSP), step-chronopotentiometry (SC), and impedance analysis were used for the cell performance evaluation. The SSP measures the correlation between current and voltage for the current density range of 0 to 150 mA/cm2. SC measures the voltage relaxation behavior by increasing the current density at 50-mA/cm2 intervals, i.e., 0, 50, 100, and 150 mA/cm2. Impedance spectroscopy measures the change in the resistance through an AC signal of 5 mV RMS at the open-circuit voltage in the frequency range from 1 kHz to 10 mHz.
The weight reduction ratio (WRR) method was also performed to estimate the remaining amounts of electrolyte in the cells. After several hours of cell operation, the masses of the cell components, i.e., cathode, anode, and matrix, were measured, and then immersed in 300 mL of 10 wt% acetic acid for 24 h to dissolve the remaining amount of electrolyte. The cell components were then dried and the mass of the dried components was measured again. The WRR was calculated using the masses of the components before and after dissolution. In addition, unlike previous experiments, this study used vacuum filtering to reduce the experimental error of the WRR from reactions between the cell components and atmospheric humidity [14].
3. Results and Discussion
In the MCFC, the theoretical voltage is determined by the fuel gas composition. This can be seen from the Nernst equation (1):
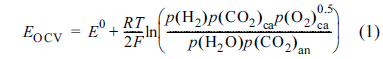
where E0 is the standard potential; T is the operating temperature; F is the Faraday constant; and the subscripts an and ca denote the anode and cathode, respectively. As shown in the equations, the open-circuit voltage (EOCV) of the MCFC is determined only by the operation temperature and the gas composition. However, the real potential of the MCFC is typically less than the theoretical voltage, which can be attributed to the overpotential by the cell components and by reactions at the electrodes. The polarization resistance at each electrode and the internal resistance by cell components together form the total overpotential (ηtot).
Equation (2) shows the actual potential of the cell. ηtot is expressed as ηIR + ηca + ηan, where ηIR is the ohmic loss and ηan and ηca are the overpotentials from chemical reactions at the anode and cathode, respectively. Thus, the total overpotential in the fuel cell can be measured through the relation in Eq. (2); hence, all cell performance can be deduced.
Figs. 1 and 2 show the SSP results for cells with various amounts of Li-K and Li-Na electrolytes at 650℃, respectively. The cells were analyzed at 650℃ under atmospheric pressure. The current density in the SSP analysis is varied from 0 to 150 mA/cm2. Under an applied current density, decreases in cell potential are observed; these can be attributed to increases in the polarization resistance. Thus, the total voltage loss can be estimated from Eq. (2).
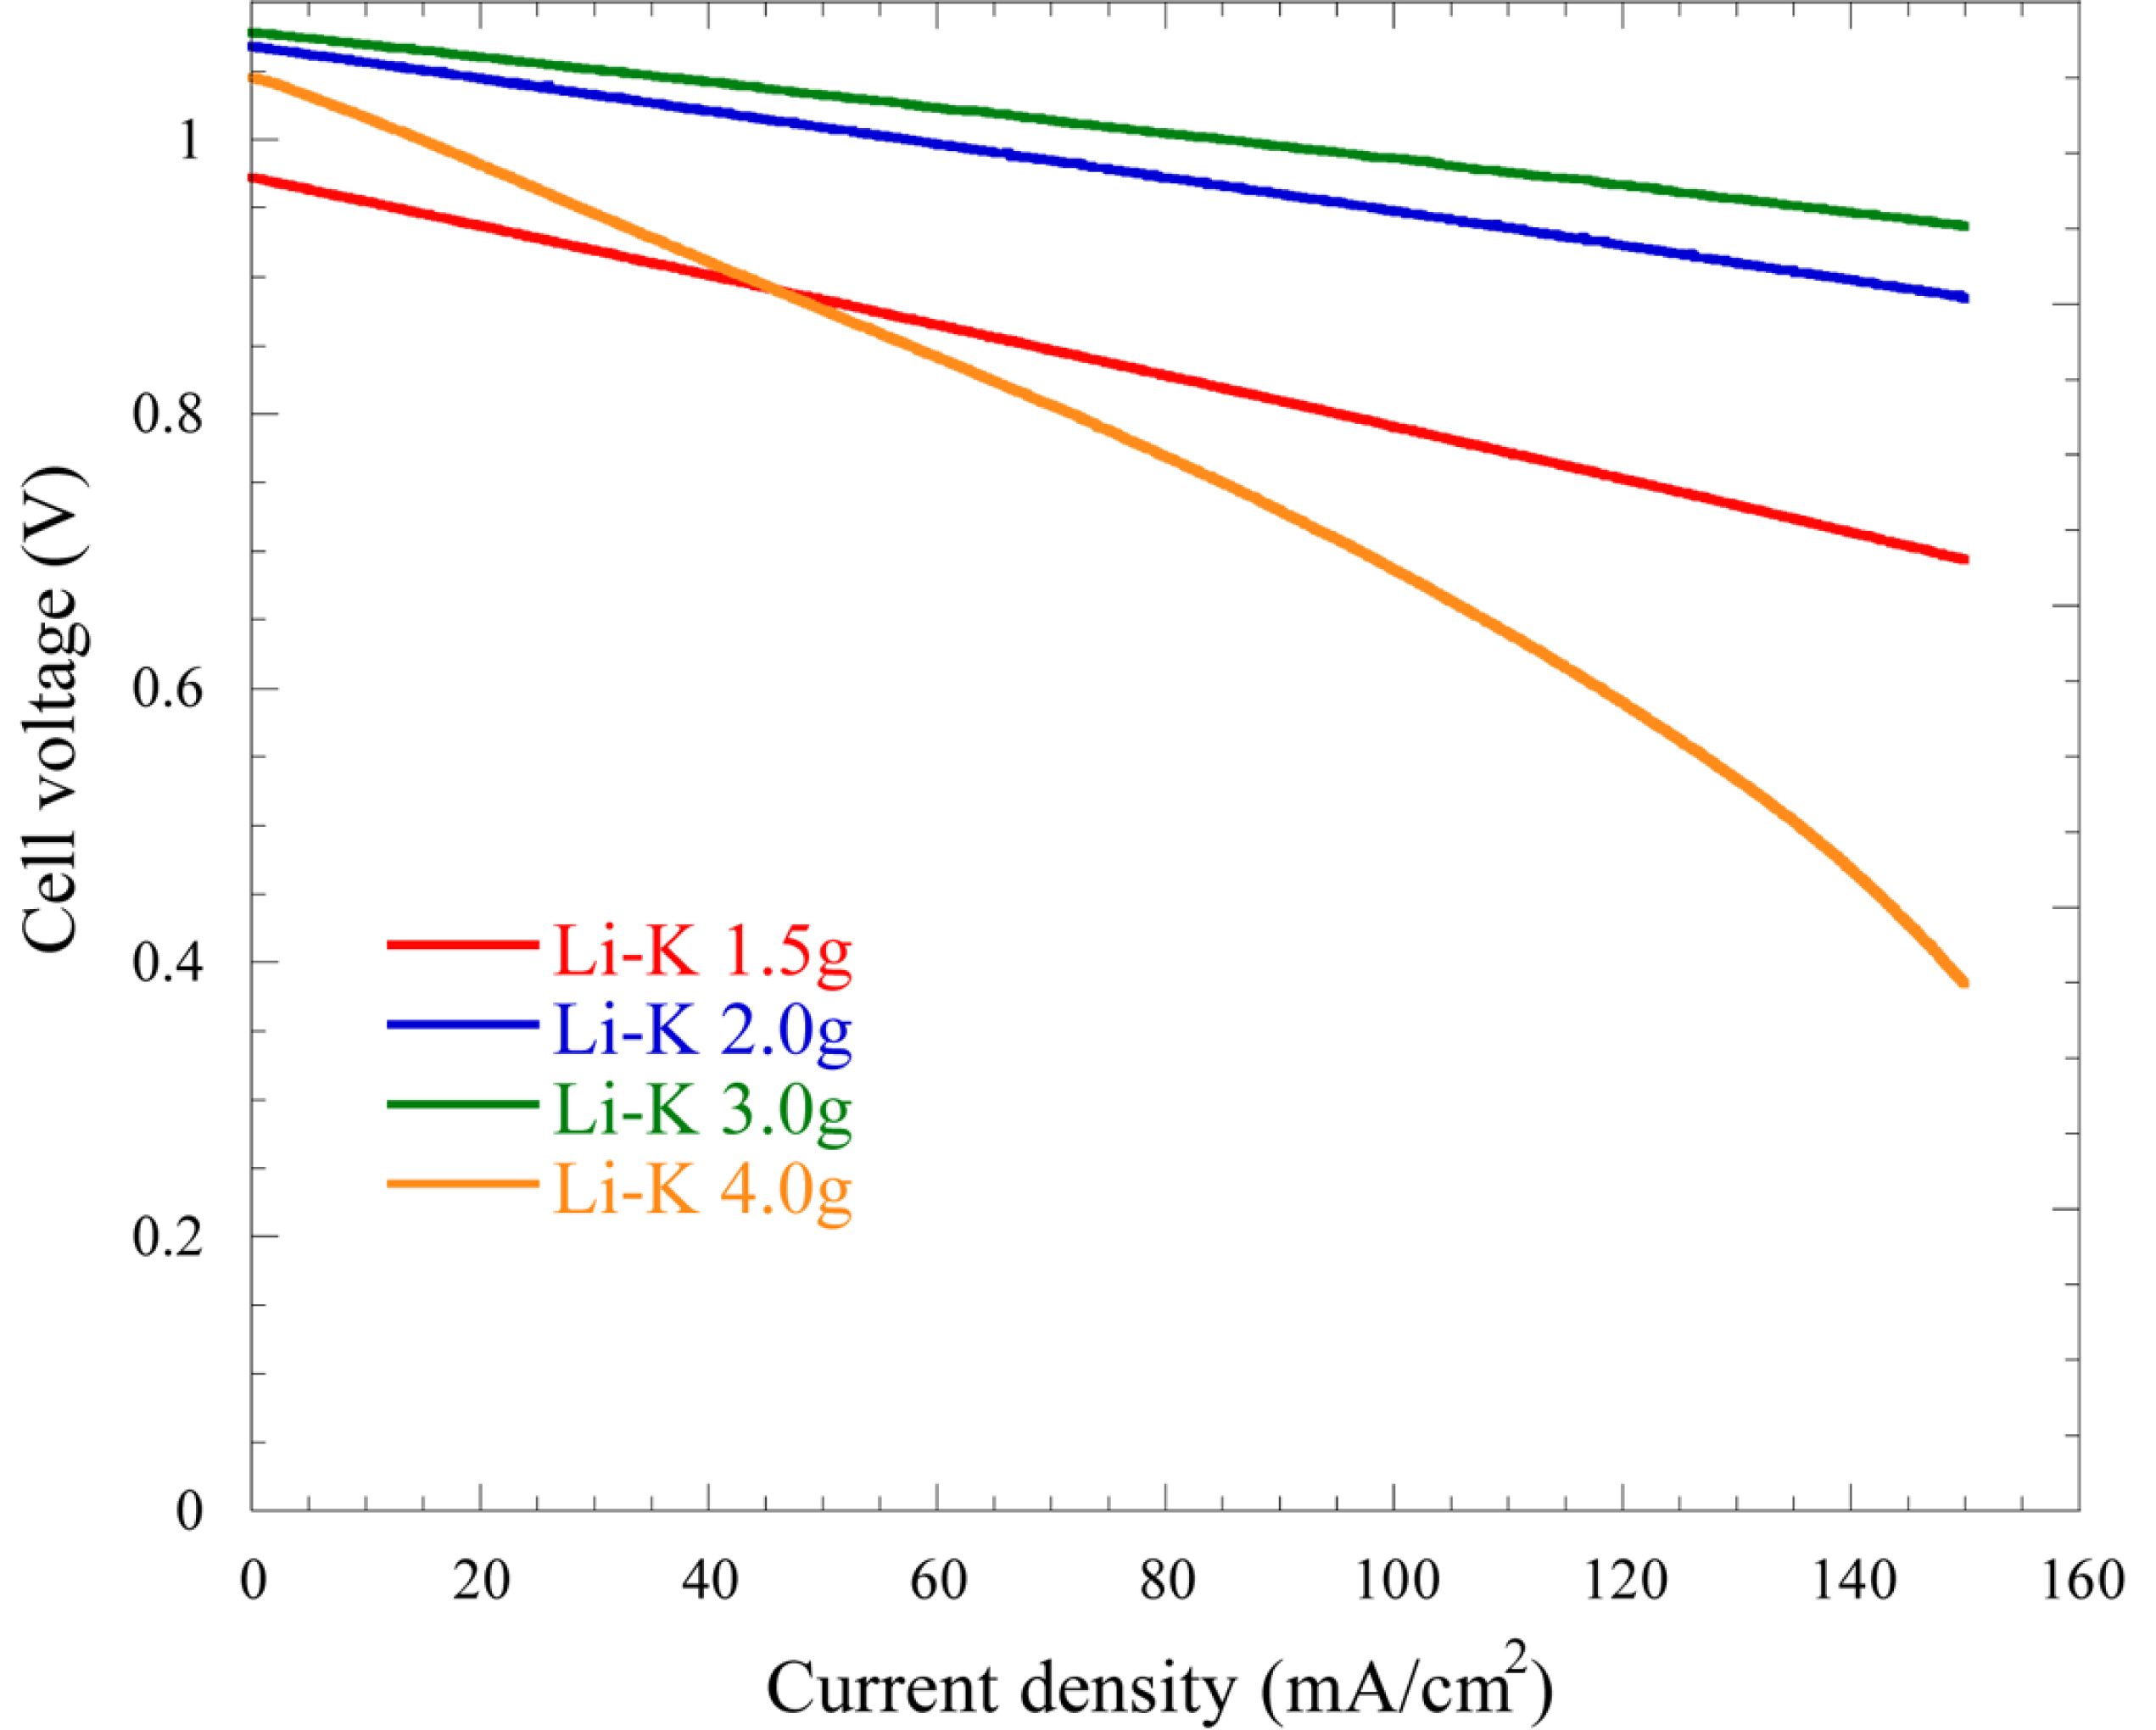
Steady-state polarization behaviors of the cells using various amounts of the Li-K electrolyte at 650℃.
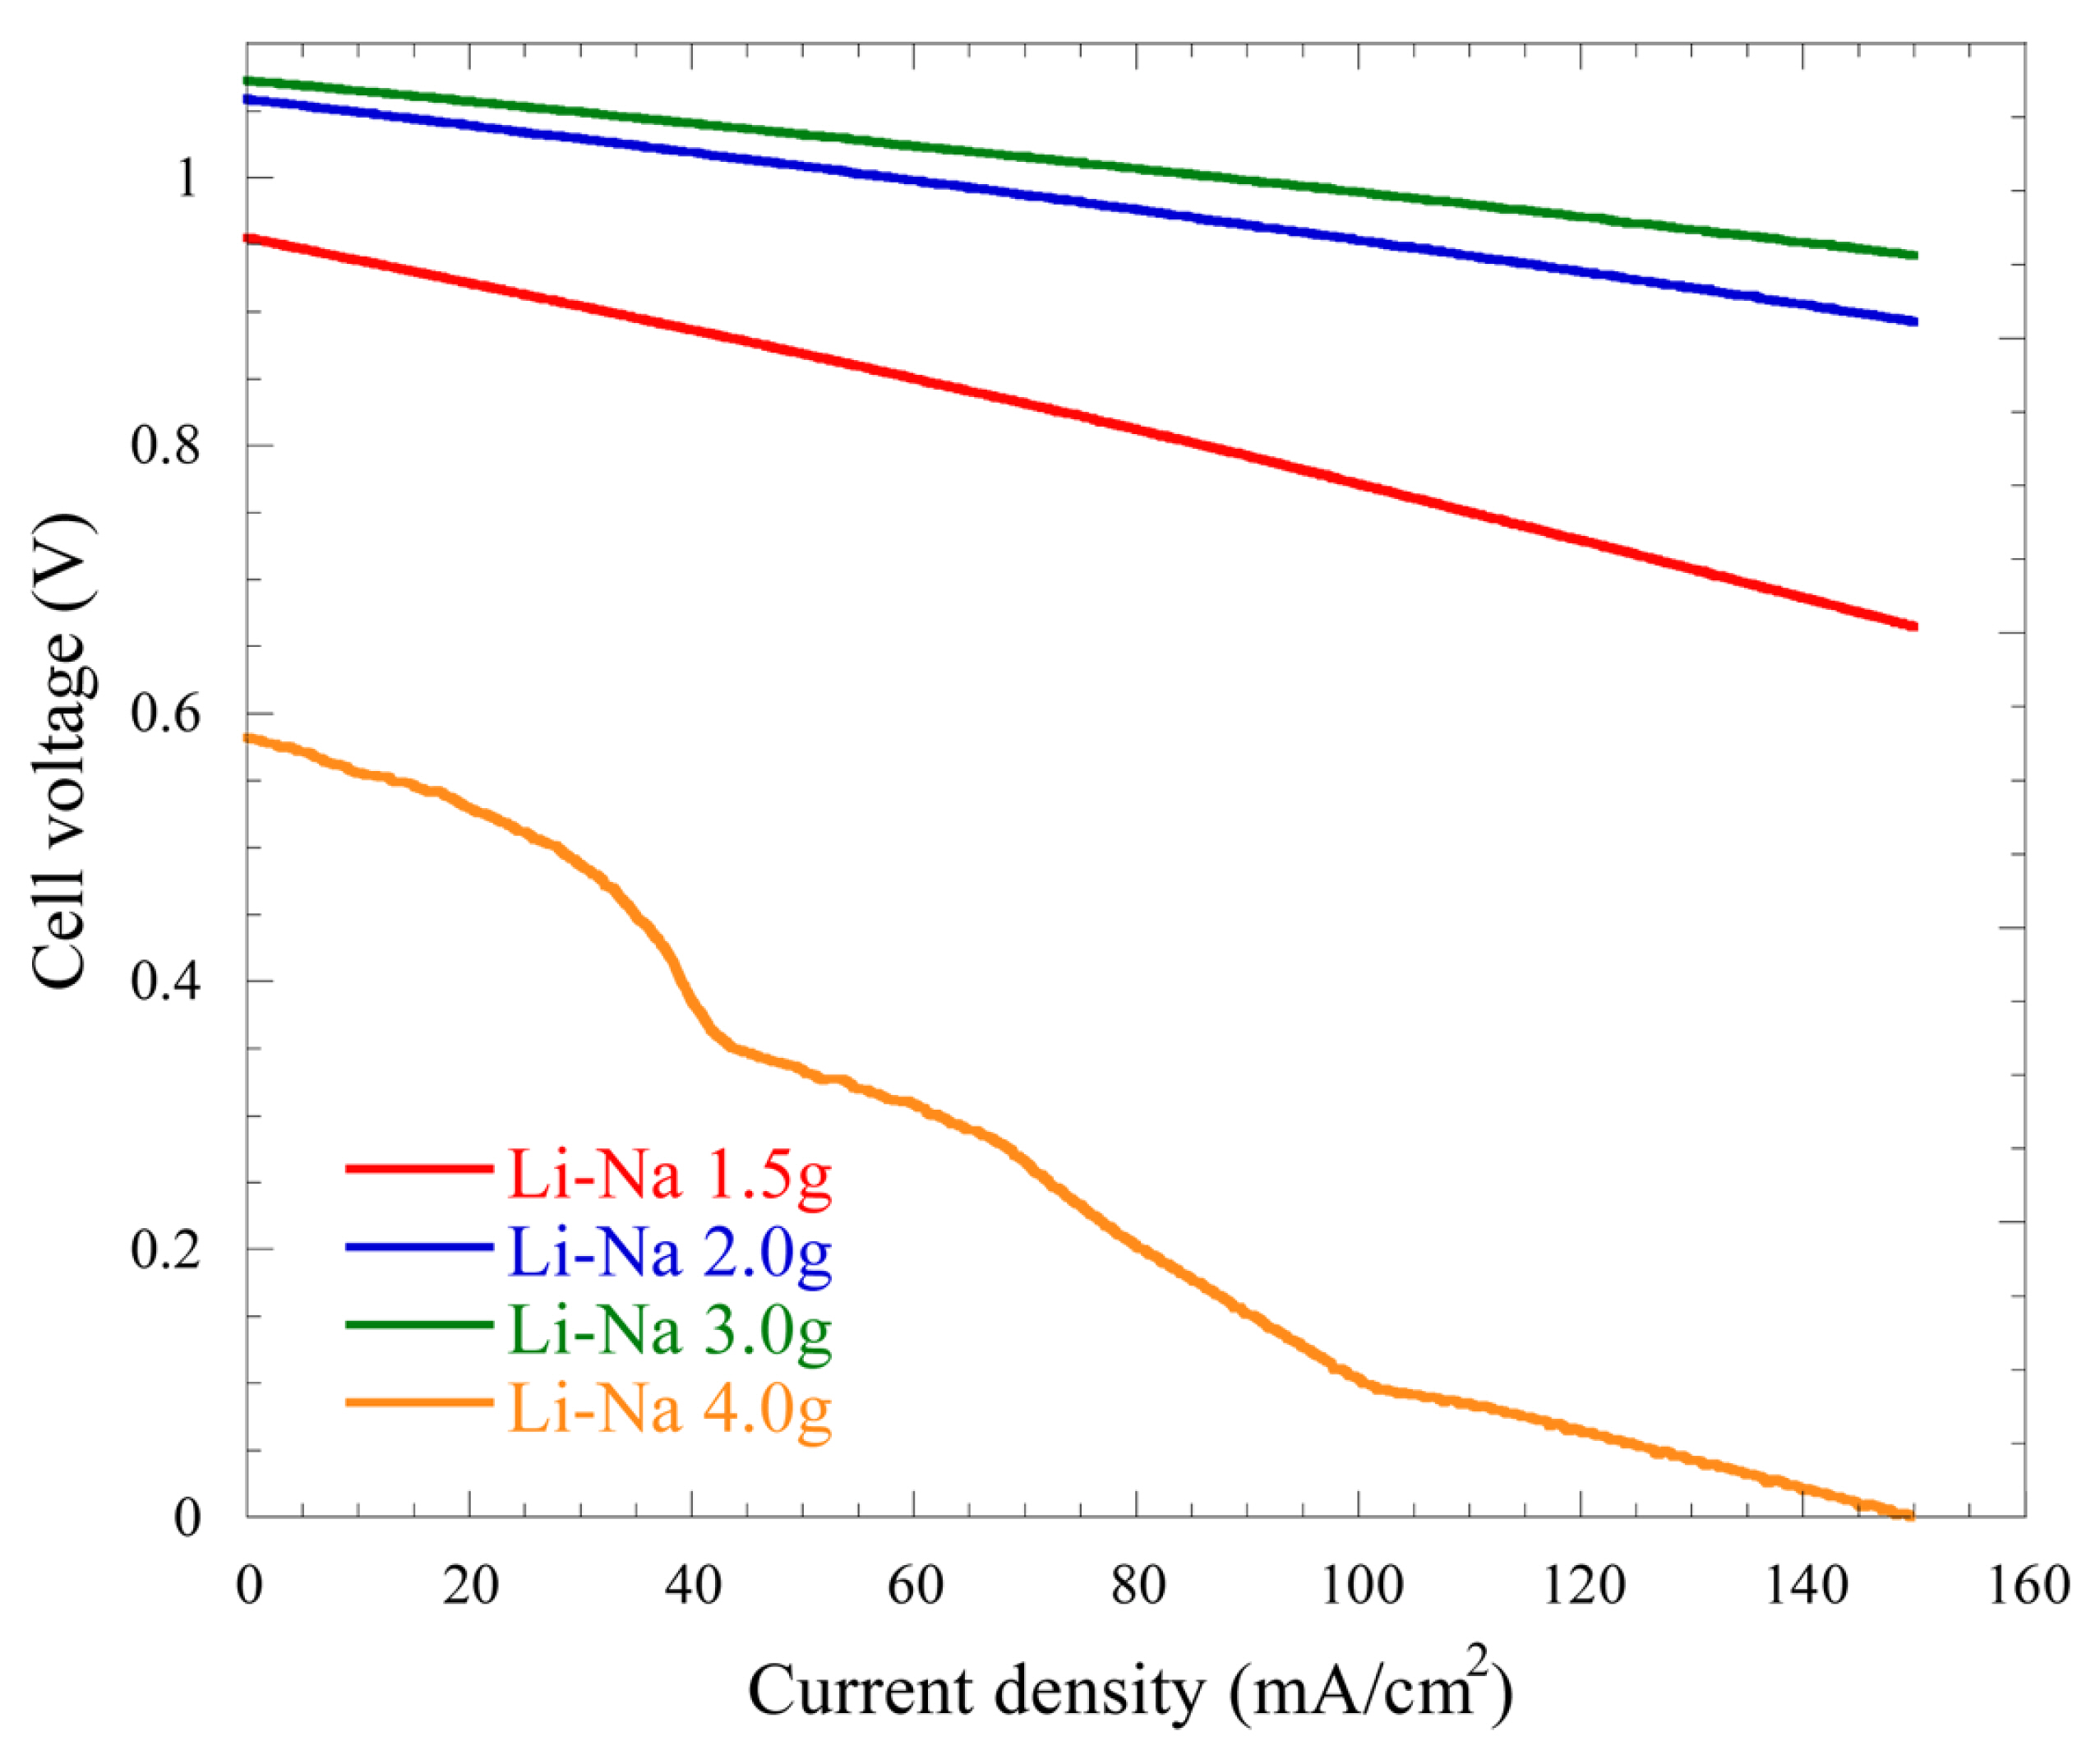
Steady-state polarization behaviors of the cells using various amounts of the Li-Na electrolyte at 650℃.
In the SSP analysis of the Li-K electrolyte, the EOCV for 1.5, 2.0, 3.0, and 4.0 g of electrolyte are 0.973, 1.068, 1.078, and 1.045 V respectively, with 3.0 g of electrolyte showing the highest EOCV. The theoretical EOCV at 650℃ is approximately 1.078 V, which is similar to the EOCV with 3.0 g of the Li-K electrolyte. For lower electrolyte amounts of 1.5 g and 2.0 g, insufficient electric circuits are developed because of the smaller active surface areas. A smaller EOCV is observed with 4 g of the electrolyte, which can be explained as a result of the flooding of the electrolyte in the electrode pores. The total overpotentials at the current density of 150 mA/cm2 are 279, 184, 142, and 661 mV for 1.5, 2.0, 3.0, and 4.0 g, respectively. Thus, as the mass of the electrolyte increases, the EOCV of the cell is increased and the total overpotential is decreased. This is because the reaction area is increased as the amount of electrolyte in the cell increases. However, with 4 g electrolyte, the overpotential is increased largely because of an increase in the mass-transfer resistance caused by the thick layer of electrolyte formed on the surfaces of the electrodes. It was suggested that electrolyte conditions above 4 g caused flooding because excess electrolyte covered the electrode surface and pores [14].
The EOCV values for 1.5, 2.0, 3.0, and 4.0 g of the Li-Na electrolyte are 0.955, 1.059, 1.072, and 0.582 V respectively. The total overpotentials at the current density of 150 mA/cm2 are 290, 166, 133, and 582 mV for 1.5, 2.0, 3.0, and 4.0 g, respectively. These results show that the total overpotential is decreased as the mass of the electrolyte increases, as said earlier for the Li-K electrolyte. Thus, the SSP results show that both electrolytes have similar performance with mass variation. Unlike the Li-K electrolyte, the EOCV is very low for the cell having 4.0 g of Li-Na electrolyte. It can be assumed that the Li-Na electrolyte causes more flooding because of its high surface tension and low wettability, hence the very low performance obtained in Fig. 2.
Figs. 3 and 4 show the SC behaviors of cells with various amounts of each electrolyte at 650℃. The SC method reveals reaction characteristics through the voltage relaxation. The voltage relaxation step in the SC results is affected by ohmic loss, charge-transfer resistance, and mass-transfer resistance at each electrode. Steeper voltage relaxation corresponds to greater effects on the total resistance by ohmic losses and by charge and mass transfer. Thus, the performance of the cell can be characterized through the voltage relaxation behavior.
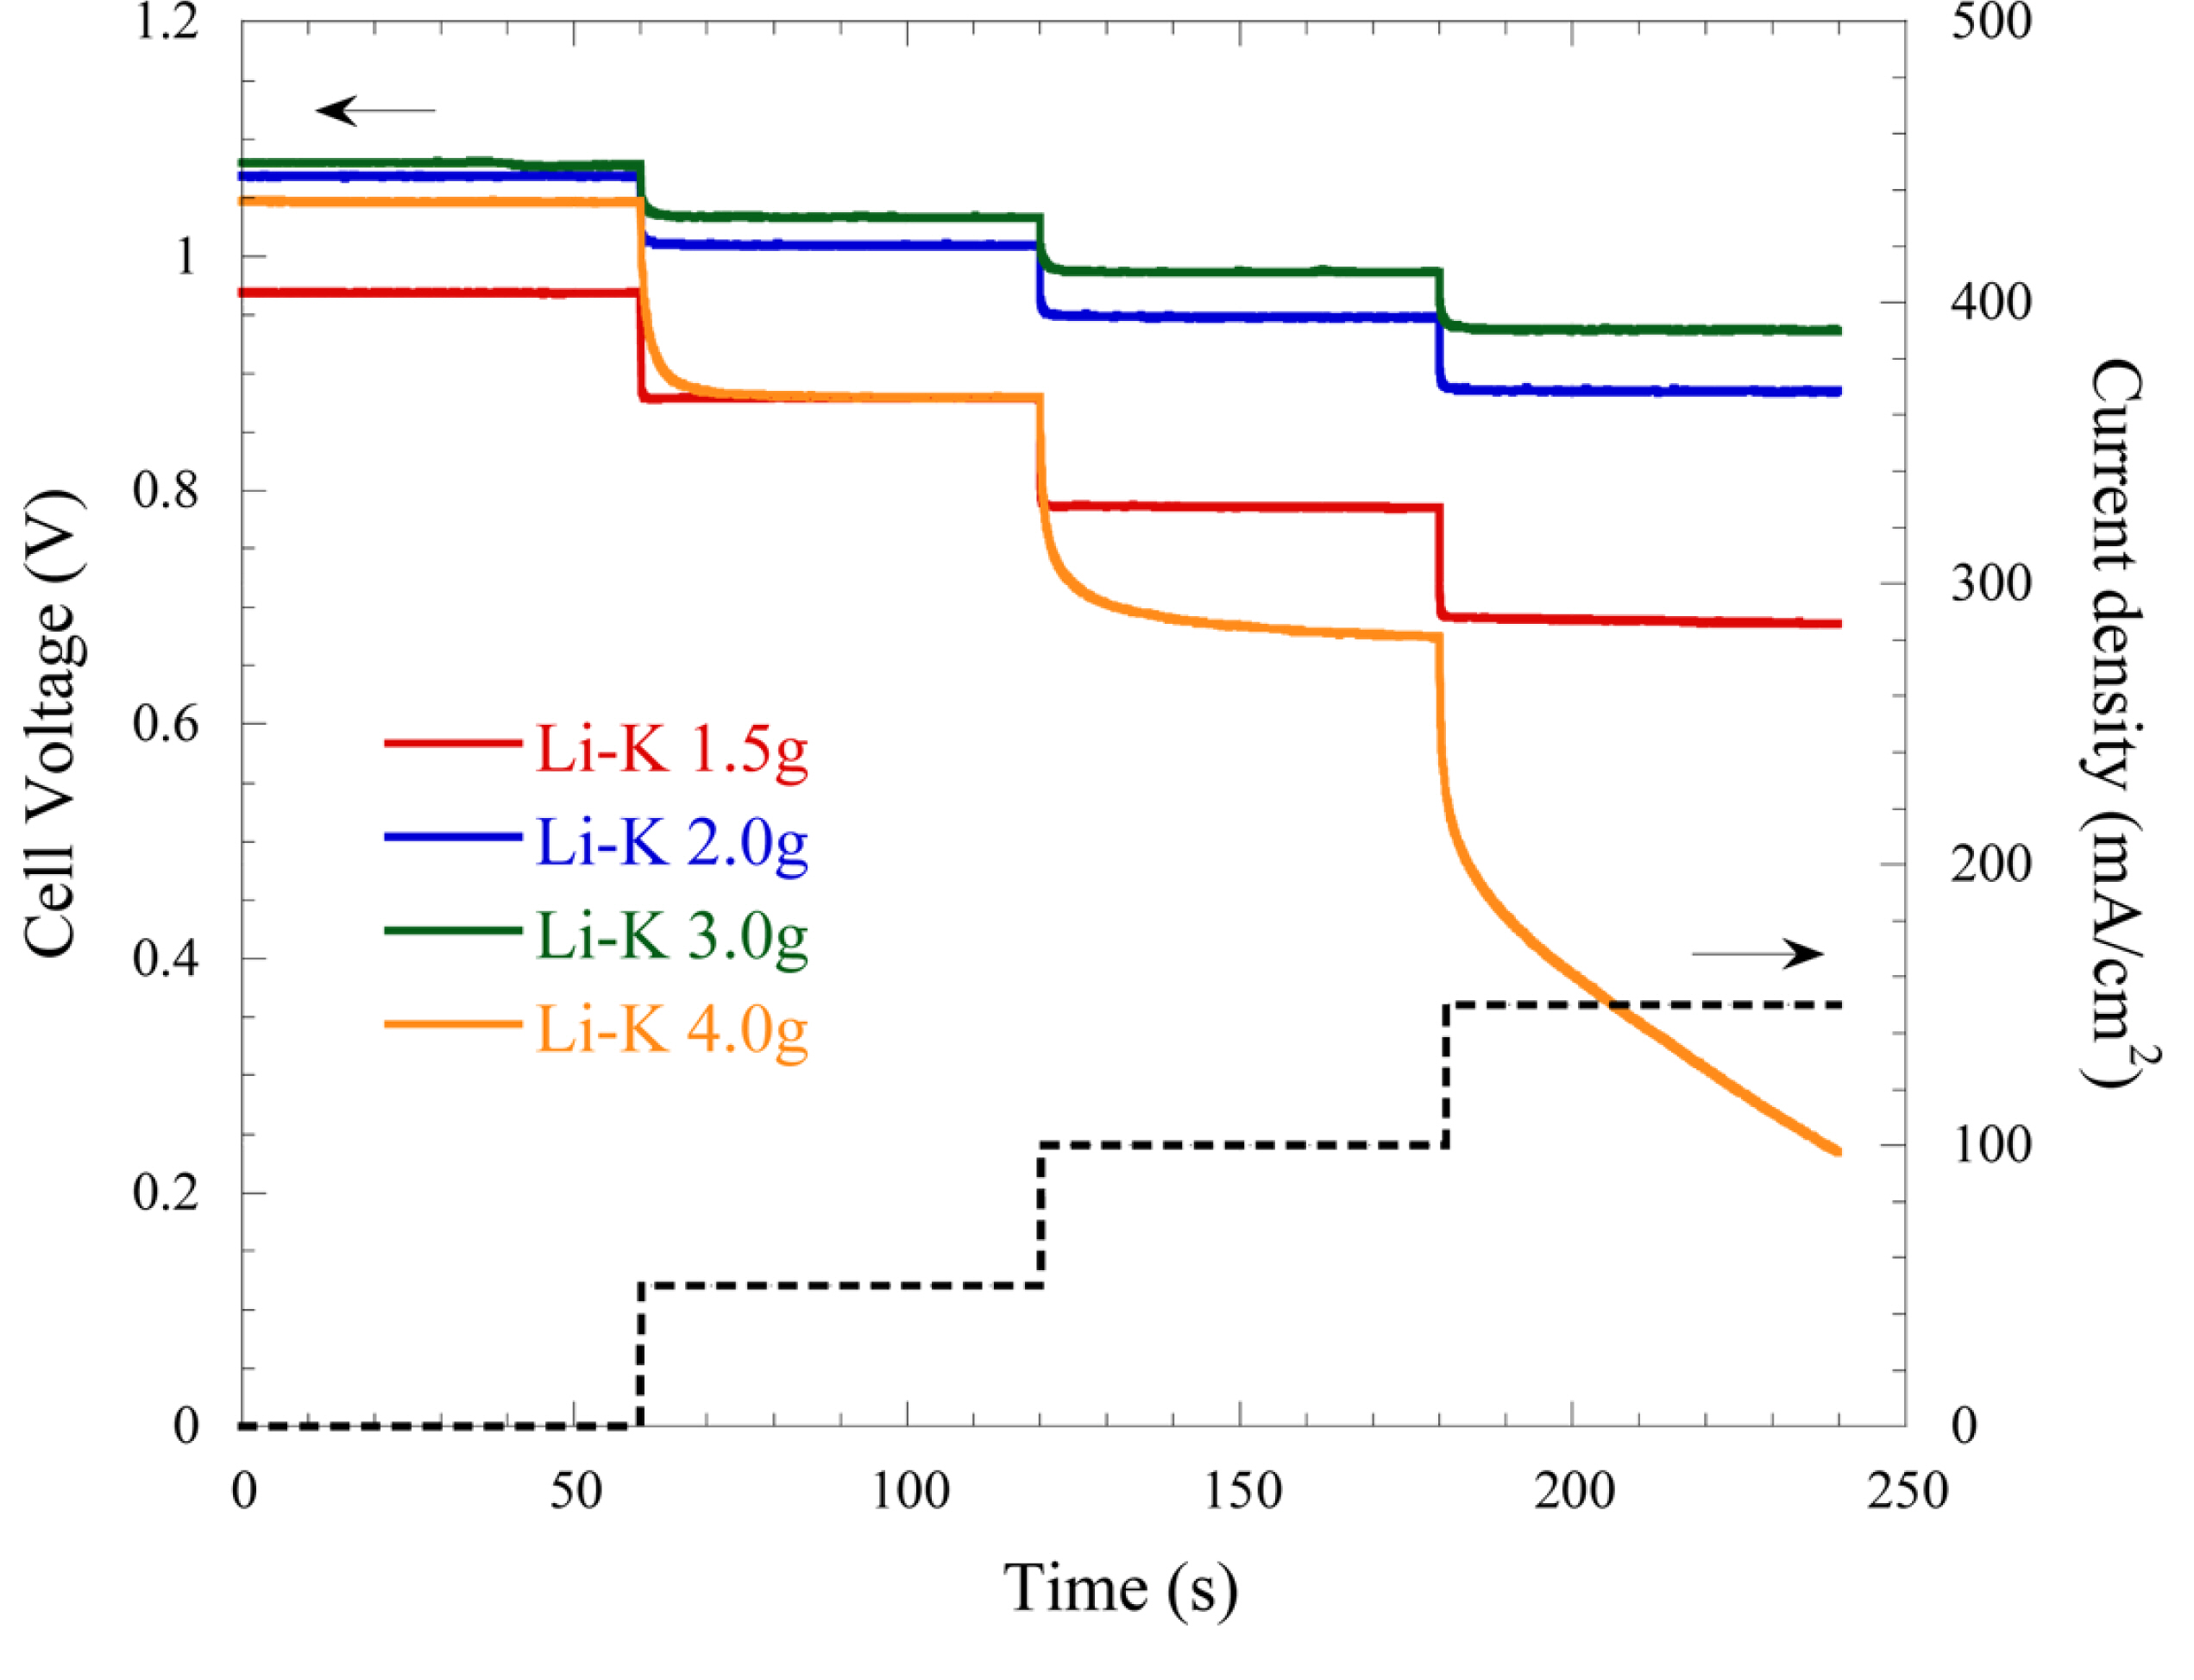
Step-chronopotentiometry for cells with various amounts of the Li-K electrolyte at 650℃.
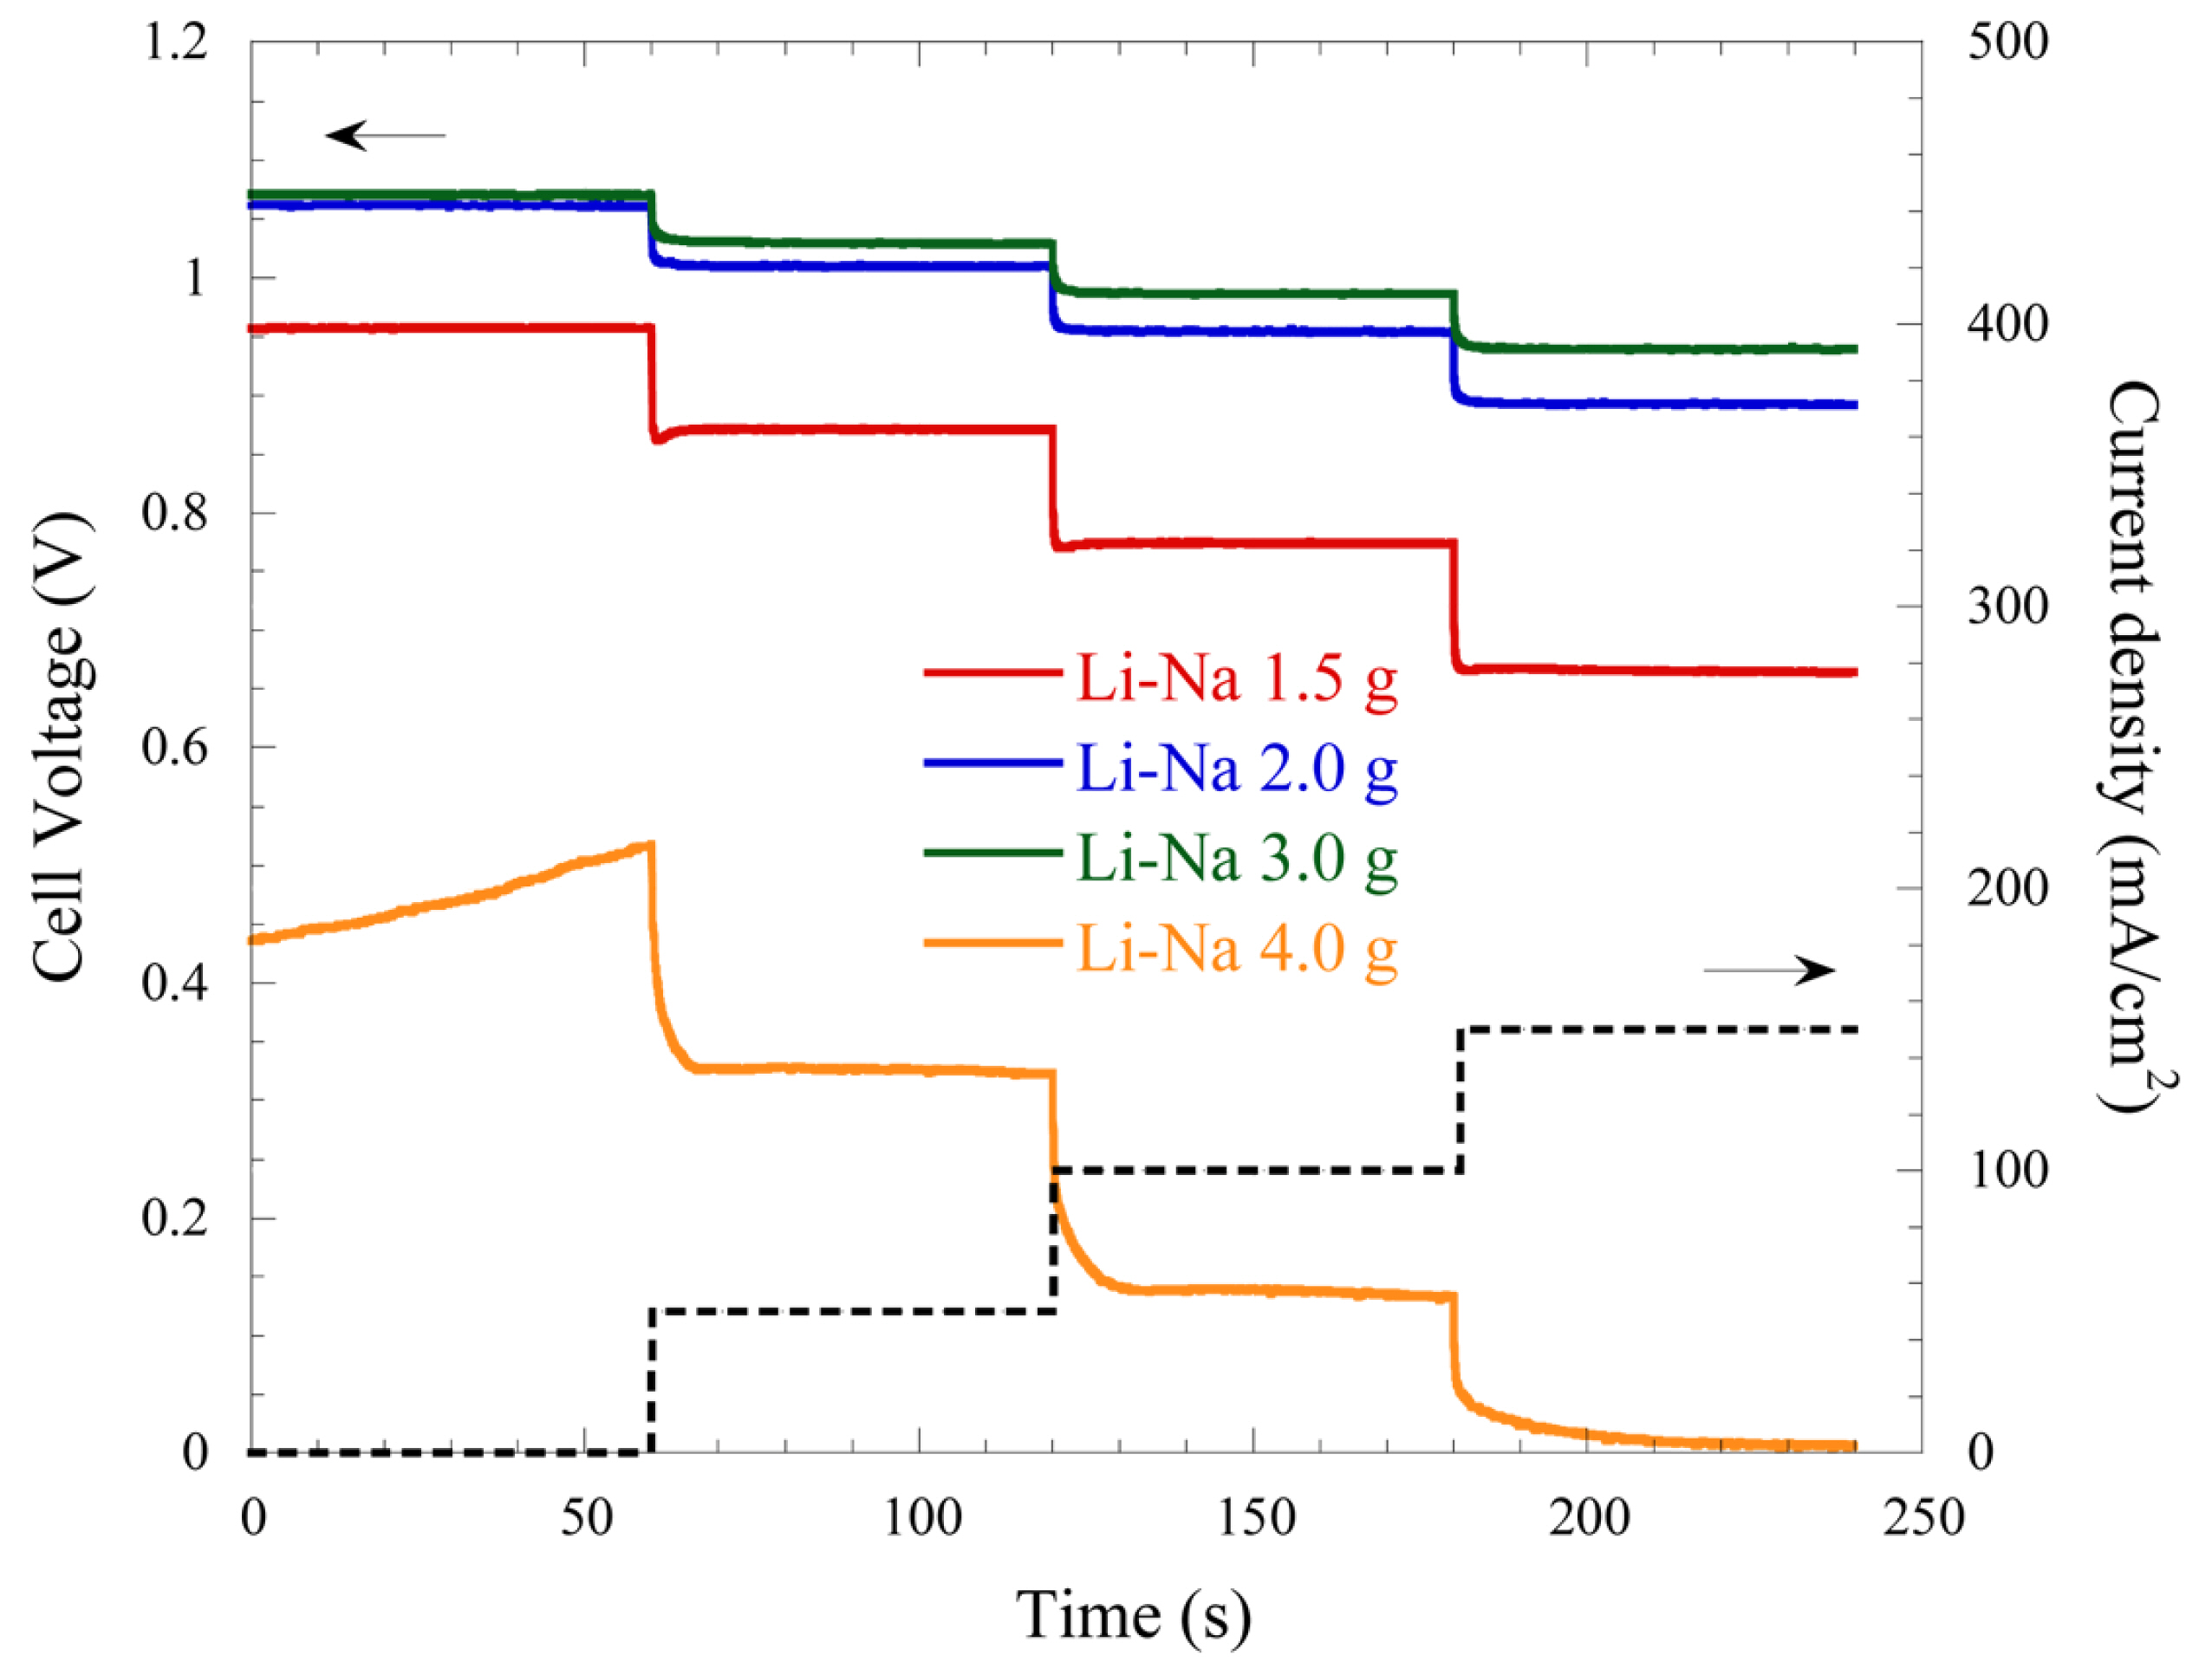
Step-chronopotentiometry for cells with various amounts of the Li-Na electrolyte at 650℃.
As shown in Fig. 3, the voltage relaxation of the cell with various amounts of the Li-K electrolyte is reduced as the mass of electrolyte increases. The overpotentials at 50, 100, and 150 mA/cm2 for 1.5 g of electrolyte are 82, 174, and 270 mV and those of 3.0 g were 47, 93, and 143 mV, respectively. Therefore, faster voltage relaxation is observed for the cell with 3.0 g of electrolyte, while the opposite occurs for the cell with 1.5 g. This means that the internal resistance and overpotential at each step are decreased as the electrolyte amount increases, as observed in the SSP results. However, the voltage relaxation with 4.0 g electrolyte is increased relative to the other conditions. It was suggested that this was due to an increase in the mass-transfer resistance by the excess electrolyte. This behavior is also observed for the Li-Na electrolyte, as shown in Fig. 4. The overpotentials at 50, 100, and 150 mA/cm2 for 1.5 g of Li-Na electrolyte are 86, 184, and 292 mV and those of 3.0 g are 42, 117, and 132 mV, respectively. The overpotential is generally decreased as the mass of electrolyte increases, like the behavior observed in the Li-K electrolyte. However, for 4.0 g electrolyte, the voltage relaxation under both electrolytes is slowed.
Figs. 5 and 6 show the impedance spectra of cells with various amounts of Li-K and Li-Na electrolytes at 650℃, respectively. In a previous work [15], the impedance spectrum of an MCFC was divided three sections; the real resistance value from 0 to the start of the high-frequency half-circle showed the internal resistance of the cell components, the high-frequency half circle reflected the cathodic overpotential due to the mass-transfer resistance through the liquid electrolyte layer, and the low-frequency half-circle represented the anodic overpotential.
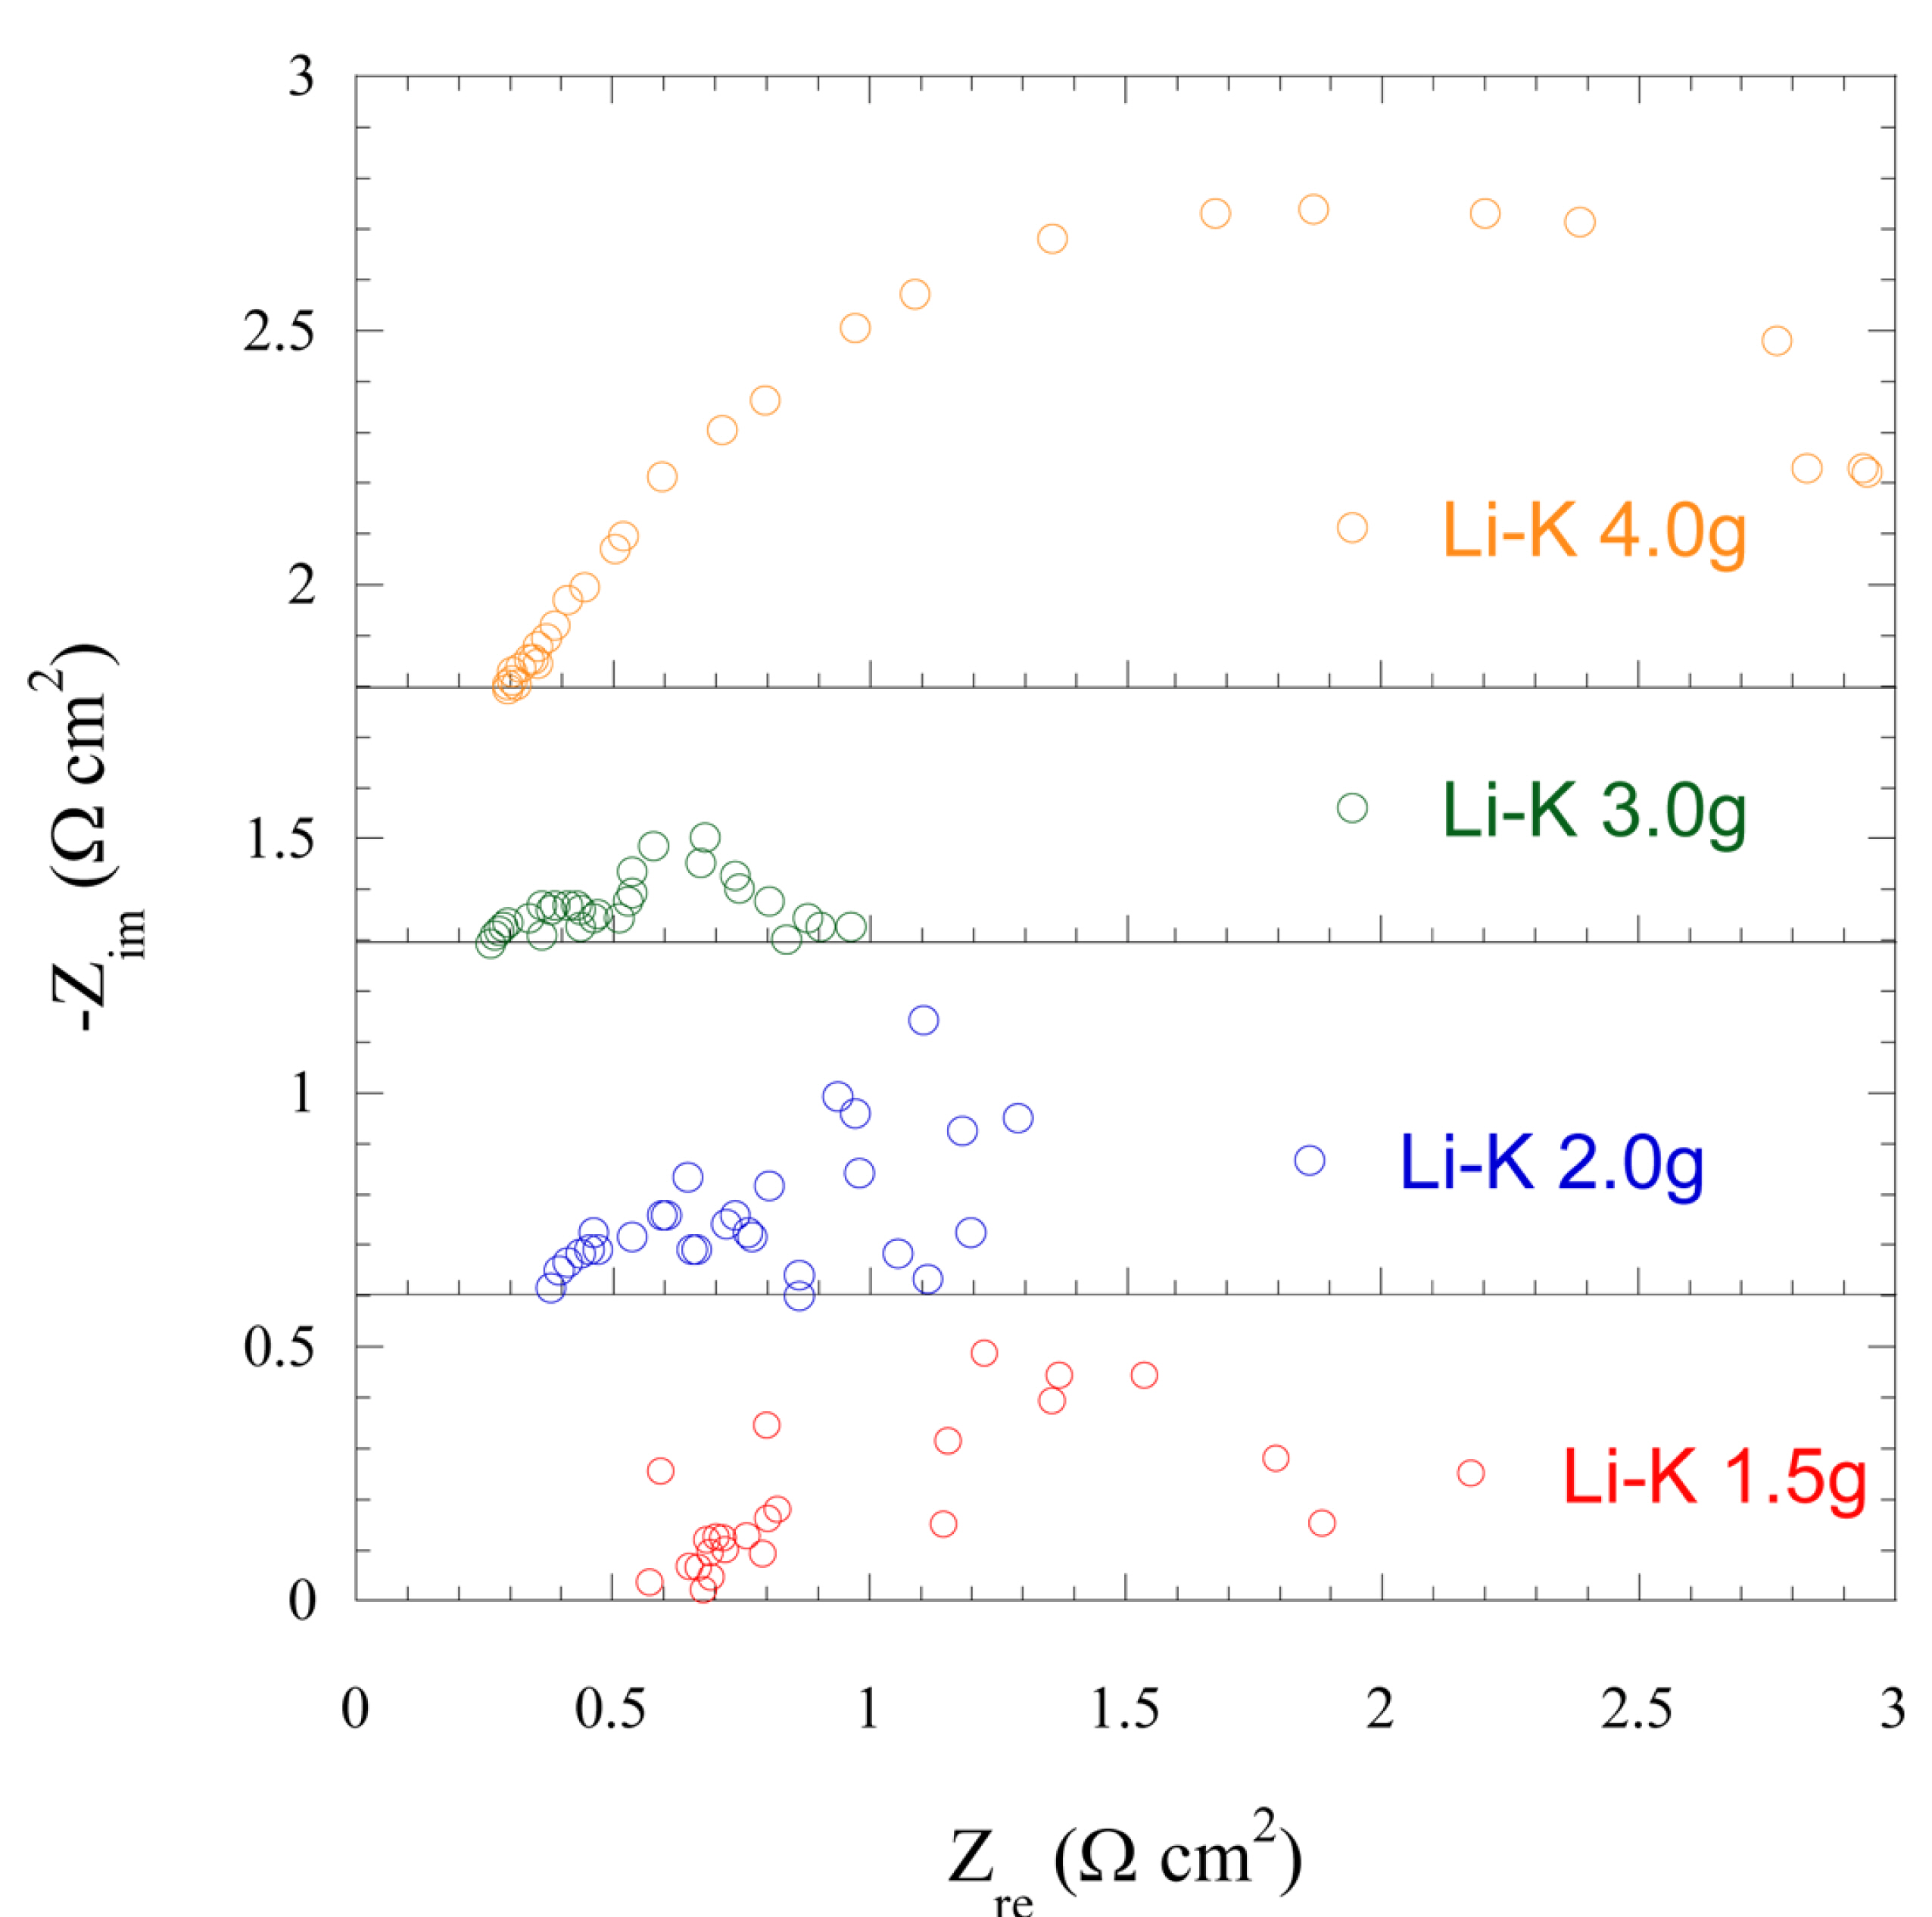
Impedance behaviors of cells with various amounts of the Li-K electrolyte at 650℃.
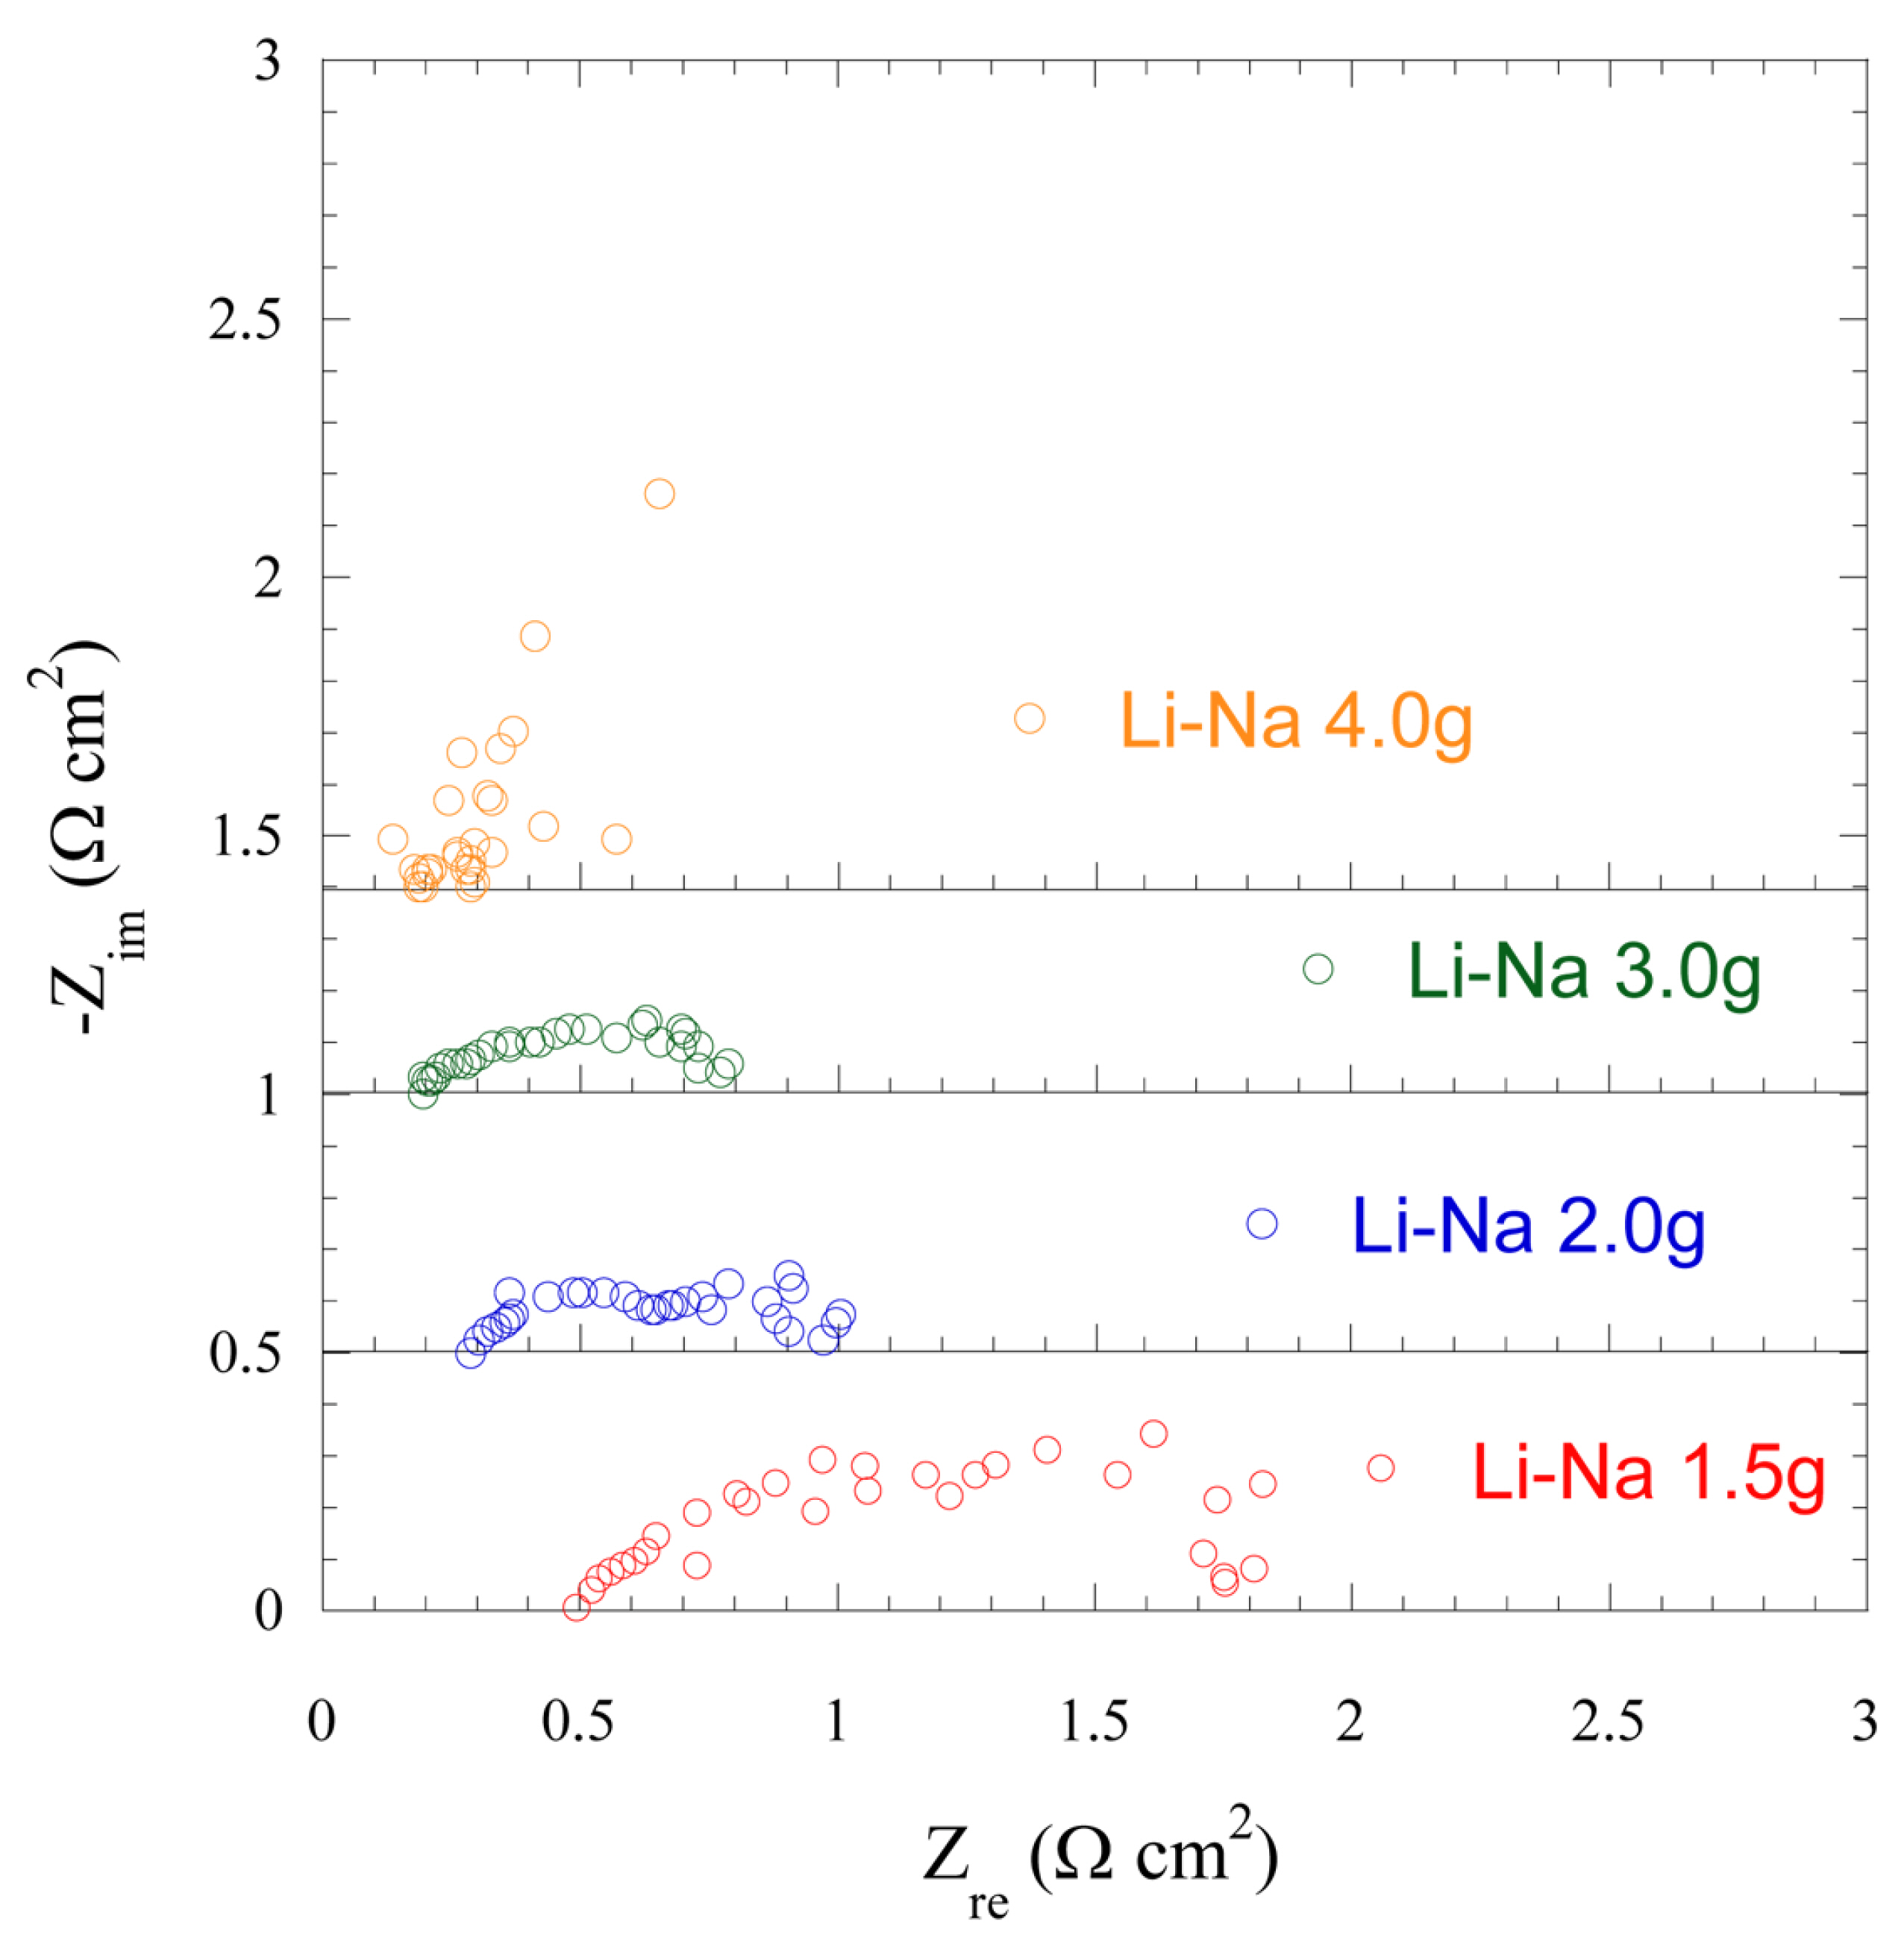
Impedance behaviors of cells with various amounts of the Li-Na electrolyte at 650℃.
In Fig. 5, the internal resistances are 0.57, 0.38, 0.26, and 0.28 Ω·cm2 for 1.5, 2.0, 3.0, and 4.0 g of electrolyte, respectively. As the amount of electrolyte increases, the internal resistance of the cell is decreased. It can be seen that the performance of the cell is improved as the amount of electrolyte increases, following the tendency observed in the SSP and SC results. The total overpotentials are 1.88, 1.22, 0.88, and 3.08 Ω·cm2, for 1.5, 2.0, 3.0, and 4.0 g of electrolyte, respectively. Thus, the overpotential depends on the amount of electrolyte, except for that in the cell with 4.0 g of Li-K electrolyte. Thus, as the amount of electrolyte approaches the optimal amount, the internal resistance and overpotential are decreased. With 4.0 g of electrolyte, the total overpotential is very large, although the internal resistance has a small value like that with 3.0 g of electrolyte. This is probably caused by the flooding of the electrolyte, as observed in the SSP and SC results. It can be said that the excess electrolyte does not greatly affect the internal resistance. However, the thick liquid layer produced by excess electrolyte can be considered to influence the mass-transfer resistance and hence the performance of the cell.
The cell using Li-Na electrolyte also shows similar trends in its impedance behavior like those observed in the Li-K electrolyte. The internal resistances of cells with the Li-Na electrolyte are 0.49, 0.28, 0.19, and 0.18 Ω·cm2, for 1.5, 2.0, 3.0, and 4.0 g of electrolyte respectively, which are lower than those with the Li-K electrolyte. It was suggested that, because the Li-Na electrolyte has a higher ionic conductivity than the Li-K electrolyte, a smaller internal resistance can be expected. The overpotentials for 1.5, 2.0, 3.0, and 4.0 g of electrolyte are 1.71, 0.96, 0.78, and 3.62 Ω·cm2, respectively. The results show that the internal resistance and the overpotential are dependent on the amount of electrolyte in the same manner as that observed with the Li-K electrolyte, except for the cell having 4 g of Li-Na electrolyte. In other words, the Li-Na electrolyte has a lower internal resistance and a lower overpotential when the amount of electrolyte approaches the optimum amount, as with the Li-K electrolyte. Therefore, both Li-K and Li-Na electrolytes have optimal electrolyte amounts; as the electrolyte amounts approach these optimums, the cell performances increase.
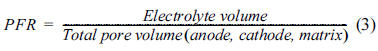
Figs. 7 and 8 show the relation between the pore filling ratio (PFR) and total resistance with Li-K and Li-Na electrolytes, respectively. The PFR is the ratio of the electrolyte filling the pores between two electrodes and the matrix [15]. This is expressed mathematically in equation (3) as:
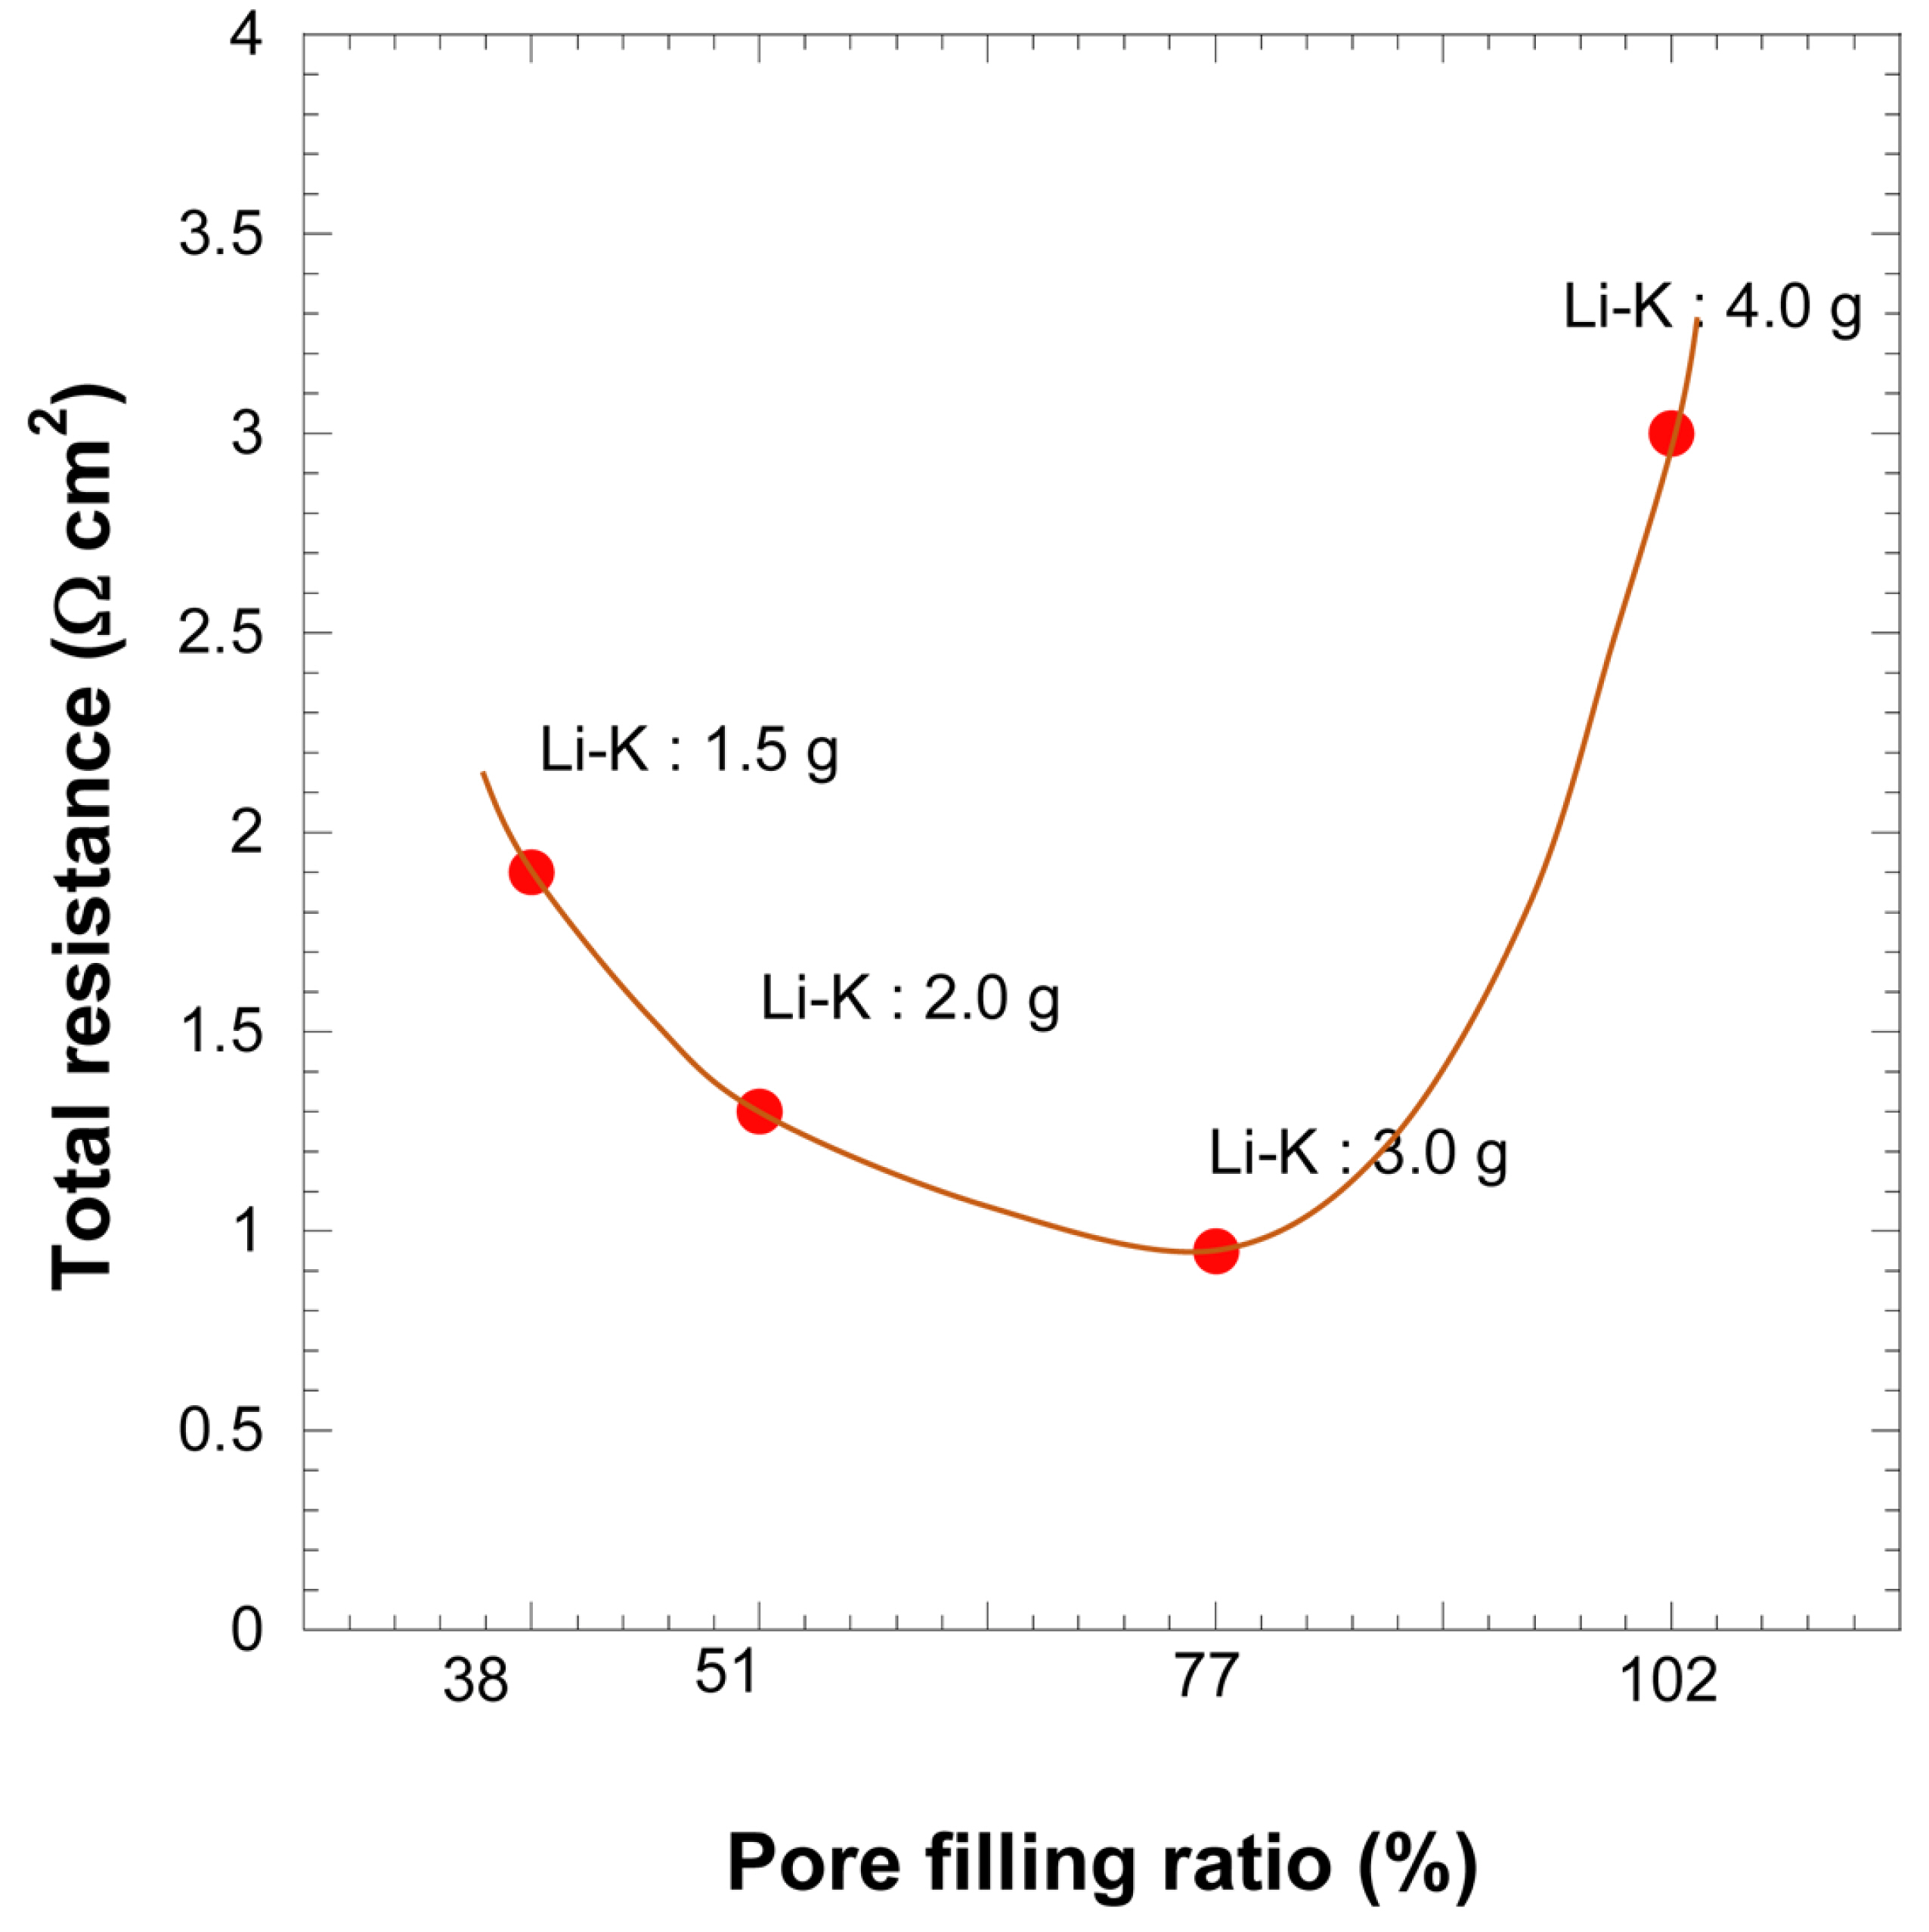
The total polarization resistances of coin-type MCFCs with various Li-K electrolyte amounts.
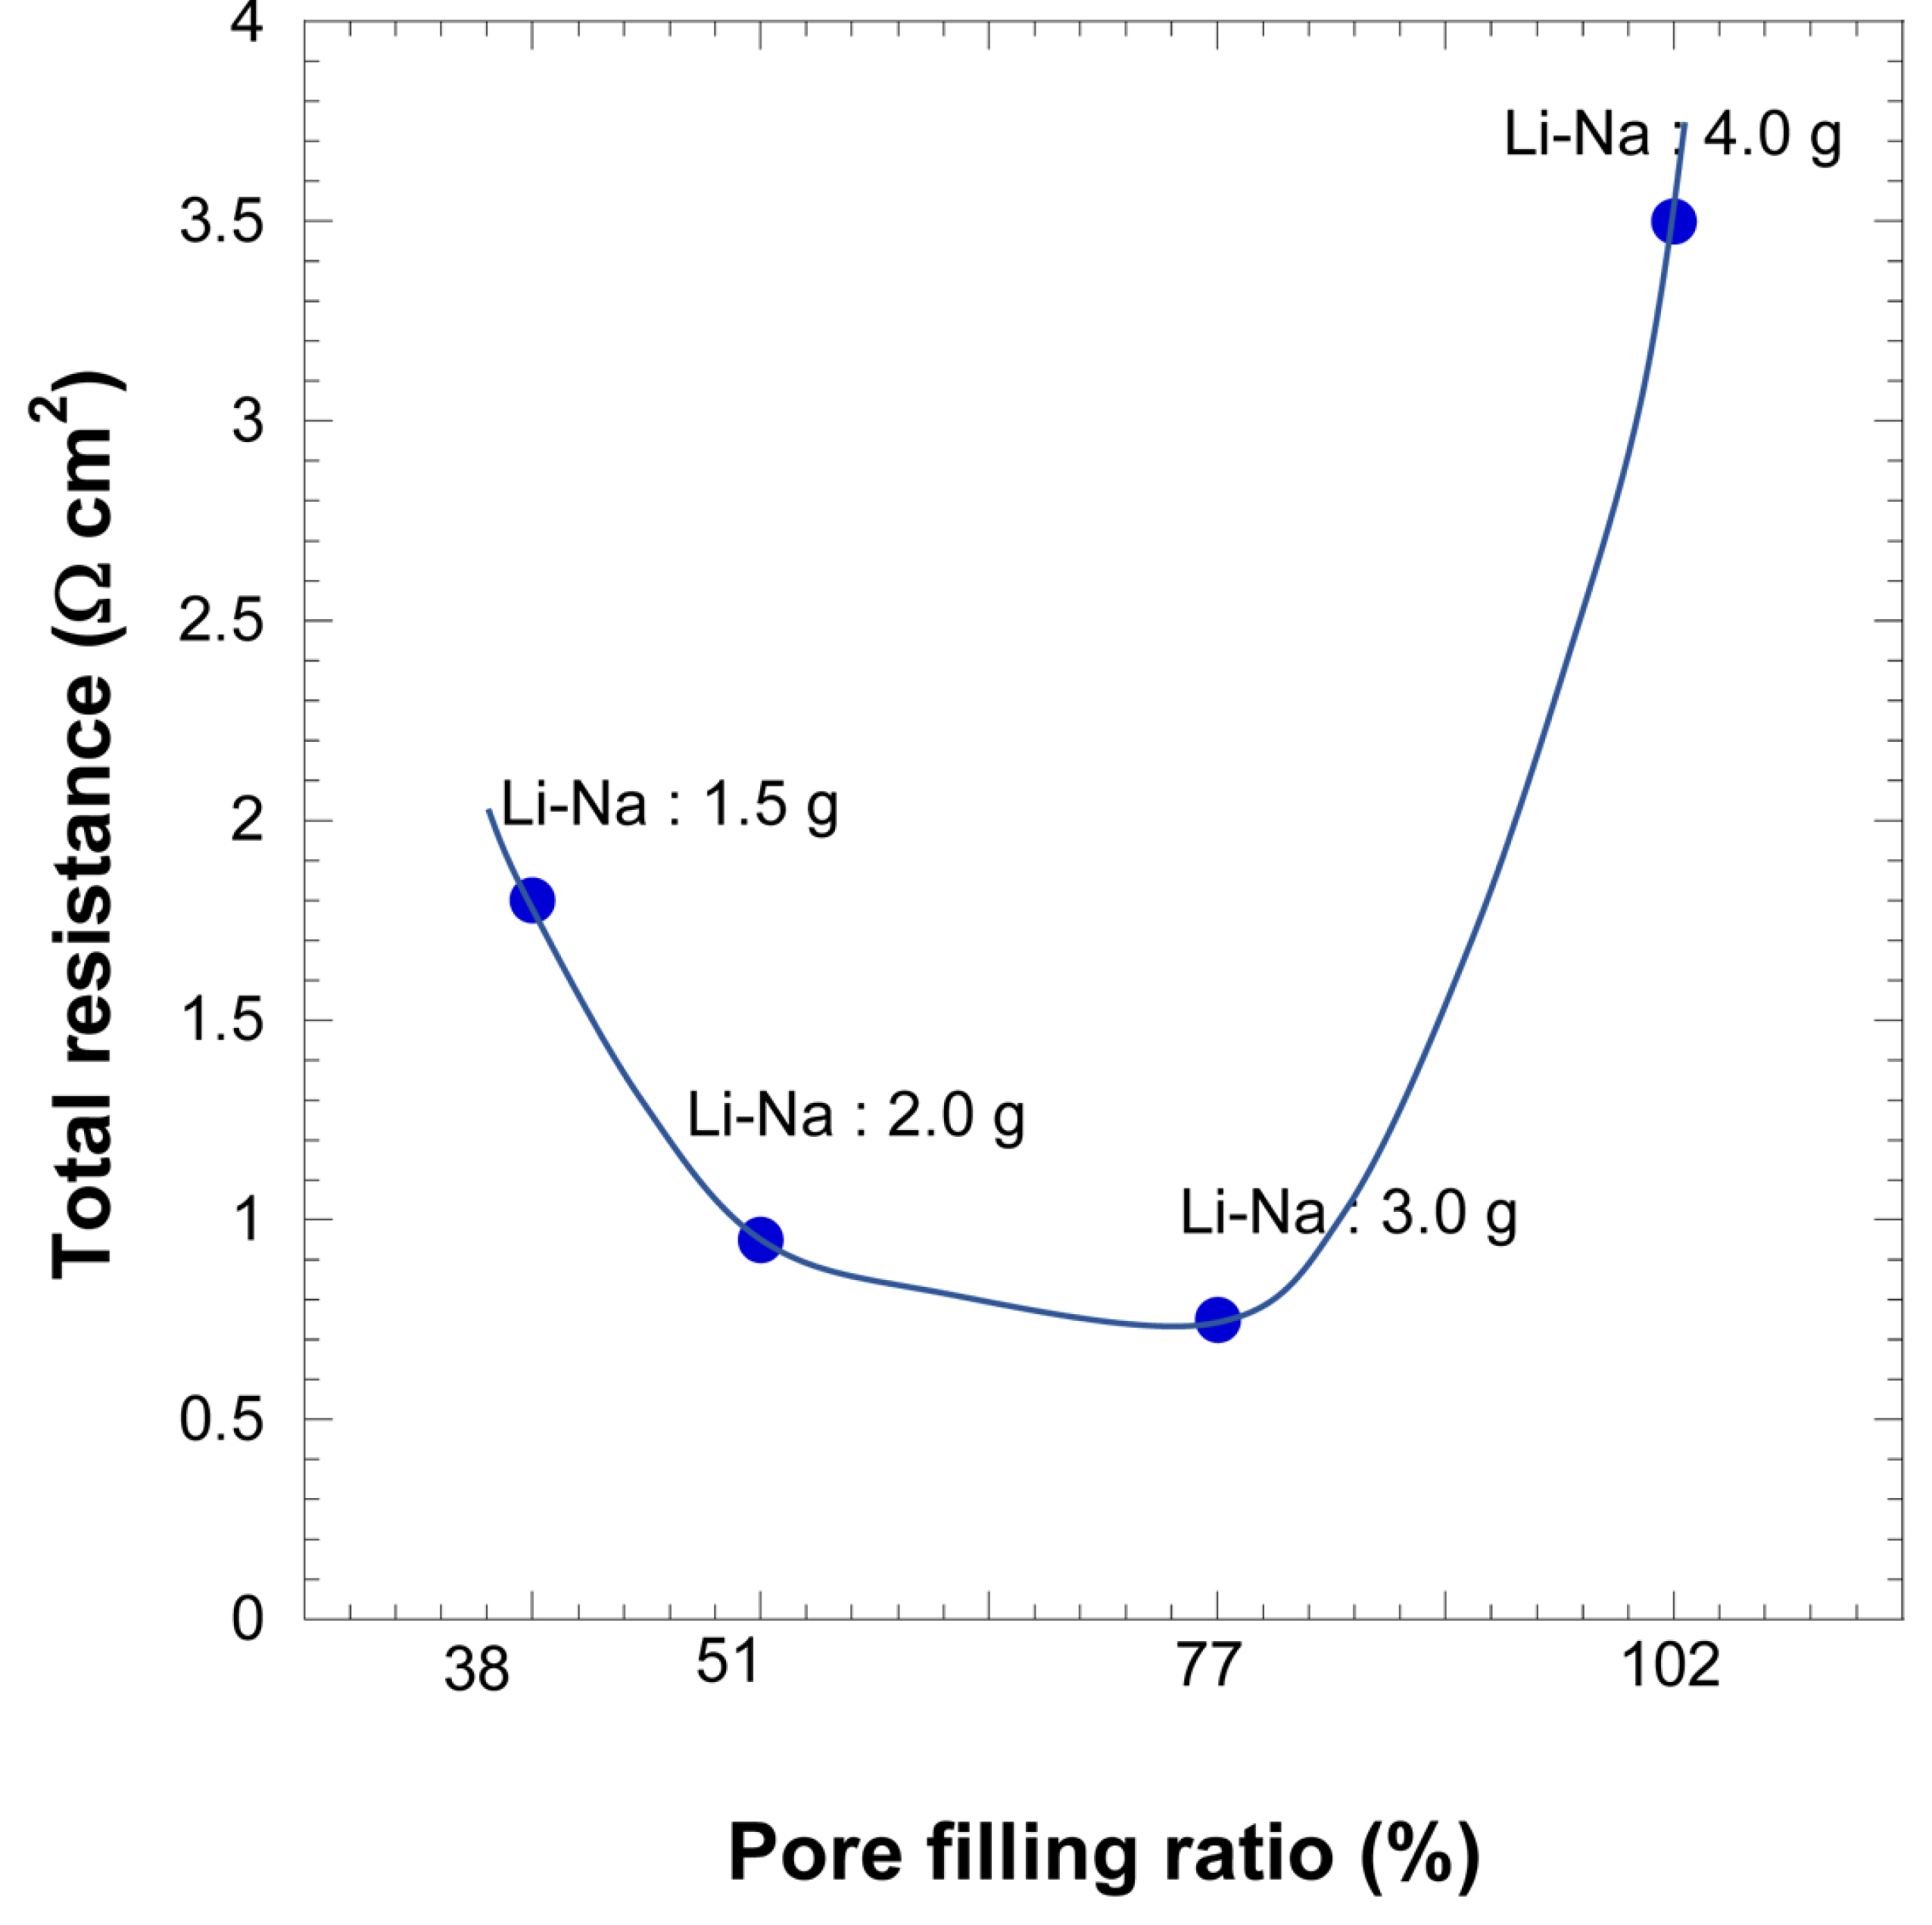
The total polarization resistances of coin-type MCFCs with various Li-Na electrolyte amounts.
The PFRs for 1.5, 2.0, 3.0, and 4.0 g of both electrolytes are 38, 51, 77, and 102%, respectively, using equation (3).
The correlation between the total resistance and PFR for Li-K electrolyte shows that the minimum total resistance occurs at 77% PFR. In addition, the total resistance from 38 to 77% and 77 to 102% is increased drastically compared to that at 77% PFR. The total resistance is affected greatly even with very small changes in the amount of electrolyte, i.e., a difference of 0.5 g.
Similar observations are obtained from the PFR trend of the Li-Na electrolyte. However, unlike in the Li-K electrolyte, the section from 51 to 77% PFR shows a smaller slope with the other sections having higher slopes than those of the Li-K electrolyte. This indicates that the optimal range of electrolyte amounts is broader in 51-77% than that of the Li-K electrolyte; however, the cell performance in other PFR ranges is lower than that of Li-K electrolyte. This result reveals that the performance of the cell is very sensitive to the amount of electrolyte; the allowable electrolyte amount range is thus very narrow.
Fig. 9 shows the relationship between the initial amount of electrolyte used and the WRR after 12 h of cell operation using both electrolytes. In order to estimate the remaining amount of electrolyte in the cell, the WRR was measured by dissolving the cell components in acetic acid and measuring the difference between the weight before dissolution (WBD) and weight after dissolution (WAD). Equation (4) was then used to calculate the WRR as shown below:
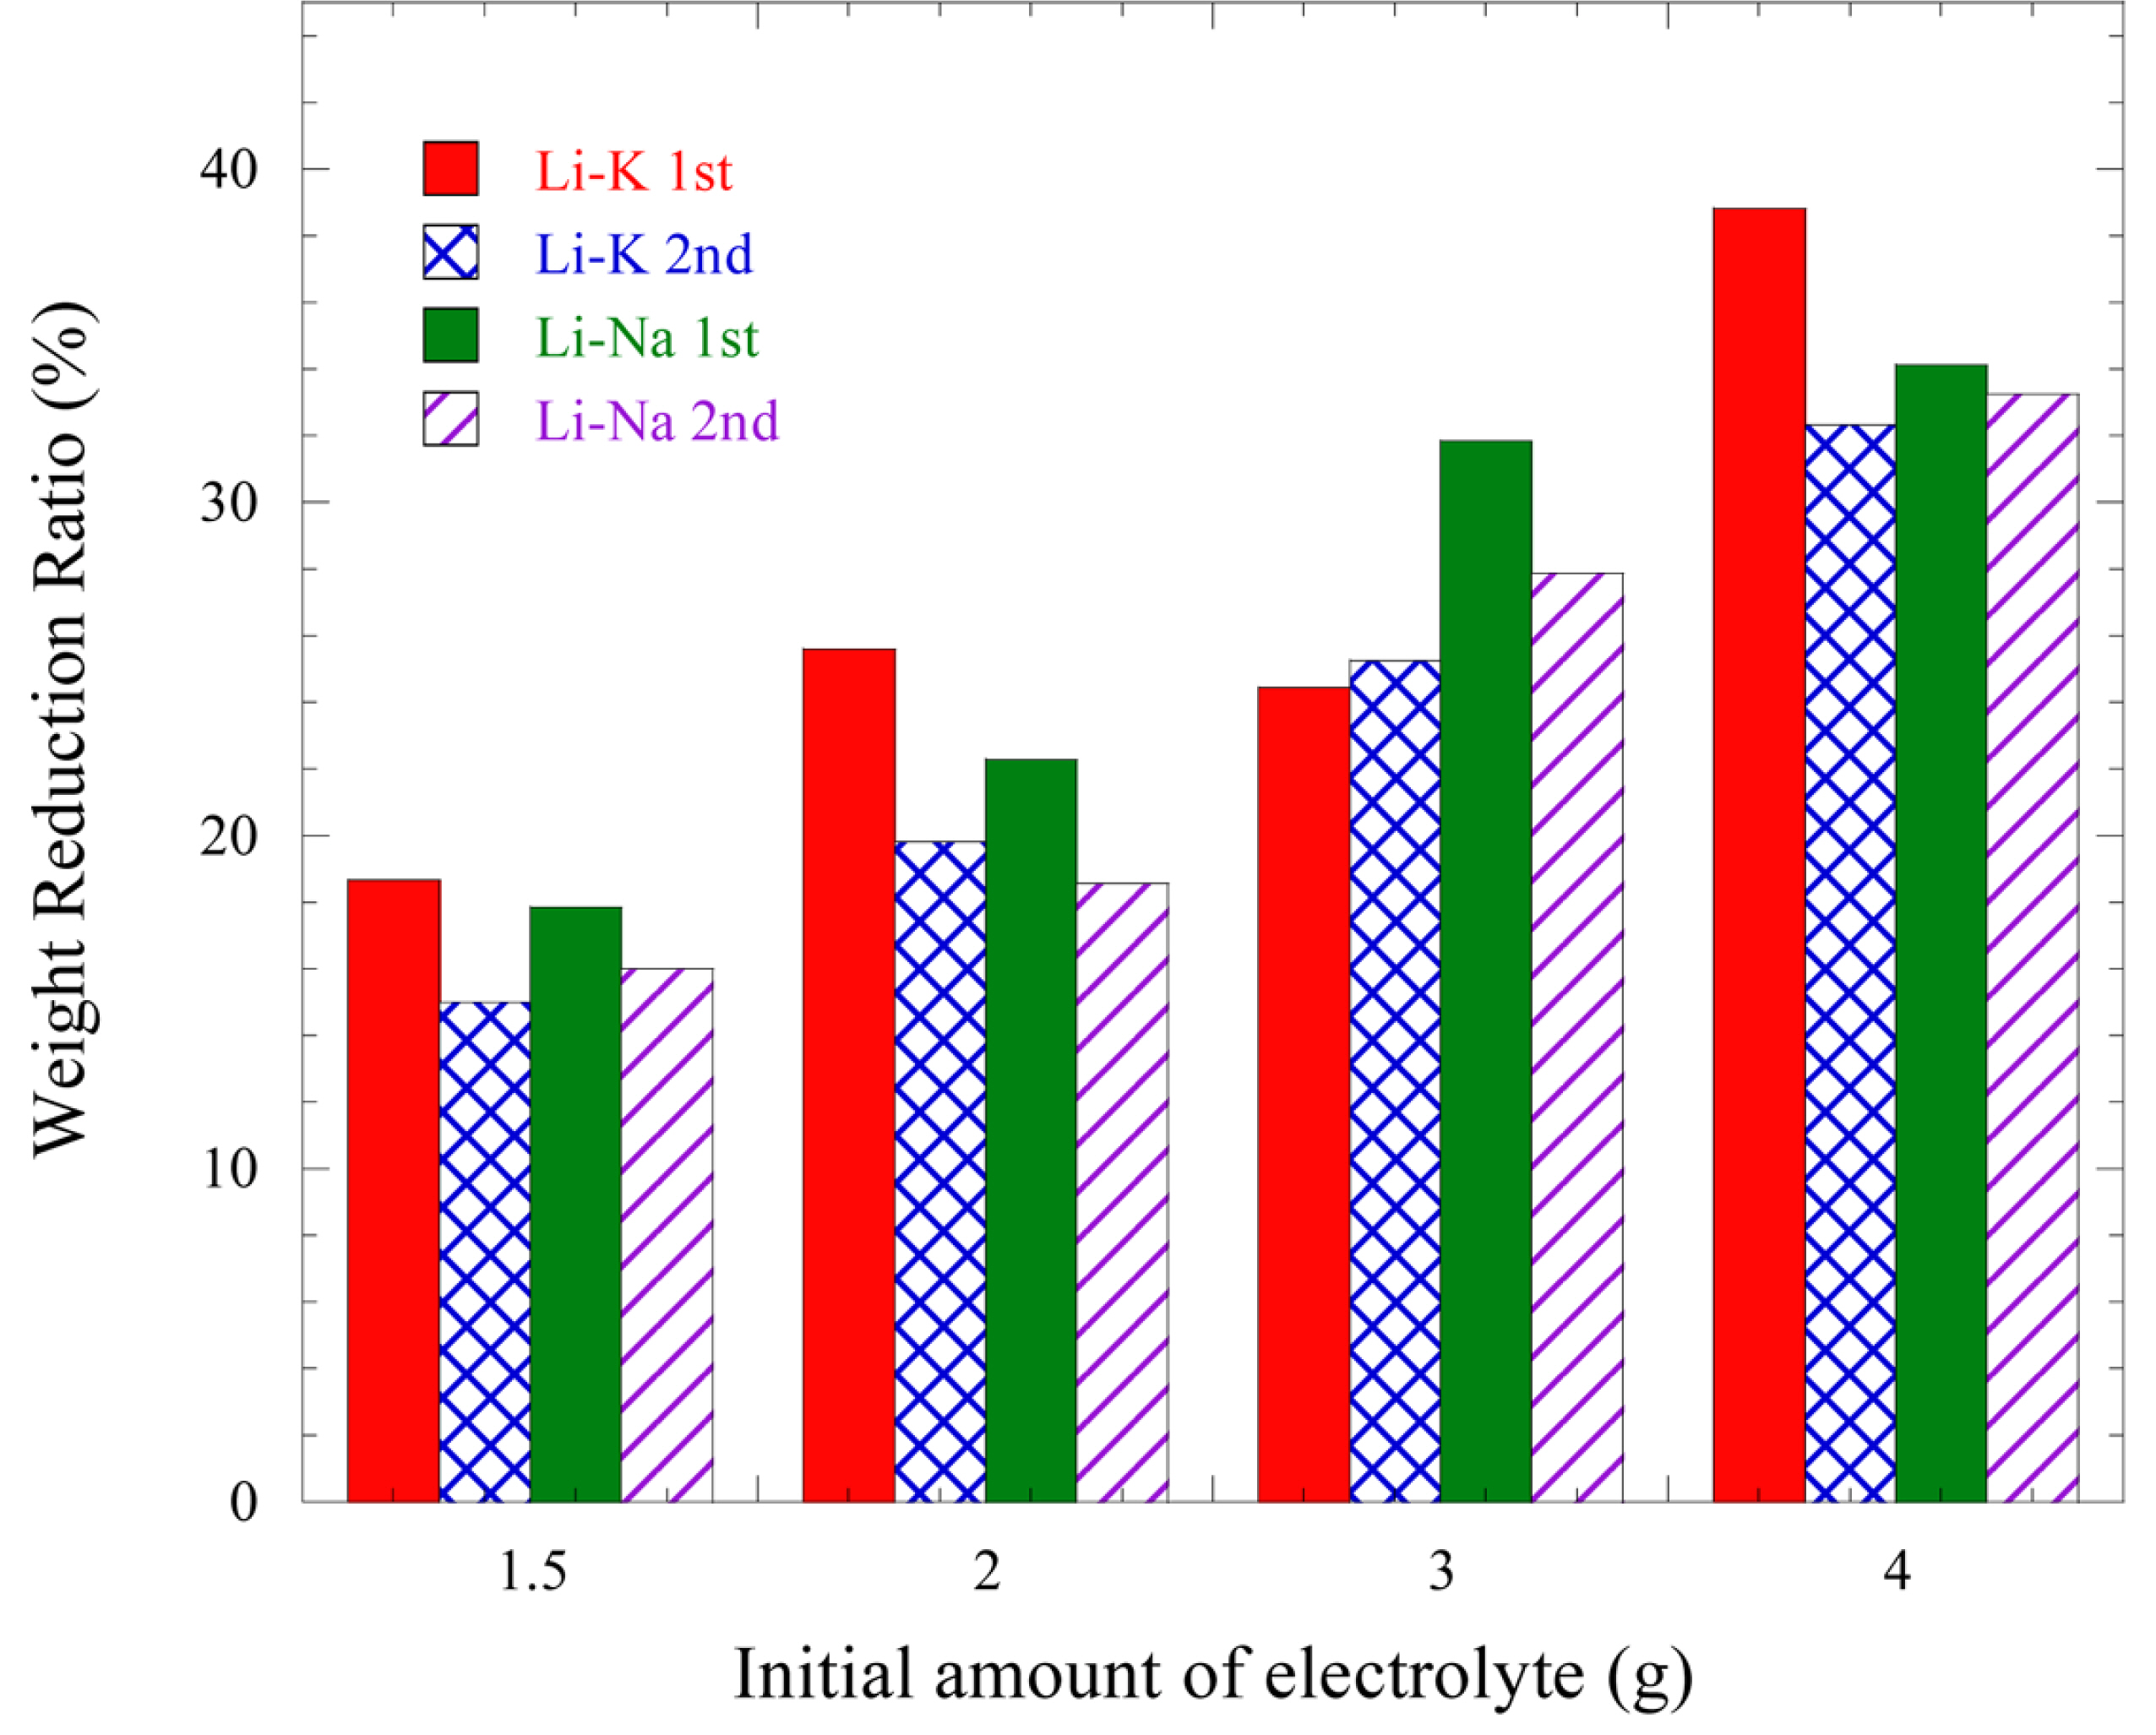
The correlation between initial amount of electrolyte and WRR after dissolution in 10 wt% acetic acid.
Each cell was tested two times under conditions of 1.5, 2.0, 3.0, and 4.0 g of electrolytes. Both electrolytes show an increase in WRR as the electrolyte amount is increased. However, experimental errors showed insignificant differences in the WRR values. Therefore, although there were some sorts of errors, it can be seen that the electrolyte WRR is linearly related to the initial amount of each electrolyte. Thus, it is possible to estimate the remaining amount of electrolyte in the cell after operation, because the cell was operated for several hours and the loaded amount of electrolyte could be considered as the remaining amount of electrolyte.
Fig. 10 shows the relationship between the amount of electrolyte and WRR using the correlation from Fig. 9. The WRR clearly shows a linear relationship with the initial amount of both electrolytes, despite slight deviations. The relationships are expressed in Eqs. (5) and (6).
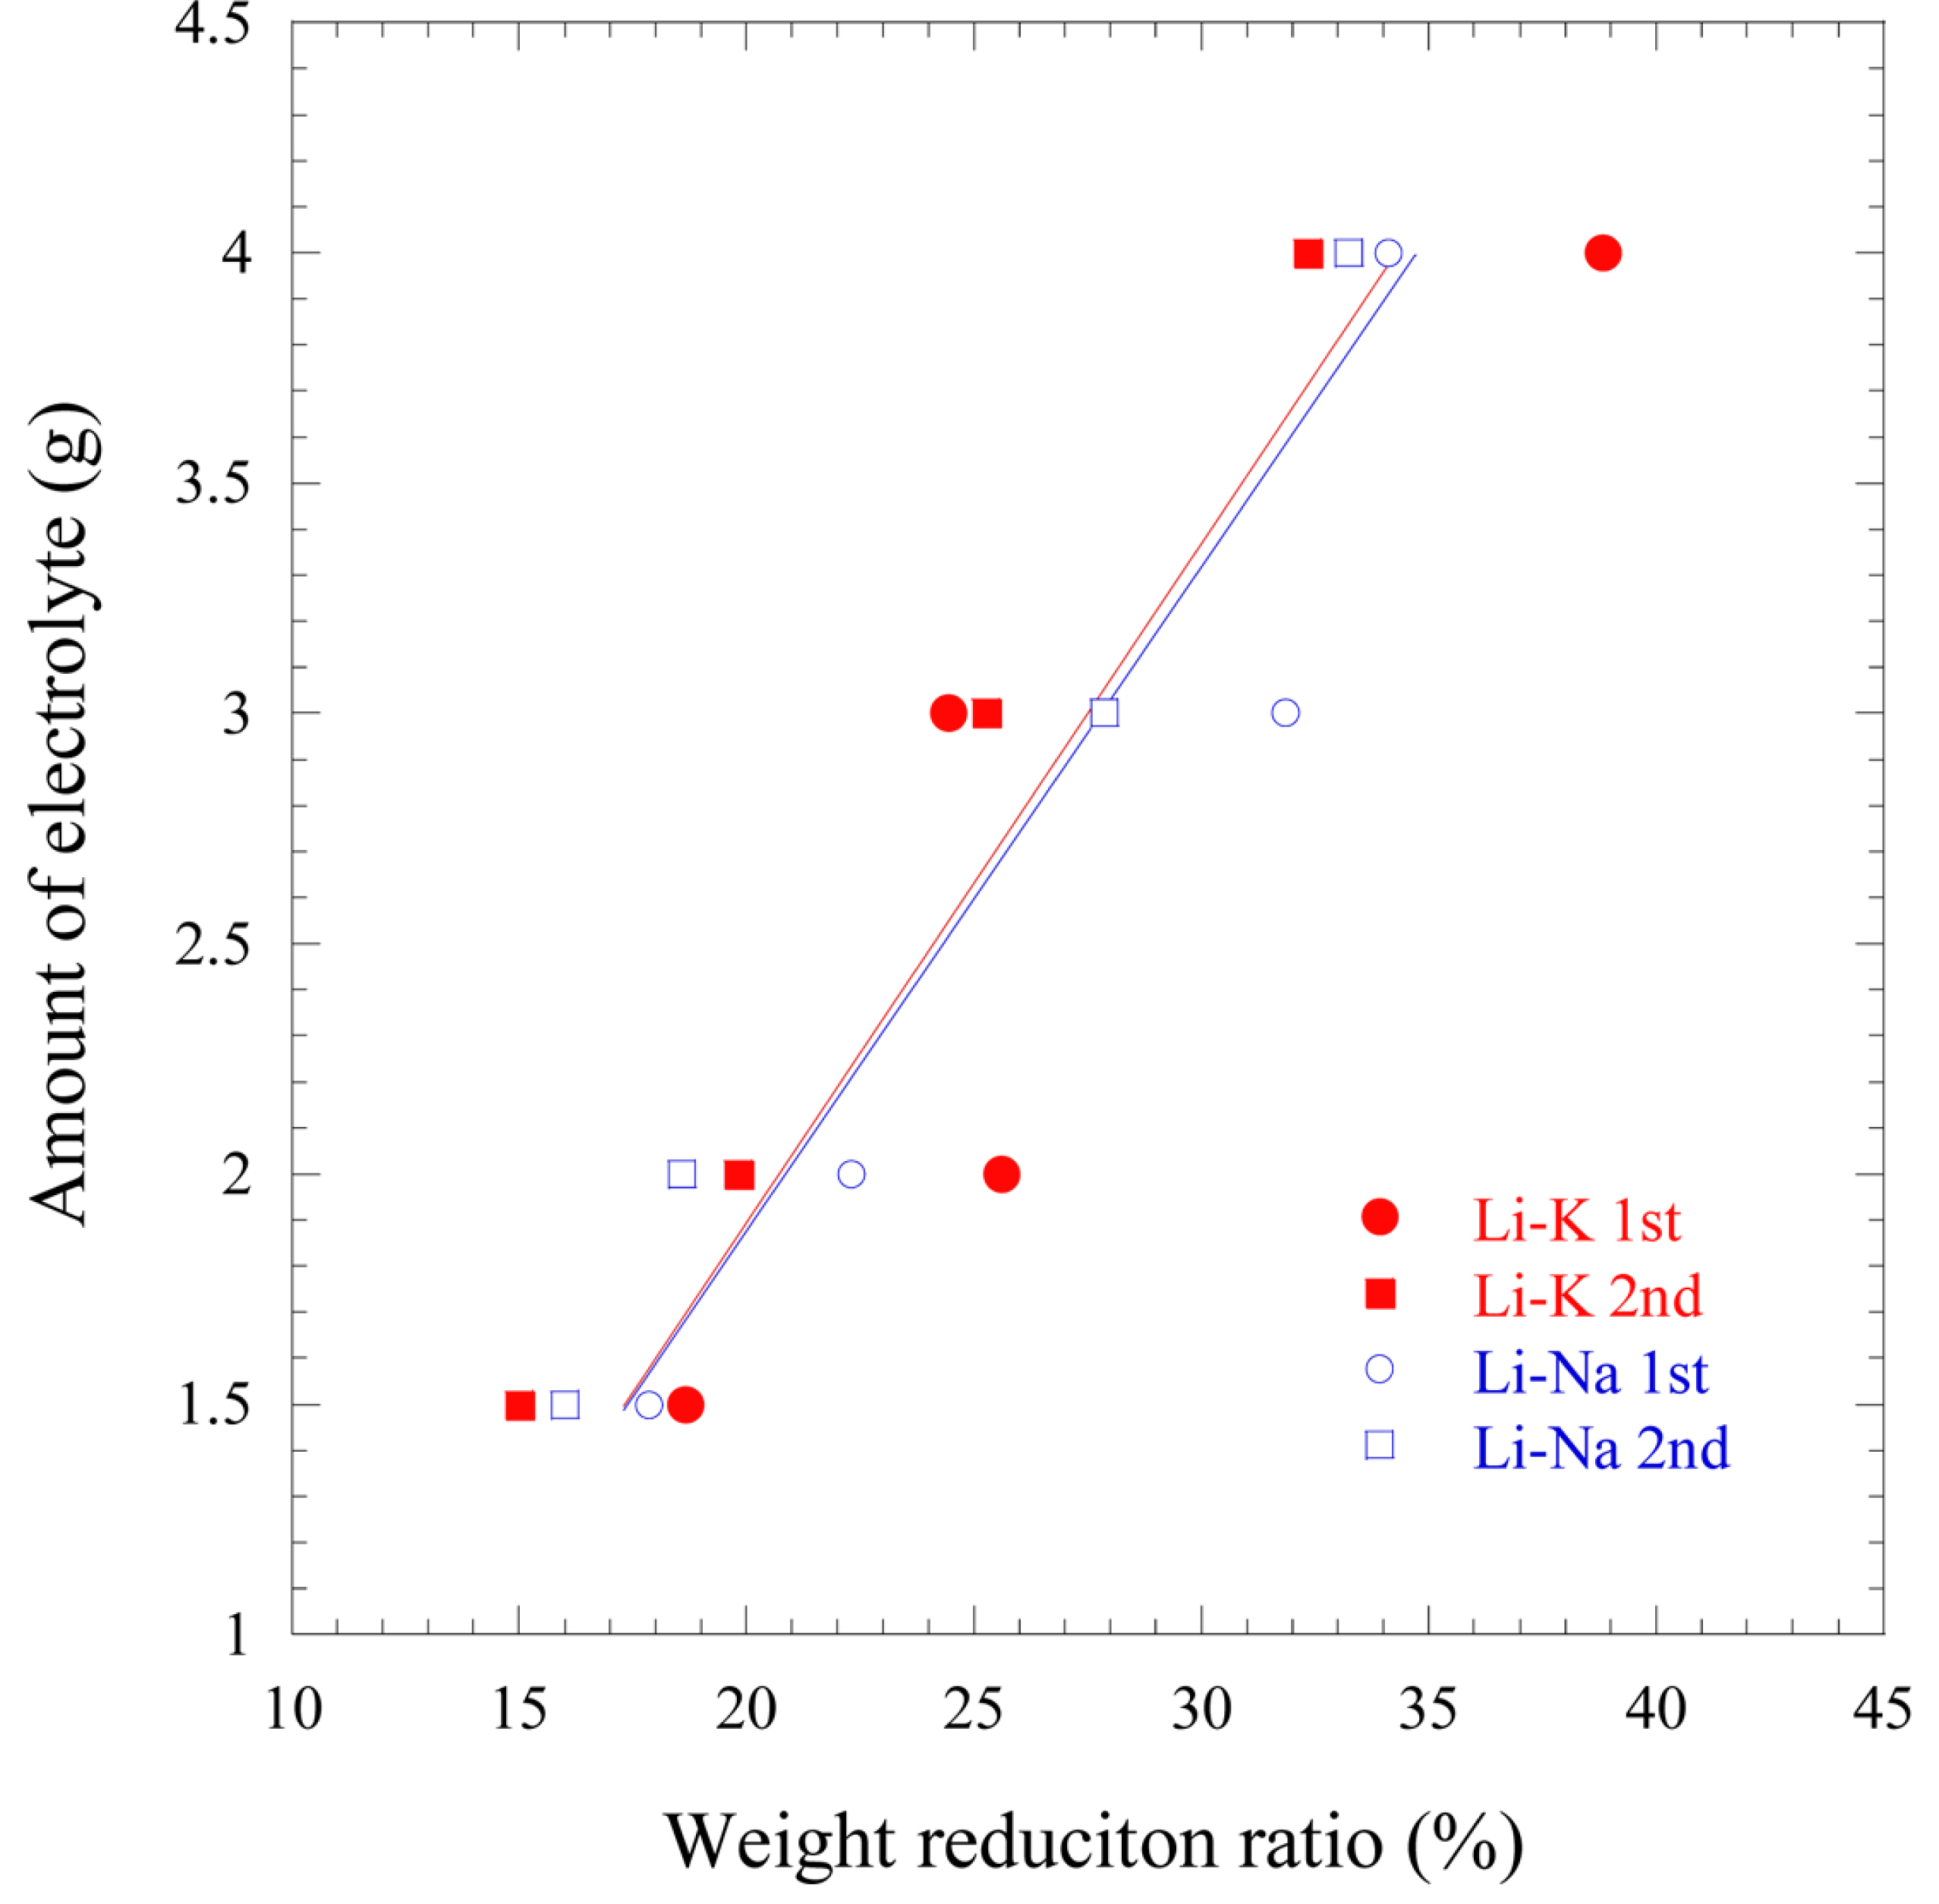
Relation between the amount of electrolyte and WRR in coin cells utilizing Li-K and Li-Na carbonate electrolytes.
where y is the remaining amount of electrolyte (g); x is the WRR (%). Therefore, it can be said that the equations above can be used to calculate the remaining amount of electrolyte in the cell. In addition, it can be seen that the WRR performed with vacuum filtering is larger than that of the equation y = 0.13x − 0.08, which was reported by the previous study [14]. This implies that the paper filtering method used in the previous experiment permitted reaction between moisture in the air and the carbonate electrolyte during filtering, which caused further reduction in the weight of the electrolyte. Thus, when the electrolyte analysis is performed using vacuum filtering, the error in calculating the remaining electrolyte through the WRR can be reduced.
4. Conclusions
This study compared the performances of Li-K and Li-Na electrolytes in MCFCs using analysis techniques such as SSP and SC. It was found that the cell performance was influenced by the amount of electrolyte, irrespective of the electrolyte species. Cells using 3.0 g of both electrolytes showed the highest EOCV and the lowest total overpotentials of 1.078 V and 142 mV for the Li-K electrolyte and 1.072 V and 130 mV for the Li-Na electrolyte, respectively. The impedance analysis showed that the internal resistance and total overpotential of the cell using Li-Na electrolyte were only 0.19 and 0.78 Ω·cm2, similar to the obtained values for cells using Li-K electrolytes. This implied that there was no significant difference in the performances of cells using the two electrolytes. At electrolyte amounts of 4.0 g, the total overpotentials of both electrolytes were increased due to flooding. The Li-Na electrolyte was affected more significantly by flooding than the Li-K electrolyte. Both electrolytes showed the best performance at 77% PFR. Thus, in order to obtain the optimum performance of the cell, it is necessary to use an electrolyte that can have about 77% PFR. Finally, the linear relation between the WRR and remaining electrolyte amount was deduced. Thus, the remaining amount of electrolyte in a cell after operation can be estimated.
Acknowledgements
This research was supported by the Cooperation of Industrial R&D Programs of the Korea Institute of Energy Technology Evaluation and Planning (KETEP) granted financial resource from the Ministry of Trade, Industry and Energy, Republic of Korea (No. 20163030031860)