Assessment of Low Carbon Steel Corrosion Inhibition by Eco-Friendly Green Chaenomeles sinensis Extract in Acid Medium
Article information
Abstract
The impact of methanol extract of Chaenomeles sinensis (C. sinensis) leaves on acid corrosion of low carbon steel was assessed by gravimetric and electrochemical methods. Phytochemical characterization by total phenolic content (TPC), and total flavonoids content (TFC) of the extract was performed. The TPC and TFC concentrations were identified as 193.50 and 40.55 mg/g. Efficiency increased remarkably in the presence of inhibitor and found as concentration dependent. A maximum inhibition efficiency of 93.19% was achieved using 2000 ppm of the C. sinensis inhibitor. Impedance and surface morphology analysis by SEM and AFM revealed that the anticorrosive activity results from the protective film of phytochemical components of C. sinensis extract adsorbed on the metal surface.
1. Introduction
Low carbon steel is one of the important category of materials widely used in industries due to its superior structural and mechanical properties, high technological value and wide range of industrial applications [1]. Indeed, acid solutions are extensively used in industries for applications including acid pickling, ore production, cleaning of boilers, industrial cleaning, acid descaling, oil and well acidizing, and petrochemical processes [2-4]. Corrosion of low carbon steel in such environments constitutes complex problems in industrial processes. The corrosion preventive methods include application of protective coatings, use of corrosion -resistant materials or control of the environment [5]. The selection of material or method of production is based on the environmental condition and economic limits. Corrosion inhibitors are widely employed to control low carbon steel corrosion in acidic environments. The major industries using corrosion inhibitors include petroleum refining, oil and gas exploration and production, water treatment, chemical manufacturing, and the product additive industries. The overall consumption of corrosion inhibitors in United States, has doubled up from ≈$600 million in 1982 to about $1.1 billion in 1998 [6]. US demand for corrosion inhibitor alone is forecast to rise 4.1 billion % per year to $2.5 billion in 2017, with volume demand approaching 1.7 billion pounds [7]. This continuous demand made the researchers to pay more attention to develop cost effective corrosion inhibitors with improved performance and better environmental profiles.
The usefulness of the inhibitor depends mainly on its ability to adsorb on metal surface through either physisorption or chemisorption processes or a combination of both. Diverse chemical functionalities employed in the organic adsorption type inhibitors formulation also play a vital role in the adsorption of inhibitor molecules on the metal surface. In general organic molecules with electronegative functional groups, hetero atoms such as S, P, N and O atoms, π electrons in triple and conjugated double bonds function as efficient corrosion inhibitors as they are readily adsorbed on the metal surface [8-11]. Unfortunately most of the reported corrosion inhibitors, still used in industry are expensive, highly toxic and hazardous to the environment [12,13]. Strict environmental guidelines that have been implemented in the recent years, divert the researchers to develop non-toxic and eco-friendly alternatives to replace the organic inhibitors.
Plants extracts, incredibly rich sources of naturally synthesised organic compounds gain importance as eco-friendly, bio-compatible, readily available and renewable resource. Recently several scientific investigations have been carried out to study the inhibitory action of various plant extracts containing poly phenolic compounds, tannins, alkaloids as well as carbohydrates. The reported extracts include, Rhus verniciflua [14], Aster koraiensis [15], Tragia plukenetii [16], Ligularia fischeri [17], Hibiscus sabdariffa [18], Eleusine aegyptiaca, Croton rottleri [19], Phoenix dactylifera [20], Piper guincense [21,22], Artememesia pallens [23], Schinopsis lorentzii [24], Lawsonia inermis [25], Oxandra asbeckii [26], Azadirachta indica [27], Justicia gendarussa [28] and Phyllanthus amarus [29].
Chaenomeles sinensis (C. sinensis), with a common name Chinese-quince is a deciduous spiny shrub, belonging to the family Rosaceae, native of Japan, Korea and China [30]. C. sinensis is an important medicinal plant possessing antiinfluenza, antioxidant, antiulcerative, antiviral, antihemolytic, antipruritic, antibacterial, anti-inflammatory effects and radical scavenging activities [31-33]. The present study was undertaken to study the corrosion inhibitive property of methanol extract C. sinensis leaves for low carbon steel in 1M H2SO4 by non-electrochemical (weight loss method), electrochemical (potentiodynamic polarization and AC-impedance) studies, Fourier transform infrared (FT-IR), scanning electron microscopy (SEM) and atomic force microscopy (AFM).
2. Experimental
2.1. C. sinensis plant extract
C. sinensis leaves collected and were surface washed thoroughly with tap water to remove the adhering unwanted impurities. Then the leaves were rinsed with distilled water and shade dried for one month. Dried leaves were crushed in a grinder and powdered. This powdered plant material (300 g) was soaked in 1 L of methanol solvent at room temperature (303 ±1K) for 5 days. The solvent was changed at intervals of 24 hours time interval. The extract was filtered using Whatmann Grade 1 filter paper and evaporated to remove the excess solvent and dried in a rotatory evaporator.
2.2. Total phenolic and total flavonoid content
Total phenolic compounds (TPC) and total flavonoid content (TFC) of the plant extract was estimated by Folin-Ciocalteu (FC) method using an Optizen 2120 ultraviolet (UV) spectrometer (Mecasys, Korea). To 0.1 mL of sample 1.9 mL of distilled water and 1 mL of FC reagent was added. To this 1 mL of 20% sodium carbonate was added and incubated at 298 ± 1 K for 2 h. After incubation absorbance was measured at 765 nm against blank. The same procedure was followed for blank preparation after which the values were calculated and expressed as mg of gallic acid equivalent (GAE). For flavonoid content, 100 mg/mL of extract was added to 10% aluminium chloride, 1 M potassium acetate and 4.3 mL of distilled water. This was incubated at 303 ±1K for 30 minutes which was then read at 415 nm for measuring the absorbance. The TFC was expressed as quercetin equivalent [34].
2.3. Anticorrosive property of C. sinensis extract
2.3.1. Weight loss method
Weight loss measurements were performed on metal specimens of dimensions 3 cm × 1 cm × 0.05 cm of composition 0.079% C, 0.025% P, 0.018% S, 0.021% Mn and the rest Fe. Mirror finish of the metallic surface was attained by standard surface finishing procedure with Silicon Carbide papers followed by degreasing with acetone. Weight loss measurements were done in 1M H2SO4 with suspension of pre-weighed metal specimens for 1, 3 and 5 hours duration in the absence and presence of 400-2000 ppm of C. sinensis extract at 303 ±1 K. After the exposure the specimens were cleaned, dried and reweighed. From the mass loss the corrosion rate and inhibition efficiency (% IE) were calculated as,


Wi and Wb are the weight loss per 1 cm2 area with and with-out C. sinensis extract. W = Wb - Wi, T is the time of exposure in hours, A is the exposed surface area (cm2) and D is the density of metal specimen (g/ cm3).
2.3.2. Electrochemical measurements
Electrochemical measurements were done with three electrode cell assembly consisting of low carbon steel rod embedded in thermoplastic resin with the exposed cross sectional area of 1 cm2 as working electrode, platinum foil as counter electrode and saturated calomel as standard reference electrode. All electrochemical measurements were performed at room temperature with 100 mL electrolyte in the absence and presence of C. sinensis extract on IVIUM compactstat instrument. Cathodic and anodic Tafel plots were recorded by polarizing the mild steel specimen at a potential of ± 200 mV vs open circuit potential at a scan rate of 1m V/sec. The corrosion kinetic parameters were obtained using IVIUM soft software. IE (%) was computed with the below expression,

Icorr(b) and Icorr(i) are the corrosion current densities in the absence and presence C. sinensis extract. Impedance measurements was made after the open circuit potential has attained over a frequency range of 10 kHz to 0.01 Hz with a signal amplitude perturbation of 25 mV/sec. The inhibition efficiency [IE (%)] was calculated from the charge transfer resistance using the following equation,

where, Rct and R′ ct are the charge transfer resistance in 1M H2SO4 and C. sinensis extract dispersed in 1 M H2SO4.
2.3.3. Surface morphology and protective film analysis
Micrograph of low carbon steel surface immersed in 1M H2SO4 with and without 1200 ppm of C. sinensis extract were visualised using JEOL-Model JSM-6390 scanning electron microscope and atomic force microscope (NTMDT, NTEGRA Prima, Russia) containing multimode scanning probe microscope with 135 μm cantilever length, 30 μm width, 2 μm thickness and 0.36 - 6.06 N/m force constant [35]. To investigate the film formed on the metal specimen, powder samples scratched form electrode surface before and after treatment with optimal C. sinensis concentration in 1M H2SO4 was analysed by Fourier transform infrared spectroscopy (FT-IR).
3. Results and Discussion
3.1. Total phenolic and flavonoid content
Total phenolic and flavonoid content in methanol extract of C. sinensis was estimated spectrophotometrically with gallic acid as calibration standard. The results depicted in Fig. 1, indicate the existence of 193.5 mg/g of TPC and 40.55 mg/g of TFC in the methonolic extract.

TPC and TFC of C. sinensis plant.
3.2. Inhibitive performance of methanol extract of C. sinensis
3.2.1. Effect of concentration
The effect of the addition of various concentration (400, 800, 1200, 1600 and 2000 ppm) of C. sinensis on low carbon steel corrosion in 1M H2SO4 for 1, 3 and 5 hours immersion at 303 ±1K was studied by gravimetric method and the results are presented in Table 1. Analysis of the data in the presence and absence of inhibitor shows reduction in mass loss and corrosion rate with increase in C. sinensis concentration. This indicates that the tested extract inhibits metal corrosion at all the concentrations studied. Addition of inhibitor decreased the corrosion rates through adsorption of naturally synthesised active constituents present in the C. sinensis extract and mitigates corrosion [10,36]. At the optimum inhibitor concentration, 2000 ppm, 93.19% inhibition efficiency is achieved. Increase in the corrosion inhibitive performance of C. sinensis extract with rise in inhibitor concentration indicates that inhibition process is dependent on the amount of inhibitor present in the acid medium. The weight loss of low carbon steel in the presence of different inhibitors varies linearly with time & it is lower than that obtained in the inhibitor-free solution. Further, there is an increase in weight loss with an increase in immersion period for each concentration of the inhibitor. The data shows (Table 1) a decrease in inhibition efficiency for a particular concentration as immersion time increases. Analysis of results presented in Table 1, signifies that regardless of immersion time, as concentration increases the inhibition efficiency increases. The decrease in inhibition efficiency with the prolonged immersion of low carbon steel may be due to the instability of adsorbed layer on the metal surface, as a result of desorption of active constituents present in the C. sinensis extract and /or diffusion process through the interface protective layer [37].

Inhibition efficiency at various concentrations (Conc.) of C. sinensis for the corrosion of low carbon steel in 1M H2SO4 for 1, 3 and 5 hours immersion obtained by weight loss measurements at 303 ±1K.
3.2.2. Effect of temperature
Temperature dependency of inhibitor’s efficiency was analysed by weight loss measurements in the temperature range 303-333 ±1K for different inhibitor concentrations. The results portrayed in Fig. 2 shows that increase in the temperature of the corrosive environment enhances the corrosion rate which leads to the decline in the efficiency at each concentration of C. sinensis extract. The reduction in inhibition efficiency can be due to the increased effect of temperature on low carbon steel dissolution process and partial desorption of the adsorbed inhibitor molecules from metal surface [38,39]. The low inhibition efficiencies at elevated temperatures revealed that inhibitor adsorption occurs through physisorption.

Effect of temperature on the inhibition efficiency of C. sinensis for corrosion of low carbon steel in 1M H2SO4.
3.2.3. Activation parameters
The apparent activation energy (Ea) for low carbon steel dissolution in 1M H2SO4 can be expressed using the Arrhenius equation,

where, K is the Arrhenius pre-exponential factor, R is the molar gas constant and T is Temperature (K). Plot of log (Corrosion rate) vs 1/T was found to be linear (Fig. 3a) with a correlation coefficient of ≈ 0.99 and slope of, -Ea /2.303 RT from which Ea was calculated and given in Table 2. Arrhenius law predicts that increase in temperature increases the metal corrosion rate and hence Ea vary in accordance with equation 5. According to Table 2 for inhibited and inhibitor free 1M H2SO4, the Ea values are greater than 20 kJ/mol which illustrates that the entire process is controlled by surface reaction [40]. For the uninhibited system, the value of Ea was found to be 33.86 kJ and the addition of different concentrations of the C. sinensis extract raises Ea in the range from 41.66 to 76.38 kJ/mol suggesting physical adsorption of inhibitors on the metal surface. Higher Ea values can also be due to the decrease in the inhibitor adsorption on the low carbon steel surface with rise in temperature. Decrease in adsorption enhances more desorption of inhibitor molecules as these two processes are in equilibrium [41]. As a result of enhanced desorption, more surface area of the metal surface is exposed to acid attack which leads to the increase in corrosion rate at elevated temperatures [42]. Fig. 3b shows the transition state plot of log (Corrosion rate/ T) vs 1/T for metal dissolution in the absence and presence of different inhibitor concentrations. Standard enthalpy of activation, ΔH* and standard entropy of activation ΔS*, for corrosion process of mild steel in 1M H2SO4 were computed form transition state equation,

a) Arrhenius plots and b) transition state plots for corrosion rate of low carbon steel in 1M H2SO4 in the presence and absence of various concentrations of C. sinensis.

Thermodynamic parameters for the corrosion of low carbon steel in 1M H2SO4 in the absence and presence of various concentrations of C. sinensis.

where, R is the universal gas constant, N is the Avogadro’s number, h is the Plank’s constant, and T is the temperature. From the slope (-ΔH*/ 2.303R) and intercept [log (R/Nh) + (ΔS*/ 2.303R)] of linear plots of Fig. 3b, ΔH* and ΔS* were calcultaed and listed in Table 2. ΔH* values are positive, both in the absence and presence of inhibitor reflecting endothermic nature of metal dissolution process which means that low carbon steel dissolution is difficult. Further increased ΔH* values in the precsence of inhibitor compared to the blank acid solution indicate higher protection efficiency, which may be due to the presence of energy barrier for corrosion reaction. Hence the inhibitor adsorption process enhances the entalpy of corosion process. It is evident from Table 2 the ΔS* values are increased positively in the presence of various concentartions of C. sinensis extract compared to the value of -23.73 kJ/mol observed for inhibitor free 1 M H2SO4. Increased ΔS* values in the presence of inhibitors might be due to the enhanced randomness of the molecules [43].
3.2.4. Adsorption isothem
In general, the mechanism behind the metal corrosion inhibition by any inhibitor can be elucidated on the basis of adsorption isotherm, which can provide the essential information concerning the interaction occurring at the metal-inhibitor interface. For the adsorption of C. sinensis extract on the metal surface, of the various adsorption isotherms explored, the best fit was verified gaphically by fitting the degree of surface coverage values obtained by gravimetric methods to Langmuir, Temkin, and Frumkin isotherms. For the adsorption of C. sinensis extract the best fit was found with Langmuir isotherm. Langmuir isotherm relates the adsorbate concentration, C. sinensis extract in bulk of the electrolyte (c) to the surface coverage (θ) as,

Plot between C/θ and concentration (Fig. 4) produces a straight line with liner regression co-efficient close to unity indicating the applicability of Langmuir isotherm. Kads values are large indicating more efficient adsorption. From the values of adsorption equilibrium constant Kads, free energy of adsorption ΔGads, is calculated using the relation,

Langmuir adsorption isotherm plots for corrosion of low carbon steel in 1M H2SO4.

In general, ΔGads values of the order of -20 kJ/mol or lower imply electrostatic interactions (physisorption) that exist between the inhibitor and metal surface and those around -40 kJ/mol or more negative denote charge sharing or electron transfer from inhibitor to metal surface to form a co-ordinate type bond (chemisorption) [44,45]. For the adsorption of C. sinensis, ΔGads is -26.59 kJ/mol indicating combined physisorption and chemisorption of phytochemical components of the extract in which physisorption dominates.
3.3. Electrochemical measurements
3.3.1. Open circuit potential measurements
Fig. 5a, depicts the variation in open circuit potential of low carbon steel as a function of time in the absence and presence of different concentration of methanolic C. sinensis extract in 1M H2SO4. EOCP of low carbon steel in blank electrolyte is shifted towards noble direction by the addition of inhibitor. This indicates that the anodic low carbon steel dissolution reaction is delayed by the adsorption of active antioxidant phenolic components present in the extract.

a) OCP, b) Polarization plots, c) Impedance, d) Bode modulus, and e) phase angle plots for low carbon steel in 1M H2SO4 in the absence and presence of C. sinensis.
3.3.2. Tafel analysis
Typical Tafel plots obtained for polarisation of low carbon steel immersed in 1 M H2SO4 containing various concentration of C. sinensis depicted in Fig. 5b illustrates that both the cathodic and anodic half-cell reactions of low carbon steel are affected by the addition of green inhibitor in the acid induced environment. The cathodic and anodic Tafel segments of the inhibited metal are parallel to that of the uninhibited metal specimen. The electrochemical parameters derived by the Tafel extrapolation method are listed in Table 3. The corrosion potential, Ecorr values are slightly shifted towards less negative values and maximum shift is found to be 66.6 mV towards anodic region. Ecorr shift in the noble direction in the presence of inhibitor compared to the inhibitor free electrolyte suggest that the secondary metabolite antioxidant phenolic compounds of C. sinensis acts preferentially on the anodic sites and retard metal dissolution. According to Li et al., [46] for a cathodic/anodic inhibitor, shift in Ecorr is > 85 mV towards cathode/anode with respect to the blank and for a mixed type inhibitor shift in Ecorr is < 85 mV. The above results clearly reveal that C. sinensis methanolic extract function as mixed type inhibitor but predominantly anodic. The effect of inhibitor on the anodic and cathodic Tafel constants, ba and bc are not noteworthy. This signifies that C. sinensis does not alter the mechanism of metal corrosion process but affects the ratio of exposed anodic/ cathodic area. Reduction in corrosion current density, Icorr for the electrolyte with plant extract compared to the blank denotes anticorrosive effect of the inhibitor. This might result from the reduction of available surface area for the aggressive electrolyte attack due to the adsorption of phytochemical constituents of the extract on to the active sites of steel electrode. Continuous decrease in Icorr with increasing inhibitor concentration is reflected in the inhibitor efficiency, which is markedly improved as the C. sinensis concentration increased. At the optimum concentration of 2000 ppm C. sinensis extract shows 78.46% inhibition efficiency.
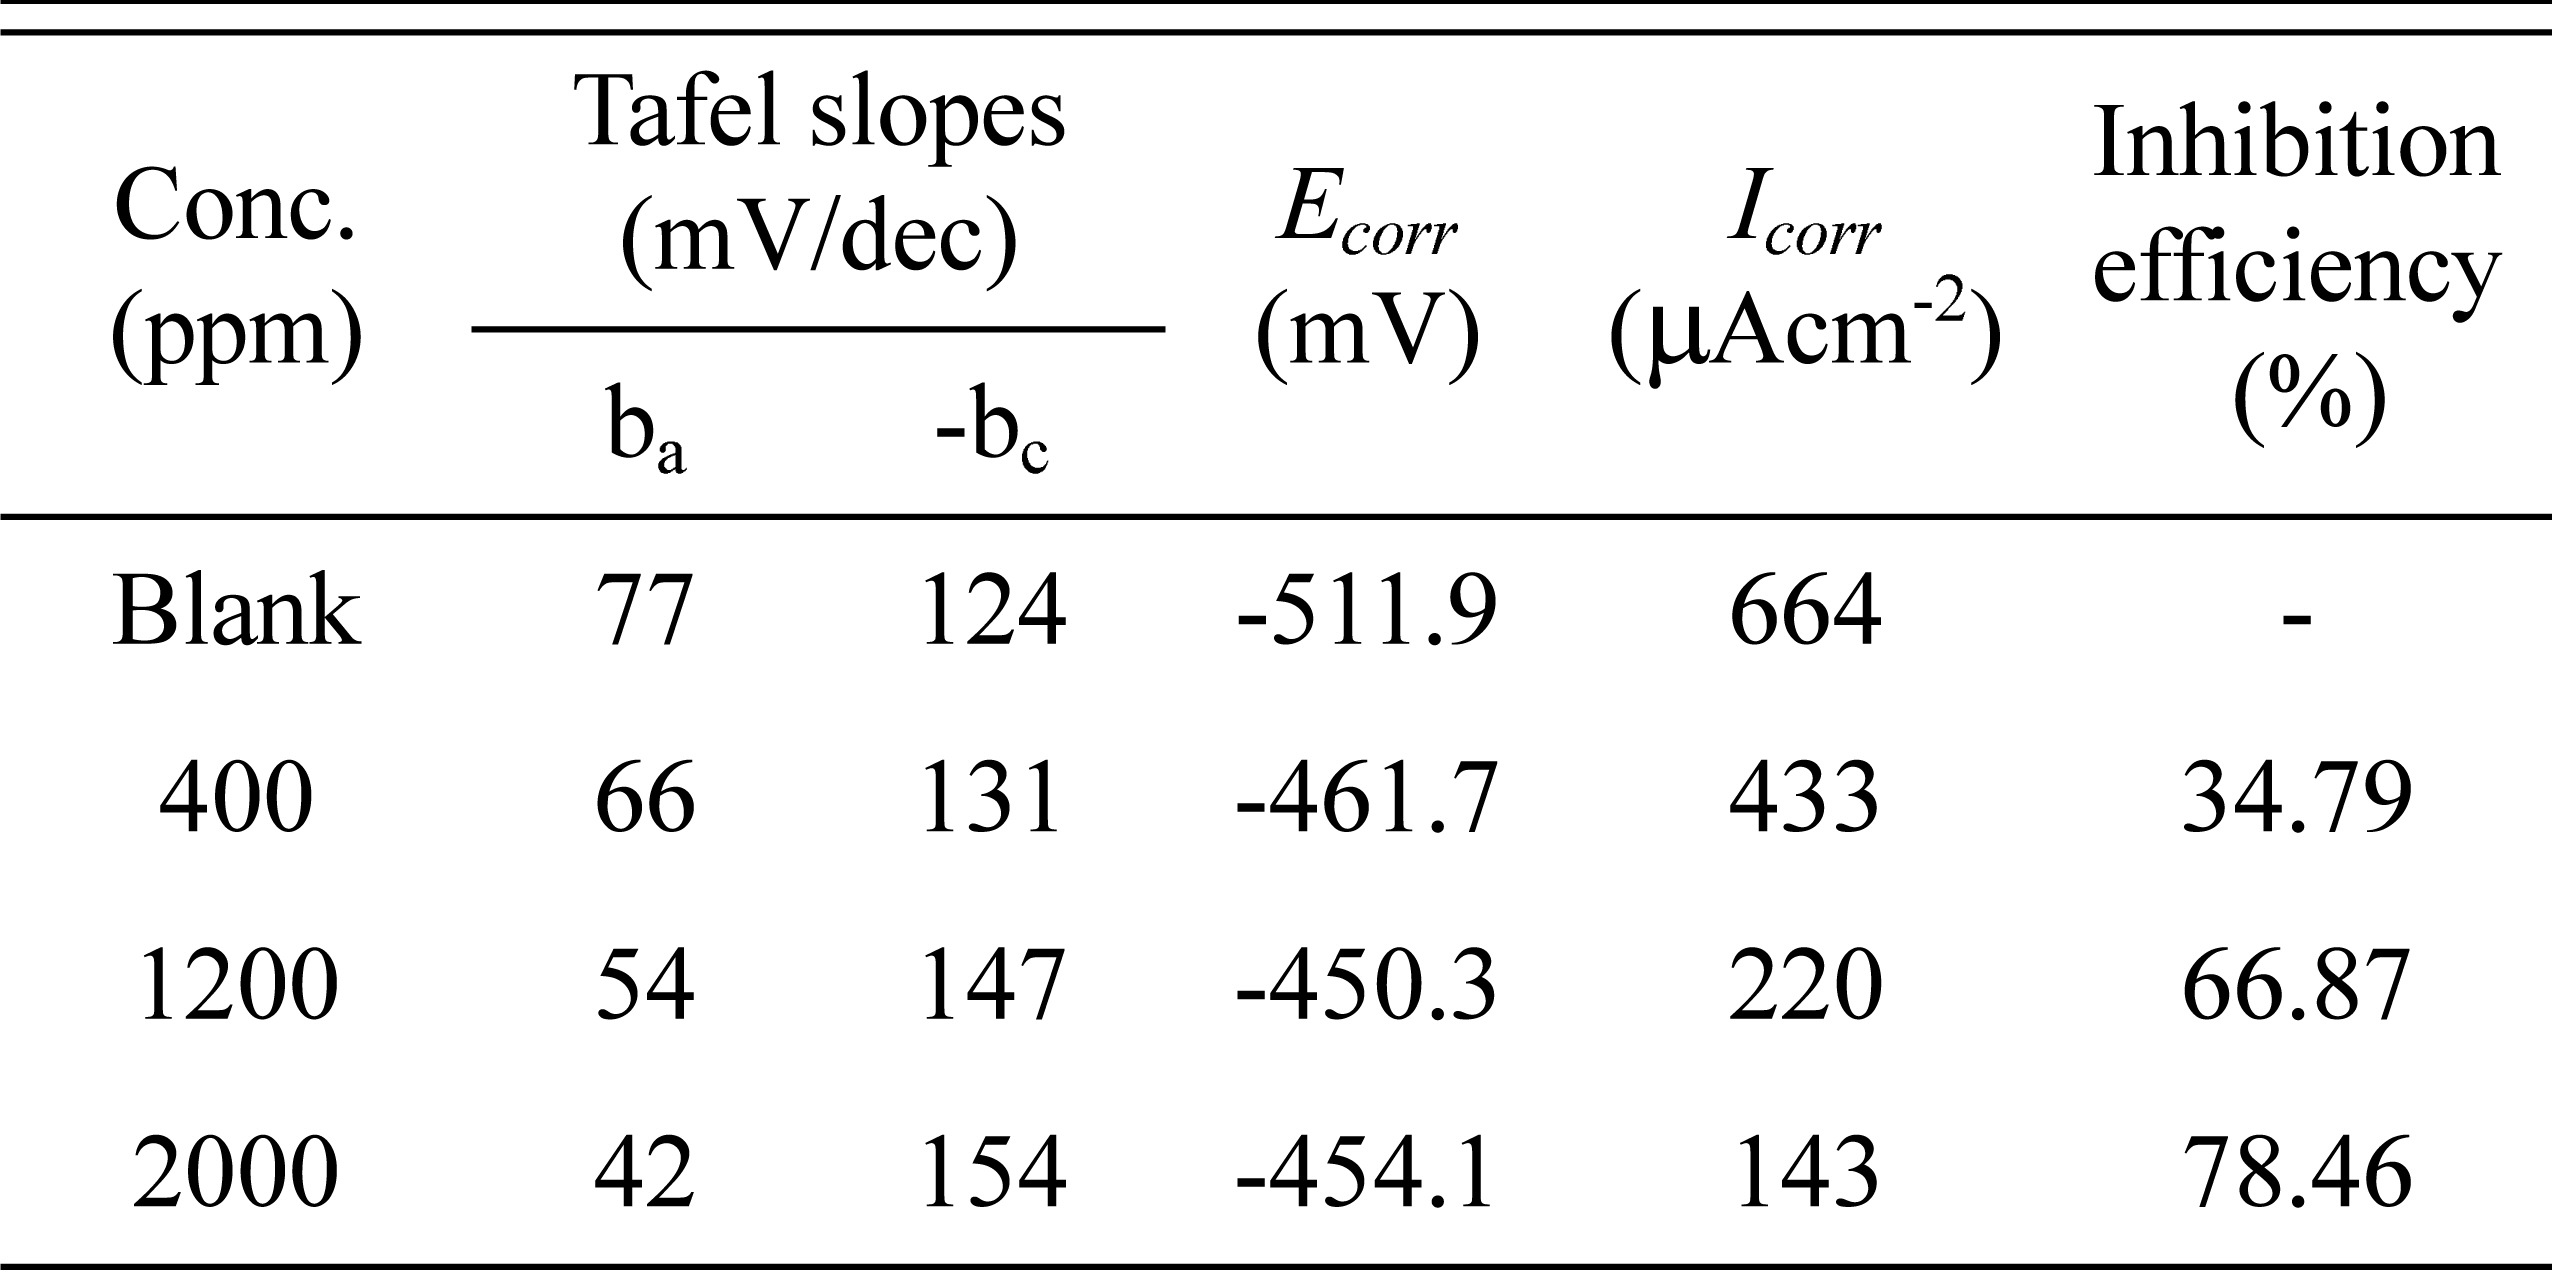
Corrosion parameters for low carbon steel at selected concentrations of C. sinensis in 1M H2SO4 by potentiodynamic polarization method at 303 ±1K.
3.3.3. Impedance measurements
Impedance analysis was performed to gain insight into the kinetics of electrochemical reaction occur at the electrode-electrolyte interface. The impedance response of low carbon steel in the absence and presence of inhibitor is depicted as Nyquist, Bode modulus and Bode phase angle plots (Fig. 5c,d,e). Impedance response of low carbon steel in blank electrolyte is altered by the introduction of methonolic C. sinensis extract. For blank electrolyte, Fig. 5c depicts single, imperfect and depressed semicircular Nyquist loop whose center displaced below the real axis. This depression of semicircle result from the frequency dispersion which is a distinctive feature of solid metal electrodes [47]. This phenomenon may also be related to the surface inhomogeneity resulting from the microscopic surface roughness and adsorption of phytochemical compounds of C. sinensis extract [48]. Also semicircular impedance plots indicate that the charge transfer controlled metal corrosion reaction is not altered by the introduction of inhibitor [49]. Increase in the diameter of the Nyquist semicircle with increasing plant extract concentration compared to inhibitor free electrolyte indicate the retardation of low carbon steel dissolution by the compact protective inhibitor film. The maximum efficiency of 89.02% is achieved with 2000 ppm C. sinensis extract. Impedance parameters obtained by equivalent circuit (Fig. 6) fit presented in Table 4, shows increase in charge transfer resistance, Rt and decrease in double layer capacitance, Cdl values. The enhanced inhibition efficiency with inhibitor concentration implied that the charge transfer process was retarded by the formation of compact inhibitoradsorption film on the steel substrate. Lower Cdl values for the inhibited solution compared to the blank acid is due to the reduced exposed area as a result of inhibitor adsorption on the electrode surface, decrease in dielectric constant and/or an enhancement in the electrical double-layer thickness. Bode plots for metal corrosion in electrolyte with and with out inhibitor are depicted in Fig. 5 shows one time constant. The phase angle values increased with increasing inhibitor concentration. This suggests the formation of protective layer coating of adsorbed inhibitor molecules on the metal surface [50].

Electrochemical equivalent circuit model.
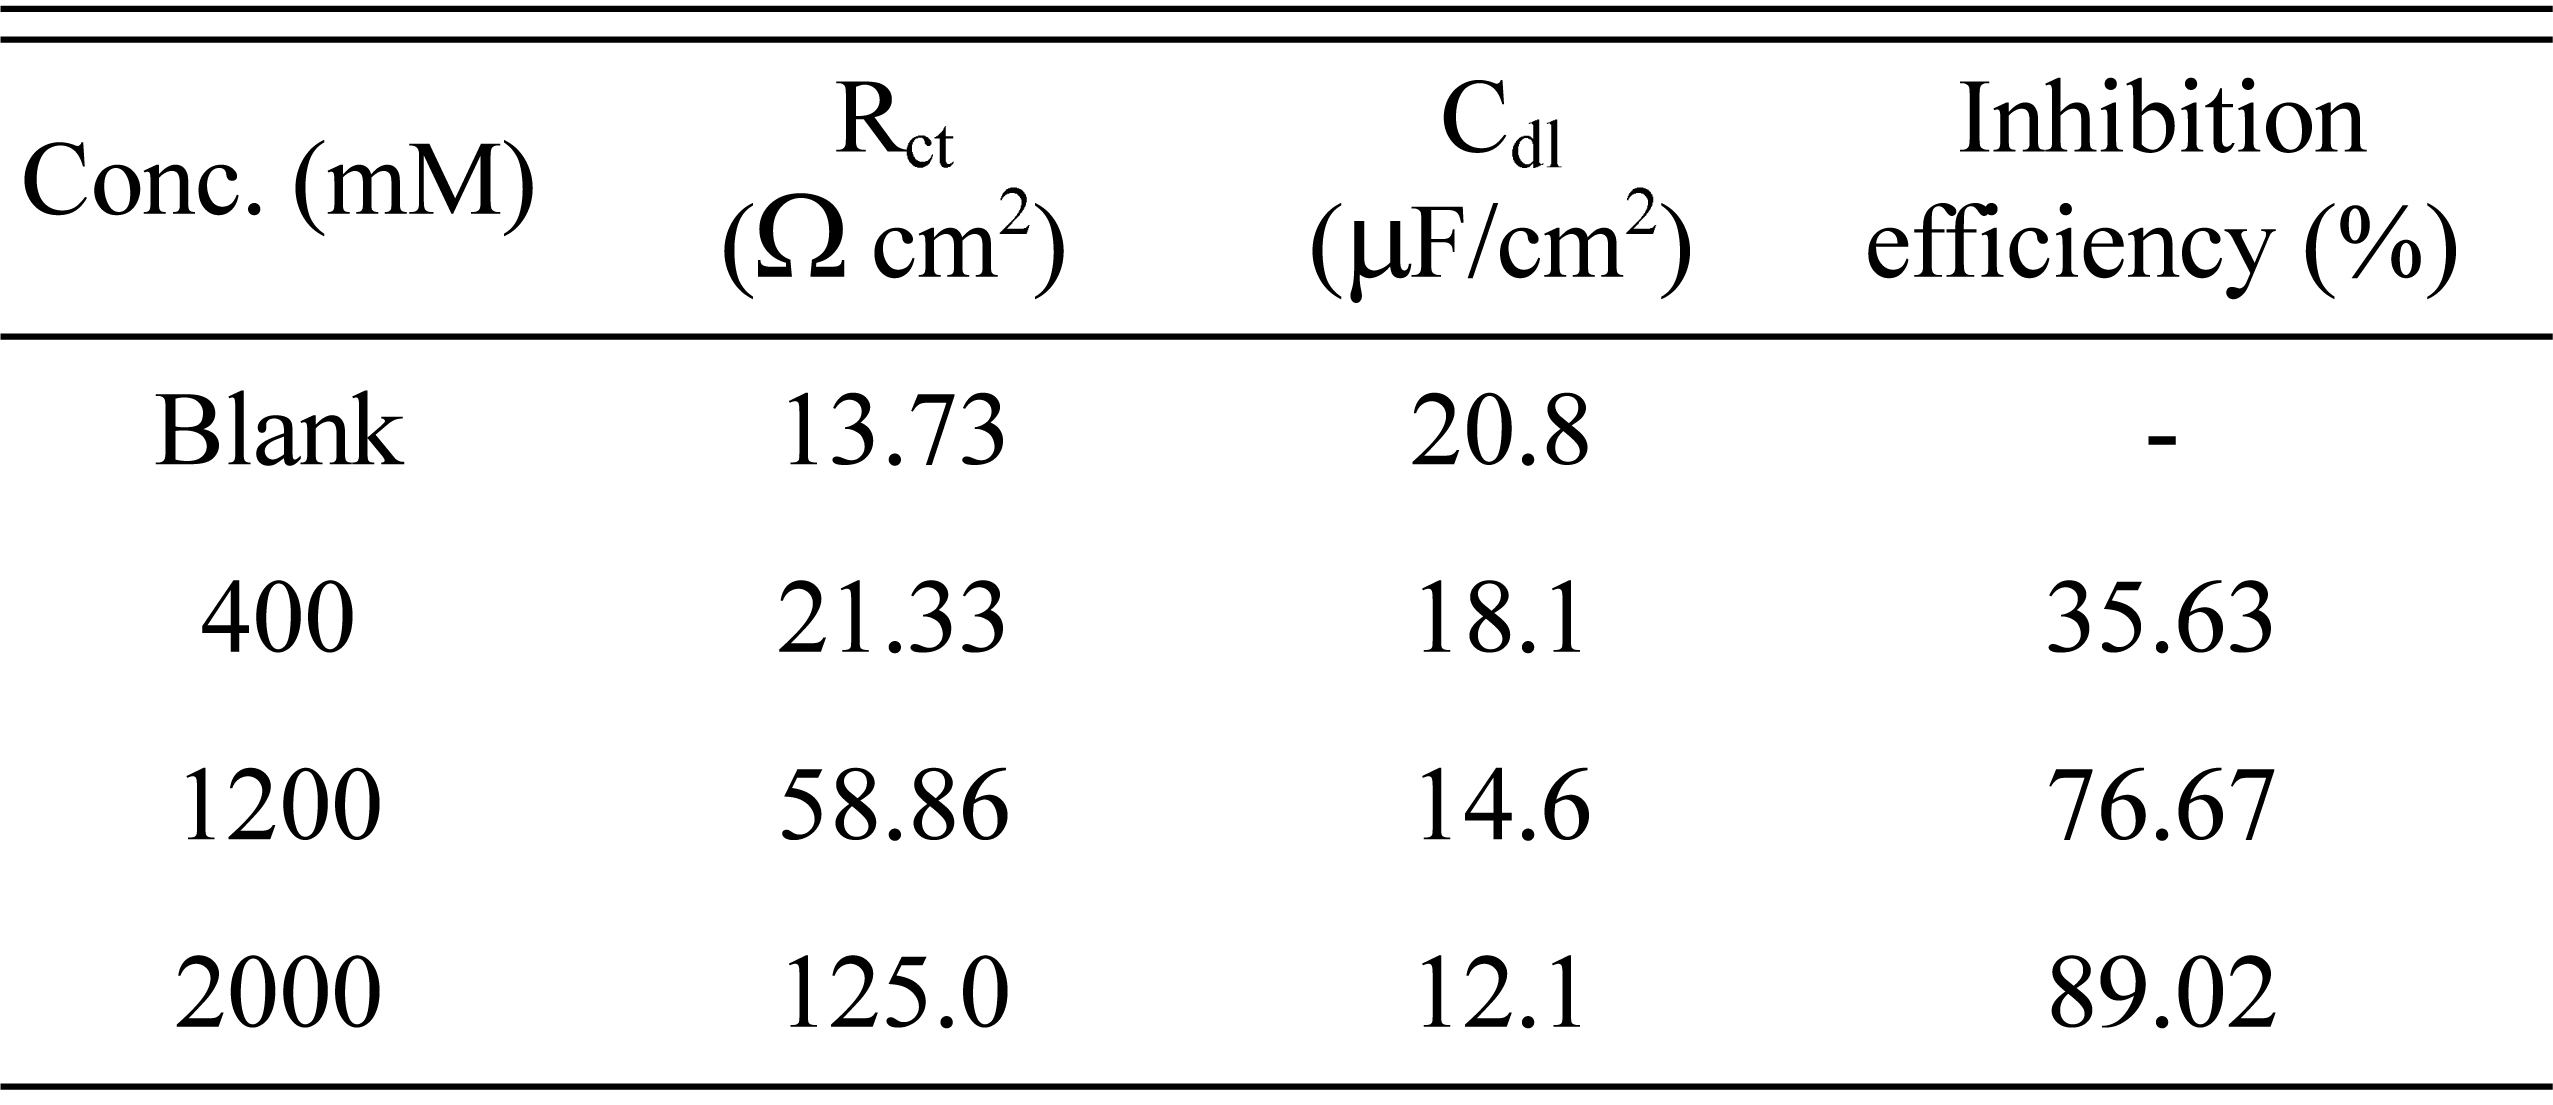
AC impedance parameters for low carbon steel at selected concentrations of C. sinensis 1M H2SO4 at 303 ±1K.
3.4. Surface morphology analysis
The surface of low carbon steel immersed in 1M H2SO4 in the absence and presence of 2000 ppm of C. sinensis were scanned through electron microscope. The micrograph of low carbon steel immersed in inhibitor free acid solution (Fig. 7a) depicts highly damaged surface with obvious deterioration and small pits due to attack of corrosive acid solution. Fig. 7b shows comparatively smooth surface due to the development of protective inhibitor film on metal surface which significantly shields the metal from direct attack of the acid and hence inhibits corrosion. SEM results are further supported by nano-to microscale level surface topography analysis by AFM technique. Two dimensional (2D) and three dimensional surface morphologies of low carbon steel dipped in 1 M H2SO4 without and with the addition of 2000 ppm of the inhibitor are depicted in Fig. 8. The average surface roughness of the metal electrode is reduced from 26.99 nm to 8.86 nm by the addition of C. sinensis extract which indicates lower permeability for aggressive particles towards the metal surface and thus corrosion is prevented by a protective film of adsorbed molecules [51].

SEM images of a) low carbon steel in 1M H2SO4 b) low carbon steel in 1M H2SO4 with 2000 ppm of C. sinensis extract.

AFM image of low carbon steel in 1M H2SO4 in the a) absence and b) presence of 2000 ppm of C. sinensis extract.
3.5. Protective film analysis
The FT-IR spectrum of crude C. sinensis extract is displyed in Fig. 9a. shows broad peak at 3310 cm-1 attributed to polymeric phenolic O-H group. The band at 1640 cm-1 is assigned to aromatic C=C bending vibration. C-H bending frequency is shown at 1310 cm-1. The adsorption bands at 1260 cm-1 and 1086 cm-1 correpond to framework vibration of aromatic ring and C-O streching vibration. The bands below 1000 cm-1 result from aromatic and aliphatic C-H vibrations [52]. The above data shows that the plant extract contains active aromatic and phenolic constitutents containing –OH, C-O and C=C groups. The FT-IR spectrum of the inhibitor film formed on the low carbon steel surface immersed in 1M H2SO4 containing 2000 ppm of the inhibitor shown in Fig. 9b. Shift in phenolic OH band from 3310 cm-1 to 3300 cm-1 is observed. Also C-O stretching vibration is shifted to 1093 cm-1. It is found that the bands due to C=C and C-H bending are shifted to 1631 and 1300 cm-1 respectively. Aromatic and aliphatic C-H streching vibrations are also shifted to lower frequencies. These observations indicate the formation of protective film by adsorption of active phtochemical components of C. sinensis extract on metal surface [53,54].

FT-IR spectrum of low carbon steel in 1M H2SO4 in the a) absence and b) presence of 2000 ppm of C. sinensis extract.
3.6. Mechanism
Corrosion inhibitive ability of C. sinensis extract result from co-operative effect of the secondary (phenolic and flavonoids compounds) metabolites of the extract through adsorption on the steel surface (Fig. 10) [55]. Generally Adsorption of inhibitor molecules on the metal surface occur by displacement of already adsorbed water molecules from the metallic surface.

Mechanism of corrosion inhibition by plant extract inhibitors.

In general inhibitor adsorption happen by physical and/or chemical mode [56]. Physisorption involves electrostatic interaction between electrically charged electrode surface and charged species in the bulk electrolyte. However chemical adsorption encompass charge sharing or electron transference from the active phytochemical components of C. sinensis to the electrode surface to form coordinate type of bond. The phytochemical components of the plant extract find difficult to adsorb on the positively charged steel surface in sulphuric acid electrolyte, as inhibitor molecules are protonated at their hetero atom in 1M H2SO4. Their adsorption occur by the electrostatic interaction between the positively charged active secondary metabolite components and negatively charged iron-sulphate species on the metal surface. Protonated molecules of the extract are in equilibrium with neutral molecules of the phytochemical components such as active phenolic and flavonoids compounds. Adsorption of neutral molecules occur by donor-acceptor interaction between the unshared electron pairs over unprotonated heteroatoms of inhibitor molecules and vacant iron d-orbital on electrode surface. In addition chemisorption results from covalent bond formation through aromatic π electrons sharing with the available d-orbitals of Fe atoms [57-59].
4. Conclusions
C. sinensis extract acted as able low carbon steel corrosion inhibitor in 1M H2SO4. The inhibitor act by mixed-mode that retards both the anodic and cathodic corrosion reactions by combined physical and chemical adsorption on the mild steel surface. Tafel analysis imply that the inhibitive action of the plant extract is due to the suppression of anodic and cathodic reactions but mainly result from reduction of anodic reaction. Inhibitor adsorption on metal surface follows Langmuir adsorption model. Precipitation of inhibitor film that protects the metal against the acid attack was confirmed by FT-IR, SEM, and AFM techniques. The study was also supported by the TPC and TFC assay which had added more significance to the above result.
Acknowledgements
This paper was supported by the KU Research Professor Program of Konkuk University.