Nanostructured Metal Organic Framework Modified Glassy Carbon Electrode as a High Efficient Non-Enzymatic Amperometric Sensor for Electrochemical Detection of H2O2
Article information
Abstract
Metal-organic frameworks have recently been considered very promising modifiers in electrochemical analysis due to their unique characteristics among which tunable pore sizes, crystalline ordered structures, large surface areas and chemical tenability are worth noting. In the present research, Cu(btec)0.5DMF was electrodeposited on the surface of glassy carbon electrode at room temperature under cathodic potential and was initially used as the active materials for the detection of H2O2. The cyclic voltammogram of Cu(btec)0.5DMF modified GC electrode shows distinct redox peaks potentials at +0.002 and +0.212 V in 0.1 M phosphate buffer solution (pH 6.5) corresponding to Cu(II)/Cu(I) in Cu(btec)0.5DMF. Acting as the electrode materials of a non-enzymatic H2O2 biosensor, the Cu(btec)0.5DMF brings about a promising electrocatalytic performance. The high electrocatalytic activity of the Cu(btec)0.5DMF modified GC electrode is demonstrated by the amperometric response towards H2O2 reduction with a wide linear range from 5 μM to 8000 μM, a low detection limit of 0.865 μM, good stability and high selectivity at an applied potential of −0.2 V, which was higher than some H2O2 biosensors.
1. Introduction
The precise and quick detection of H2O2 is of practical importance in clinical diagnostics areas, food industry and biotechnology. One can name various techniques for the determination of H2O2, including titrimetry, spectrophotometry, fluorescence, chemiluminescence and electrochemistry [1-3]. Among the techniques mentioned above, the electrochemical one has been extensively utilized due to its simplicity, low-cost, high sensitivity and selectivity. During the past decades, most of the modified electrodes for determination of H2O2 were based on enzyme because of their high sensitivity and excellent selectivity. However, these expensive enzyme-based electrochemical biosensors cannot be utilized in extreme weather and the detecting accuracy is greatly affected by factors like temperature, humidity, pH and toxic chemicals. By the same token, non-enzymatic electrochemical biosensors are good choices for H2O2 detection because of low cost, free of pH, high sensitivity, high stability and fast response time.
A new type of crystalline porous materials, metalorganic frameworks (MOFs) have attracted a great bulk of attention because of their unique properties such as high surface areas and high pore volumes in uniformly sized. The electrodeposition method has proven itself as the most promising technique among different methods of preparing thin films of MOFs owing to its simple procedure, easy handing, high yield efficiency, high purity of products and very short reaction time. In particular, MOFs have been considered useful modifiers in electrochemical analysis, providing novel electrochemical sensors. In this aspect, Wang’s team reported an electrochemical sensor based on a carbon paste electrode (CPE), modified with ZnO4(BDC)3(MOF-5) (BDC= 1,4-benzene dicarboxylate) for sensitive determination of lead. They applied a bulk modification of CPE instead of plating a film on the electrode surface because Zn-based MOFs are susceptible to water and lose their large surface area when exposed to water [4]. In a similar study, they prepared amino functionalized metalorganic frameworks (NH2-Cu3(BTC)2) (BTC = 1,3,5-benzene tricarboxylate) and introduced a novel electrode modifier to determine trace levels of lead [5]. Recently, a non-enzymatic H2O2 biosensor based on Ni(II)-based metal-organic framework (Ni(II)-MOFs) anchored on carbon nanotubes (CNTs) was made by Bao et al. [6].
Owing to the advantages of the MOFs, Cu(btec)0.5DMF (Cu-MOF ; btec = 1,2,4,5-benzene tetracarboxylate ) (Fig. 1) was electrodeposited on the surface of glassy carbon electrode (GCE) in room temperature under cathodic potential and was initially employed as the active material for the detection of H2O2 in this report. Electrosynthesized Cu(btec)0.5DMF structure was characterized by scanning electron microscopy (SEM), transmission electron microscopy (TEM) and fourier transform infrared spectroscopy (FT-IR). This synthetic protocol supplies high surface area, high purity, easy of synthesis procedure, low cost and easy operation. As far as we know, it is the first example in which Cu(btec)0.5DMF is used as a novel electrocatalyst for H2O2 electrooxidation. The Cu(btec)0.5DMF modified GC electrode gives a wide linear range of 5-8000 μM, a good detection limit and high selectivity to the target analysts. As far as we know, such catalytic activities of Cu-MOFs have been rarely reported. Therefore, this Cu-MOF is very likely to be applied successfully in H2O2 non-enzymatic electrochemical sensors.
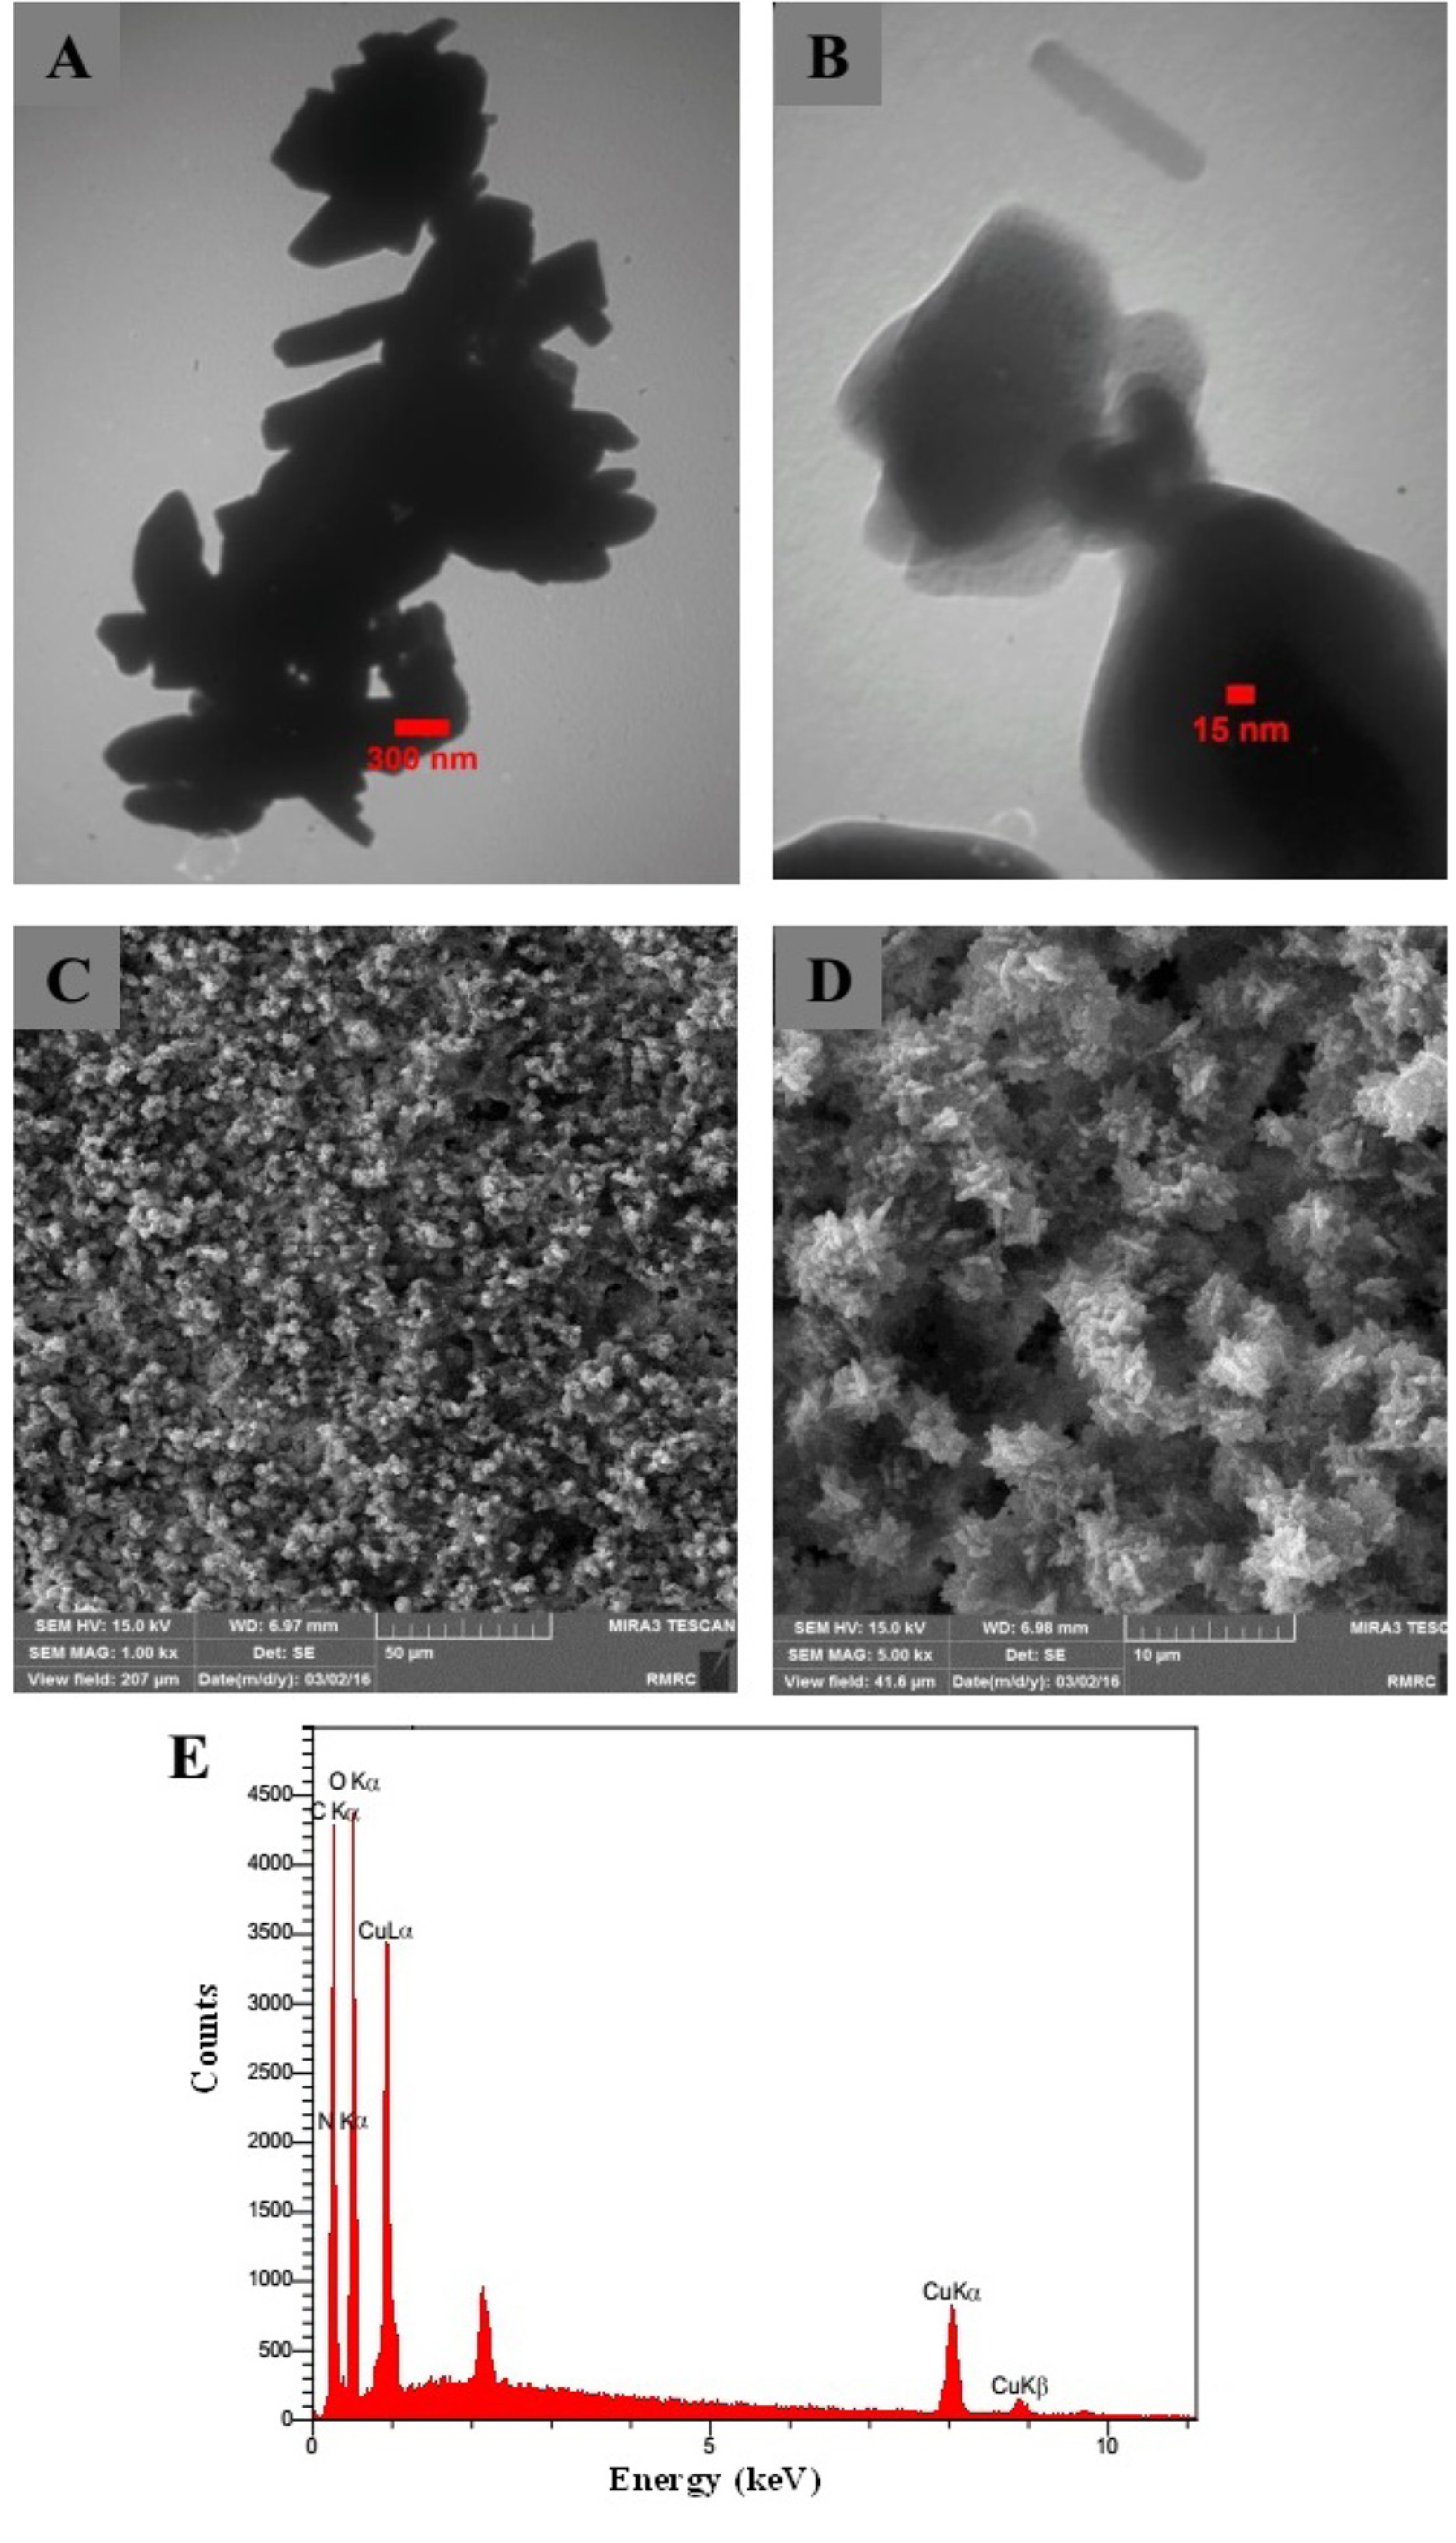
TEM, SEM images and EDX spectrum of electrosynthesized Cu(btec)0.5DMF.
2. Experimental
2.1. Reagents and Materials
All reagents were bought from the Merck and Aldrich chemical companies and were used without any additional purification. Double distilled water was used during the experiments.
2.2. Apparatus
Electrochemical measurements were done by Zahner Ennium and a conventional three-electrode system was employed during this experiment. A saturated Ag/AgCl electrode, a Pt wire and a glassy carbon electrode (2 mm diameter) were used to serve as the reference, counter and working electrodes, respectively. The frequency range of 100 kHz to 100 mHz and modulation amplitude of 5 mV were employed for impedance studies. The capacitance values were normalized by fitting on Z-view program. Tescan scanning electron microscope, energy dispersive X-ray spectrometry (EDX), and Zeiss EM900 transmission electron microscope have been used to obtain the morphologic information of sample. Fourier transform infrared spectra were recorded using a Bruker Tensor 27 FT-IR spectrometer with KBr pellets. Outgassing and determination of adsorption isotherms were done by a BEL Japan, Inc. surface area analyzer. Samples were outgassed at 120℃ overnight under vacuum and N2 adsorption isotherms were measured at 77 K.
2.3. Electrodeposition of Cu(btec)0.5DMF
The Cu(btec)0.5DMF was electrochemically synthesized based on the previous report [7]. In short, the optimal values of organic linker (0.1 M H4btec), copper nitrate (0.02 M), sodium nitrate (0.1 M) and supporting electrolyte (0.1 M tetrabutylammonium tetrafluroborat (TBTA)) were dissolved in DMF:water (100:1 V/V) solution. A saturated Ag/AgCl electrode, a Pt wire and a glassy carbon electrode (2 mm diameter) were selected to be the reference, counter and working electrodes. Before the experiment, the GCE was cleaned by polishing with 0.05 μm alumina slurry on a polishing cloth to create a mirror finish. The electrode was then sonicated with absolute ethanol and double-distilled water for about 2.0 minutes, respectively, and finally, it was dried under ambient temperature. Electrolysis was carried out in an electrochemical cell under optimal constant voltage electrolysis (−1.7 V) for 10 minutes. Finally, the green precipitate of Cu(btec)0.5DMF was deposited on the GCE. After that, a 5 μL of nafion aqueous solution (0.5 wt%) was coated on the modified electrode and was dried under ambient temperature.
3. Results and Discussion
3.1. Characterization of Cu(btec)0.5DMF
The transmission electron microscopy and scanning electron microscopy characterize the microstructure and morphology of electrosynthesized Cu(btec) 0.5DMF. As shown in Fig. 1A, the Cu(btec)0.5DMF particles are rods particles in shape and are very similar in size. Fig. 1B shows a closer view of Cu(btec)0.5DMF nano rods at the high-magnification TEM image. Moreover, it is interesting to see that SEM images of Cu(btec)0.5DMF particles strongly resemble the natural flowers in Fig. 1C (shown in a large scale). As it can be seen in Fig. 1C, the morphology of Cu(btec)0.5DMF to be uniform nanoflower arrays with monomodal particle size distribution of 40-50 nm on average. Fig. 1D indicates a high-magnification of an assembled 3D flower nano-structure particle. Moreover, the EDX analysis has shown that the Cu(btec)0.5DMF consisted of C, O, Cu and N elements. The N element in the spectrum should be from DMF, showing that Cu(btec)0.5DMF had been synthesized successfully.
The N2 adsorption-desorption isotherm of Cu(btec)0.5DMF is shown in Fig. 2A. The fractal dimension of solid samples can be determined based on the Frenkel-Halsey-Hill (FHH) method by utilizing the isotherm data of N2 gas adsorption. The equation used in FHH method is:
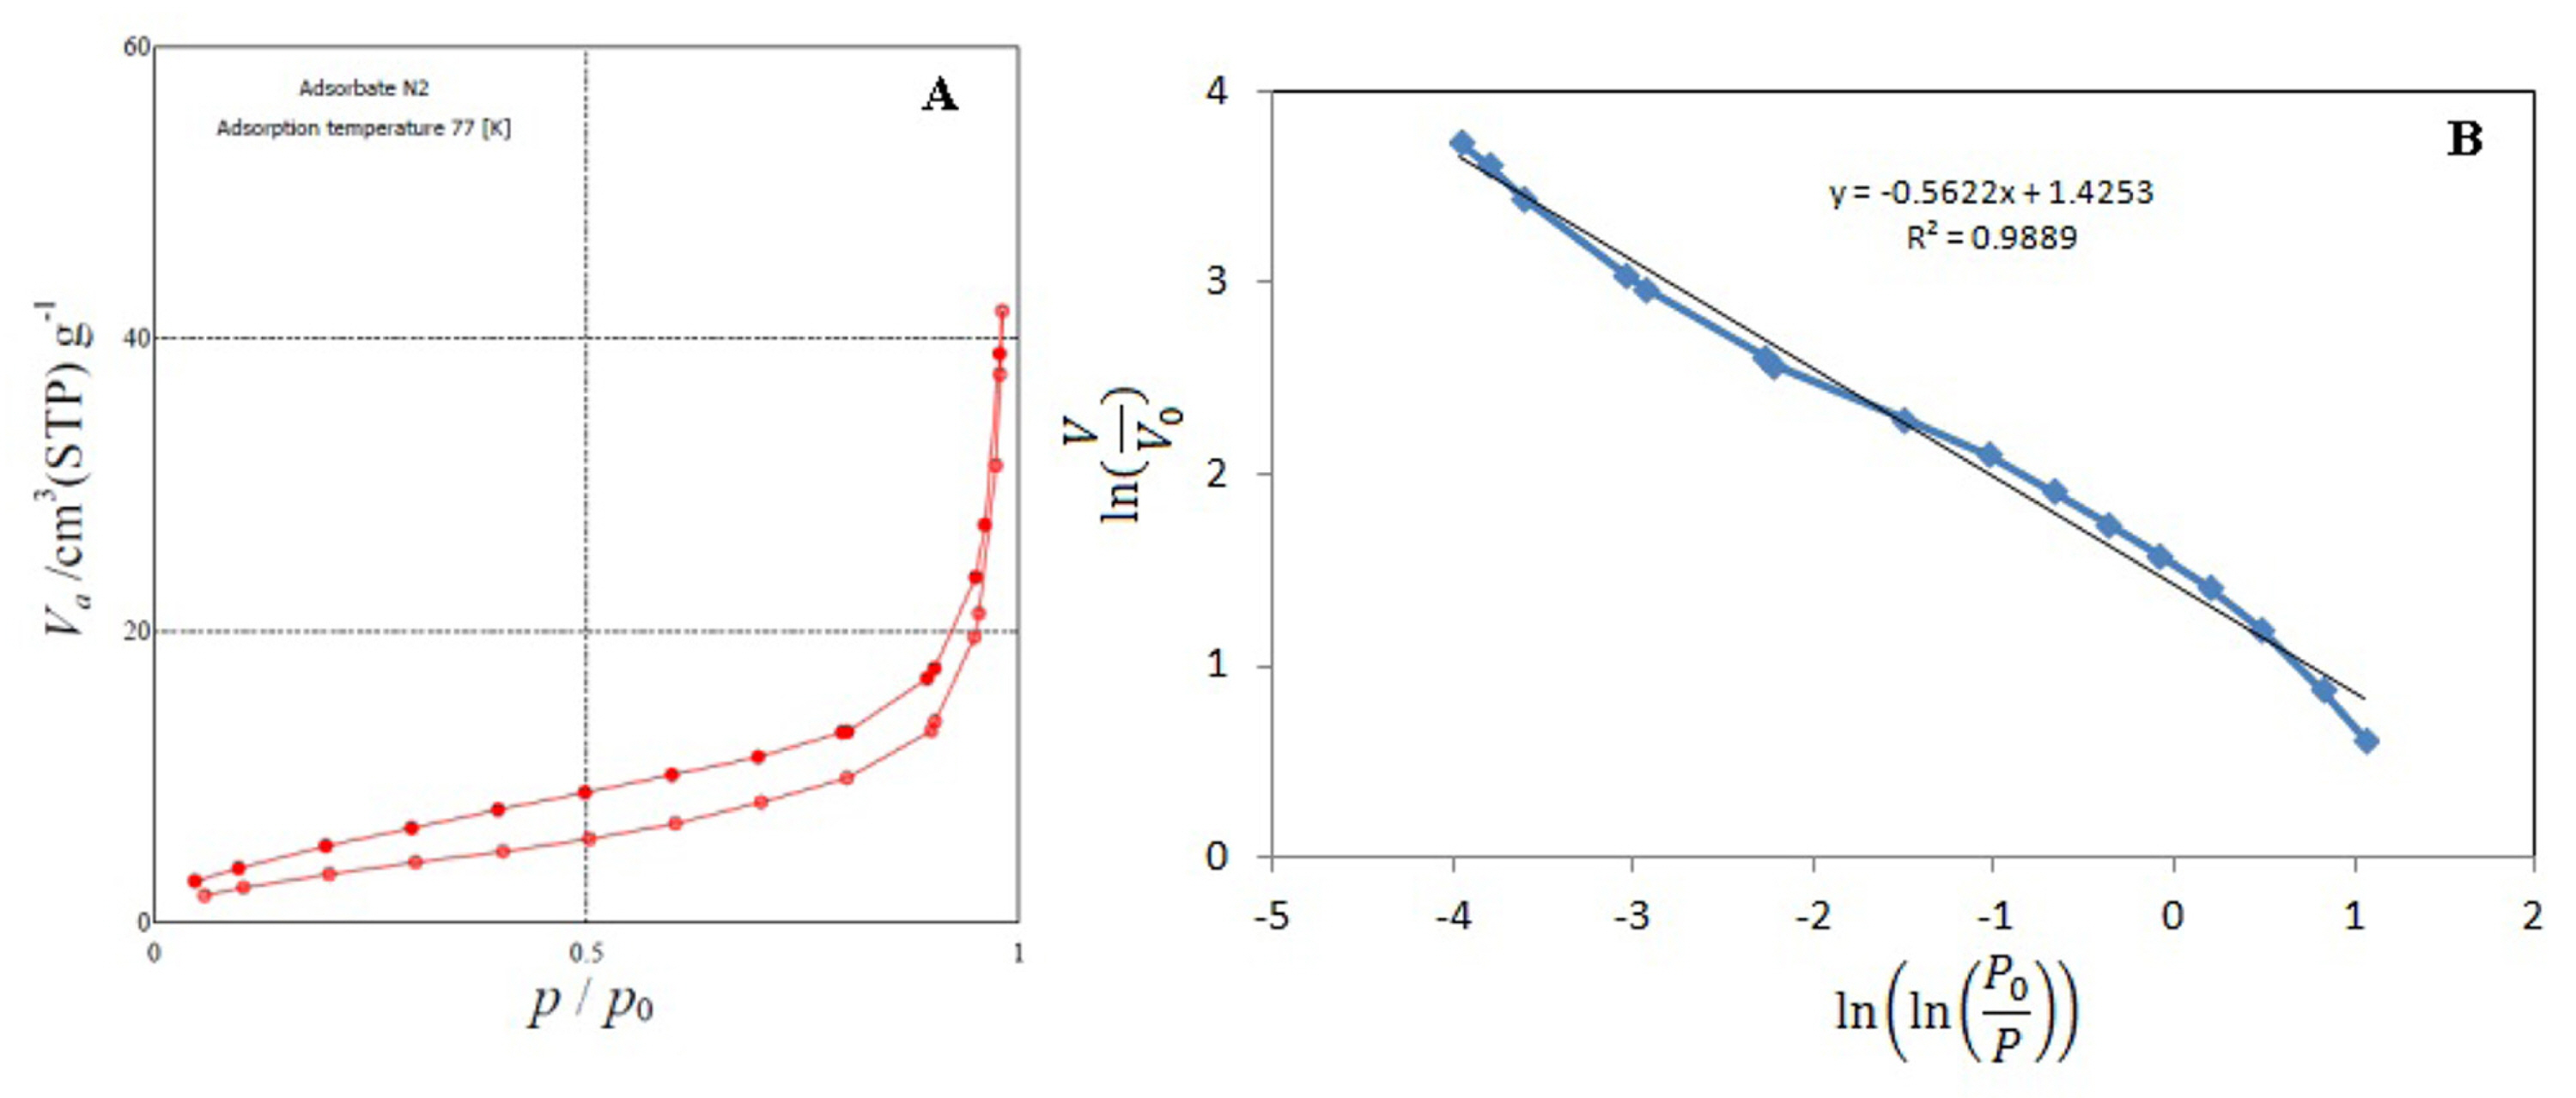
(A) The N2 adsorption-desorption isotherm of Cu(btec)0.5DMF and (B) The fractal dimension plot of Cu(btec)0.5DMF.
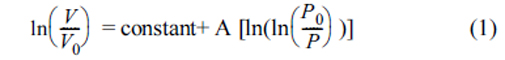
where V and V0 are the volume of adsorbed gas at pressure P and monolayer volume, respectively. P0 and A, respectively, are the saturation pressure and a constant, related to the fractal dimension (Df) of solid sample (Df =A+3). As far as FHH method is concerned, the plot of ln(V) versus ln(ln(P0/P)) gives a straight line with slope of A. The fractal dimension plot of Cu(btec)0.5DMF is shown in Fig. 2B. In this regards, fractal dimension values of Cu(btec)0.5DMF was calculated as 2.44.
Infrared spectra of Cu(btec)0.5DMF is shown in Fig. 3. The Cu(btec)0.5DMF displays the absorption bands at 1533 cm-1 and 1392 cm-1, which is related to the antisymmetric stretching vibrations and symmetric stretching vibrations of -COO-, respectively. No absorption peaks are observed between 1730 cm-1 and 1690 cm-1, indicating that all the carboxyl groups are deprotonated. The appearance of stretching vibrations of C-H bands (related to methyl group in DMF molecule) at 2930 cm-1 and 2860 cm-1 is a good indication of the presence of DMF in the structure of the electrosynthesized Cu(btec)0.5DMF.
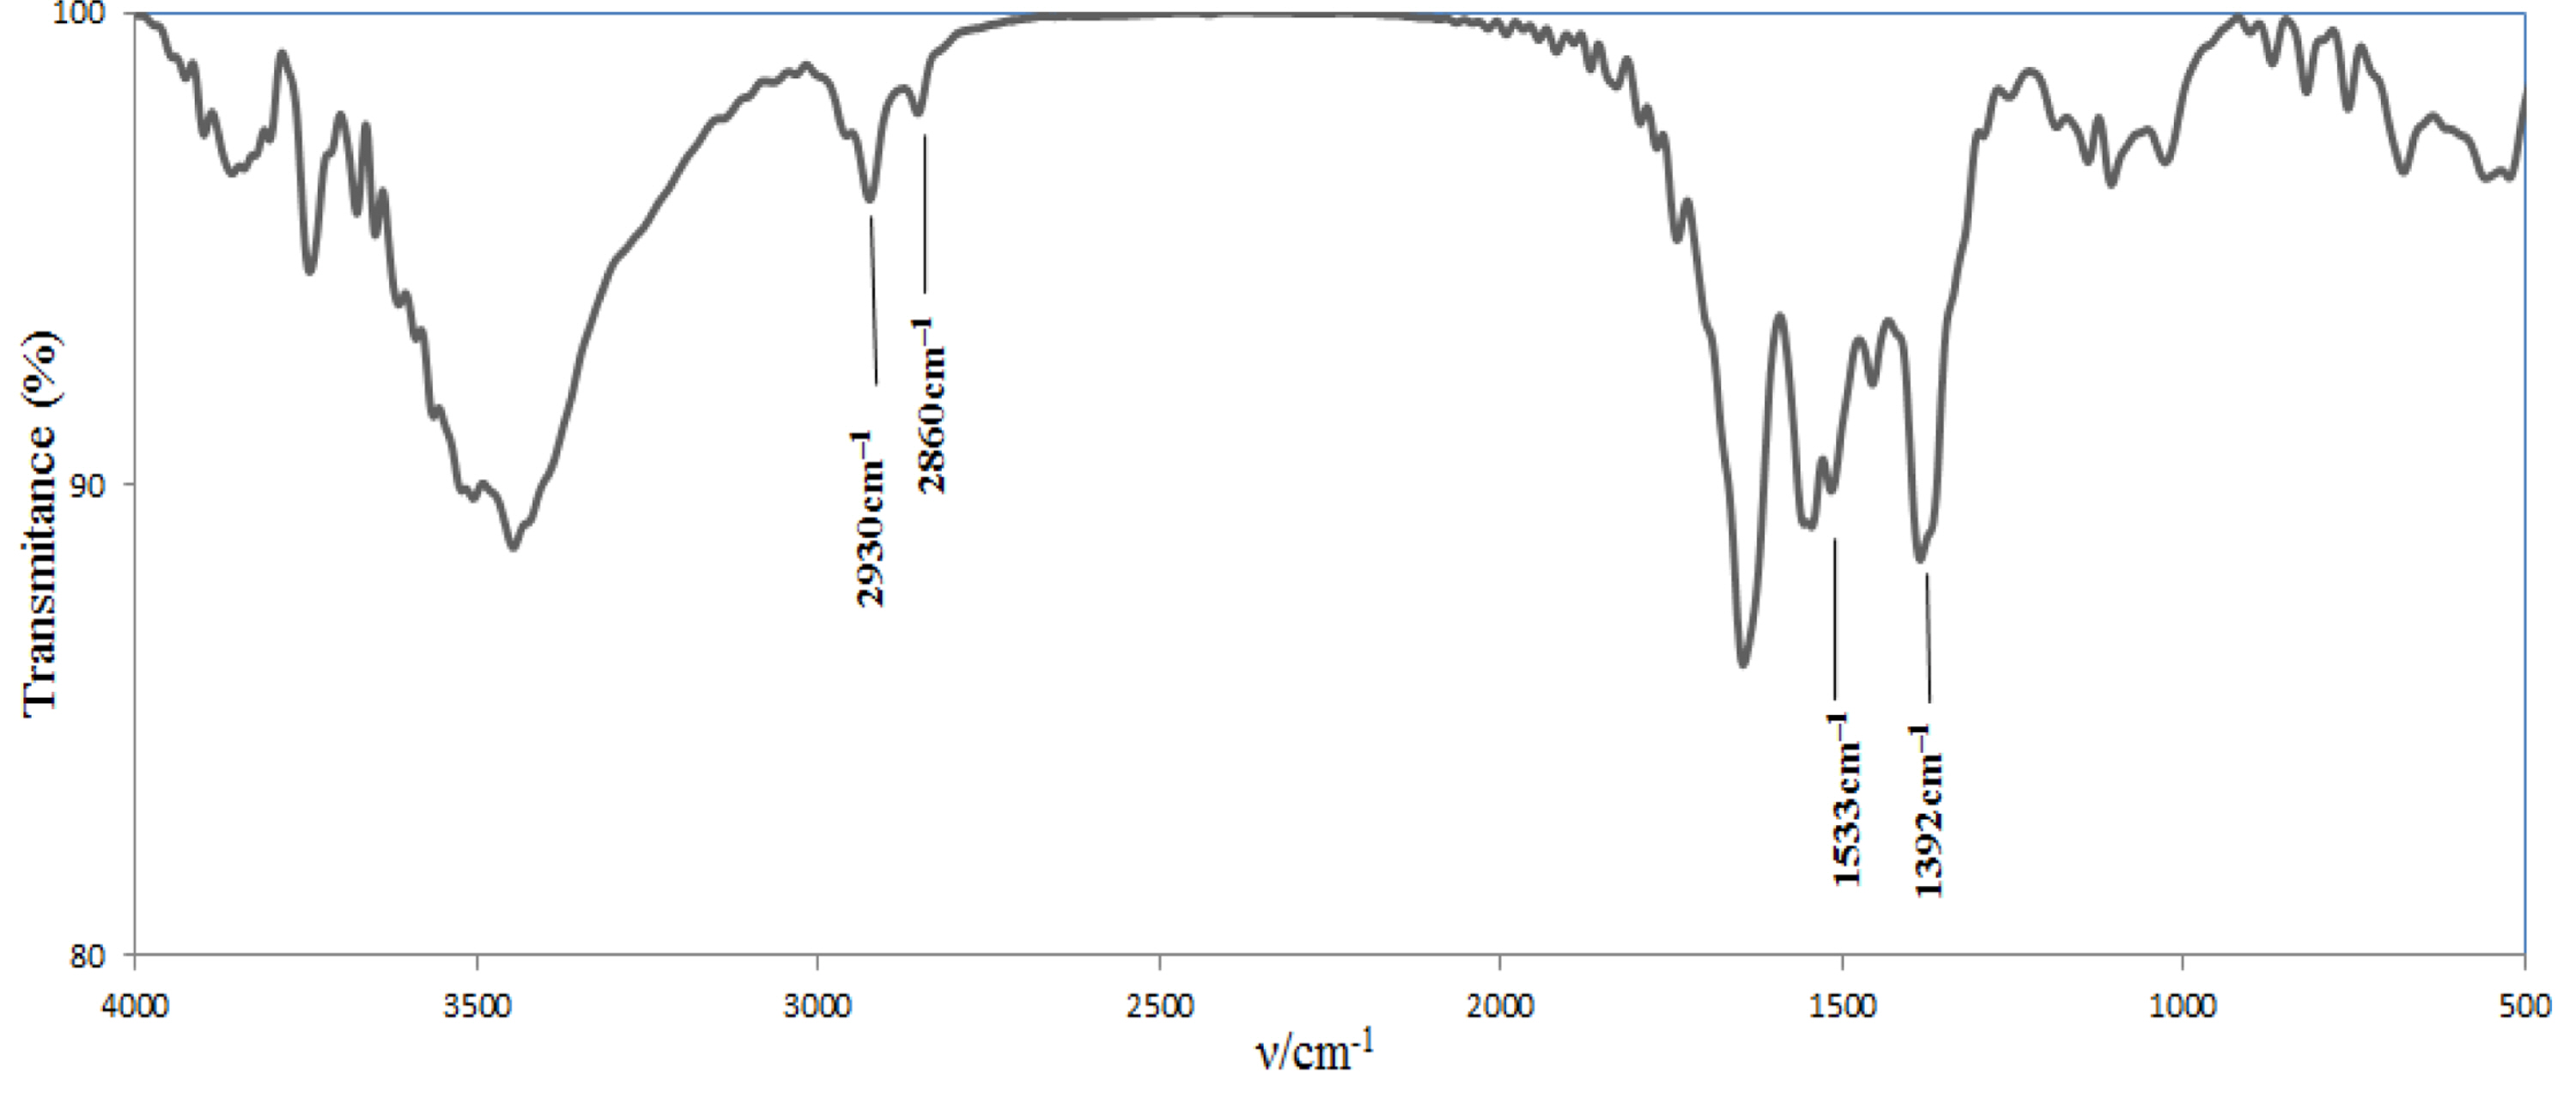
Infrared spectra of Cu(btec)0.5DMF.
3.2. Electrochemical Performance of Cu(btec)0.5DMF-GCE
For the electronic conductivity of Cu(btec)0.5DMF to be analyzed, electrochemical impedance spectroscopy was used. The bare GCE Nyquist plots and modified GCE are displayed in Fig. 4. The semicircle portion of the plot corresponds to the charge transfer process, with the diameter of the semicircle equivalent to the charge transfer resistance (Rct). After modification with Cu(btec)0.5DMF, the EIS semicircle diameter of Cu(btec)0.5DMF-GCE is markedly reduced. The electron transfer rate constant (ket) at the Cu(btec)0.5DMF-GCE interface can be estimated by using the EIS data and the equation as follows [8]:
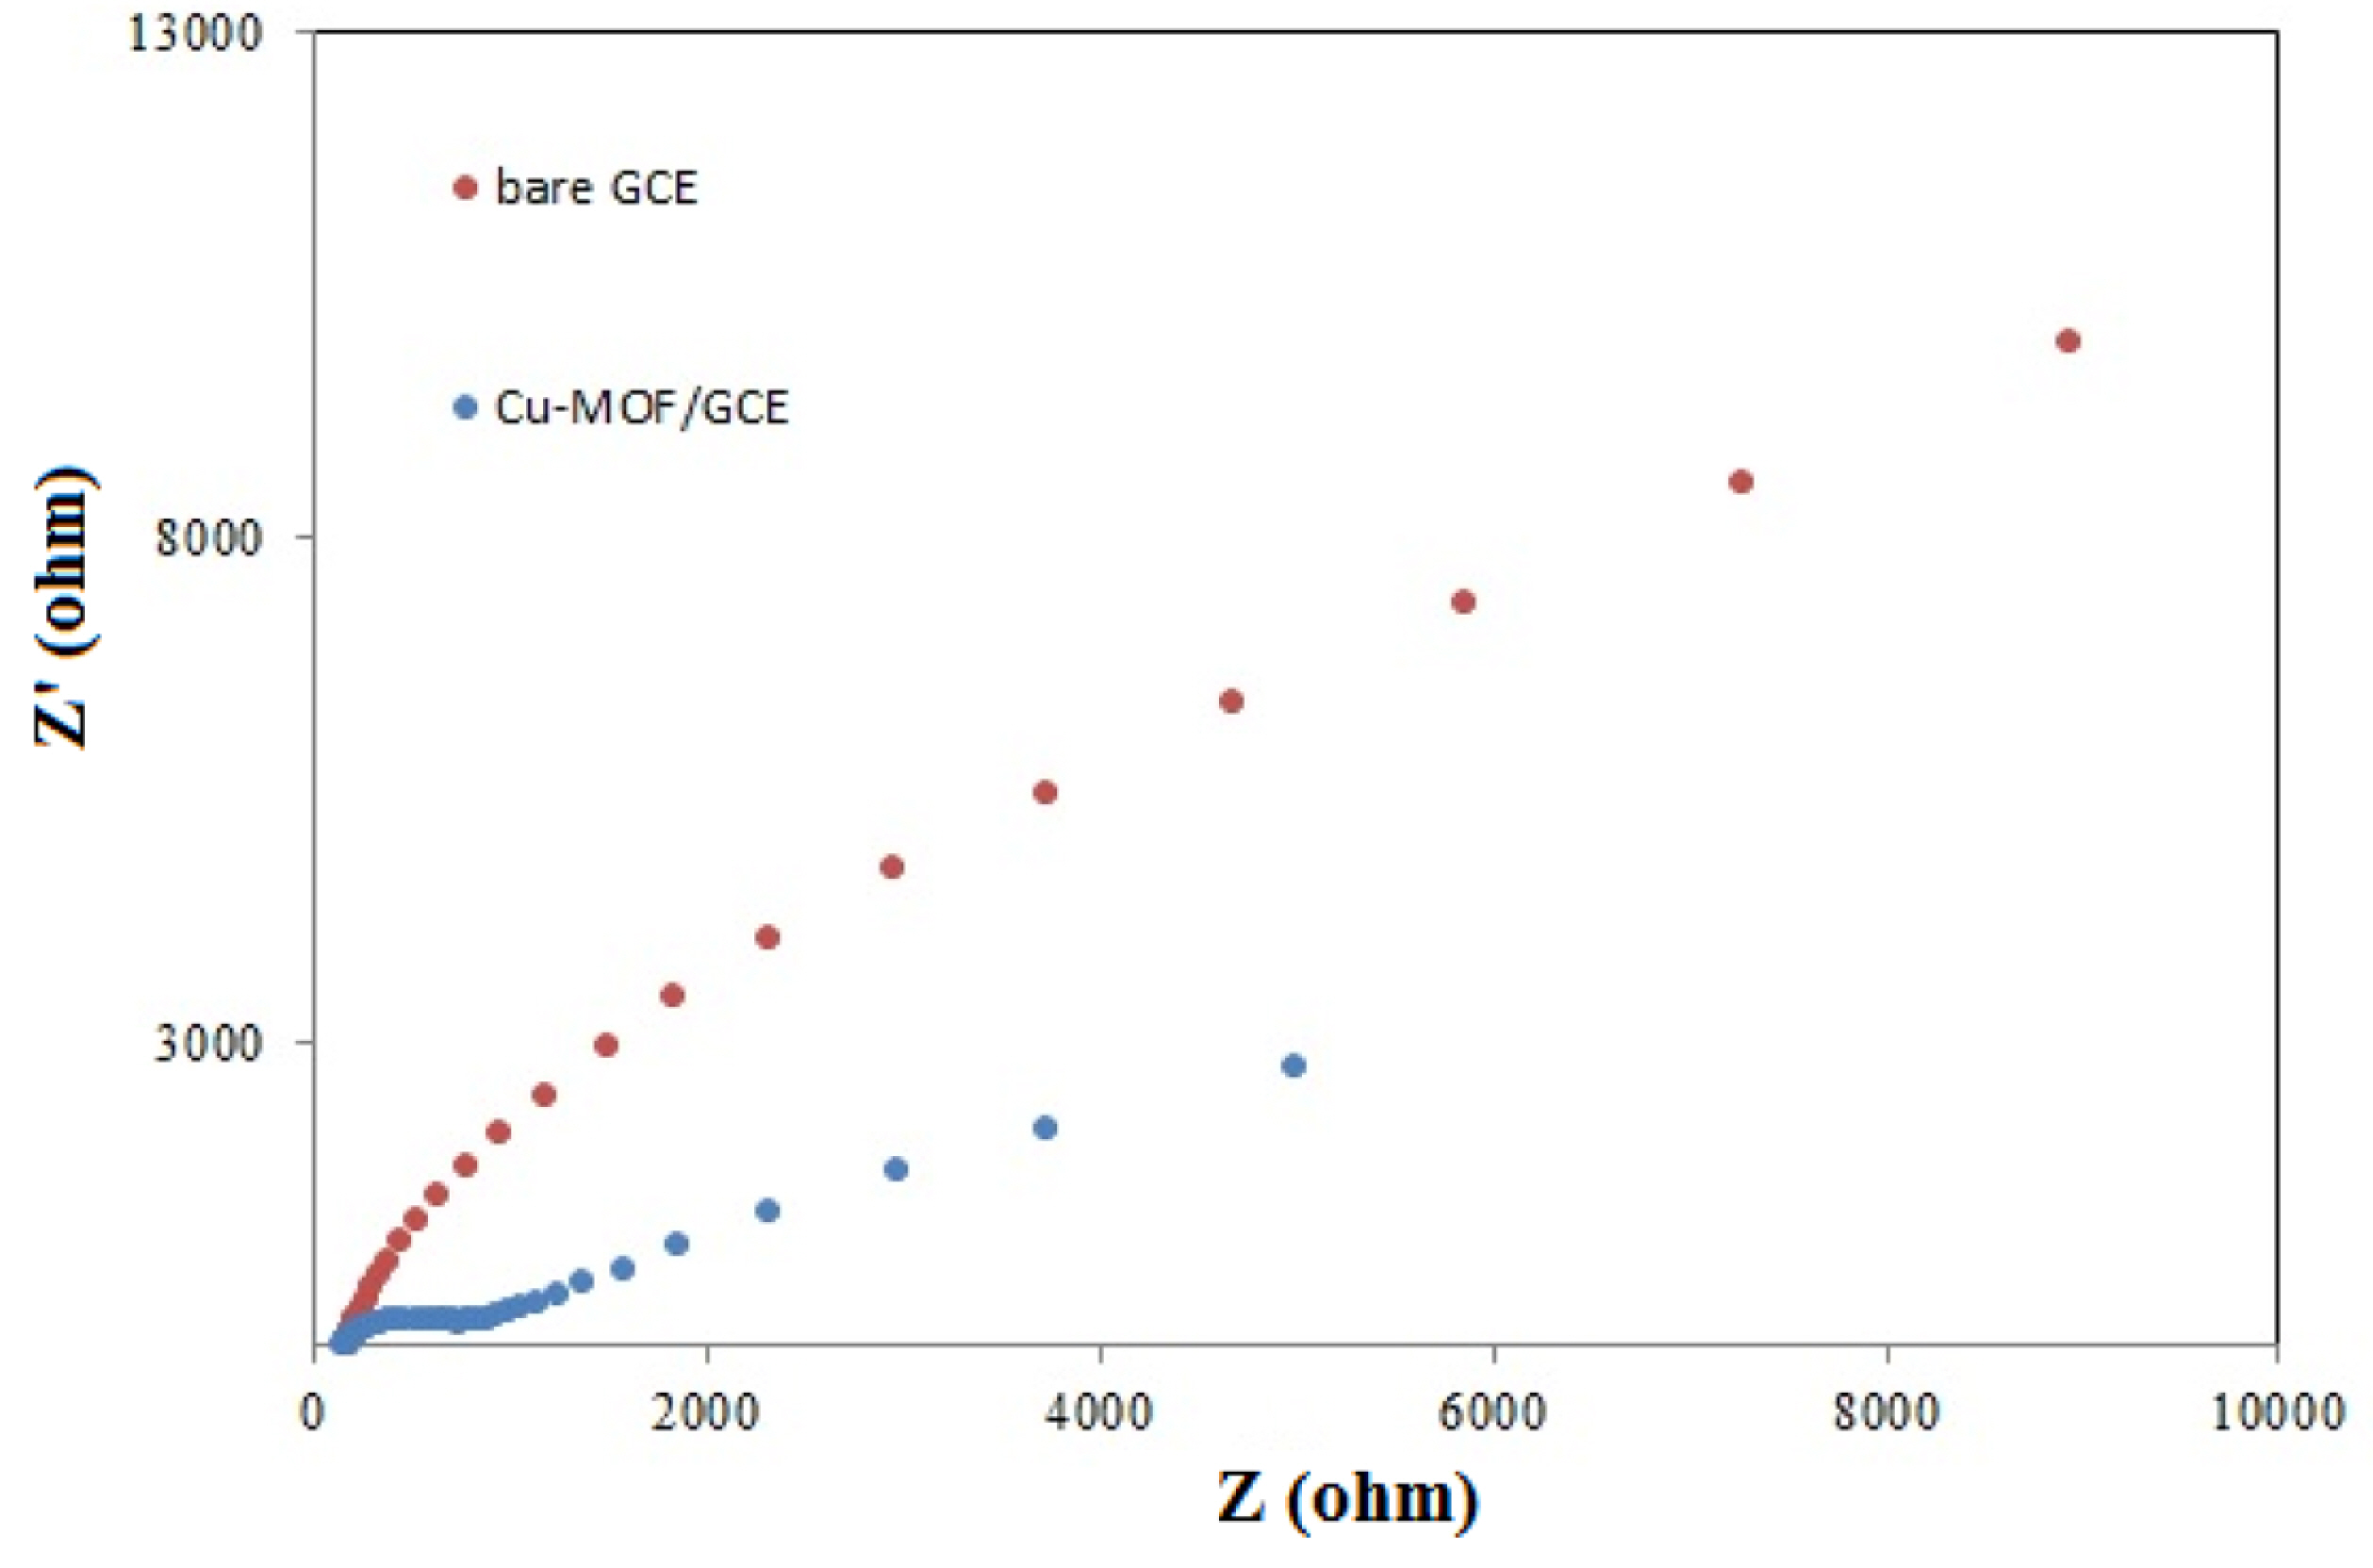
The Nyquist plots of bare GCE and modified GCE in 0.1 M PBS.
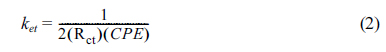
where CPE is constant phase element and Rct is the charge transfer resistance. The values of CPE and Rct were obtained by fitting on Z-view program as 1.944 μFs-1 and 1148 Ω, respectively. Then the electron transfer rate constant, ket = 224, was calculated based on Eq. 2. These results demonstrate that Cu(btec)0.5DMF can form good electron pathways between the electrode and electrolyte; thus, this can serve as an appropriate platform for electrocatalysis applications.
The electrochemical behavior of Cu(btec)0.5DMF, which is electrodeposited on GC electrode, was studied by CV. Fig. 5A indicate the CV response of Cu(btec)0.5DMF/GCE in 0.1 M phosphate buffer solution (PBS) at a scan rate of 30.0 mV s-1 at pH 6.5. As shown in the figure, the resulting cyclic voltammogram arrives at distinct redox peak potentials at +0.002 and +0.212 V which was presumably ascribed to the reversible oxidation and reduction of Cu(II)/Cu(I) in Cu(btec)0.5DMF [9]. In order to study the kinetic parameters, the CVs of Cu(btec)0.5DMF electrodeposited on a glassy carbon electrode at different scan rates in 0.1 M PBS (pH 6.5) were recorded (Fig. 5B). The redox system’s peak currents are proportional to the scan rate for sweep rates below 100 mVs-1 (Fig. 5C) signaling a surface-controlled process. In addition, the anodic peak currents were quite similar to the corresponding cathodic peak currents and the peak potential did not change with the increase in the scan rate. The plot of the peak current vs. scan rate, at higher sweep rates, deviates from linearity and, thus, the peak current becomes proportional to the square root of the scan rate (Fig 5D), as in redox diffusion-controlled process. Peak separations, at higher sweep rates (>100 mVs-1), begin to increase and the shift values of the peak potentials are proportional to the logarithm of the scan rate (Fig. 5E). Charge transfer coefficient (α) and the electron transfer rate constant (ks), based on the Laviron theory, can be arrived at by measuring the variation of peak potential by scan rate when nΔEp ≥ 200 mV [10]. The charge transfer coefficient was determined by using the following equation:

(A) CV response of Cu(btec)0.5DMF/GCE in 0.1 M phosphate buffer solution (PBS) at a scan rate of 30.0 mV s-1 at pH 6.5, (B) CVs of Cu(btec)0.5DMF electrodeposited at different scan rates, (C) dependency of the peak currents of the redox system vs scan rate below 100 mVs-1 (D) dependency of the peak currents of the redox system vs square root of the scan rate and (E) shift values of the peak potentials vs to logarithm of the scan rates.
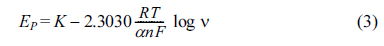
The plot of ΔEp vs. log(ν) displays a slope about 156 mV and, then, α was calculated as 0.378 (for n = 1). The electron transfer rate constant can be obtained by introducing this value in the following equation:
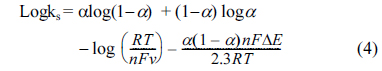
The ks value was calculated to be approximately 0.959 s-1 (for ν = 1000 mV s-1). This large value signals a high ability of Cu(btec)0.5DMF for promoting the electrons to the electrode surface.
The electroactive species’ the surface coverage (Γ ) immobilized on electrode surface can be arrived at from the slope of Ipc vs. scan rate (ν < 100 mV s-1) by the following equation [11]:

In which ipc is the cathodic peak current (A), n is the number of electrons transferred (n = 1 in this case), ν is the scan rate (Vs-1), A is the geometric area of the electrode (0.0314 cm2), and other symbols have their usual meanings. The value of Г was calculated to be approximately 5.41 × 10⁻⁸ mol cm-2 for Cu(btec)0.5DMF electrodeposited on a glassy carbon electrode.
3.3. Cyclic Voltammetric Electrochemical Response of Cu(btec)0.5DMF-GCE Towards H2O2
In order to investigate sensing application of Cu(btec)0.5DMF in hydrogen peroxide detection, an enzyme-free sensor was designed by electrodeposition of Cu(btec)0.5DMF on a glassy carbon electrode surface. The electrocatalytic activity of Cu(btec)0.5DMF/GCE towards the reduction of H2O2 was examined by CV in 0.1 M PBS (pH 6.5) containing 2 mM H2O2. As it can be seen in Fig. 6A, CV curves arrived in 0.1 M PBS with and without H2O2 showed the similar current response for the bare GCE mentioning that the H2O2 reduction can rarely be achieved on the GCE surface. In contrast, the cathodic peak current was improved in the presence of hydrogen peroxide at the surface of Cu(btec)0.5DMF/GCE, whereas the oxidation peak current decreased. The dramatic increase in reduction current could be attributed to the porosity with highsurface area of Cu(btec)0.5DMF film as well as its electrocatalytic behavior to raise the rate of the electron transfer process. With the successive addition of hydrogen peroxide, while anodic peak current has virtually vanished, the cathodic peak current of the modified electrode rose, reflecting a typical electrocatalytic reduction process (EC′) (Fig. 6A). The catalytic reduction reaction mechanism can be expressed as follows [12]:

(A) Cyclic voltammograms of modified glassy carbon in 0.1 M PBS (pH 6.5) containing different concentration of H2O2, (B) cyclic voltammograms in different scan rates in 0.1 M PBS (pH 6.5) containing 2 mM H2O2 .


The catalytic currents rose linearly with H2O2 concentration in the range of 5.0-22.0 mM, and the linear regression equation Ip(μA) = −2.94 [H2O2](mM) − 51.59 with the correlation coefficient (R2) of 0.995 was obtained. In order to investigate the electrocatalytic mechanism of H2O2 reduction at the Cu(btec)0.5DMF/GCE, cyclic voltammograms in 2 mM H2O2 were recorded at different scan rates (Fig. 6B). It was concluded that the peak current for the cathodic reduction of H2O2 was proportional to the square root of the scan rate, proposing that the process is controlled by diffusion of analyte as can be expected for a catalytic system.
3.4. Chronoamperometric Response of Cu(btec)0.5DMF-GCE to H2O2
In order to assess the sensing ability as a non-enzymatic sensor towards the detection of H2O2, with a more focus, the typical amperometric responses of the Cu(btec)0.5DMF-GCE was illustrated upon the successive injection of H2O2. The amperometric response of Cu(btec)0.5DMF-GCE, with successive addition of H2O2 into 0.1 M PBS (pH 6.5), under the applied potential of −0.2 V in the stirring condition, is shown in Fig. 7. Upon the steeply increasing concentration of H2O2, as can be seen in Fig. 7, the response of Cu(btec)0.5DMF-GCE rapidly reaches 95% of the steady-state value within 8 s, which signalled a rapid response and efficient catalytic properties of Cu(btec)0.5DMF-GCE. The Cu(btec)0.5DMF-GCE also showed a good linear relationship between the reduction current and H2O2 concentration in the range of 5-1000 μM (Ip(μA) = −0.007 [H2O2](μM) −0.26 and R2 = 0.998) and 1000-8000μM (Ip(μA) = −3.70 [H2O2](μM) −3.38 and R2 = 0.998) (Fig. 7). The values of R2 show that the regression lines are in line with the experimental data and the regression equations can be applied in the unknown sample determination. The detection limit was calculated according to 3 s/m. For n = 8 measurements of background current, the s was obtained 0.0019. By considering of slope of calibration curve (m = 0.0066), the detection limit was 0.865 μM which is lower than that in the literatures reported before (Table 1).The detection limit and linear calibration range of the proposed modified electrode were compared with those previously reported, and the results were summarized in Table 1. As can be seen, the analytical parameters are equal or even better than those reported for H2O2 detection at the surface of other modified electrodes. It makes clear the excellent performance of the Cu(btec)0.5DMF-GCE as a promising electrochemical sensor in H2O2 determination.
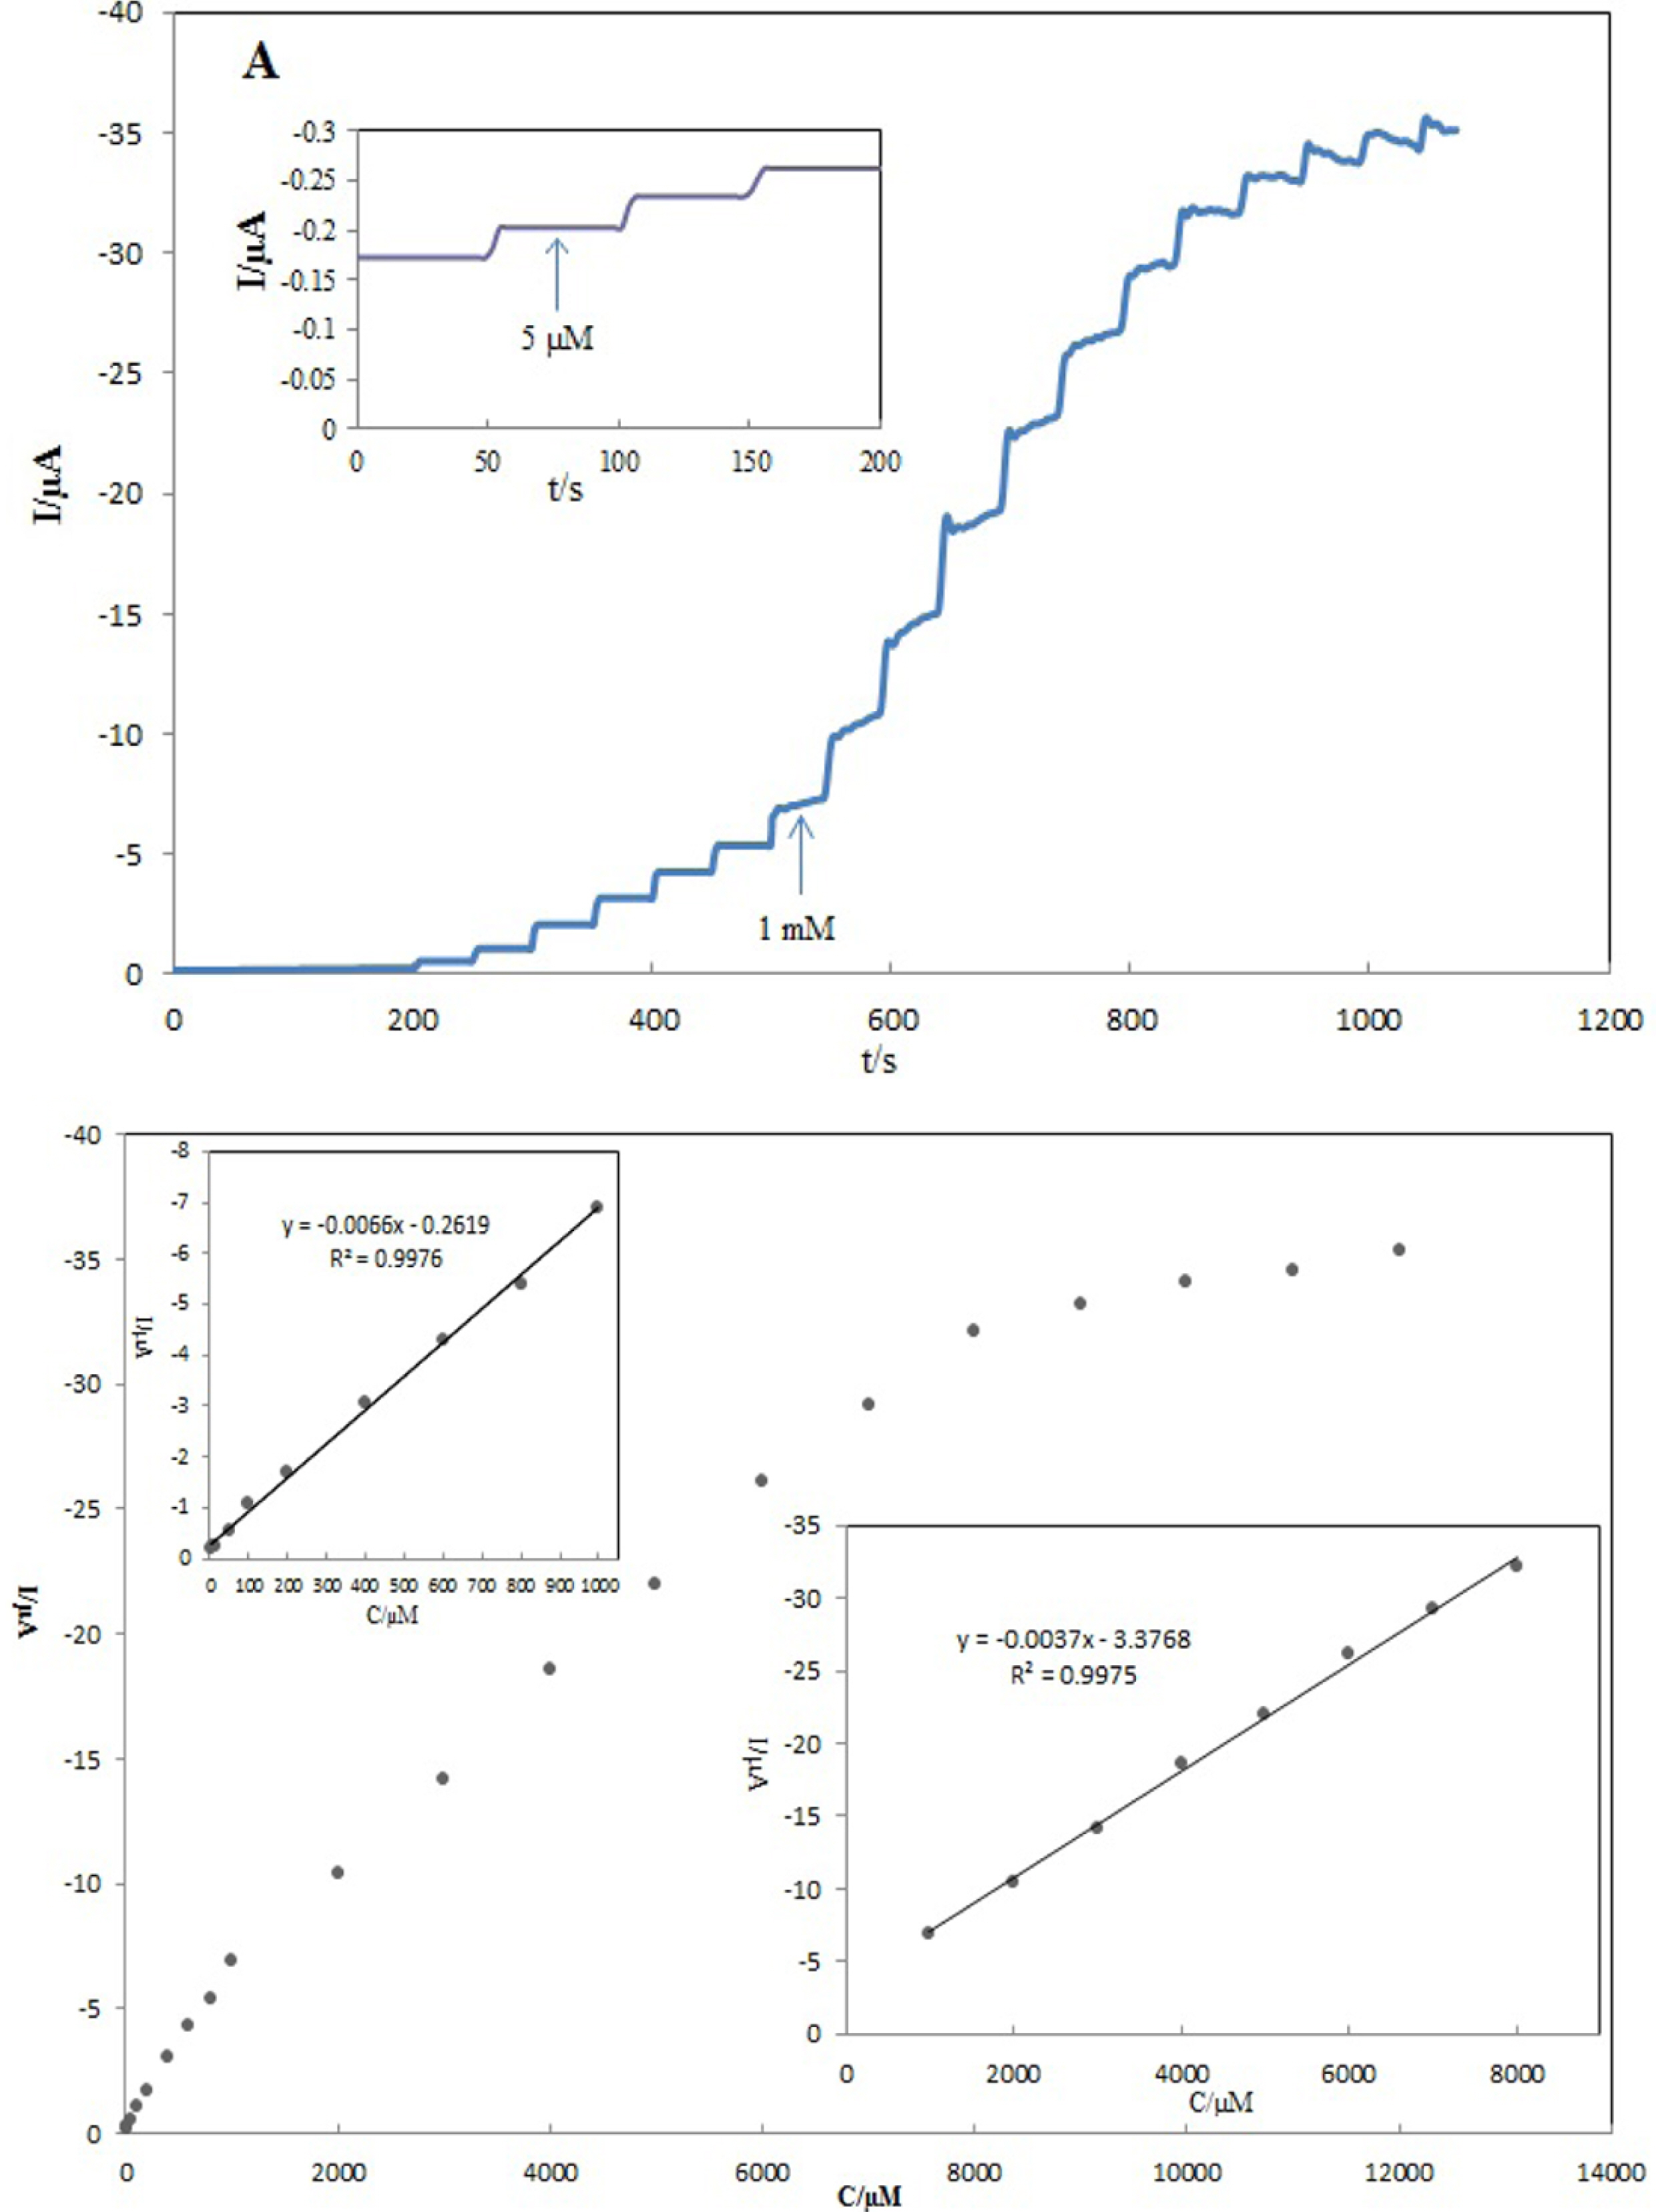
(A) amperometric response of Cu(btec)0.5DMF-GCE with successive addition of H2O2 into 0.1 M PBS, (B) relationship between the reduction current and H2O2 concentration.
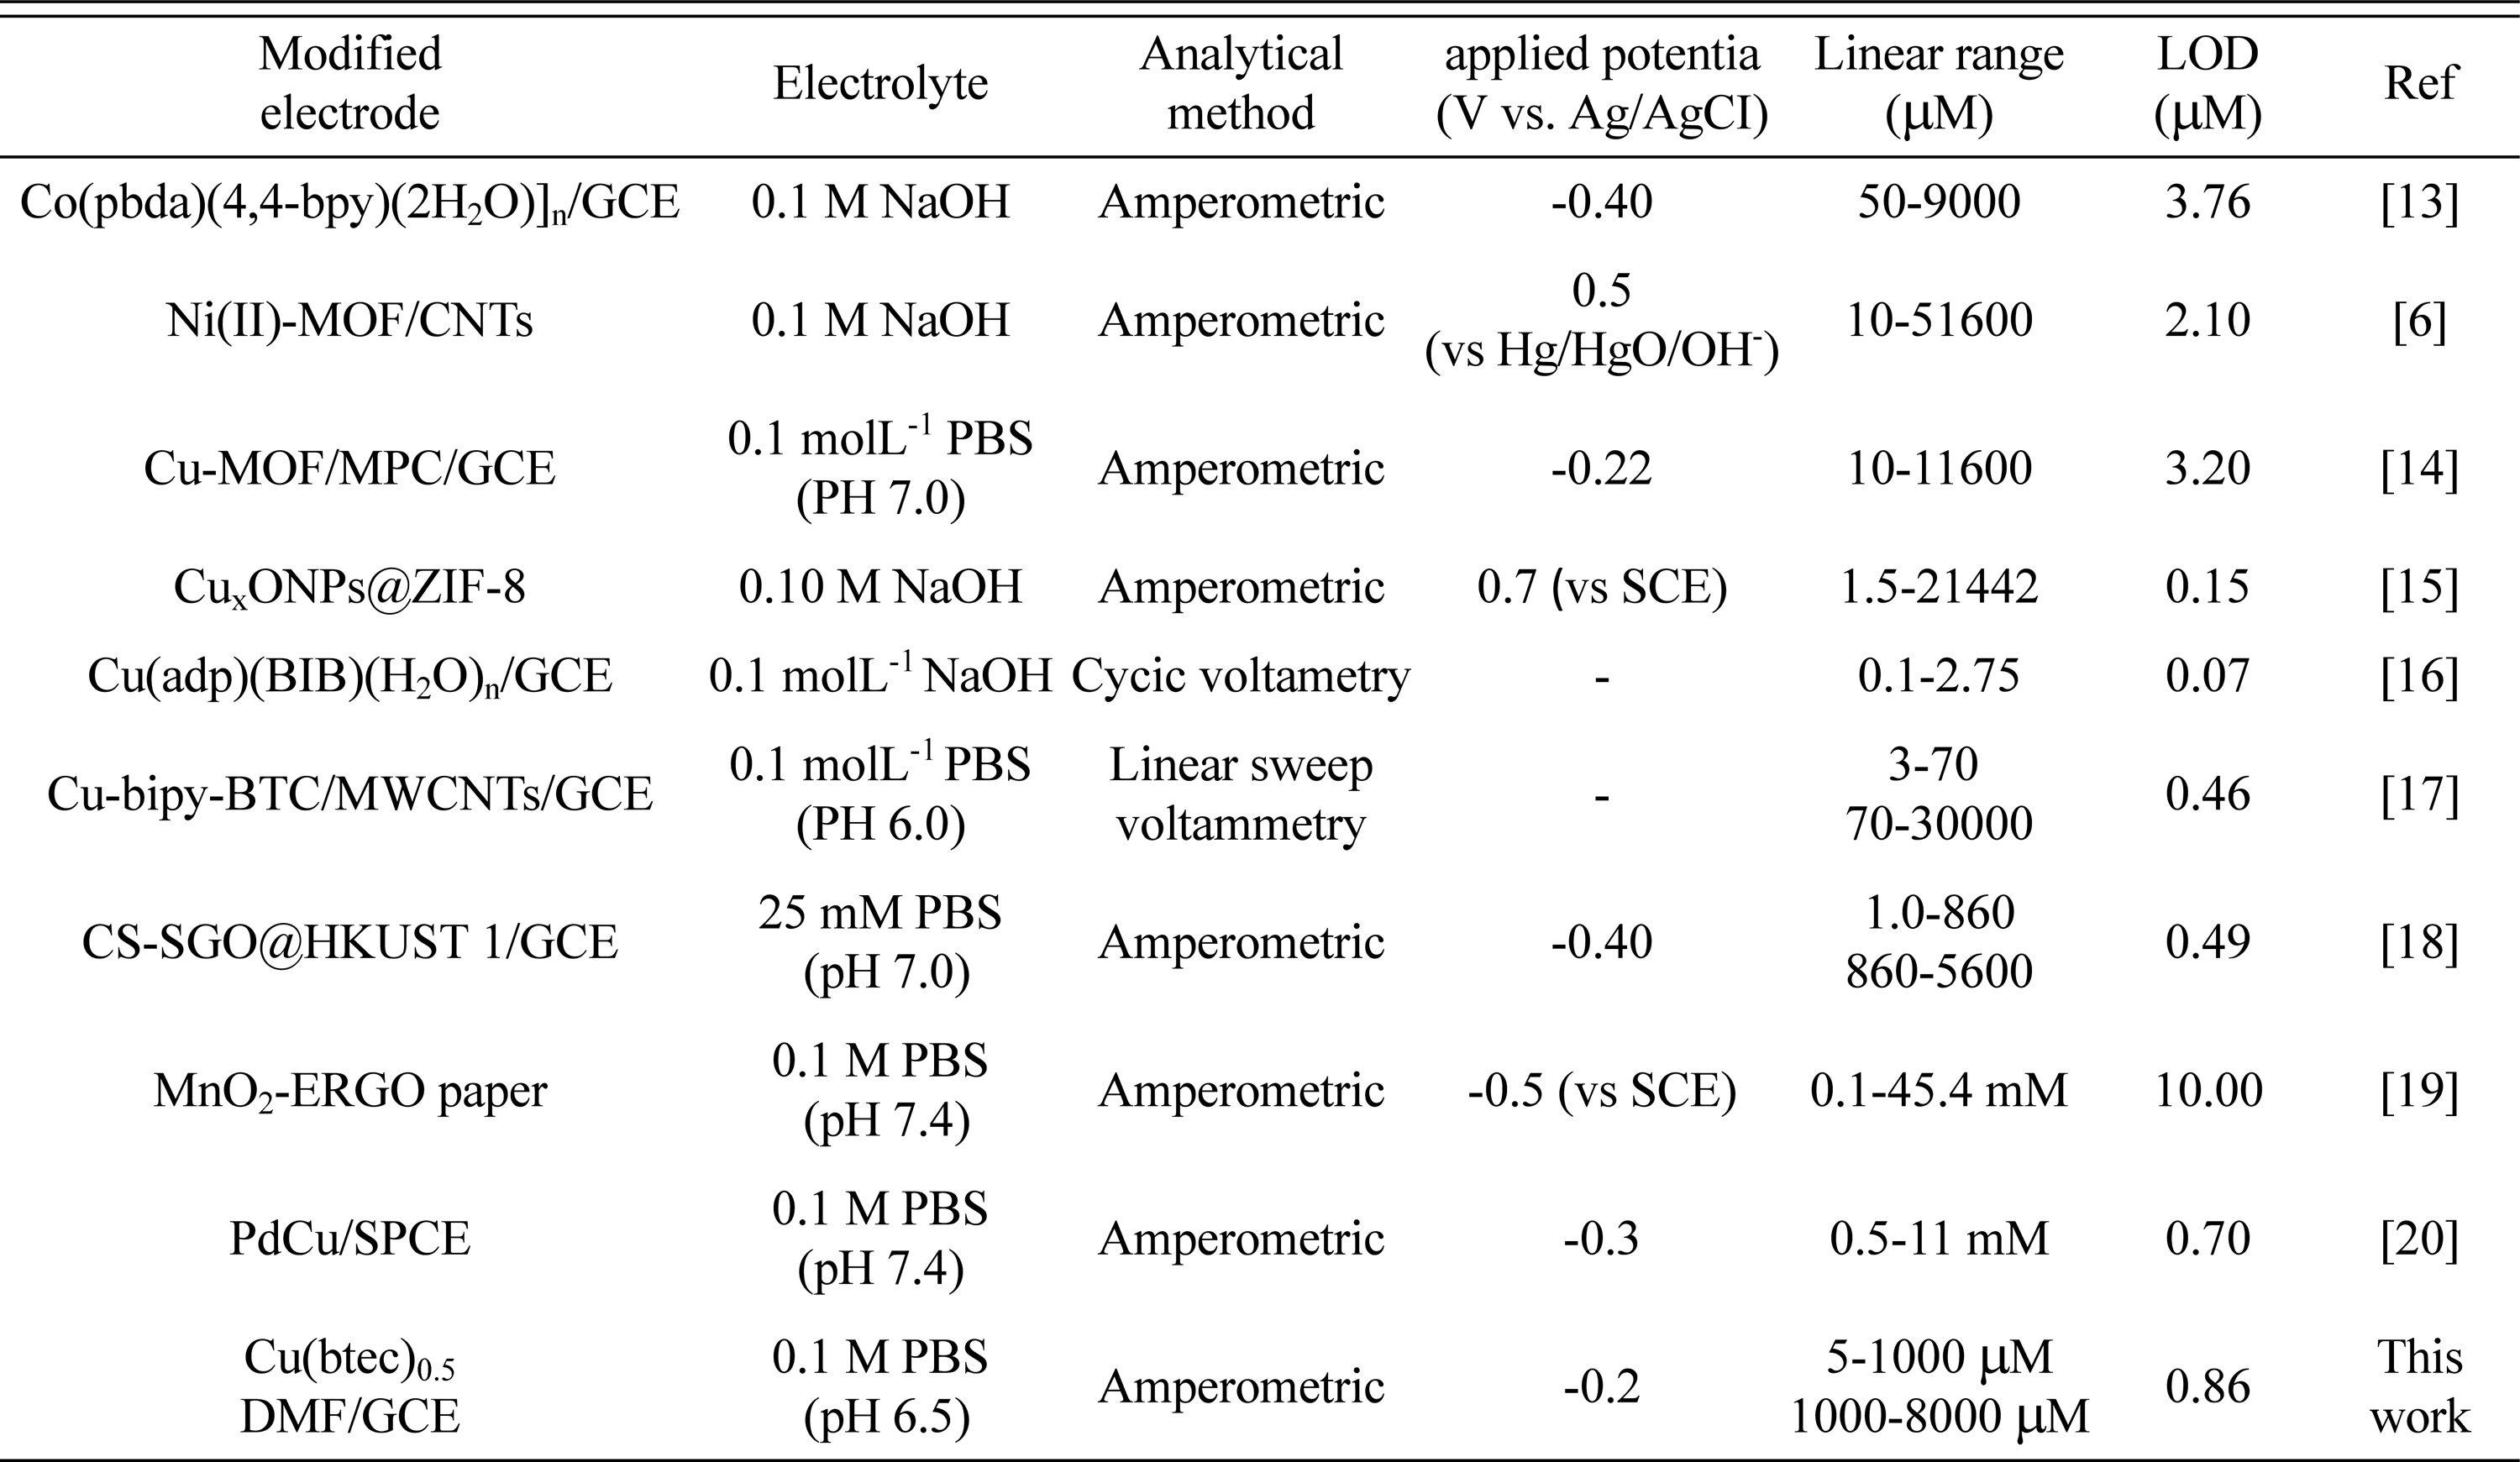
Comparison of the electrochemical performance of the non-enzymatic H2O2 sensors.
3.5. Repeatability, reproducibility, stability and selectivity the H2O2 sensor
Repeatability and reproducibility are two important parameters to evaluate the ability of a sensor. A good repeatability is shown by the Cu(btec)0.5DMF-GCE, with a relative standard deviation (RSD) of 7.9% for seven successive detections at 1.0 mM H2O2 into 0.1 M PBS (pH 6.5). By the same token, it exhibits a reproducible current response with a RSD of 4.3% for five individual electrodes. These results indicate the excellent reproducibility and repeatability of the Cu(btec)0.5DMF-GC electrode, which are considered a highly desirable characters in its usage in electrochemical non-enzymatic sensors. Furthermore, by measuring the amperometric response of 2 mM H2O2, during a prolonged 500 s experiment (Fig. 8A), the stability of the H2O2 sensor was tested. The response remains stable throughout the experiment (only a 3.86% decrease in current was observed), showing that Cu(btec)0.5DMF is effectively stabilized onto GC electrode. Finally, the effect of electroactive interfering species on the modified electrode was investigated. Fig. 8B shows the amperometric response of the electrode with the continuous additions of 2 mM H2O2, 2 mM glucose, 2 mM sucrose, 2 mM L-cysteine, 2 mM L-ascorbic acid and 2 mM H2O2 into 0.1 M PBS. It was found that, the current response of the mentioned electroactive interfering species is quite negligible which puts a true mark on the fact that the Cu(btec)0.5DMF-GCE possesses a good selectivity for the determination of H2O2.
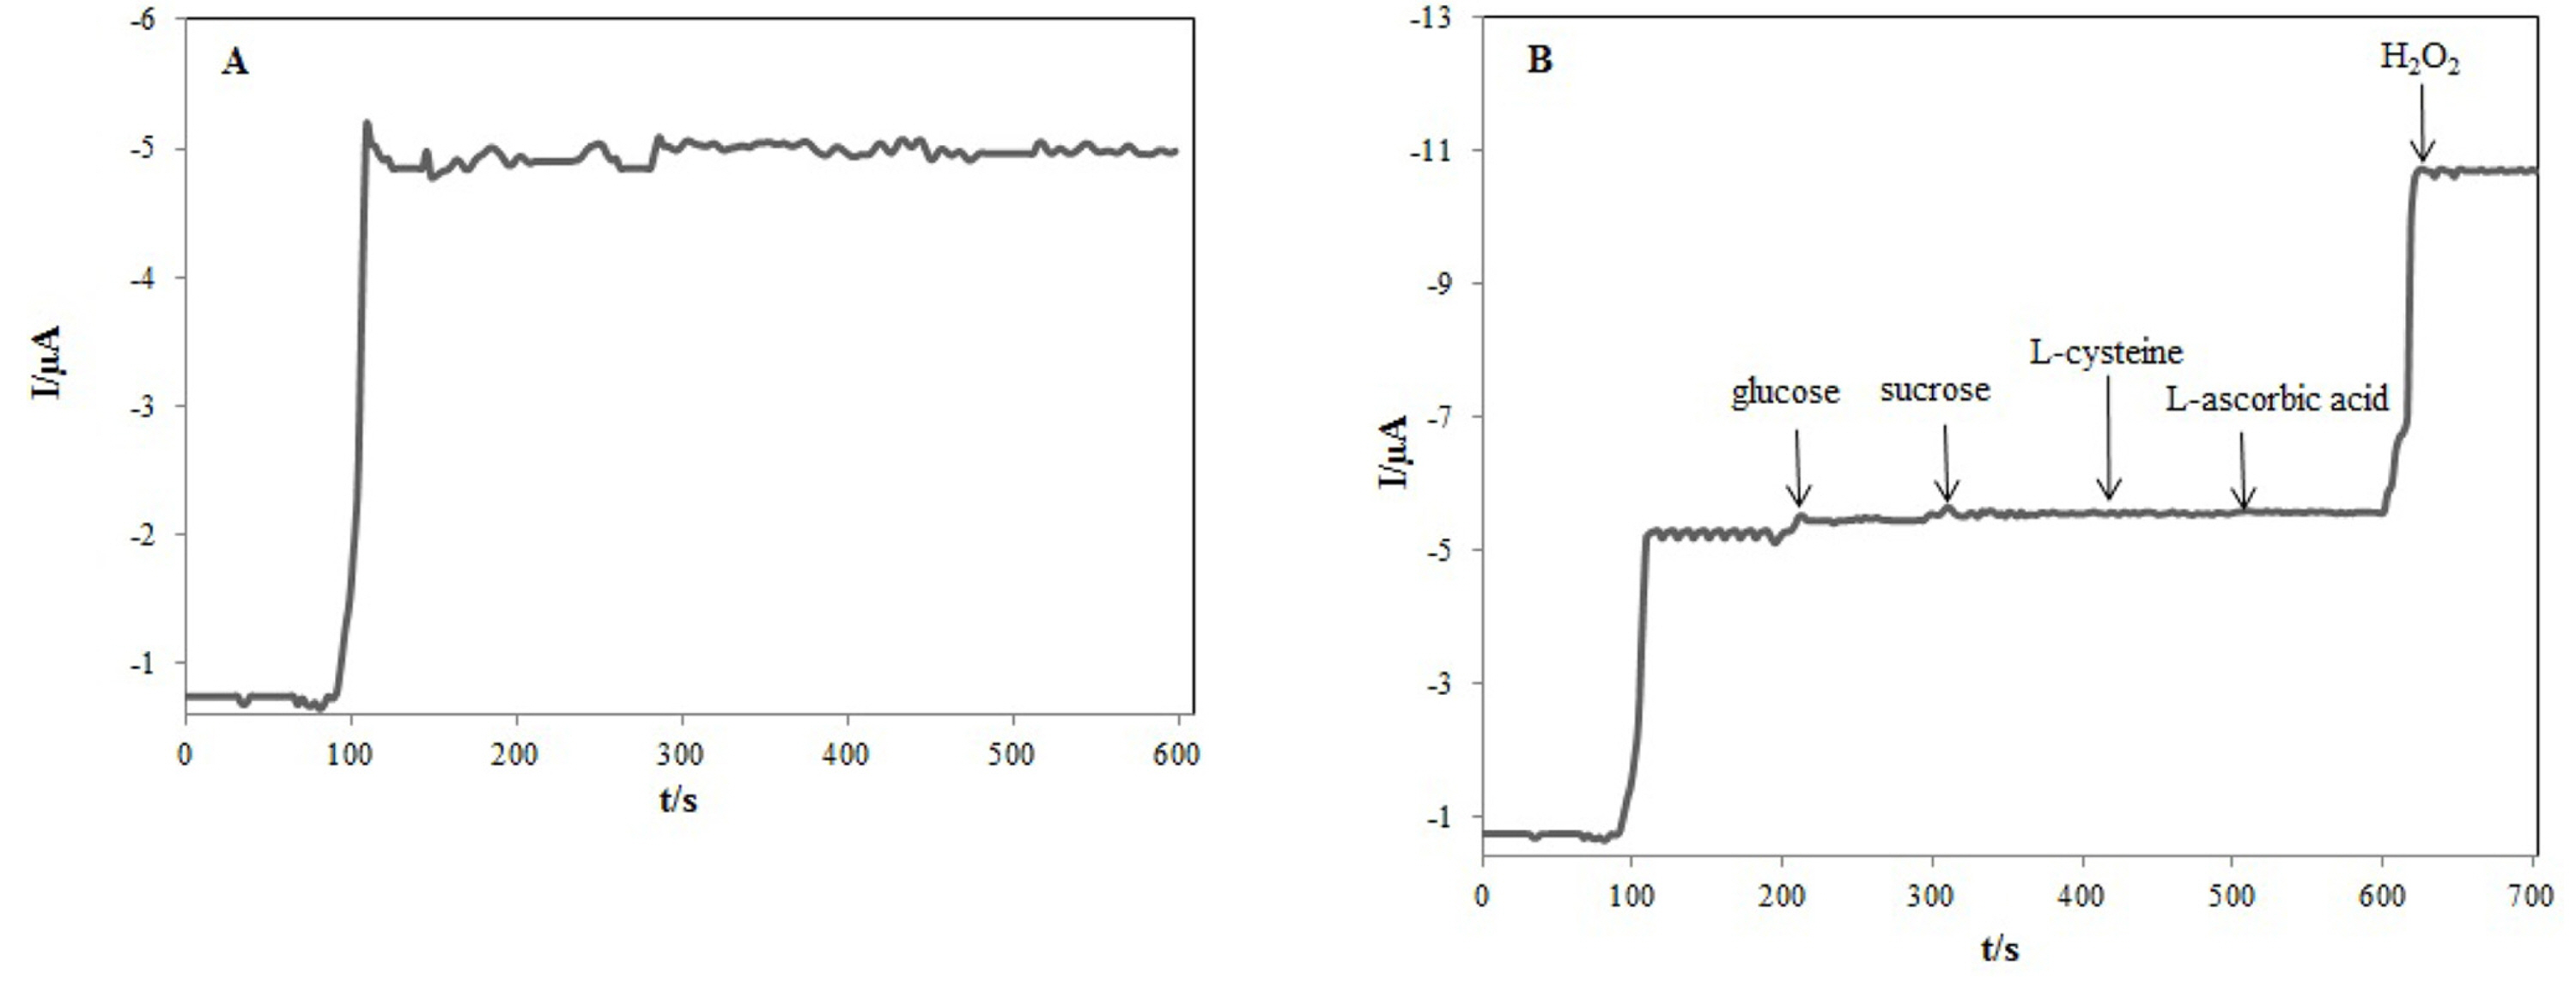
(A) Amperometric response of 2mM H2O2 (B) amperometric response of the Cu(btec)0.5DMF-GCE with continuous additions of different compounds.
4. Conclusions
In summary, this paper reports on the easy preparation of Cu(btec)0.5DMF to construct a novel non-enzymatic amperometric sensor for the detection of H2O2 for the first time. Electrochemical assays showed that the Cu(btec)0.5DMF modified GC electrode exhibited outstanding performance for nonenzymatic H2O2 detection with a wide linear range (5-8000 μM), and a low detection limit (0.865 μM). Moreover, Cu(btec)0.5DMF modified GC electrode demonstrated long-term stability, good reproducibility, and excellent anti-interference ability against common interfering species.