Biocides Effect on the Microbiologically Influenced Corrosion of Pure Copper by Desulfovibrio sp.
Article information
Abstract
The aims of this study were to determine the corrosion behavior of pure copper in the presence of Desulfovibrio sp. and also to investigate the effects of glutaraldehyde (GD) and isothiazolinone (ISO) on the corrosion behavior of pure copper in the presence of this sulfate-reducing bacteria (SRB) strain by using electrochemical techniques. Electrochemical measurements of pure copper were carried out at specified time intervals (0, 8, 24, 48, and 96 hr) over a period of exposure . Corrosion rates of pure copper from anodic and cathodic Tafel slopes and corrosion potential (Ecorr) were determined. Biofilm and corrosion products on the copper surfaces were observed by Field Emission Scanning Electron Microscopy (FESEM) and Energy Dispersive X-Ray Spectrometry (EDS) analyses. The effects of solution types (PC (Postgate’s C medium) and SRB (Desulfovibrio sp.)) and exposure times of copper and biocides (ISO or GD) on the corrosion rates of pure copper were evaluated by statistical analyses. As a result of the FESEM analysis, biofilm formation was observed on the surfaces of pure copper exposed to the Desulfovibrio sp. cultures both with and without the biocides. The results show that the pure copper was corroded by Desulfovibrio sp. However, the addition of GD or ISO to the Desulfovibrio sp. culture resulted in a decrease in the corrosion rate of the pure copper. It was also observed that both of the biocides showed a similar effect on pure copper’s corrosion rate caused by Desulfovibrio sp.
1. Introduction
Copper is one of the most important metals in industry owing to its combination of mechanical workability, excellent electrical and thermal conductivity, and its relatively noble properties. It is widely used in many applications in electronic industries and communications as a conductor in electrical power lines, pipelines for domestic and industrial water utilities, heat conductors, and heat exchangers in cooling systems [1-5]. Since cooling systems provide suitable conditions for microbial growth, biofilm formation begins immediately on the surfaces of the system and causes many problems in the system, such as reduction in heat transfer, occlusion, and corrosion [2-6]. Although copper and its alloys are toxic to fouling organisms, they are subject to microbiologically influenced corrosion (MIC) due to the forming of biofilm on the surface, especially experiencing severe attack by sulfide if conditions allow for the growth of sulfate-reducing bacteria (SRB) [7]. SRB can also decrease the anodic zone area and promote localized corrosion of copper [8]. It has been reported that H2S and biofilm produced by Desulfovibrio sp. and Desulfomaculum sp. can cause pitting corrosion and/or stress corrosion cracking on copper alloys [9].
Generally, to control biofilm and corrosion, most industries periodically add biocides and inhibitors into the cooling-water systems. Biocides decrease microbial activity by killing and/or inhibiting the growth of microorganisms in several ways [2,10,11]. Glutaraldehyde, which has been used for many years, is the most consistent biocide for controlling microorganisms. Isothiazolinone (ISO) is a compound containing sulfur, nitrogen, and oxygen and is soluble in water [5]. Studies have shown that ISO has a strong inhibitor efficacy on the growth of SRB not only in cooling towers but also in oilfield injection, paper-mill and metalworking fluid systems [12-14]. Aruliah et al. (2014) reported significantly less pitting corrosion on the surfaces of copper in the presence of the bronopol [15]. It has also been reported that, while glutaraldehyde (GD) is very effective on SRB on carbon steel surfaces, inhibiting localized corrosion significantly, azole is particularly effective on SRB on copper alloys [16].
The electrochemical behavior of copper and its alloys has been studied extensively over a wide range of experimental conditions to explore different processes such as dealloying, stress corrosion cracking, and pitting corrosion [17]. However, electrochemical studies on the MIC of pure copper are restricted, especially involving Desulfovibrio sp. [3,18]. Copper surfaces have a biofilm layer and also copper oxide (cuprite) formation, particularly in an alkaline water environment in copper pipes [18].
The aims of this study were to determine the corrosion behavior of pure copper in the presence of Desulfovibrio sp. and to investigate the effects of GD and ISO on the corrosion behavior of pure copper in the presence of this SRB strain using electrochemical techniques.
2. Experimental
2.1. Test specimens
The test material was pure copper (99.9 wt. % Cu) used in cooling towers as a heat exchanger. Pure copper coupons were used with approximate dimensions of 12.5 × 12.5 × 2 mm. Coupons were polished mechanically with 320, 400, 600, and 800 grit size emery paper. The surface was protected with silicon to leave 1 cm2 surface in contact with the medium. Before each experiment, the coupons were immersed in double-distilled water, rinsed with ethanol, and dried with air.
2.2. Culture Medium Conditions
The experiments were carried out in two different electrochemical cell systems: a control and a bacterial culture. The study was performed using a pure culture of the strain Desulfovibrio sp. isolated from cooling-tower water in our previous study [19]. All experiments were carried out in sterile Postgate’s C medium (PC) and a pure Desulfovibrio sp. culture with and without biocides. The PC medium consisted of sodium lactate (6.0 g/L), KH2PO4 (0.5 g/L), NH4Cl (1.0 g/L), Na2SO4 (4.5 g/L), CaCl2.6H2O (0.06 g/L), MgSO4.7H2O (0.06 g/L), yeast extract (1.0 g/L), resazurin (0.001 g/L), FeSO4.7H2O (0.004 g/L), C2H3O2SNa (0.1 g/L), C6H5O7Na3.2H2O (0.3 g/L) [20]. The pH was adjusted to 7.2 by 10% NaOH. C2H3O2SNa and FeSO4.7H2O were added after boiling the medium, passing it through 99.9% N2 gas. The medium was sterilized in an autoclave for 15 minutes at 121℃ and then cooled in a glove-box system. Anaerobic conditions were provided in glove-box system and all experiments were carried out under anaerobic conditions.
For preparation of the Desulfovibrio sp. culture before the experiments, PC medium (800 mL) was inoculated with an appropriate volume (10%) of a one-day-old Desulfovibrio sp. culture, resulting in an initial concentration of 25 × 106 per mL [19]. Concentrations of 150 ppm GD and 10 ppm ISO were added separately to the sterile PC medium and one-day-old Desulfovibrio sp. cultures.
2.3. Electrochemical Measurements
The electrochemical corrosion tests were carried out with a computer-controlled testing device by measuring the potentiodynamic polarization curves. All electrochemical tests were carried out in a conventional electrochemical cell, with a carbon rod as the counter electrode, a saturated calomel electrode (SCE) as the reference electrode, and the prepared samples as the working electrode. The measurements were carried out using a potentiostat/galvanostat (Parstat 2253). The working solutions were mixed using a magnetic stirrer, and all of the measurements were performed at 28℃. Copper coupons with a top surface area of 1 cm2 were used and exposed to the culture media. Electrochemical measurements were carried out at specific time intervals (0, 8, 24, 48, and 96 hr) in a sterile PC medium, and Desulfovibrio sp. culture with and without GD or ISO biocides. Potentiodynamic polarization curves were obtained at a scan rate of 1 mV/s within initial potential −550 mV to final potential +800 mV from open circuit potential (OCP) compared to the corrosion potential (Ecorr).
2.4. Surface Characterization
Biofilm formation and corrosion products were determined by Field Emission Scanning Electron Microscopy (FESEM) and Energy Dispersive X-ray Spectrometry (EDS) at the end of the experiment. Coupons were fixed with 2.5% GD, followed by dehydration in a graded series (30%, 50%, 80%, 95% v/v) of ethanol and air-drying [11]. The dried samples were coated with palladium (15 nm) and imaged with JEOL JSM-6335. The surface morphologies were observed by FESEM and the chemical analyses were done by EDS.
2.5. Statistical Corrosion Rate Analysis
The corrosion rates were analyzed by using factorial design statistically. Three factors and two levels (Table 1) were selected to control the parameters of corrosion. Variable factors included: solution type (PC and SRB [Desulfovibrio sp.] culture) (A), exposure times (8 and 24 hr) (B), and the biocides (ISO or GD) (C). Interaction graphics were determined by MINITAB v16 software.

Determination of controlling factor and their levels.
3. Results
Electrochemical experimental results revealed that Ecorr of the pure copper shifted to active values in the presence of Desulfovibrio sp. according to the sterile PC medium (Fig. 1, Table 2). The changes in the corrosion rates according to the times of exposure are given in Fig. 2. The corrosion rate of copper in the presence of Desulfovibrio sp. reached its maximum value at 8 hours of exposure, then decreased gradually and was detected as 1.25 mpy at the end of the experiment.

Polarization curves of the pure copper coupons after 8 hours of exposure; PC: Sterile PC medium, SRB: Desulfovibrio sp. culture.

The electrochemical corrosion parameters of the pure copper in the sterile PC medium and Desulfovibrio sp. culture during interval times.

The corrosion rate valus of copper exposed to the SRB cultures with and without the biocides over 96 hours of exposure.
The polarization curves of the copper coupons exposed to the sterile PC medium and Desulfovibrio sp. culture containing 150 ppm GD or 10 ppm ISO after 24 hours of exposure are given in Fig. 3. After the addition of the biocides into the Desulfovibrio sp. culture, the Ecorr of the coupons shifted slightly to positive values after 24 hours (Fig. 3, Table 3). It was also observed that the corrosion rate of the coupons decreased significantly in the culture without biocides (Fig. 2). However, a small increase was detected in the corrosion rate of copper exposed to the sterile PC medium with the biocides after 96 hours.
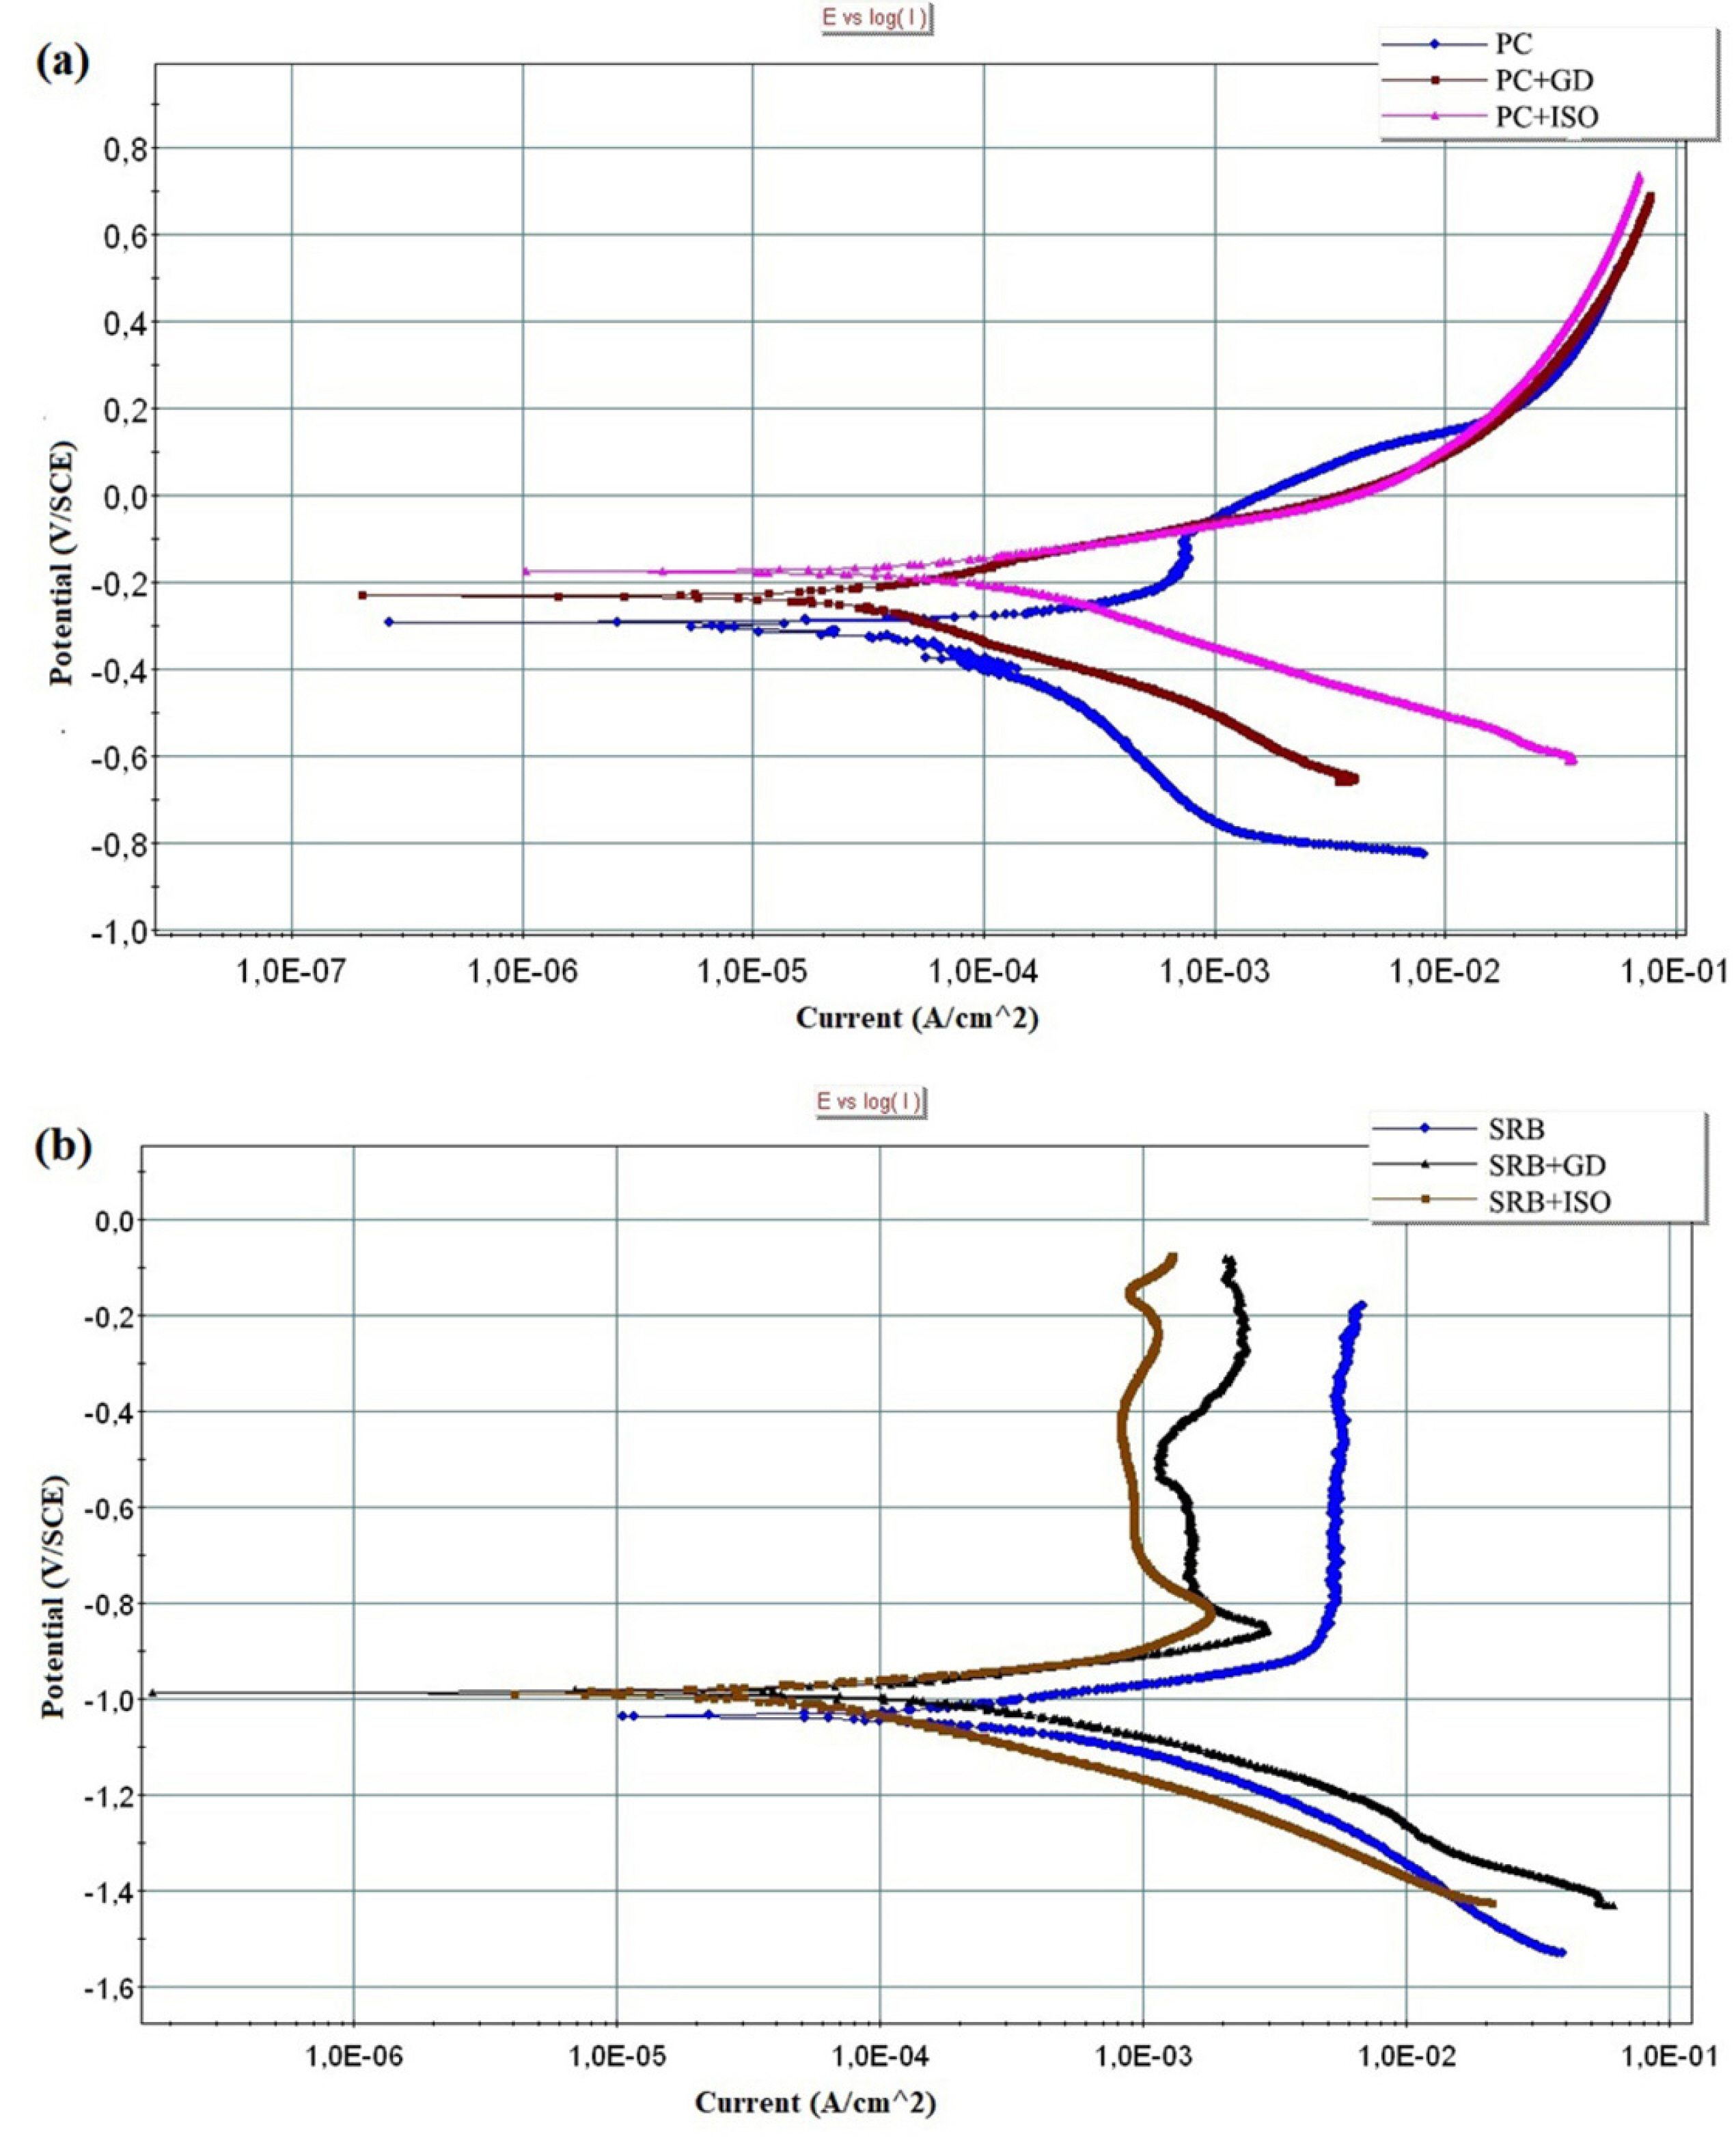
Polarization curves of the pure copper coupons after 24 hours of exposure a) Sterile PC, PC+GD (150 ppm), PC+ISO (10 ppm) b) SRB (Desulfovibrio sp.) culture, SRB+GD (150 ppm), SRB+ISO (10 ppm).

The electrochemical corrosion parameters of pure copper in the sterile PC medium, Desulfovibrio sp. culture with and without biocides after 24 hours of exposure.
Biofilm formation was observed on the copper surfaces exposed to the Desulfovibrio sp. Culture, both with and without the biocides (Fig. 4). The corrosion products on the surface of the copper coupons exposed to the Desulfovibrio sp. culture, with and without the biocides, were observed to mainly contain Cu, S, and O (Fig. 5a-c).
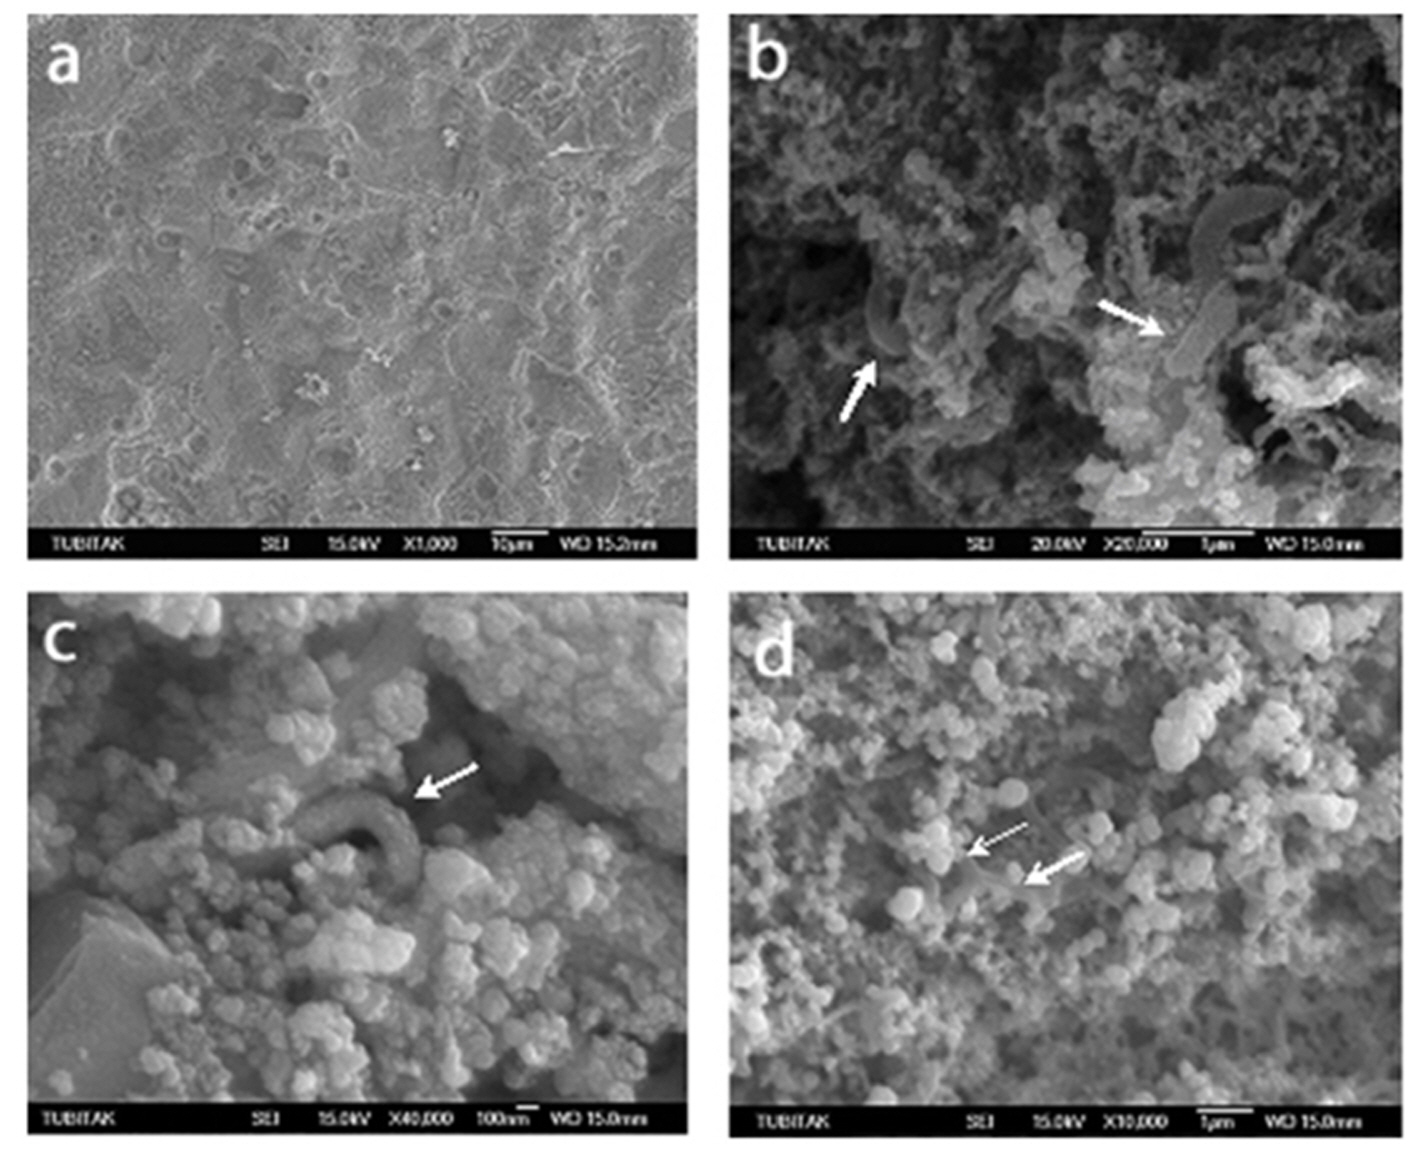
FESEM micrographs of the copper surfaces exposed to the a) sterile PC medium, Bar = 10 µm, b) Desulfovibrio sp. culture, Bar = 1 µm, c) Desulfovibrio sp. culture with ISO, Bar = 100 nm, d) Desulfovibrio sp. culture with GD, Bar = 1 µm after 96 hr of exposure. The arrows indicate bacterial cell in the biofilm.

EDS analysis of the corrosion products formed on the copper surfaces after 96 hr of exposure. The coupons exposed to the a) Desulfovibrio sp. culture, b) Desulfovibrio sp. culture with ISO, c) Desulfovibrio sp. culture with GD.
The effects of the solution type (A), the exposure time of the copper (B), and the biocides (C) on the corrosion rate of the copper were evaluated statistically. While α = 0.05 (significance level) was taken, an interaction plot curve was obtained for the observation of each factor and its interaction effects. It was detected that the exposure time of copper (B) and the solution type (AC) with and without the biocides (A) have statistically important effects on the corrosion rate of pure copper (Fig. 6). While the solution type (A) caused an increase in the corrosion rate of copper (Fig. 7a), during the exposure time (B) a decrease was observed in the corrosion rate of copper (Fig. 7b). Additionally, GD and ISO biocides (C) have a similar effect on the MIC of copper statistically (Fig. 7c).
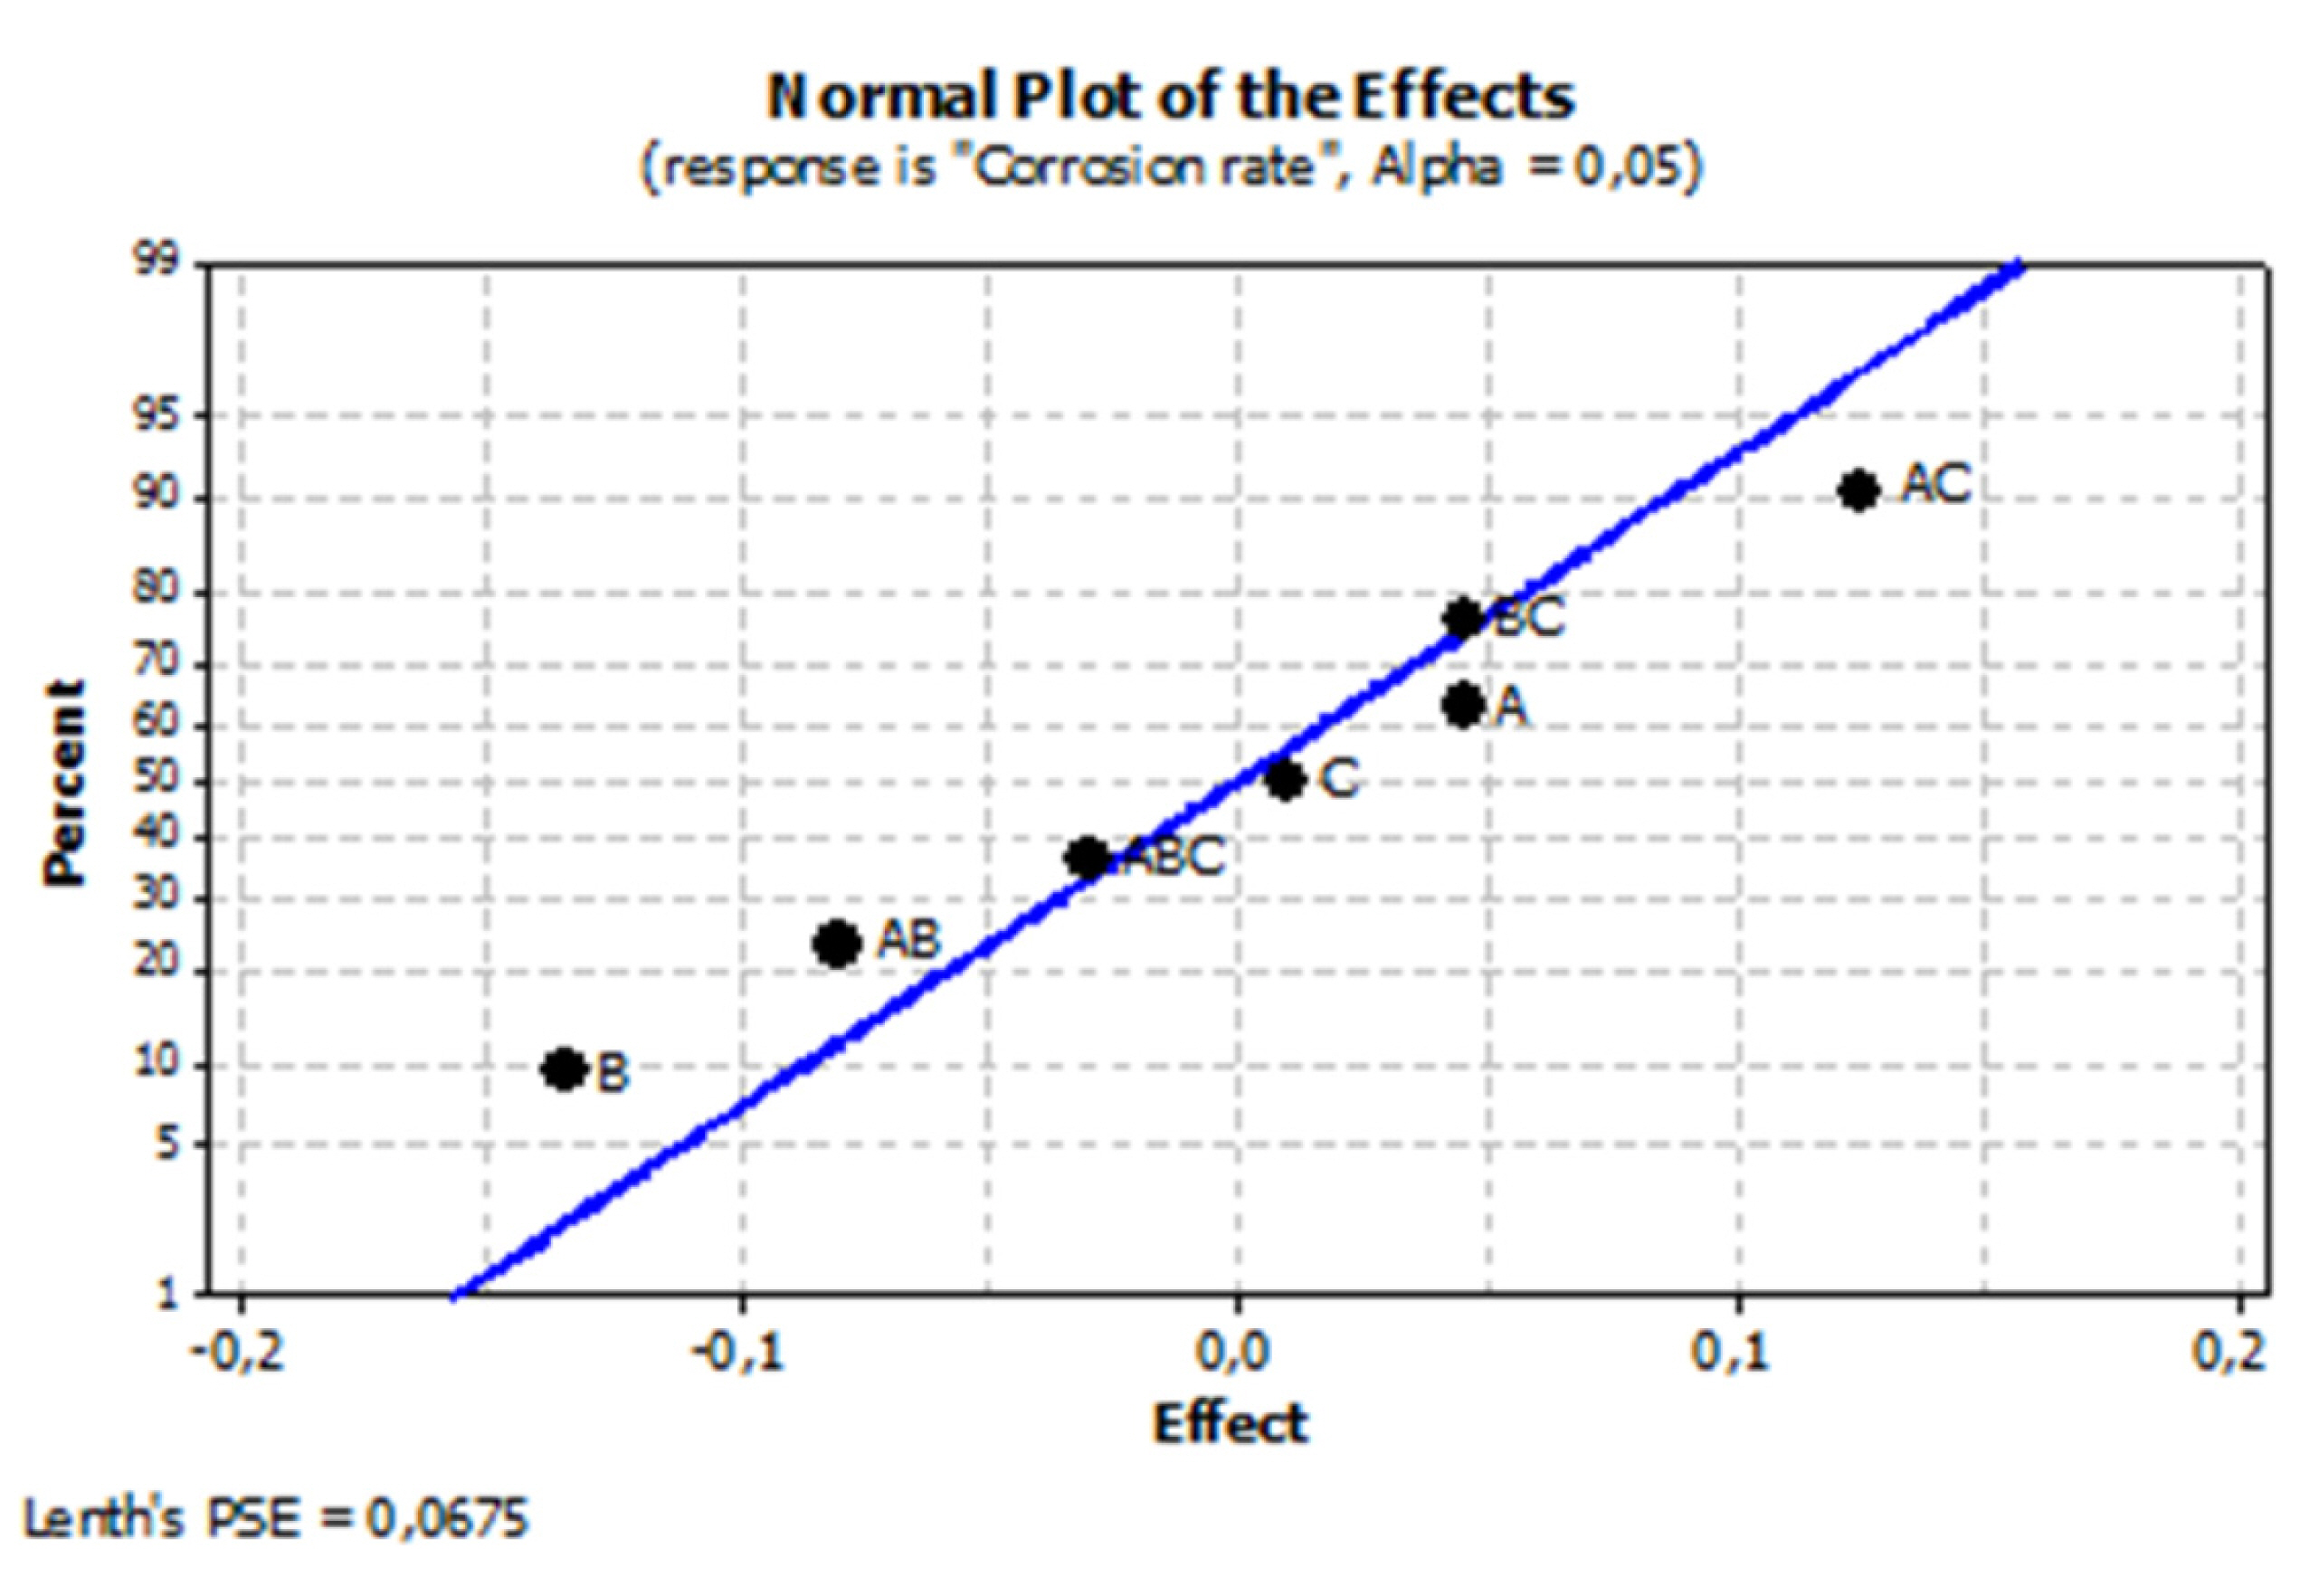
Interplot curve for corrosion rate changes associated with factors.
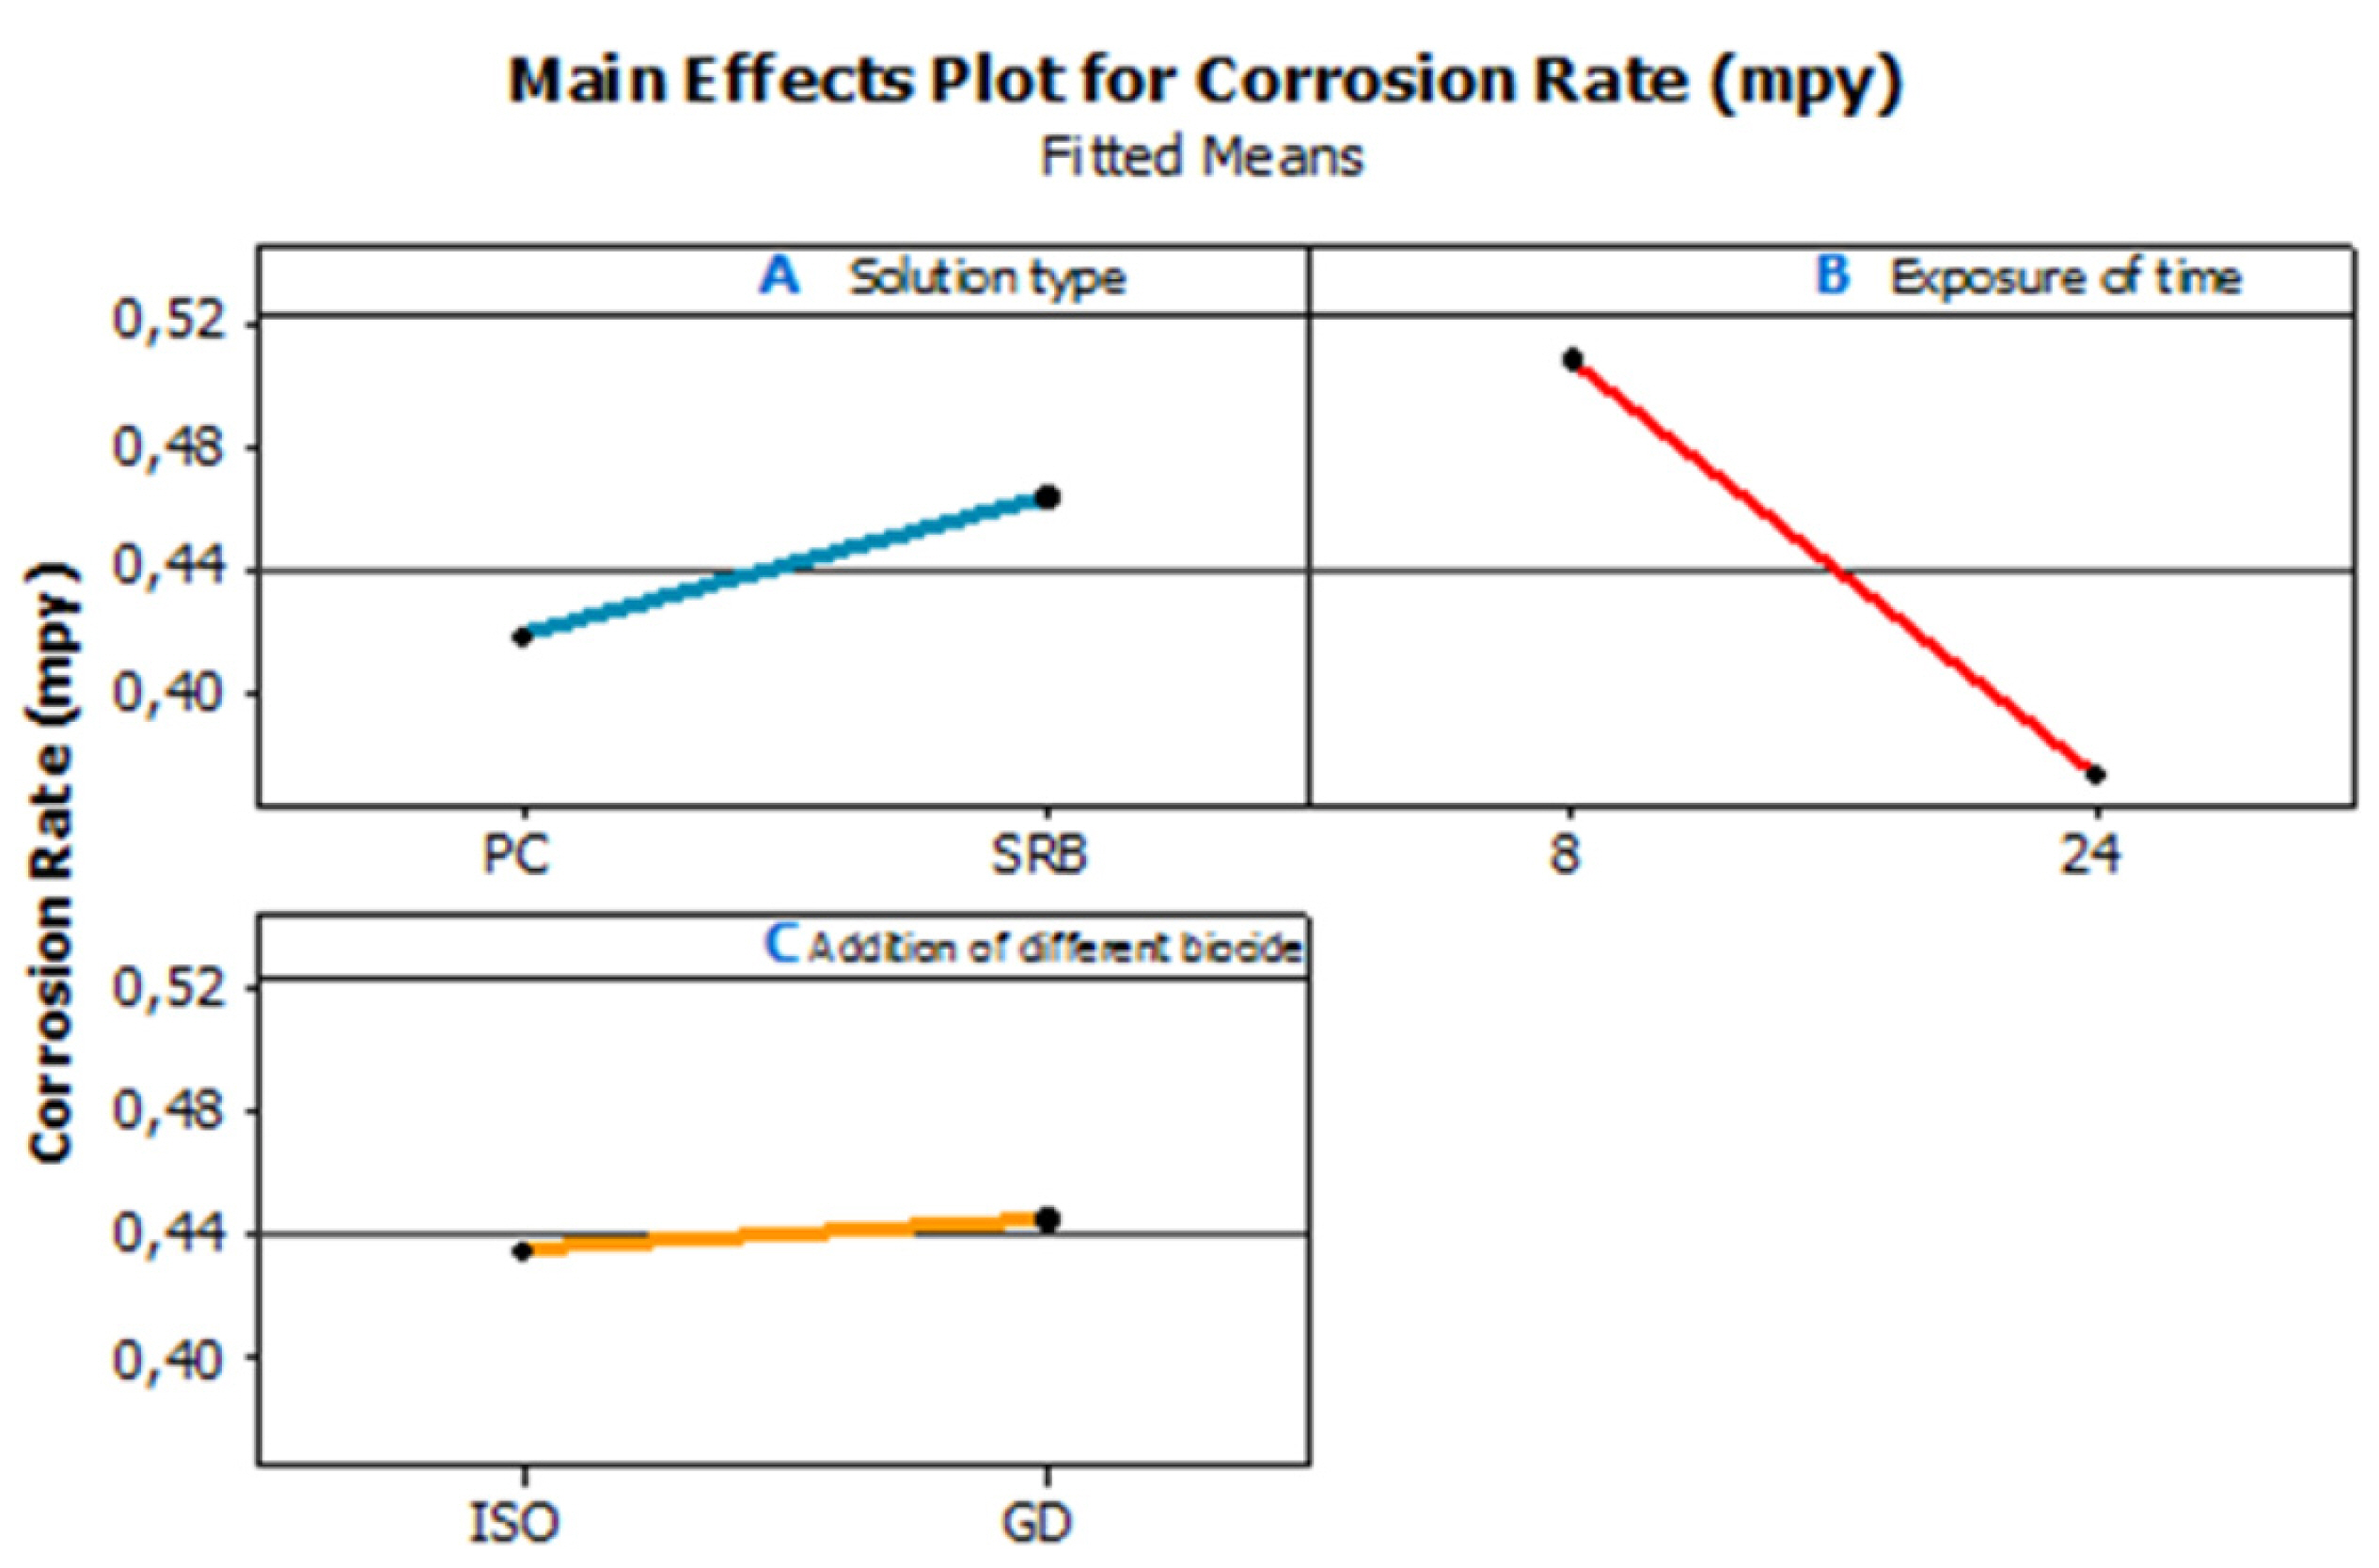
Interaction effects of factors over corrosion rates.
4. Discussion
Pure copper has a non-adherent biofilm layer that, in any event, contrasts with copper alloys or steel [5]. However, FESEM analysis validated that Desulfovibrio sp. attached to the copper surfaces and formed a surface biofilm layer. The formation of bacteria on the copper surface in the alkalinity media on the copper pipe was also observed [18]. In fact, Doğruöz et al. (2015) reported biofilm formation resulted in MIC on the copper surfaces exposed to cooling-tower water over ten months [21]. Copper alloys are not recommended for dirty water, which promotes the formation of microbial fouling with SRB [22].
Desulfovibrio sp. leads to the corrosion of the pure copper, similar to Cu-Ni (70/30) and Cu-Zn (70/30) alloys [23,24]. In the presence of Desulfovibrio sp., the Ecorr values of pure copper shift to more negative values. The reason for this is a variation of SRB activity of biofilm changes with SRB growth conducted by EIS [24].
There is a general belief that biocides decrease the corrosion rate of metals under corrosive conditions. It was observed that GD and ISO showed a significant decrease in the corrosion rate of the pure copper, meaning GD and ISO can be effective in inhibiting Desulfovibrio sp. activity and decreasing corrosion rates. Alhajji et al. (1996) reported that the addition of GD to bacterial culture leads to obtaining more noble Ecorr values in sulfide-present environments for Cu-Ni alloy since the biocide causes a decrease in sulfide-polluted systems with copper surfaces prone to corrosion [25].
The S peak in the corrosion products indicates that the sulfur reactions occurred on the copper coupons in the Desulfovibrio sp. culture, both with and without biocide addition, according to EDS analysis. As a result of the metabolic activities of SRB, S ions occur and react with Cu in copper alloys and form sulfides of this element [21-26]. Biofilm formation and its effects on the surface of copper in the presence of ISO have been observed by conducting experiments in model systems over ten months [26]. SRB’s influences on biofilm formation decrease with additional biocide types (GD, ISO, etc.). GD also shows the highest efficiency on mild steel [27].
5. Conclusions
(1) The results obtained from this study show that pure copper is corroded by Desulfovibrio sp.
(2) FESEM analysis validated the biofilm formation on pure copper by Desulfovibrio sp., both in the presence and absence of biocides.
(3) The exposure time of pure copper and the solution type (with and without biocides) have statistically important effects on the corrosion rate of pure copper.
(4) The corrosion rate of pure copper was reduced after 8 hours during the experiments in the presence of biocides. GD and ISO biocides have a statistically similar efficiency in decreasing the corrosion rate of the pure copper.
Acknowledgements
This work was supported by the Research Fund of Istanbul University [Project number: 7804].