1. Introduction
Recently, there has been substantial demand for high-capacity Li secondary batteries to meet the needs of electric vehicles and energy storage systems as well as mobile IT devices. For this reason, many research groups tried to enhance the battery performances by exploring alternatives to the core materials, while the main efforts of the battery manufacturers have been applied for modification of existing materials and cell design optimization of internal spaces. Among the alternatives, Si and Sn anodes have been researched intensively because of their high capacity and potential to overcome the theoretical capacity limit of commercialized graphite [1-8]. However, these high-capacity anodes undergo severe volume changes during the reaction, which brings critical problems in the key performance features such as cycling and reliability.
One of the typical phenomena of these anodes is the tendency to crack, and this crack propagation may cause an internal electric short. To solve these problems, many approaches, such as metal-carbon composites, thin-film electrodes, multiphase alloys, and active-nonreactive matrix, were employed, and remarkably improved results were achieved [15-18]. Among those approaches, the active-nonreactive matrix is known as one of the effective ways to suppress the cracking produced by volume changes [2, 6-13]. In previous studies on the active-nonreactive matrix, several research groups mainly adopted preparation methods of sputtering and mechanical alloying (MA) to optimize the electrochemical performance by controlling the elemental composition and/or the crystal structure [15]. These methods have various advantages, such as convenience of compositional survey and relatively simple process parameters, but also have difficulties in control of sample quality, such as crystallinity, and in transfer to larger production scale. It was reported that the samples from these preparation methods are undesired amorphous or a mixture of amorphous and crystalline, despite the deliberate design [15,19]. Moreover, a composition produced by a method, such as sputtering, might not be materialized easily and thus may lead to misjudging the optimum composition for practical applications.
Here, we report a SiŌĆōFeŌĆōAl ternary alloy prepared by a facile and inexpensive process, melt spinning, which can control a certain level of solidification speed (around 103ŌĆō106 K/s), and is known as the most suitable method for the mass production of alloys [16]. Another advantage of Si-alloys produced by the melt-spinning process is a tendency to be formed in the equilibrium state (most stable) as designed based on the phase diagram. As a rule, the phase diagram is very useful for metallurgists, material engineers, and material scientists to control the compositions and predict the phases of alloys under certain conditions. Therefore, the use of the phase diagram allows the design of alloys with required properties to be performed more efficiently and cost-effectively. In Li-ion batteries, as mentioned above, Si-based alloys are considered as the most promising anode material with the active/inactive matrix concept. Traditionally, by utilizing the phase diagram, we theoretically predict secondary phases formed along with active Si; however, their specific capacities should be practically measured. Thereby, the main purpose of this work is the development of a fundamental approach to predict specific capacities of Si-alloys in conjugation with the phase diagram. This prediction method can be used to efficiently design an alloy with a desired capacity without timeconsuming investigations of a large number of possible alloy compositions.
2. Experimental
2.1 Design of Si-based alloy samples
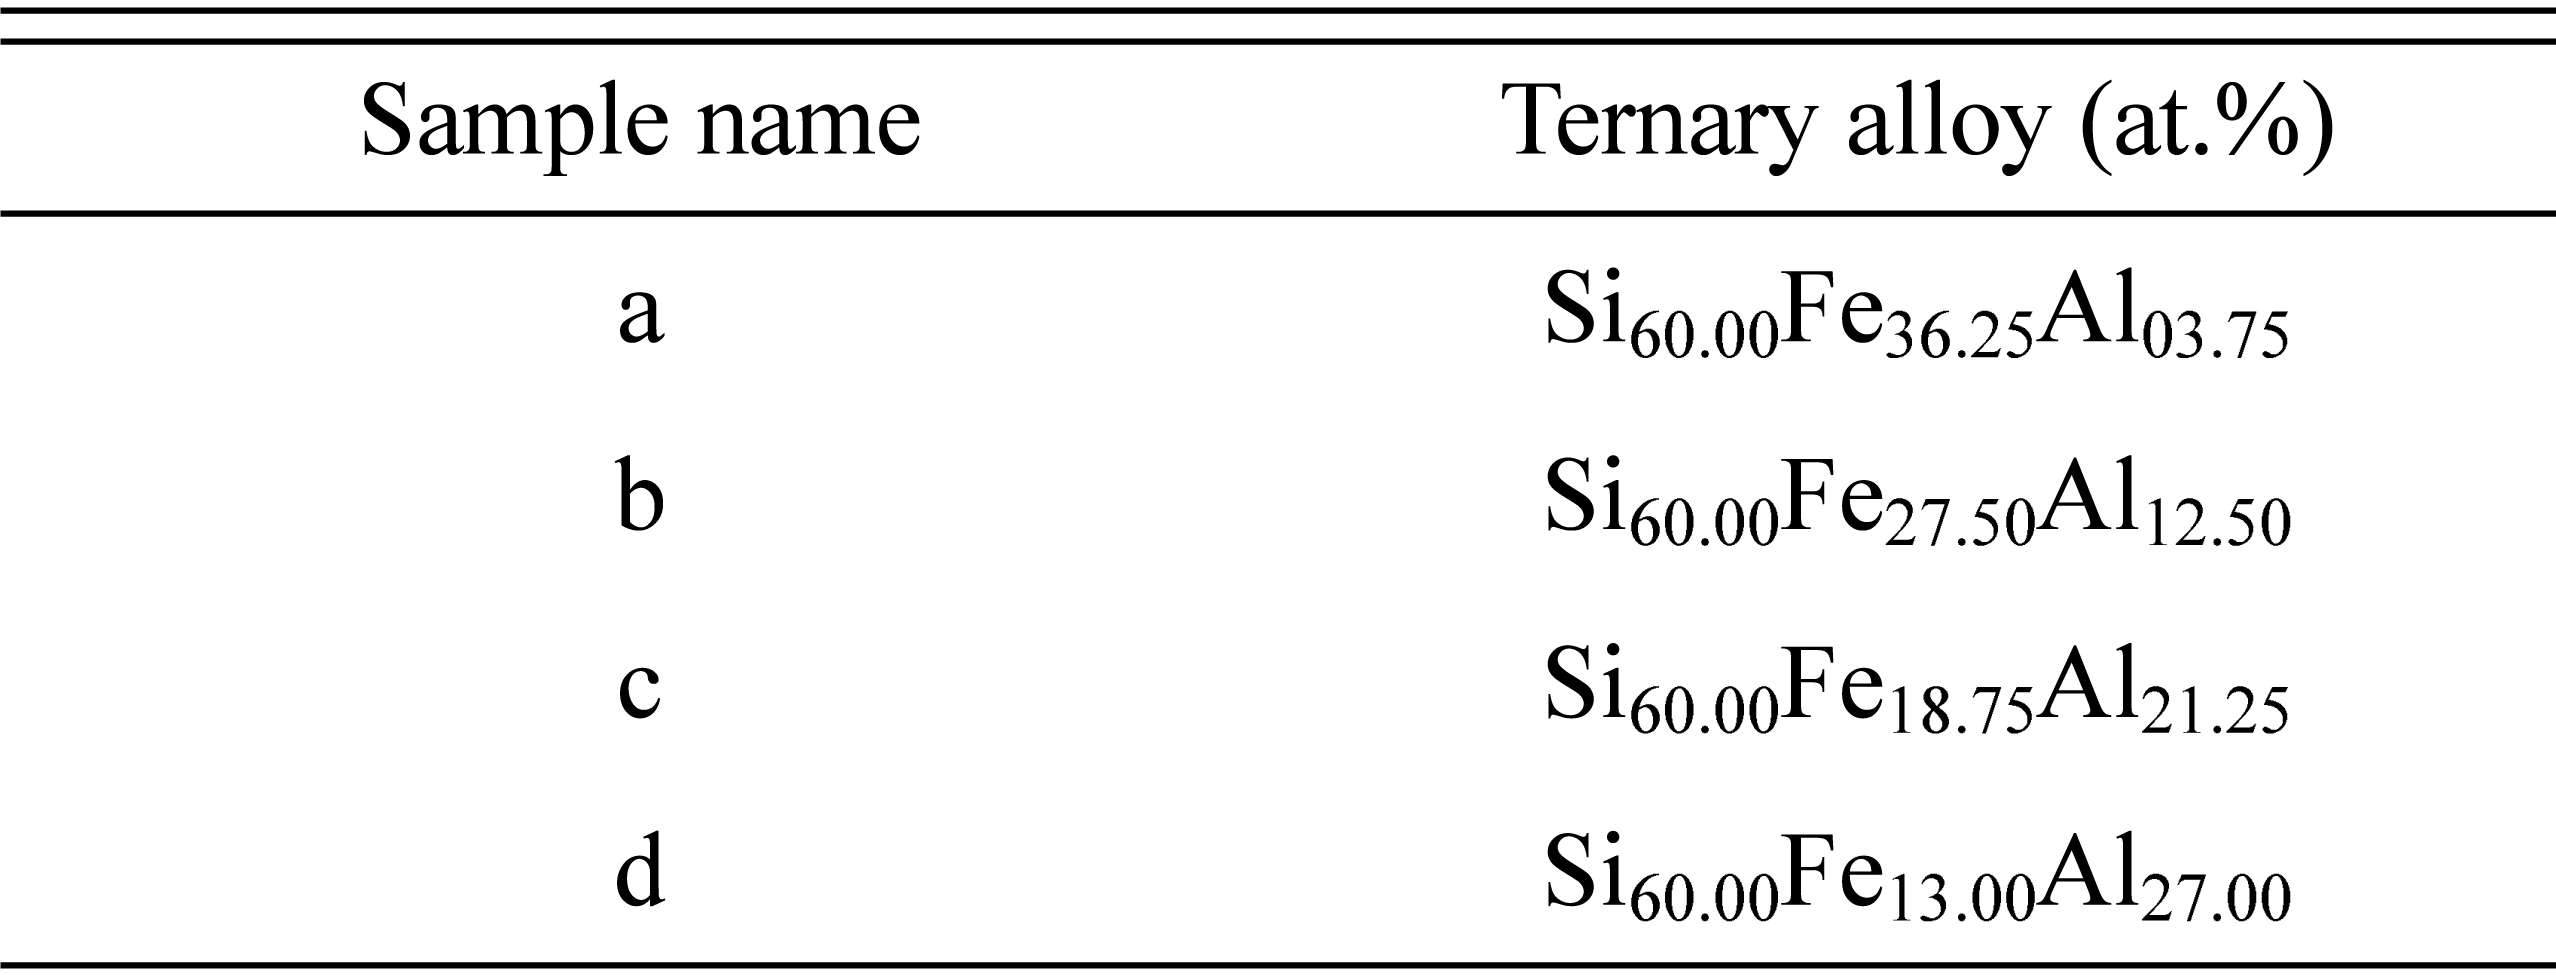
The purity of the used Si, Fe, and Al raw materials was 99%, 99.9%, and 99.9% (Taewon Scientific Co.), respectively. The raw materials were weighed by the atomic ratios of samples, as shown in Table 1, subsequently melted and cast as button shapes by an arc melting machine. Each alloy button was remelted three times in Ar atmosphere to acquire homogeneous alloy composition. The Si amount of all four samples was fixed to 60 at.%, and the ratio of Al and Fe was varied. The sample compositions designed in those three-phase coexistence regions were as shown in Fig. 1.

2.2. Alloy sample preparation and characterization
The melt-spinning method, which is known as the commercial rapid solidification process under gas atomization, was adopted to prepare the designed alloy samples. The schematics and photo of the melt spinning process are shown in Fig. 2. A previously prepared alloy button was inserted in a graphite nozzle with a bottom slit inside the melt spinning equipment and melted again with a high-frequency induction current in Ar atmosphere. After complete melting of the alloy in the nozzle, the melted alloy was squeezed out through the slit by increasing the gas pressure of Ar onto a rotating Cu wheel (rotational speed: 40 m/s). The melted alloy contacted the Cu wheel, and the liquid-to-solid phase transition was completed by rapid heat transfer. In this process, a fine alloy microstructure might be attainable by faster nucleation, as compared to the rather slower conventional solidification process. The average thickness of a ribbon type sample was around 20 ╬╝m. Wet milling was carried out by a paint shaker (Nara Science Corp. KM-2000T) for 20 min with a 5 g ribbon sample and a 200 g zirconia ball (diameter: 5 mm) in a 125 cc glass bottle filled with an n-hexane solution.

The microstructures of the samples in the ribbon state were observed by scanning transmission electron microscopy combined with energy-dispersive X-ray spectroscopy and selected area electron diffraction (STEM, EDS, and SAED, Hitachi HD 2300A). The phases were identified by an X-ray diffractometer (XRD, Bruker AXS, D8 Discover) with Cu K╬▒ in the 2╬Ė range of 10-90┬░.
2.3. Electrochemical measurement of the Si-based alloy samples
The working electrode was prepared by mixing a Si alloy powder, Ketjen Black (Infochems EC-600JD) as a conductive agent, and polyamide-imide binder (Solvay Torlon 4000T-HV) dissolved in N-methyl-2-pyrrolidinone (Sigma-Aldrich) with a weight ratio of 87:3:10, respectively. The resulting slurry was cast onto a Cu foil (12 ╬╝m, Iljin materials) by a doctor blade method and subsequently dried in an oven for 2 h at 110Ōäā to evaporate the solvent. The imidization of the binder was carried out at 400Ōäā for 1 h in the inert gas flow. Coin cells of the 2016 type were assembled in an Ar-filled glove box with a Li metal foil as the counter electrode and polyethylene as a microporous separator (W-scope Korea). The electrolyte was 1 M LiPF6 dissolved in ethylene carbonate/ethyl methyl carbonate with 5 vol.% of fluoroethylene carbonate as an additive (EC:EMC = 3:7 v/v.%, +5% FEC, Panax E-Tec Co.). Electrochemical tests were carried out using a battery cycler (Espec) in the potential range from 0.005 V to 2 V vs. Li/Li+ at 25Ōäā. Lithiation (charging) was performed at 100 mA/g constant current mode followed by a constant voltage of 0.005 V until the current density was 50 mA/g. And, delithiation (discharging) was performed at a constant current of 100 mA/g.
3. Results and Discussion
As shown in Table 1, all samples have the same atomic percentage of Si with a varying ratio of Al and Fe, and therefore it might be assumed that they would have the same reaction amount of Li with Si. However, there are different amounts of active Si due to the formation of various intermetallic compounds such as FeŌĆōSix and AlzŌĆōFeyŌĆōSix as shown in Fig. 1. We could infer that there is no active Si in the sample a because sample a is located in the three-phase coexistence region of FeSi, FeSi2, and Al2Fe3Si3 through the phase diagram. In the case of sample b, in the region of Si, SiFe2, and Al6Fe4Si6, a capacity of 300 mAh/g might be expected by the lever rule of active Si (  ) as shown in Fig. 3(a). The reversible reaction was assumed to be Li3.75Si with an identical capacity of about 3600 mAh/g [7, 14]. According to the same estimation procedure, the capacities of samples c and d were expected to be 963 mAh/g and 1368 mAh/g, respectively. Fig. 3(b) shows the capacity estimation of sample c by the lever rule of the phase diagram. The capacity estimation for all samples by the lever rule is summarized in Table. 2.
) as shown in Fig. 3(a). The reversible reaction was assumed to be Li3.75Si with an identical capacity of about 3600 mAh/g [7, 14]. According to the same estimation procedure, the capacities of samples c and d were expected to be 963 mAh/g and 1368 mAh/g, respectively. Fig. 3(b) shows the capacity estimation of sample c by the lever rule of the phase diagram. The capacity estimation for all samples by the lever rule is summarized in Table. 2.Fig.┬Ā3.
Capacity estimation line (red) of samples b (a) and c (b) by the lever rule using the equilibrium phase diagram of the SiŌĆōFeŌĆōAl alloys at 600Ōäā.


Fig. 4 and Fig. 5 show the XRD patterns and STEM observations of the ribbon samples, respectively. In sample a, as we expected, no XRD peaks of elemental Si (Fig. 4(a)) were detected, indicating that all Si was transformed to the FeSi and FeSi2 phases. Accordingly, no active Si grain was observed in the elemental mapping of Si, Al, and Fe as shown in Fig. 5(a). The dark area coincides with the Fe-rich region and therefore is assumed to be FeSi. Meanwhile, the bright area is the FeSi2 phase. Furthermore, SAED indexing confirmed our observations. Although we expected Al2Fe3Si3 from the phase diagram, the corresponding peaks were not detected by XRD, probably, because of the low amount of Al in the alloy. The XRD indexing of sample b revealed the FeSi2 and Al6Fe4Si6 phases (Fig. 4(b)). In addition, from EDS mapping (Fig.5 (b)), insignificant amounts of elemental Si (dark area) and Al grains (grey area) surrounded by FeSi2 (bright area) were observed, which is in good agreement with our expected phases based on the phase diagram. Similarly, in sample c, from XRD patterns (Fig. 4(c)), we could identify the expected secondary phases along with crystalline Si. Fig. 5(c) represents the clear separation between active Si with a grain size of about 200 nm and the matrix through elemental mapping. In sample d, based on the XRD and TEM-EDS data analyses (Figs. 4(d) and 5(d)), the homogeneous distribution of nanosized Si in a surrounded matrix consisting of the Al6Fe4Si6 and Al2FeSi ternary phases can be seen. The selected area electron diffraction results show the formation of polycrystalline Si and the matrix phases in all samples. Summary of the estimated and revealed phases is represented in Table 3.

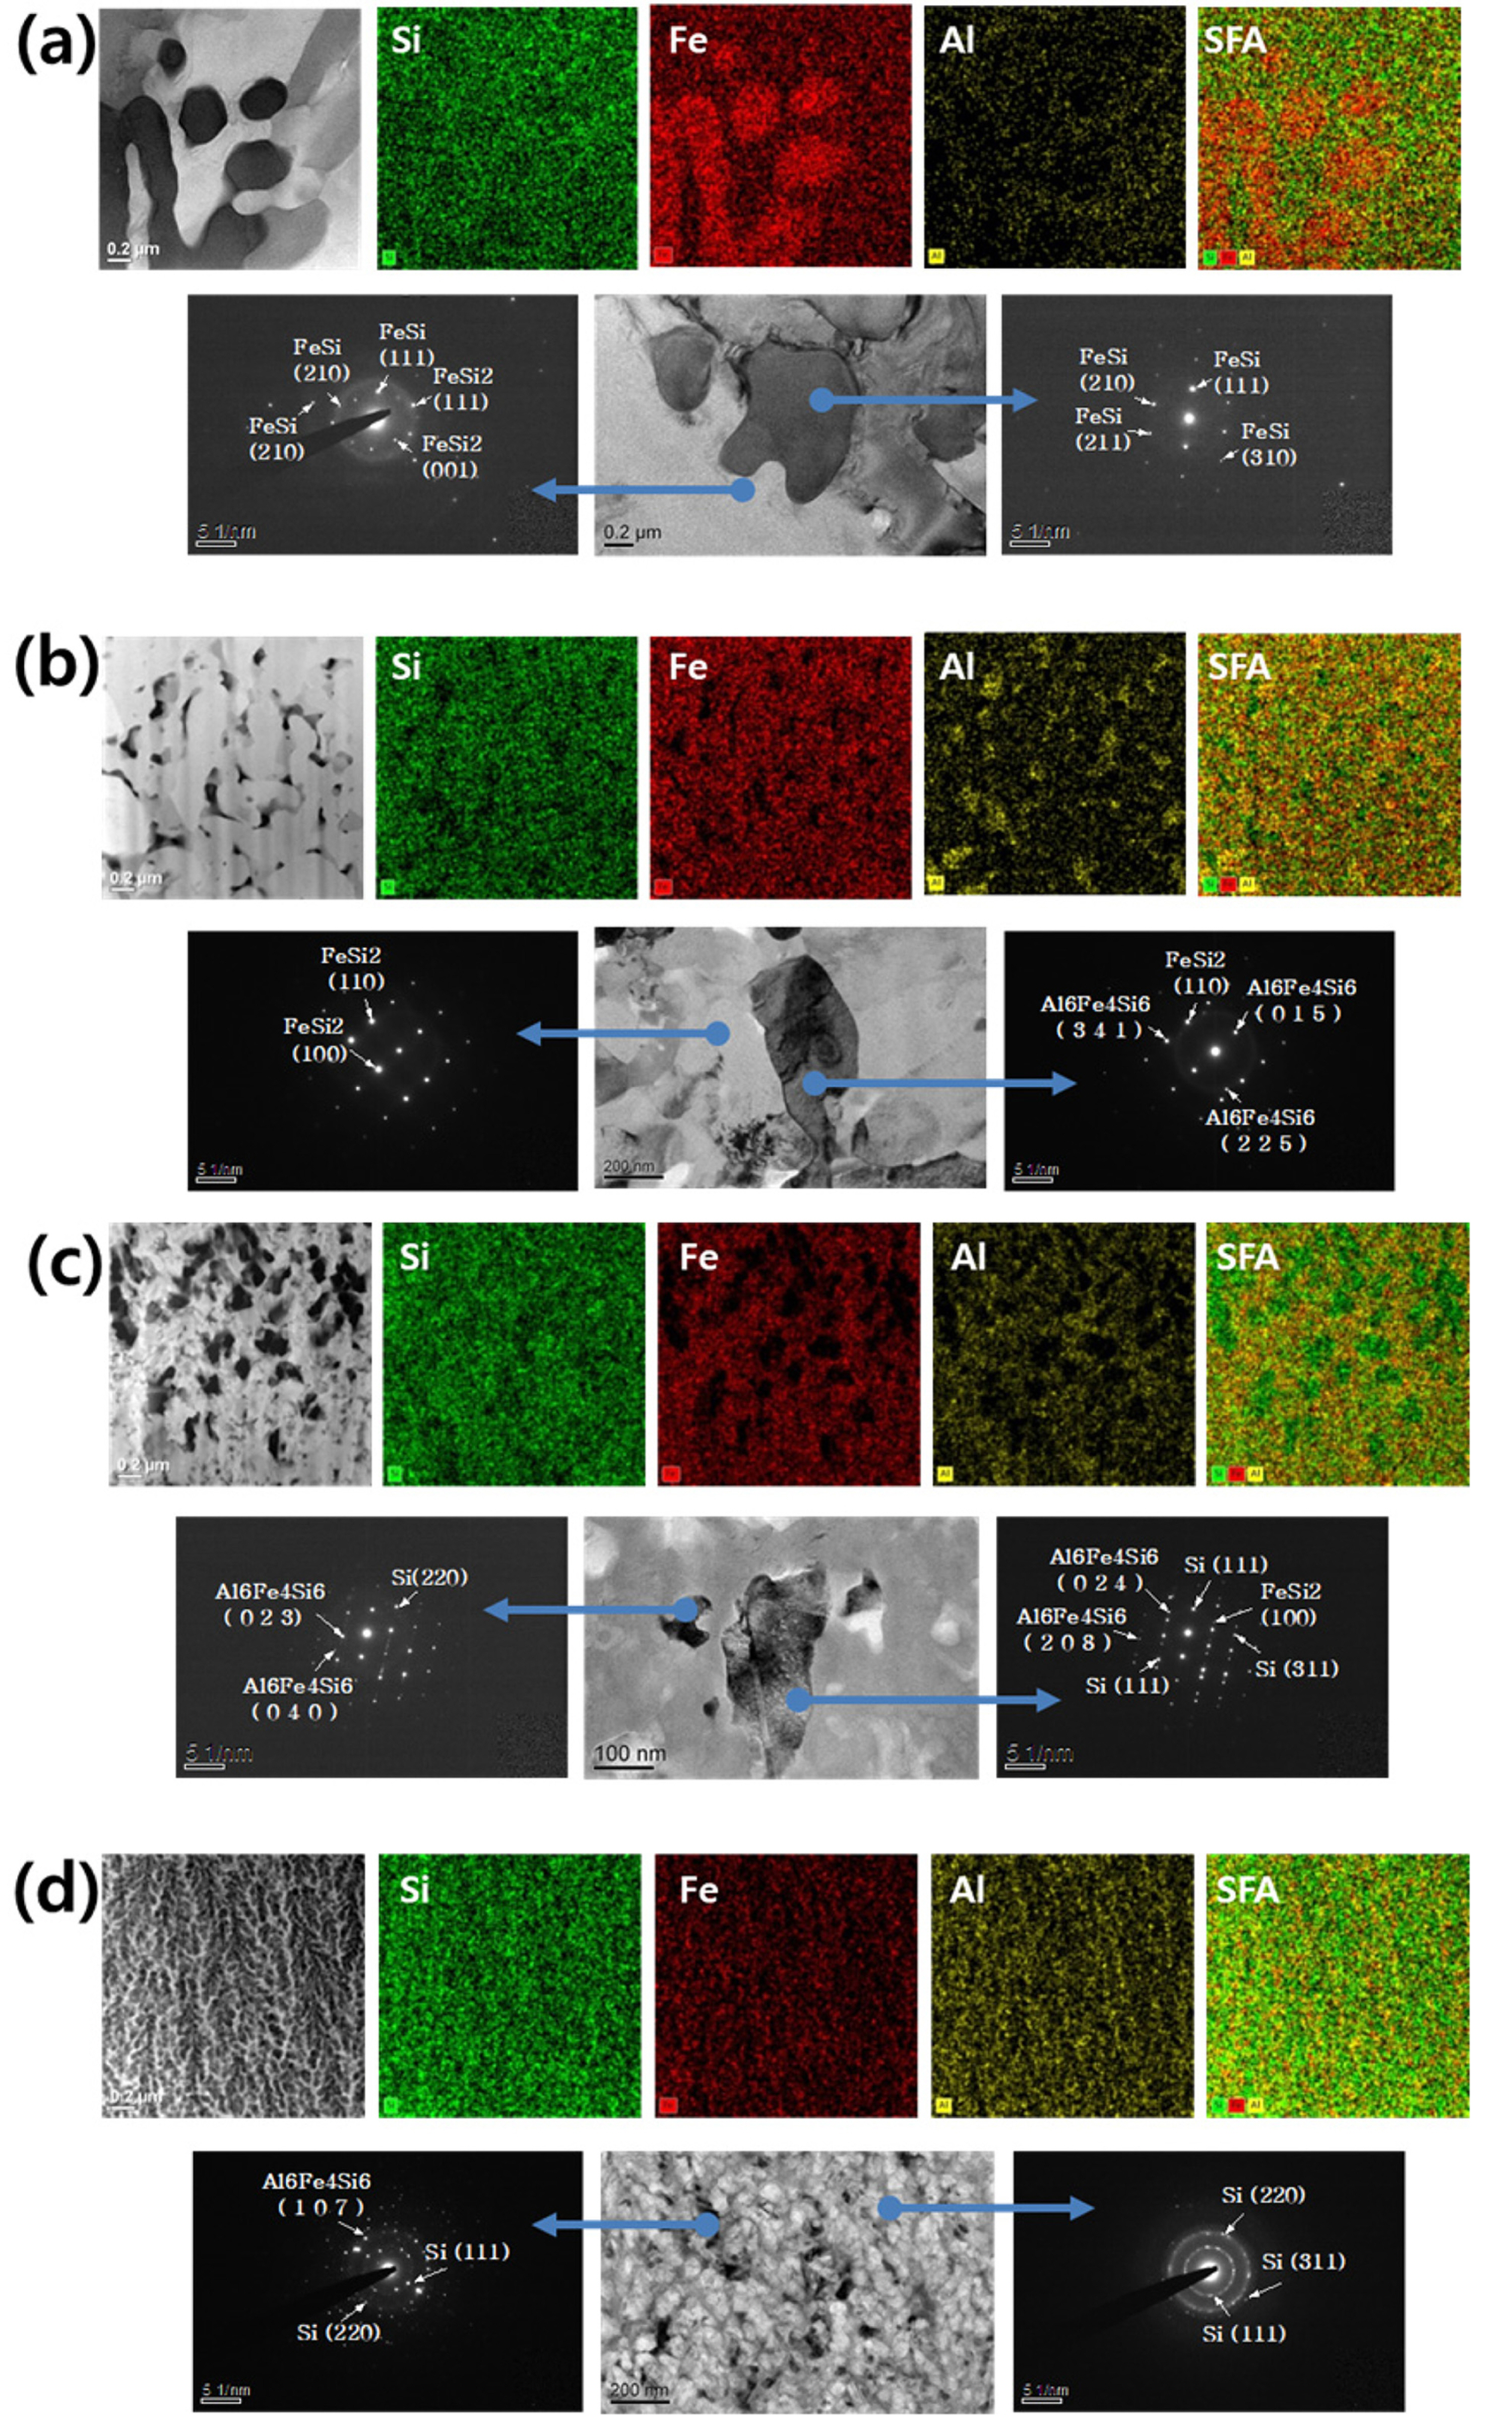

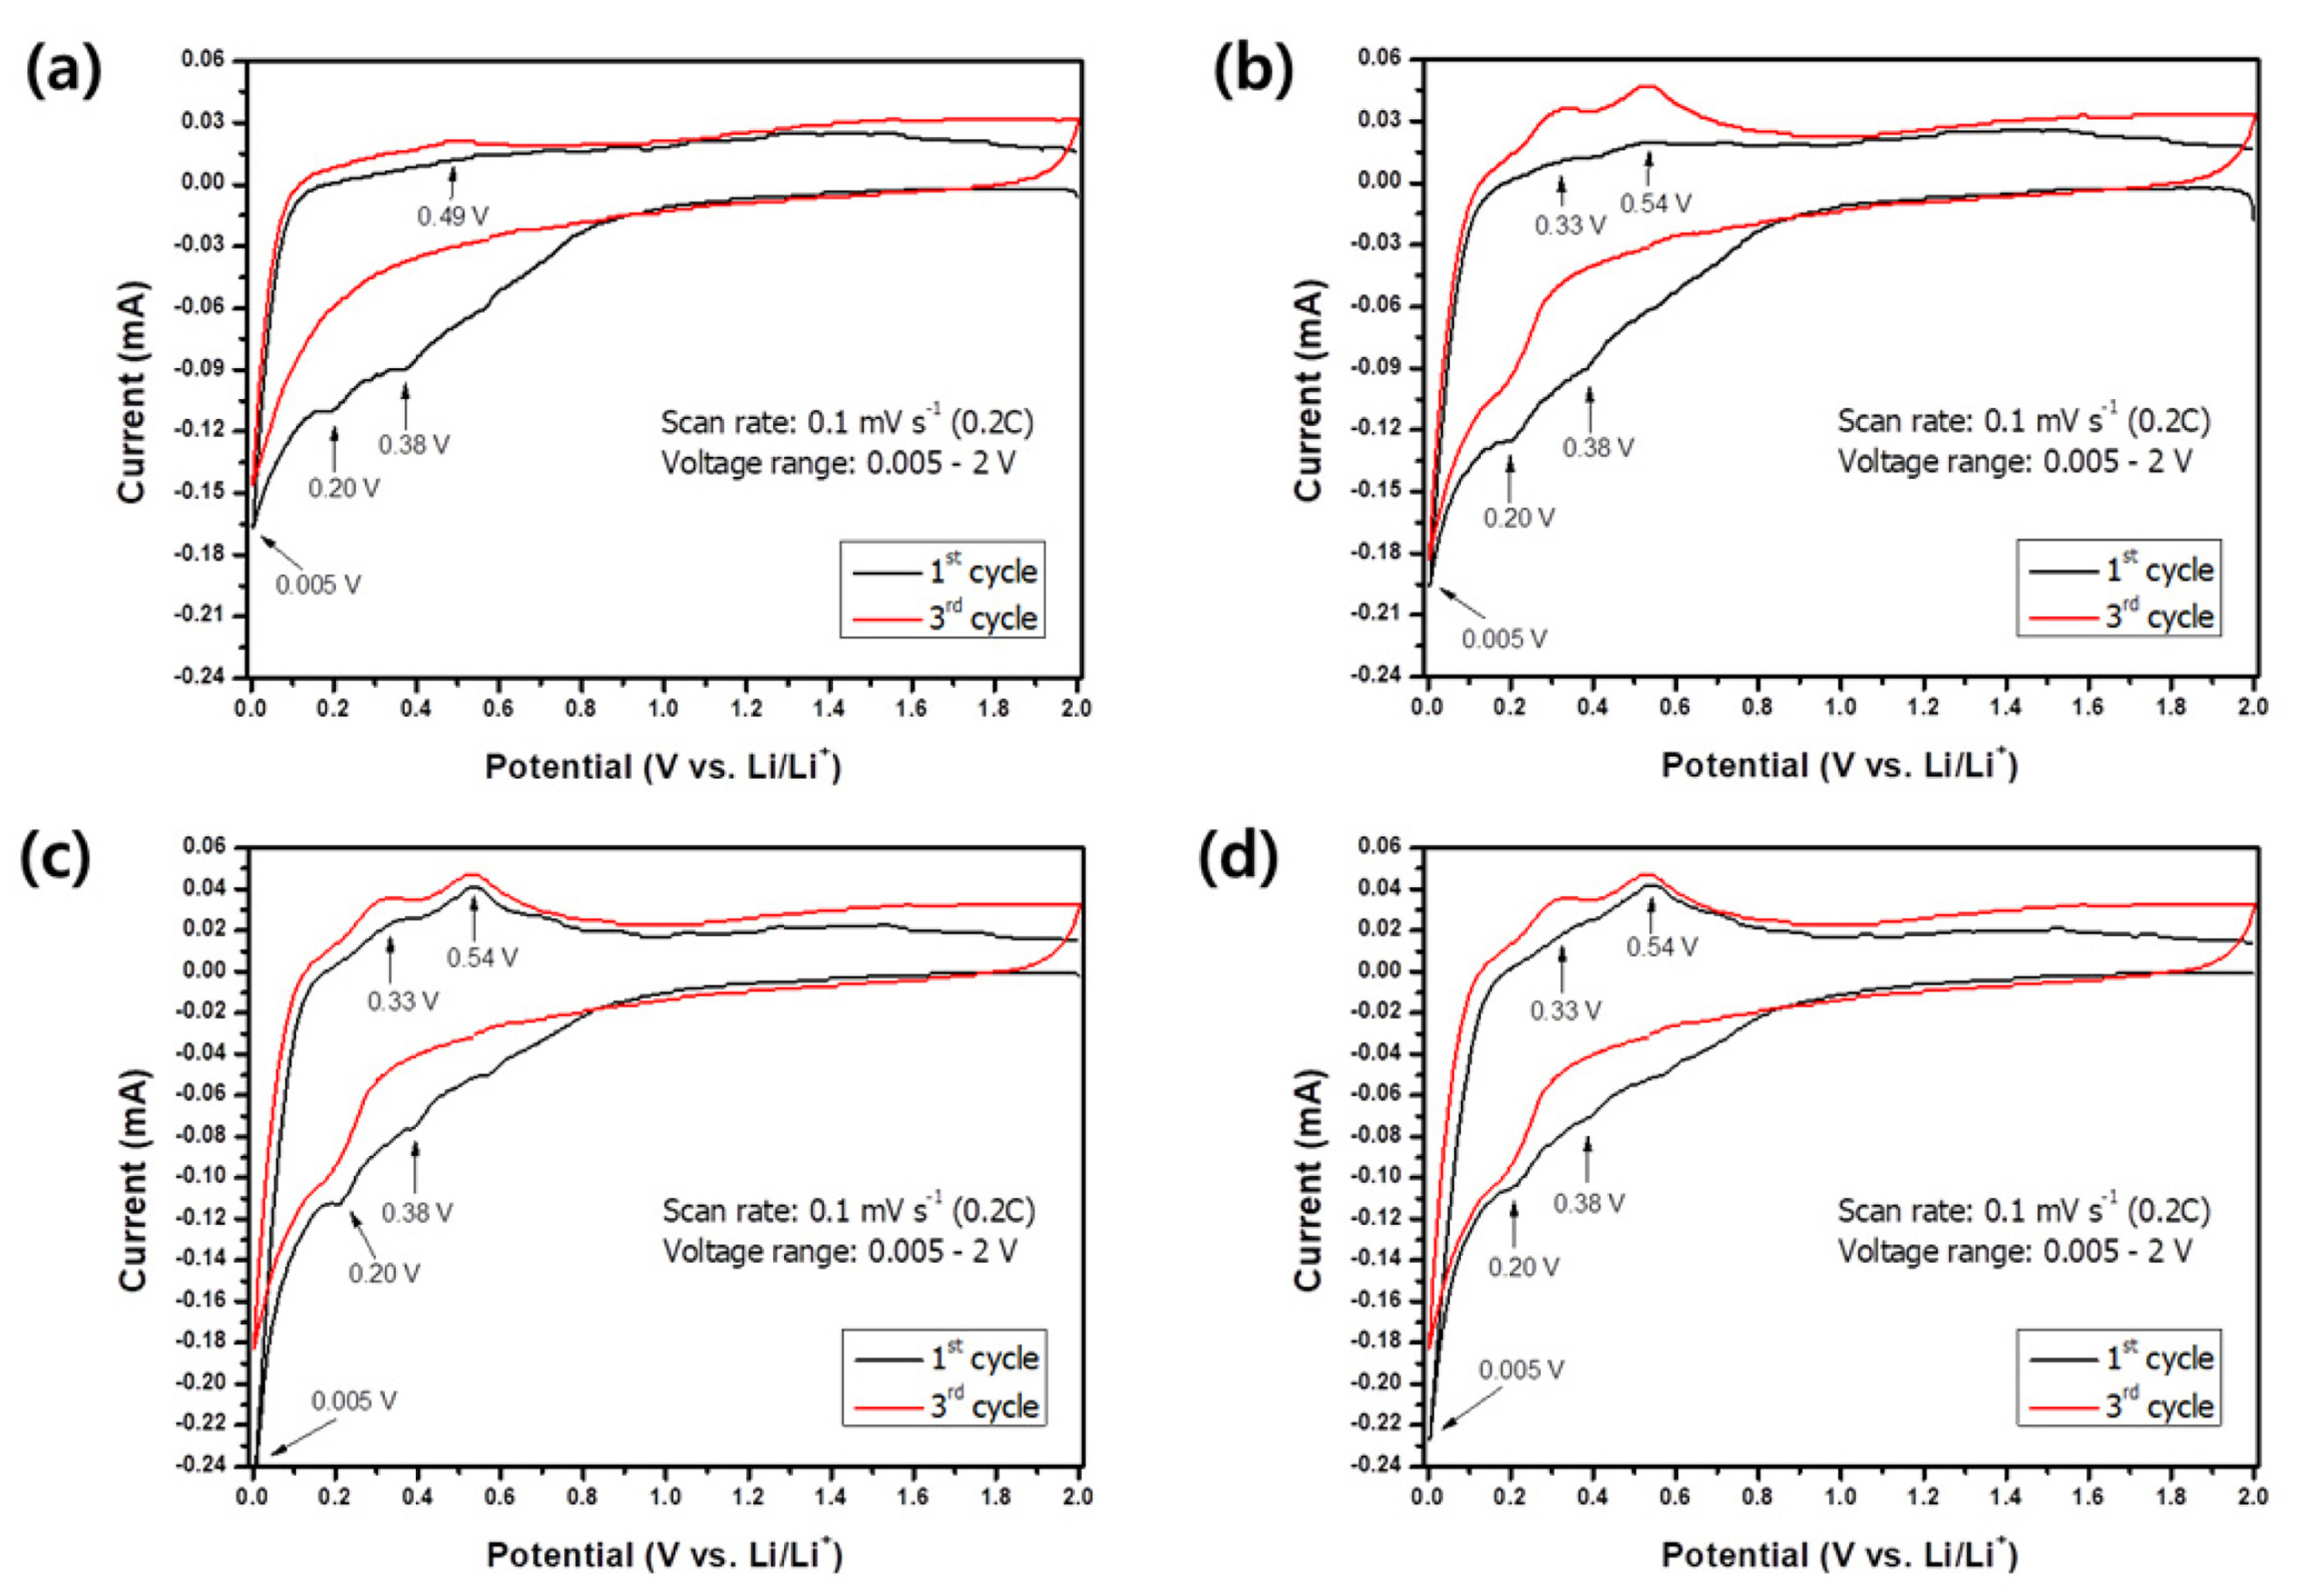
Fig. 6 shows typical CV curves of the Si alloys in the range of 0.005ŌĆō2 V at 0.1 mV/s (corresponds to 0.2 C). In the first lithiation, three reduction peaks appeared at 0.38, 0.2, and 0.005 V, respectively. The broad and indistinct peak at 0.38 V was observed only in the first lithiation and disappeared in the subsequent cycles. This indicates an irreversible reaction and was widely reported [20-22] as being attributed to the formation of a solid electrolyte interphase on the working electrode surface. Other reduction (at 0.2 V and 0.005 V) and oxidation (at 0.33 V and 0.54 V) peaks show good reversibility and are represented by Si phase changes upon the lithiation/delithiation process. Samples b, c, and d show identical redox peaks; however, sample a shows the oxidation peak at 0.5 V, which probably corresponds to the insignificant reactivity of other phases as reported elsewhere [23].
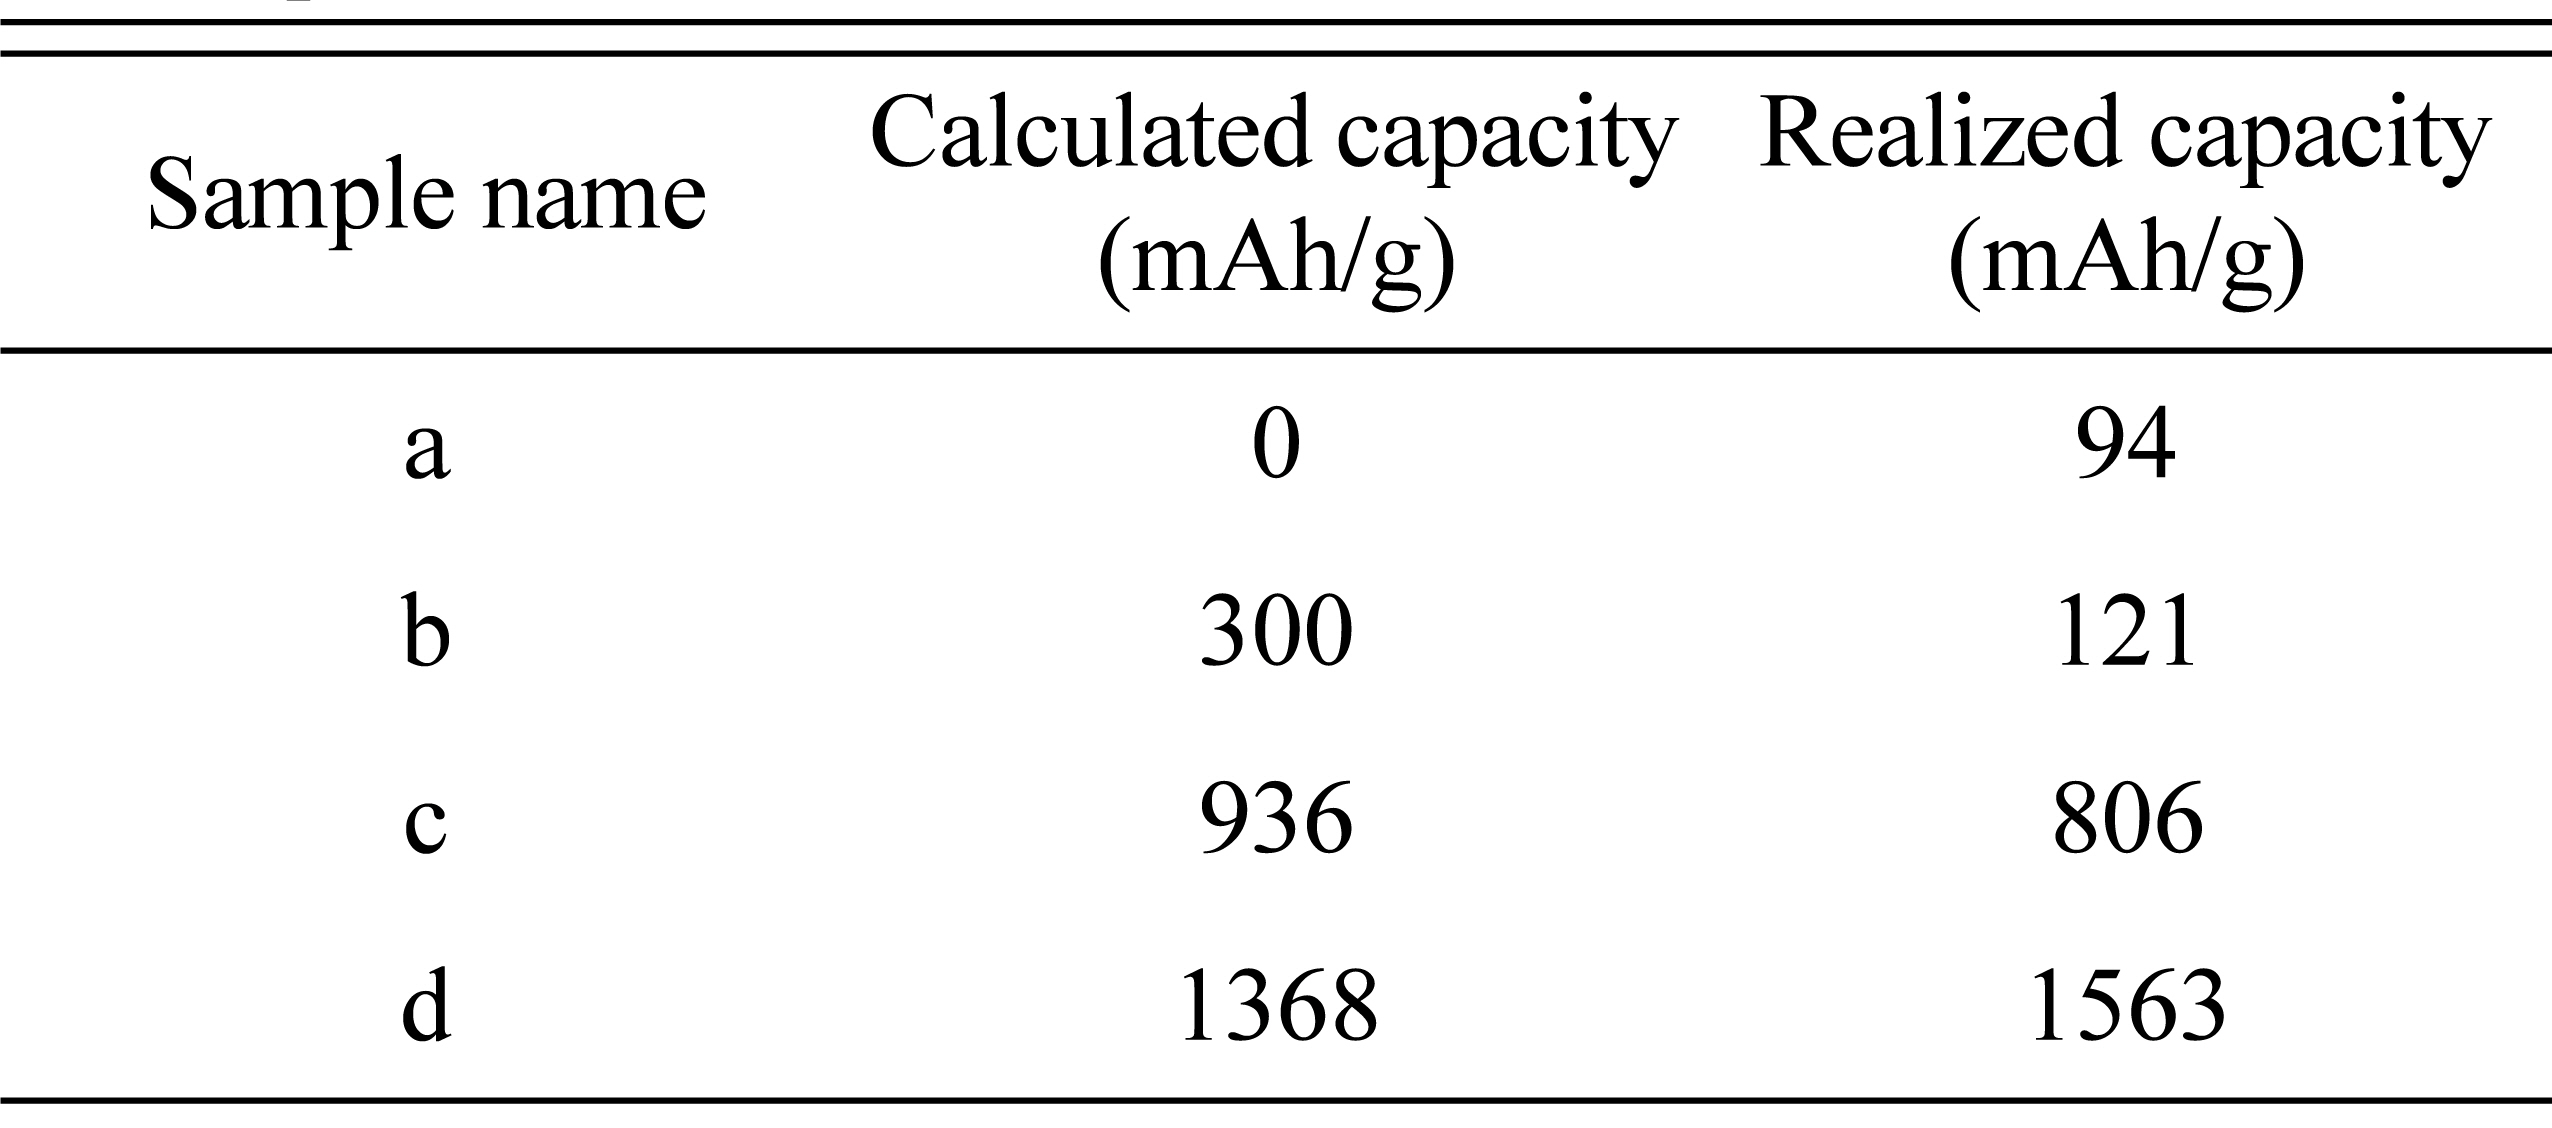
The charge/discharge curves of samples a, b, c, and d at a current density of 100 mA/g were examined during 30 cycles as illustrated in Figs. 7(a), 7(c), 7(e), and 7(g), respectively. Samples a and b show reversible capacity <130 mAh/g. While, samples c and d show the initial discharge capacities of 806 and 1563 mAh/ g, respectively. Thus, these results are consistent with the proposed capacity estimation by the lever rule method. In samples b, c, and d we found a discrepancy between the initial and 30th cycles. The corresponding dQ/dV plots (Figs. 7(d), 7(f), and 7(h)) clearly show the formation of the second oxidation peak at 0.3 V upon 30 cycles. Similar behavior was observed in our previous research on rapidly solidified SiŌĆōNi alloys [24].
Fig.┬Ā7.
(a, c, e, g) ChargeŌĆōdischarge curves and (b, d, f, and h) dQ/dV plots of samples a, b, c, and d at a current density of 0.1 A/g.
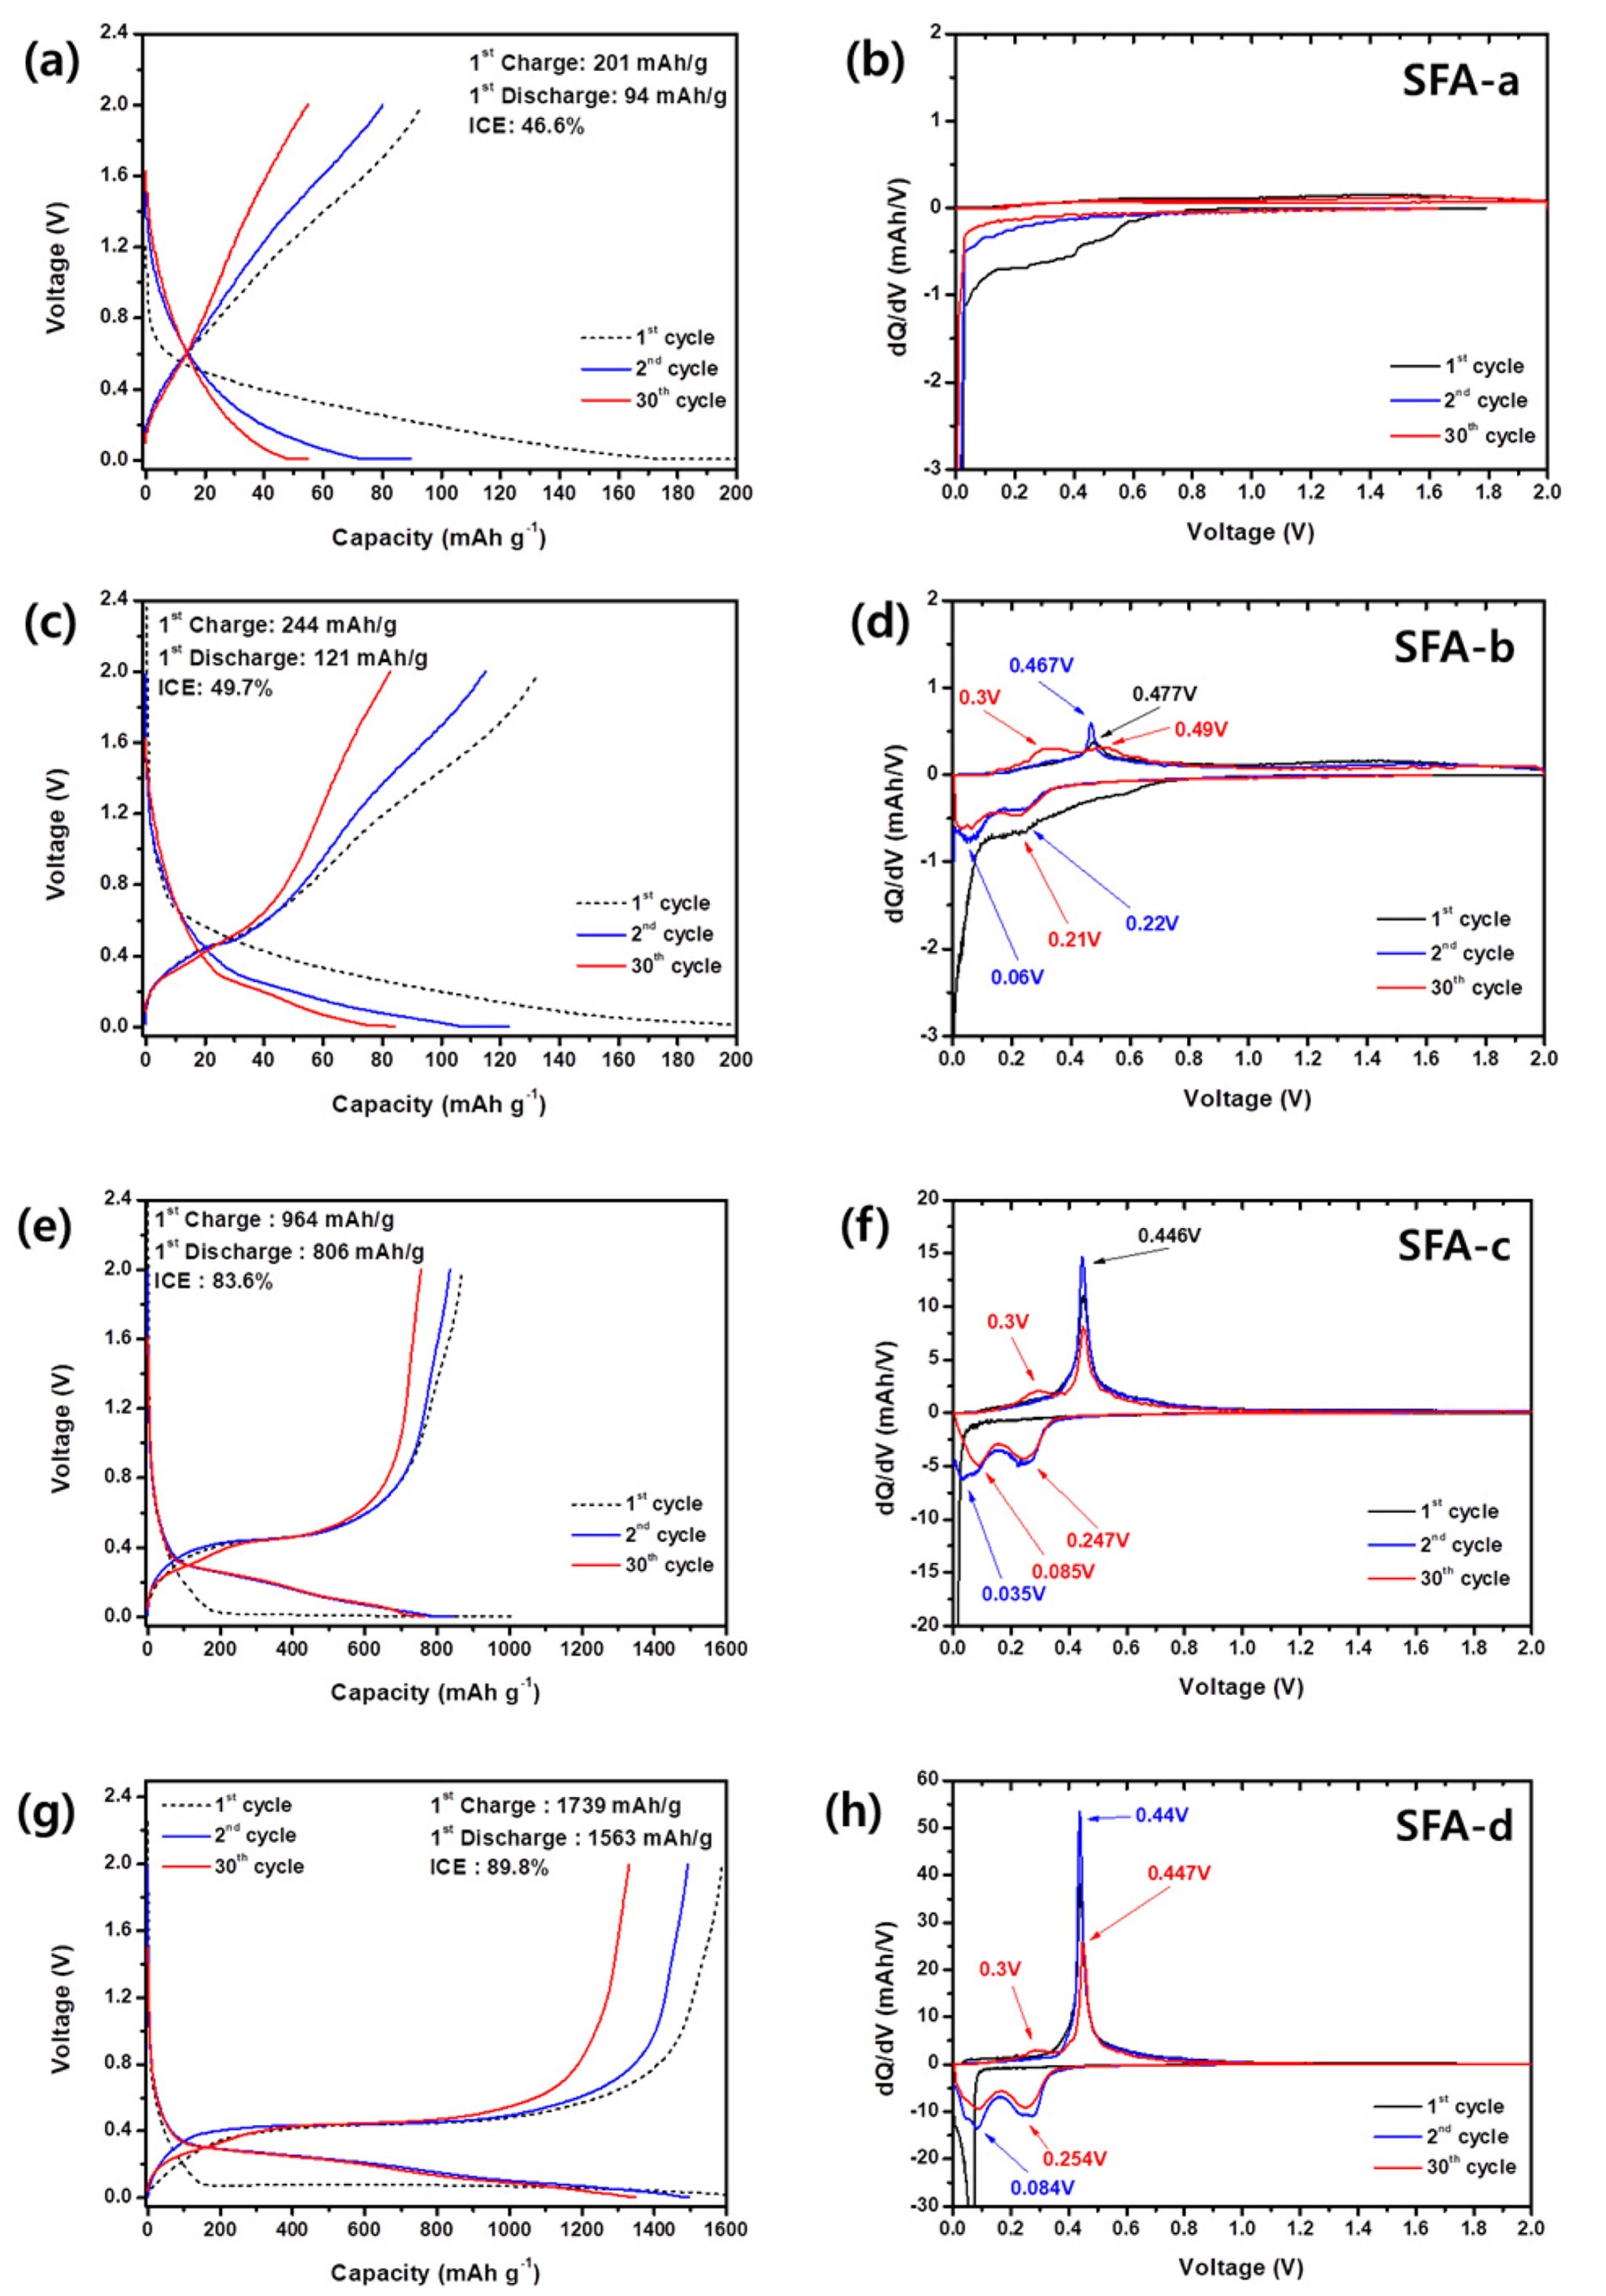
Fig. 8 depicts the cycle performance and the coulombic efficiency of various SiŌĆōFeŌĆōAl alloys over 30 cycles. All samples exhibit a high coulombic efficiency of >98%; however, in terms of the Li-ion battery application, the most attractive energy content was evaluated in samples c and d. Despite the highest initial discharge capacity in sample d, the capacity retention gradually decreases compared to that of sample c. Excellent cycle performance of sample c can be explained by the lower amount of active Si in the matrix, and therefore less stress and strain occurred upon the reversible reaction with Li.
Fig.┬Ā8.
(a) Cycle performance and (b) Coulombic efficiency of samples a, b, c, and d at a current density of 0.1 A/g.

Fig. 9 shows the rate capability of samples a, b, c, and d evaluated at various current densities from 0.1 A/g to 2 A/g with an increment of five cycles. Here-inafter, the capacity recovery ability was evaluated at an initial current density of 0.1 A/g over ten cycles. Similarly as discussed above, the samples a, b and d shows steady capacity fading upon cycling under high current densities. An extraordinary rate capability over high current densities was revealed in sample c. Indeed, such durability was achieved owing to intrinsic properties of the matrix to accommodate the volume expansion of Si along with the improved conductivity.

4. Conclusions
The reliability of the capacity prediction approach proposed in the current work was practically examined. We have successfully prepared four SiŌĆōFeŌĆōAl alloys with the same Si content of 60 at% and various amounts of Al and Fe by utilizing an inexpensive and facile melt spinning method. The estimation of the active Si amount was carried out based on the lever rule in conjugation with the AlŌĆōFeŌĆōSi ternary phase diagram (isothermal section at 600Ōäā). The half-cell electrochemical test results and the XRD and TEM investigations revealed fairly good agreement of the calculated and realized capacities of the SiŌĆōFeŌĆōAl alloys (Table 4). Accordingly, this study elucidates that the capacity of an alloy material can be efficiently predicted by the phase diagram and this technique will be a powerful method to accelerate the development of next-generation Si-based alloys as the anode material for Li-ion batteries.