A Newly Synthesized Schiff Base Derived from Condensation Reaction of 2,5-dichloroaniline and benzaldehyde: Its Applicability through Molecular Interaction on Mild Steel as an Acidic Corrosion Inhibitor by Using Electrochemical Techniques
Article information
Abstract
A new organic Schiff base compound N-benzylidene-2,5-dichloroaniline (BDC) was synthesized and the structure of the Schiff base is illuminated by some spectroscopic techniques. In addition, whether it is an applicable inhibitor in the industrial field was examined by conventional methods such as linear polarization resistance (LPR), electrochemical impedance spectroscopy (EIS) and potentiodynamic polarization for different concentrations. The BDC concentration and temperature effects were surveyed for elucidating the inhibitive mechanism. The BDC molecules are adsorbed to surface of mild steel via the Langmuir isotherm. Atomic force (AFM) and scanning electron microscope (SEM) techniques were utilized to give insight into surface characterization.

1. Introduction
Metallic materials try to return spontaneously to oxidized forms when they are left unchecked. This returning phenomenon is another expression of corrosion. Corrosion losses are meant to finish the resources that future generations will use today. Corrosion is inevitably a natural disaster, and it must be struggled against this disaster [1]. Corrosion may not have a detrimental influence on a metal directly but it may generally affect the metal’s strength and physical appearance as well as many industrial problems. Acids solutions such as HCl are usually utilized in chemical field for acid pickling, chemical cleaning and descaling, etc. [2–4]. Materials like mild steel is commonly employed in various fields as building material owing to its excellent mechanical characteristics, the ease of production, and low cost [5–7]. Especially in pipelines and tanks, the metal surface is coated to protect from corrosion. However, as a result of the destruction that may occur anywhere in the coating, the corrosion mechanism quickly begins to work. Because transition metals and alloys are widely tapped in technical and practical, their protection against corrosion is also significant. As it is known, transition metals have electrons that are not doubled in d-electrons orbits [8,9]. Anodic (electron donor, oxidation) reactions and cathodic (electron acceptor, reduction) reactions occur together during the corrosion.
Inhibitors are substances that diminish the corrosion rate when more or less added to the medium. These substances usually remain unaltered in the medium. Their function is to increment the resistance of the metal/solution interface by closing the metal surface. The substances that adsorb firmly to the surface are effective inhibitors [10–13]. Despite the presence of many organic compounds whose inhibitor activity is known, there is always a need to identify new organic inhibitors [14–16].
Schiff bases occur in the neutral media of primary amines with aldehydes and ketones, usually as a result of condensation reactions in alcoholic solutions. In the constructions, the –C=N– group is the compounds which are present and in general this compound is called as “azomethine or imine compounds”. Schiff bases are among the most widely used organic compounds. The inhibitor effects of Schiff bases on corrosion in acidic media and the development of new inhibitors have attracted attention such as the synthesis of Schiff bases, which can be used in many technologies, and Schiff bases have become more prominent and have become a subject of study in many fields [17–19]. BDC is an aromatic Schiff base compound owning heteroatoms in its structure such as chloride and nitrogen, which can clearly be protonated in acid solution, and several π-electrons present in the molecule [20,21]. According to literature knowledge, no findings have been released concerning the inhibitive mechanism of corrosion of the synthesized BDC Schiff base in acid solution.
The present study is aimed to prepare N-benzylidene-2,5-dichloroaniline as a new inhibitor compound against mild steel corrosion in 1.0 M HCl. BDC is offered as an alternative commercial inhibitor due to its eco-friendly and non-toxic abilities. The characterization of BDC was achieved by spectroscopic techniques, inhibition efficiency was determined via electrochemical measurements and further adsorption characteristics were investigated with the help of PZC measurements and adsorption isotherms. Finally, metal surfaces were monitored by utilizing AFM and SEM techniques.
2. Experimental
The Schiff base studied inhibitor effect was synthesized from 1:1 mol ratios of 2,5-dichloroaniline (0.8101 g, 0.005 mmol) with benzaldehyde (0.5306 g, 0.005 mmol) in ethanol with a reflux technique for 8 h. The mixture was evaporated by rotary evaporator. The formed compound was filtered first, then washed two times with cold ethanol to eliminate excess aldehyde that remains unreacted. Finally, the forming bright cream colour crystal of Schiff base was dried under vacuum. The experimental scheme is given in Fig. 1. The yield of formed compound was found to be 79.0%. The melting point of the BDC was determined to be 93.6–94.2°C, which indicate that the formed Schiff base has good purity.
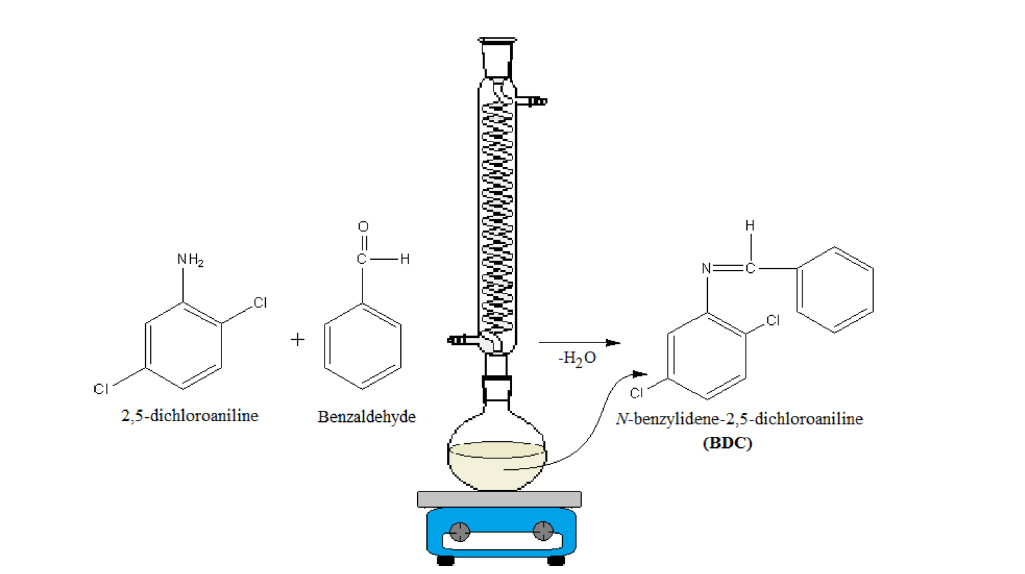
The representation experimental synthesis scheme of Schiff base BDC.
The structure illumination of the BDC inhibitor was analysed with Bruker 400 MHz nuclear magnetic resonance (NMR) spectroscopy. The significant peaks identified in the 1H-NMR spectrum of BDC are as follows. 1H-NMR (400 MHz, CDCl3) d (ppm): 6.65–7.97 (m, Ar-8H); 8.60 (s, 1H, HC=N). In addition, the 1H-NMR spectrum of the characteristic peak of the Schiff base is shown in Fig. S1. According to Fig. S1, it is evidence of formation of a singlet peak of imine group observed at 8.60 ppm.
Fourier transform infrared (FT-IR) spectrum (Perkin Elmer spectrum 400 FT-IR/FT-FIR system instrument) of the BDC Schiff base revealed different bands, at 1630 cm−1 corresponding to (–C=N, imine) bond, 733 and 753 cm−1 to (–C–Cl) bond, 3003–3081 cm−1 to (Ar-CH) bond.
Optical features were also investigated by using Shimadzu A160 dual beam UV–visible spectrophotometer. Solutions of starting compounds and synthesized Schiff base of 1.0×10⁻⁵ M were prepared in dichloromethane. The prepared solutions were transferred to the quartz cell of the device and UV-vis. spectra were obtained at a wavelength range of 200–1000 nm.
The corrosion tests were realized on the surface of mild steel, which is the same as the chemical composition given: 0.21700 Cu, 0.08400 C, 0.01900 S, 0.40900 Mn, 0.01100 P, 0.00198 Co, 0.10200 Si, 0.01040 Mo, 0.01620 Sn, 0.07890 Ni, 0.01100 V, 0.06030 Cr, 0.00222 Nb and the remain is Fe (wt.%). The mild steel electrode was cut to a length of 5 cm and drilled from the surface at a distance to penetrate a thin copper wire for conductibility. The specimens were embedded in a bath containing the polyester mixture and the surface area of 0.5024 cm2 was in touch with the corrosive environment. Before all electrochemical measurements, mild steel specimens were sanded with 150, 600, and 1000 grid emery papers, respectively. After, they were degreased, washed with acetone and purified water, and finally dried in atmospheric environment, respectively. All the used chemicals in the current paper are of an analytical purity and they were bought from Sigma-Aldrich (Taufkirchen, Germany) and Merck Chemical Company (Darmstadt, Germany) and utilized as received without any distillation.
The corrosion experiments were conducted in 1.0 M HCl solutions in absence and presence of various BDC concentrations (1.0×10⁻⁵ and 1.0×10⁻³ M). For each experiment, fresh solutions were prepared and used. All the tests were realized under atmospheric conditions.
The corrosion resistance of the BDC was determined by LPR, EIS and potentiodynamic polarization methods. Surface morphologies were examined 120 h of immersion time in 1.0 M HCl with and without BDC using AFM and SEM analyses. All electrochemical measurements were made by CHI-660B model electrochemical analyser device with computer-controlled. These tests were conducted with standard three-electrode method. The measurements were achieved using mild steel as the working electrode, a platinum plate as the counter electrode with a surface area of 1 cm2 and Ag/AgCl as the reference electrode. All potential values determined in this paper were taken according to this reference electrode. Mild steel electrodes were left in test solutions for 1 h to get obtain balance for the open circuit potential (Ecorr). Impedance experiments were analysed in the frequency between 105 Hz and 5×10⁻³ Hz at Ecorr by implementing 5 mV amplitude to the system. EIS measurements were also taken to determine the potential of zero charge (PZC) of the metal. After determining the stable potential, the polarization resistance (Rp) values were recorded at this stable potential by applying ± 0.180 V (Ag/AgCl) the ranges of potential. From these obtained values, the Rp versus potential graph was drawn and the PZC of the mild steel was determined. During the long-term EIS experiments, the mild steel electrodes were left at 298 K for 1–120 h in a beaker containing 150 mL working solution. LPR measurements were measured ±10 mV (Ag/AgCl) from open circuit potential with a scan rate of 0.1 mV s−1 and by plotting the potential versus current graph, Rp was found from the slope of this graph.
The potentiodynamic polarization curves were applied ±0.350 V firstly cathodic potential secondly anodic potential from Ecorr at a scan rate of 1.0 mV s−1. In order to determine the related activation energies, the potentiodynamic polarization tests were done in various concentrations of BDC in 1.0 M HCl solution and different temperature ranges (298–328 K).
After long term EIS tests (120 h), the surface of the mild steel electrodes was instantly examined by both a Leo 440 computer controlled digital scanning electron microscope and Veeco Multimode 8 Nanoscope 3D model atomic force microscope device. For SEM micrographs in 1.0 M HCl with and without all concentrations of BDC, the surface morphology on a 100 μm scale was scanned and applied a 20.00 kV voltage. For AFM analysis, the surface morphology on a 10 μm×10 μm scan size scale was scanned by studying three-dimensional surface micrographs in a 1.0 M HCl solution containing with and without 1.0×10⁻³ M BDC. SEM and AFM analyses were also performed by cutting the electrodes at a distance of 0.5 cm from the surface with the help of an iron saw.
3. Results and Discussion
3.1. UV-visible, FTIR and 1H–NMR spectroscopy studies
UV-vis. spectroscopy is a further proof that it is synthesized Schiff bases. The organic compounds used as inhibitors mostly have absorption bands in the electromagnetic spectrum and they are absorbed stretch over at higher wavelength owing to conjugation [22,23]. The recorded UV–visible spectrums in dichloromethane containing 1.0×10⁻⁵ M solutions of starting compounds and synthesized Schiff base at 298 K were shown in Fig. 2.
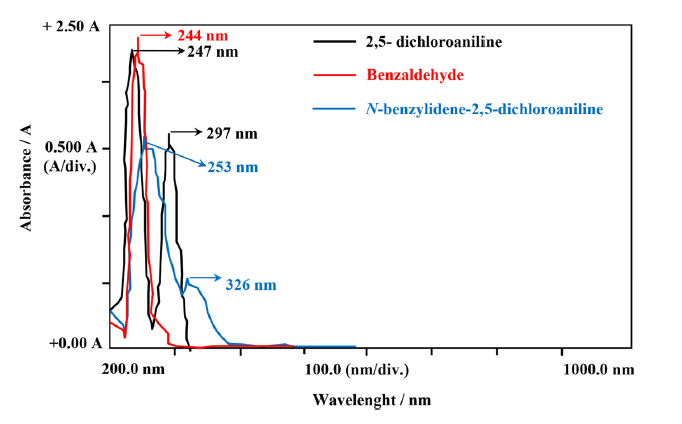
The UV–vis. spectra of starting compounds and synthesized BDC.
Since the UV-vis. spectra of the benzene compounds vary according to the solvents used and the substituents in the rings, the peaks observed at 247 nm and 297 nm are the absorption bands due to the π-π* transitions in benzene molecule (conjugated double bonds) and the n-π* transitions in the amine group in its structure. A single peak at 244 nm of benzaldehyde is observed. This peak corresponds to the π-π* electronic transition of conjugated double bonds in the aromatic ring. In the UV–vis. spectrum of the synthesized DBC in Fig. 2, in addition to the characteristic peaks of 2,5-dichloroaniline and benzaldehyde, a new peak of the n-π* transition of the –C=N– (imine) bond have appeared at 326 nm. This newly formed absorption peak (326 nm) is another proof that the Schiff base is successfully synthesized as mentioned in the literature [24,25].
The newly formed –C=N– peak in the FT–IR spectrum of N–benzylidene–2,5–dichloroaniline has observed at 1630 cm−1. Peaks attributed to the –NH stretching of the 2,5-dichloroaniline structure (3432 cm−1) and the –C=O stretch of benzaldehyde (1693 cm−1) have not observed in the FT–IR spectrum of BDC. The peaks observed at 733 cm−1 and 753 cm−1 are stretching peaks of the –C–Cl groups. The peaks observed at 3003–3081 cm−1 belong to aromatic –C–H stretches. As a result, the peak of the amine –NH stretching and of the aldehyde –C=O stretching is not observed in the Schiff base spectrum (Fig. 3); confirms that a condensation reaction takes place between 2,5–dichloroaniline and benzaldehyde and the formation of BDC.
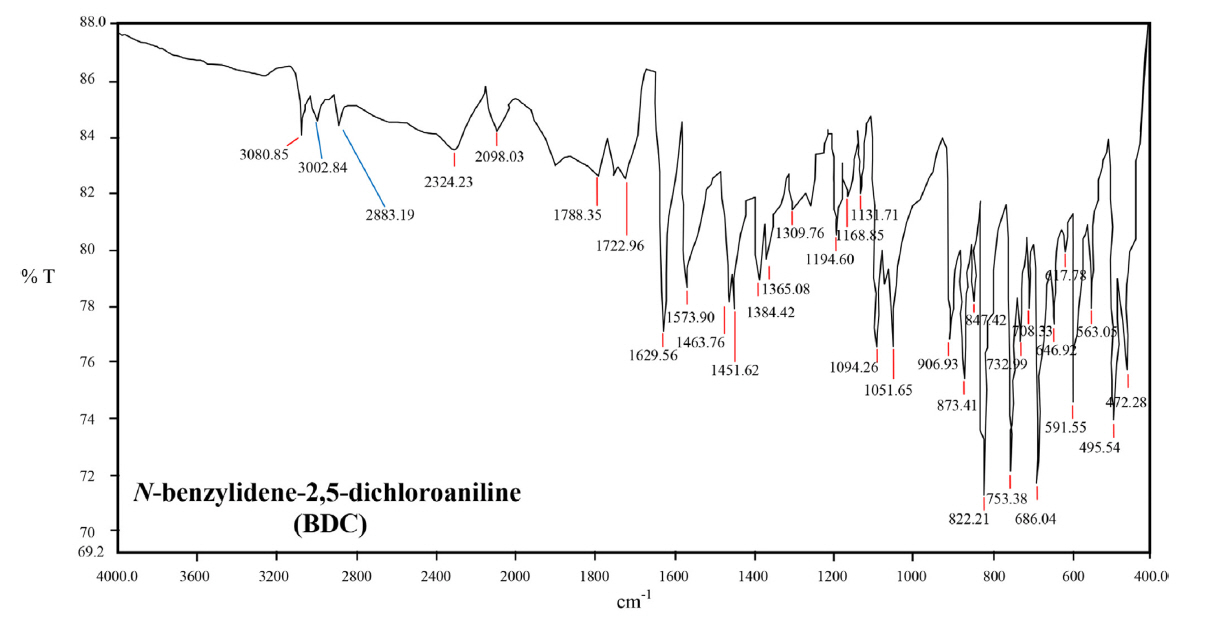
The FT–IR spectrum of synthesized BDC Schiff base.
According to the 1H-NMR (CDCl3, δ ppm) spectrum of the BDC, the multiple (m) peaks of the 8 H due to the aromatic ring are observed at 6.65–7.97 ppm. Hydrogen in the imine group of the synthesized BDC molecule appears as a singlet peak at 8.60 ppm [26]. The synthesis of the BDC Schiff base has confirmed by all three spectroscopic methods in this way.
3.2. Potentiodynamic polarization measurements
Potentiodynamic polarization plots of mild steel in 1.0 M HCl at 298–328 K temperature range and between 1.0×10⁻⁵ and 1.0×10⁻³ M BDC concentrations were shown in Fig. 4. In order to get knowledge about the dissolution stage of the mild steel, the relevant parameters were determined by the extrapolation of the linear part of the cathodic polarization plots to Ecorr. These are Ecorr, the cathodic Tafel constant (−βc), corrosion current density (icorr) and the inhibition efficiency (η%) values and indicated in Table 1.
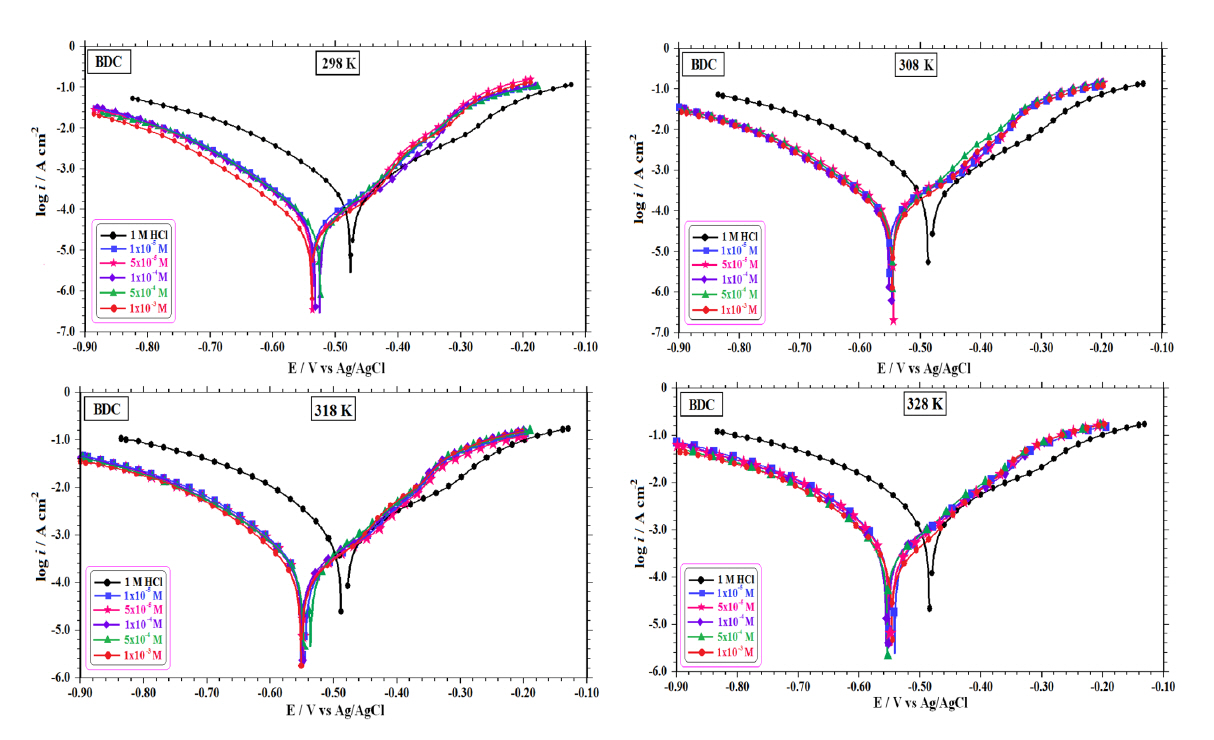
Potentiodynamic polarization curves obtained for mild steel in 1.0 M HCl for various concentrations of BDC at 298 K–328 K.

Potentiodynamic polarization parameters for mild steel in 1.0 M HCl solution containing different concentrations of BDC at 298–328 K.
The η values have been calculated from potentiodynamic polarization findings according to the relevant equation indicated below:
Where icorr and i′corr are the values of corrosion current density without and with inhibitor, respectively. The results found are listed in Table 1.
From Fig. 4 and Table 1, it can be clearly monitored that the icorr values of the BDC were lower than those of the uninhibited solution. This demonstrates that the anodic dissolution of mild steel and the cathodic reduction of hydrogen ions are inhibited. It also means that the electrochemical reaction rate is reduced via the formation of protective layer of BDC molecules on the mild steel surface [27]. As can be seen from Table 1, the icorr values reduced from 265 μA cm−2 to 34 μA cm−2 at 298 K, from 440 μA cm−2 to 81 μA cm−2 at 308 K, from 1296 μA cm−2 to 216 μA cm−2 at 318 K and from 2536 μA cm−2 to 407 μA cm−2 at 328 K in the presence of 1.0×10⁻³ M BDC. The η% values increased from 71.7% to 87.2%, from 72.5% to 81.6%, from 75.2% to 83.3% and from 67.6% to 84.0% with the enhancement of BDC concentration and temperature, respectively.
The −βc values have not changed remarkably which connotes that the hydrogen evolution mechanism has been impressed neither the addition of BDC molecules nor the temperature. According to potentiodynamic polarization curves (Fig. 2), it can be observed that the Ecorr values in the polarization curves shift to more negative potential with the increment concentration and temperature of BDC. This shift is not noteworthy enough for the BDC to be classified as a cathodic type, as the migration of Ecorr values is less than 85 mV, the inhibitors can be classified as a mixed-type inhibitor. So, it is clearly said that the BDC molecule will act predominantly cathodic controlled mixed-type inhibitor as the cathodic current density values are more depressed for all studied temperatures [28,29]. It means that, the adsorbed BDC layers are composed on the mild steel surface, so limiting the diffusion of oxygen from acidic medium to the predominantly cathodic sites of mild steel [30,31]. This approved that the addition of the BDC has predominantly delayed the cathodic reaction rate and at the same time the anodic one. In addition, the cathodic polarization curves are parallel (Fig. 4), demonstrating that there is no alteration in the hydrogen evolution mechanism by the addition of BDC molecule, and the reduction of hydrogen ions chiefly occurs through a charge transfer mechanism at all temperatures [27,32].
According to Table 1, it is explicitly observed that there is an increment in η% with the rise of BDC concentration at studied temperatures. This result displays that the studied BDC Schiff base plays a role by adsorbing on the mild steel. In this case, the inhibition effect can be clarified by closing the active sites of the mild steel with the BDC molecule. As monitored from Table 1, the slight variation in inhibition efficiency values at apparent concentrations with the rise of temperature attracts attention the more forceful adsorption of BDC on mild steel surface and protective influence and it can be commented as that adsorbed BDC molecules and formed corrosion products on mild steel surface provide the inhibition together.
3.3. EIS and LPR measurements
Over the past half a century electrochemical impedance spectroscopy has thrived into a substantial corrosion measurement method. Its utilization has brought up to contain implementations ranging from primary researches of material properties and corrosion to many practical investigations of quality control and corrosion inhibition [33]. Electrochemical impedance spectroscopy is one of the methods used to acquire information about the adsorption interaction of the BDC at the mild steel/solution interface [23]. This measurement method is a swift and appropriate technique for examination of the protective features of organic compounds on metal’s surface. More trustworthy findings can be acquired with this way, as it does not distort the double layer at the interface of mild steel/solution [34]. The influence of BDC concentration on mild steel was investigated by applicating EIS tests in 1.0 M HCl with and without BDC molecule after 1 h immersion time at 298 K and long-term EIS measurements have also been fulfilled. The Nyquist diagrams and suggested electrical equivalent circuits of the mild steel in HCl medium have been given with all BDC concentrations for 1 h in Fig. 5. ZView2 software was used to describe and fit EIS data. Two equivalent circuit models of the system have been composed and the proposed electrical equivalent circuit models are shown in Fig. 5 by embedding in 1 h of the impedance diagrams.
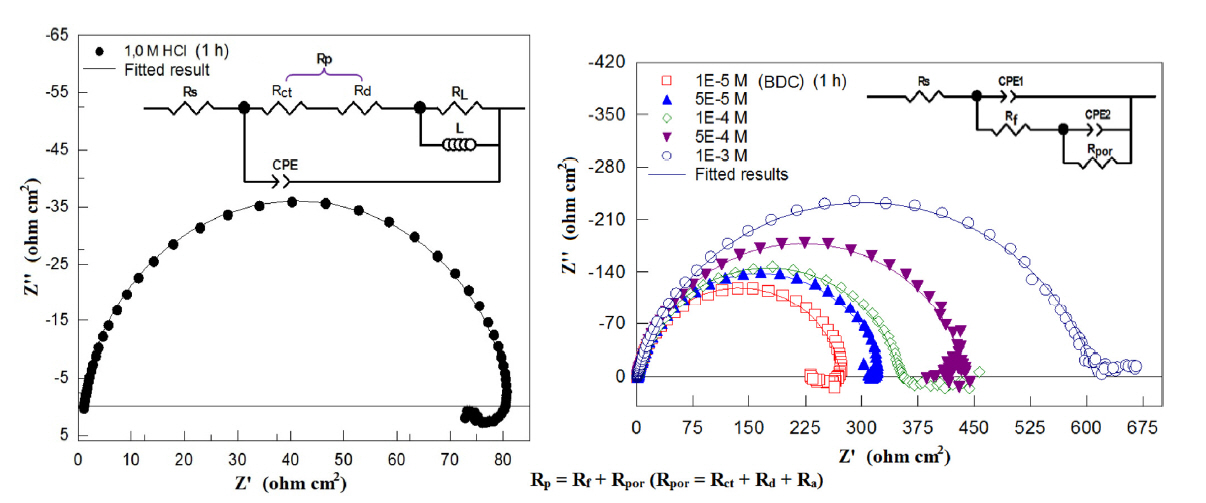
The Nyquist curves obtained at 1 hour in 1.0 M HCl solutions with and without BDC Schiff base at different concentrations (Rs: Solution resistance, Rct: Charge transfer resistance, Rd: Diffuse layer resistance, Ra: Resistance of accumulated species at mild steel/solution interface, L: Inductance, RL: Inductive resistance, Rf: Film resistance, Rpor: Pore resistance, CPE1: Film capacitance, CPE2: Double layer capacitance).
In Fig. 5, it is seen that the equivalent circuit model proposed in the inhibited medium is different from the equivalent circuit model suggested in uninhibited one. It is obvious from Fig. 5 that in without inhibitor medium, Nyquist curve composes of a depressed semicircle. This situation represents that the corrosion of mild steel in the 1.0 M HCl and largely conducted by a charge transfer process [17,29,35]. The Nyquist curve can be utilized to identify polarization resistance (Rp) value which comprehends not only charge transfer resistance (Rct) but also diffuse layer resistance (Rd). Moreover, the diameter of the capacitive loop has increased by the gradual boost in the BDC concentration [2]. On account of boosting the BDC concentration, more BDC molecules adsorb on the mild steel surface area. So, a preventive adsorption film constituted on metal acts as an effectual obstacle to aggressive possible attack by the acidic solution [36,37]. As can be explicitly seen from Fig. 5, the diameters of the capacitive loops formed in the high frequency region in all the inhibited media were larger than in the uninhibited media and the diameters increased as the inhibitor concentration increased. Similar findings in the literature have been reported in some studies [38–42]. Nyquist curves in inhibited solutions act as depressed capacitive loops at the low and high frequency. The low frequency loop is expressed as the film resistance (Rf) and other accumulated types such as corrosion products and inhibitor compounds (Ra), on the other hand, the higher one is expressed as the Rct and Rd. This event has been compatible with many studies in literature [17,43,44].
Corrosion parameters determined from EIS and LPR measurements in uninhibited and inhibited solutions are given in Table 2.

EIS and LPR parameters of mild steel in 1.0 M HCl in the absence and presence of BDC in various concentrations after 1 h immersion time.
While the Rs value in the uninhibited solution was 1.2 Ω cm2, it did not show a significant change in the inhibited solution, so, it did not have a significant effect on the Rs value of the inhibitor concentration, and was about 1–2 Ω in the inhibited medium. The Rp value in the 1.0 M HCl solution without inhibitor was 72 Ω cm2 in the EIS measurement. As the inhibitor is added in this medium, that is, the Schiff base concentration increases, the Rp values also increase. The maximum Rp has been obtained as 606 Ω for 1.0×10⁻³ M BDC concentration. At the end of the 1 h immersion time, the values of η% calculated from the Rp values have also increased as the Schiff base is added. The inhibition efficiency value in 1.0×10⁻³ M concentration of BDC after 1 h has been found as 88.1%.
The η% values for 1 h immersion have also been found from LPR plots. The found results are shown in Table 2 together with the EIS data. The parameters found from three electrochemical methods are very compatible with each other. The Schiff base showed inhibitor efficiency detected by all three electrochemical methods, showing a high level of protection, especially at low concentrations, and the inhibitor showed a good inhibitor effect on the studied acidic medium. According to the 1 h measurement results, it is thought that this effect is due to the electrons in the aromatic ring in the BDC Schiff base structure, and the larger area covered on the mild steel surface. Adsorption is a consequence of both the aromatic system and the interaction of the π-electrons of the imine group with the electrode.
Immersion time measurements were performed in the absence and presence of various BDC concentrations in 1.0 M HCl at different immersion times (24–120 h). Nyquist curves of mild steel electrodes in 1.0 M HCl after different immersion times are indicated in Fig. 6.
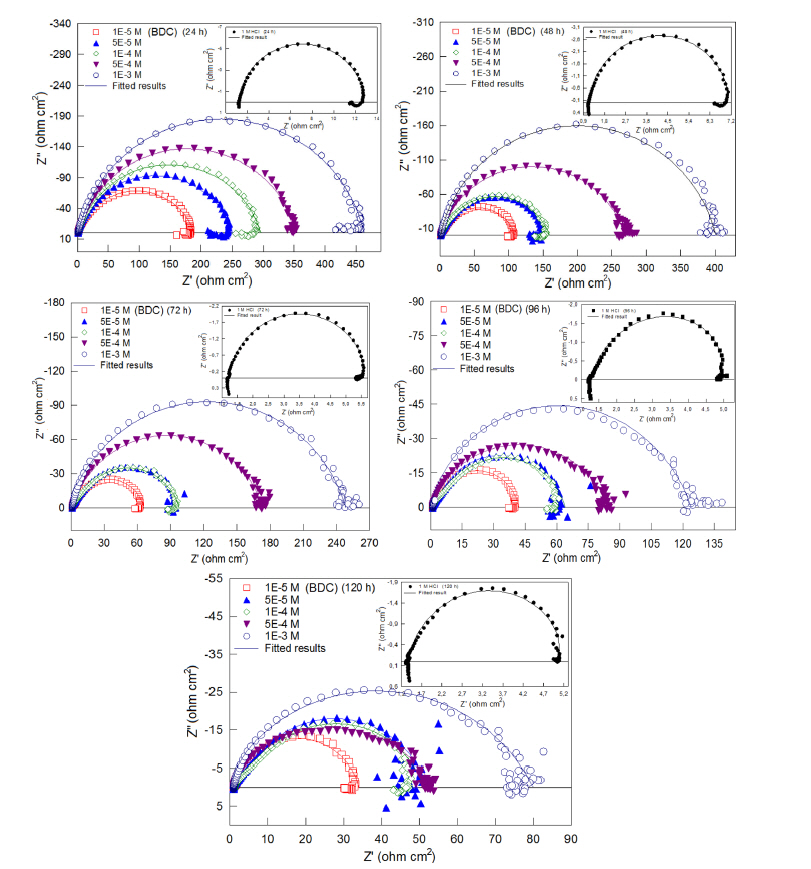
Nyquist plots of mild steel in 1.0 M HCl in the absence and presence of BDC after 24–120 h immersion times.
It is obvious from Fig. 6 that, the Nyquist diagrams of mild steel grant a slightly depressed semi-circle. The diameter of semi-circles has diminished with the increment of immersion time as a consequence of the expected enhancement in corrosion. The formed BDC film on the mild steel surface has decayed with the rise of immersion; it can be apparently observed on impedance diagrams as shown in Fig 6. It has been fitted all experimental data with an appropriate equivalent circuit to find used parameters. So, it has been proposed two kinds of equivalent circuits. The first one of them (embedded to Fig. 5) incorporates Rp comprising Rct and Rd, solution resistance (Rs), inductive resistance (RL), and an inductance (L) with together a constant phase element (CPE). The latter (embedded to Fig. 5) is suggested for each concentrations of BDC Schiff base after long-term tests. It incorporates a film resistance (because of comprising a preventive BDC film on mild steel, Rf) and the pore resistance (Rpor) including Rct which obeys to resistance between the mild steel/outer Helmholtz layer, Rd including adsorbed BDC, ions, accumulated types on the mild steel of the semi-elliptical model that has been informed by Erbil [34]. Two constant phase elements are also available in the system. One of them is the double layer capacitance (CPEdl) and the second one is film formed on mild steel (CPEfilm) which reflects the film layer capacitance. Where Rp is equal to the sum of Rct, Rd and Rf values (Rp = Rct +Rd +Rf).
Calculated all impedance parameters for all exposure times were offered in Table 3. In this instance, η% value can be defined from the Rp using the Eq. (2):

The impedance parameters of mild steel in the absence and presence of BDC at different exposure times.
Where R′p and Rp are inhibited and uninhibited polarization resistances, respectively. It is recognizable that CPE values diminish with the boost of BDC concentration but the Rp values enhance. Parallel investigations have been formerly stated [45] and diminish in CPE values was clarified by a reduce in the dielectric constant and/or an increment in the double layer thickness. That the “n” values decrease with the increment of the BDC concentration can be construed as a proof for adsorption of molecules on mild steel surface [46].
All Nyquist diagrams of the BDC (Fig. 6) are semi-elliptical. During each immersion period, the diameter of the capacitive loops in the solutions containing Schiff base increased significantly with the rise of concentration. On the other hand, as the immersion time increases at each concentration, the diameter of the capacitive loop decreases. As can be seen from Fig. 6, at the end of the 120 h immersion period in the BDC solutions two capacitive loops are formed, one of which is high and the other of which is slightly degraded in the low frequency region. At the Schiff base concentrations, the Rp values decreased as the immersion time increased.
In Table 3, the resistance range of Rp in the BDC containing solutions after 24 h was 188–463 W, 107–400 W after 48 h, 64–246 W after 72 h, 40–122 W after 96 h and 26–48 W after 120 h. As the immersion time increased, there was no remarkable and sudden alteration in the η% values even though the Rp values decreased at each concentration. For example; the η% values calculated at 1, 24, 48, 72, 96 and 120 h immersion times with 1.0×10⁻³ M BDC are respectively; 88.1%; 97.6; 98.8; 98.4; 96.7 and 91.7. This result can be interpreted as increasing the concentration of BDC as the protective and strict film grows on the surface and the surface is covered well.
The inhibition efficiency values found in the Nyquist curves for the BDC inhibitor at different immersion times and concentrations are plotted in a three-dimensional graph in Fig. 7, so that it would be difficult to trace such numbers on the table.
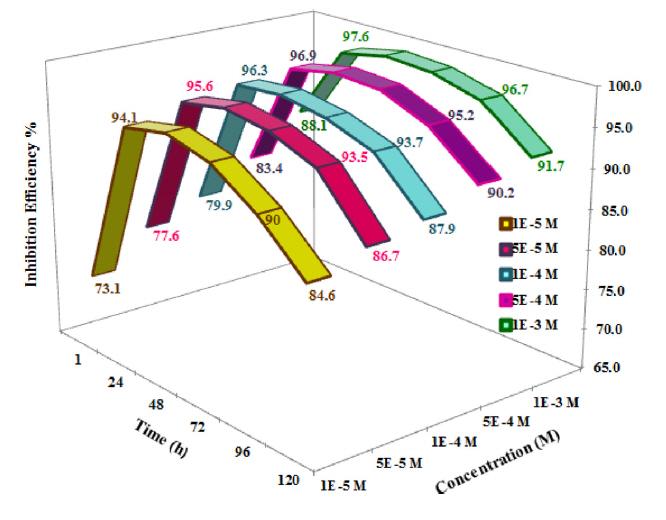
Inhibition efficiency values found in the Nyquist curves for BDC at different immersion times and concentrations.
It is obviously seen that the BDC inhibits the corrosion even after 120 h of exposure time in Fig. 7. This graph expresses the inhibition efficiency values that the increase continues and the decrease starts more easily. When we consider the concentration of BDC versus exposure time, the η% values are rose with the increment of BDC concentration. The inhibition efficiency values determined from EIS experiments have attained the maximum at 48 h after this exposure time that values are slightly decreased. When we look at the chemical structure of the BDC inhibitor (Fig. 1), it appears that the BDC has two aromatic rings in the structure and the electron-donating π electrons of these rings, which strongly activate the molecule and have an effective surface area. In other words, we can interpret the surface of the metal in the form of a Fe+2 ion in the aqueous solution to better cover the BDC molecule because doing so makes it more negative.
The potential of zero charge, Epzc (Eq=0), is another important mutable depending on the concept of adsorption in surface science. In fact, it signifies the potential in which the surface does not transport completely any charge matching the maximum polarization resistance, in other words, the minimum capacitance. The adsorption phenomenon of the inhibitor is impressed by the surface charge and nature of the metal and by the chemical structure of inhibitors. For this reason, the metal surface charge is owing to the electrical field which arises at the interface on immersion in the electrolyte [17,47]. The EIS method was utilized to determine the PZC of the metal. The metal’s surface charge is described by the location of corrosion potential (Ecorr) in accordance with the Epzc.
Where Ecorr the corrosion potential, i.e. open circuit potential and Epzc is zero charge potential, and y is the surface charge. When the surface charge is found to be positive, the adsorption of anions is favoured. When it is the opposite, the metal surface gains the negative net charge and the adsorption of cations is favoured [48,49]. The zero charge potential of the mild steel in 1.0 M HCl with the contribution of 1.0×10⁻³ M BDC inhibitor was calculated from the EIS measurements after 1 h exposure time. Therefore, the all measured Rp values at a stable potential between ± 0.180 V (Ag/AgCl) were recorded and as result, the plot of the Rp versus potential was drawn. The plot obtained is shown in Fig. 8.

Rp values versus E (V vs Ag/AgCl) in 1.0 M HCl in the presence of 1.0×10⁻³ M BDC at 298 K.
According to Fig. 8, the difference of potential is ψ = −0.03 V for BDC. That is, the mild steel surface was found as negative. Where y is negative, it means that the electrode surface is negatively charged. Hereby protonated water molecules and cationic types of the BDC molecule would be directly adsorbed on mild steel surface [50,51]. The negatively charged surface pulls the protonated imine molecule from the corroding media through electrostatic interaction and composes a protective surface on mild steel. This formed layer insulates the mild steel from direct contact with the acidic solution and decrease the loss of material.
3.4. Adsorption isotherm and inhibition mechanism
Different adsorption isotherms such as Flory-Huggins, Langmuir, Temkin, Frumkin and Freundlich for the BDC inhibitor have been tried to identify the relationship between the mild steel surface and the inhibitor and to determine which species of adsorption is responsible, assuming that the molecular adsorption at the mild steel/solution interface is based primarily on a mechanism of corrosion inhibition. In the drawing of adsorption isotherms, surface coverage fraction (θ) values determined by EIS method at the end of 1–120 h immersion times at 298 K were used. The appropriate fits were provided with Langmuir adsorption isotherm by correlation coefficients varied from 0.995 and 0.999 for all immersion times. According to Langmuir adsorption isotherm, θ is related to the BDC concentration C(inh).
Where C(inh) is the BDC concentration and K(ads) is the adsorption equilibrium constant of the adsorption process. The C versus C/θ plot grants a linear line with a slope near unit (Fig. 9) for each immersion times.
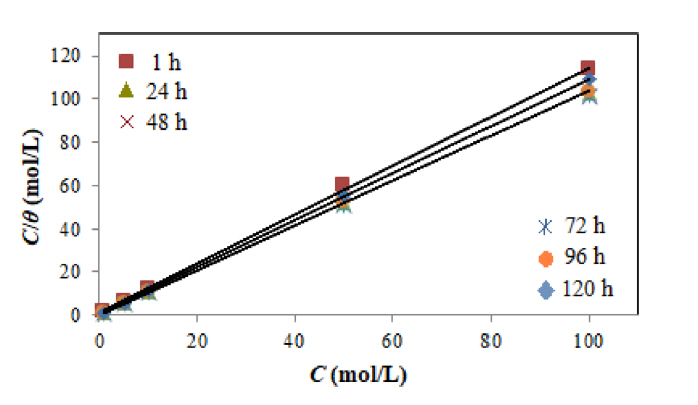
Langmuir adsorption plot for mild steel in 1.0 M HCl solution containing different concentrations of BDC Schiff base for different immersion times.
The adsorption of the organic inhibitors can be defined by two kinds of interaction: Chemical and physical adsorptions. These interactions are concerned with the nature of metal, the type of the electrolyte and structure of the inhibitor.
In present study, it has been calculated the adsorption free energy (

The values of Kads and
Where 55.5 is the molar concentration of water, R is the universal gase constant, and T is temperature in Kelvin. The negative and high values of
In this study, the all
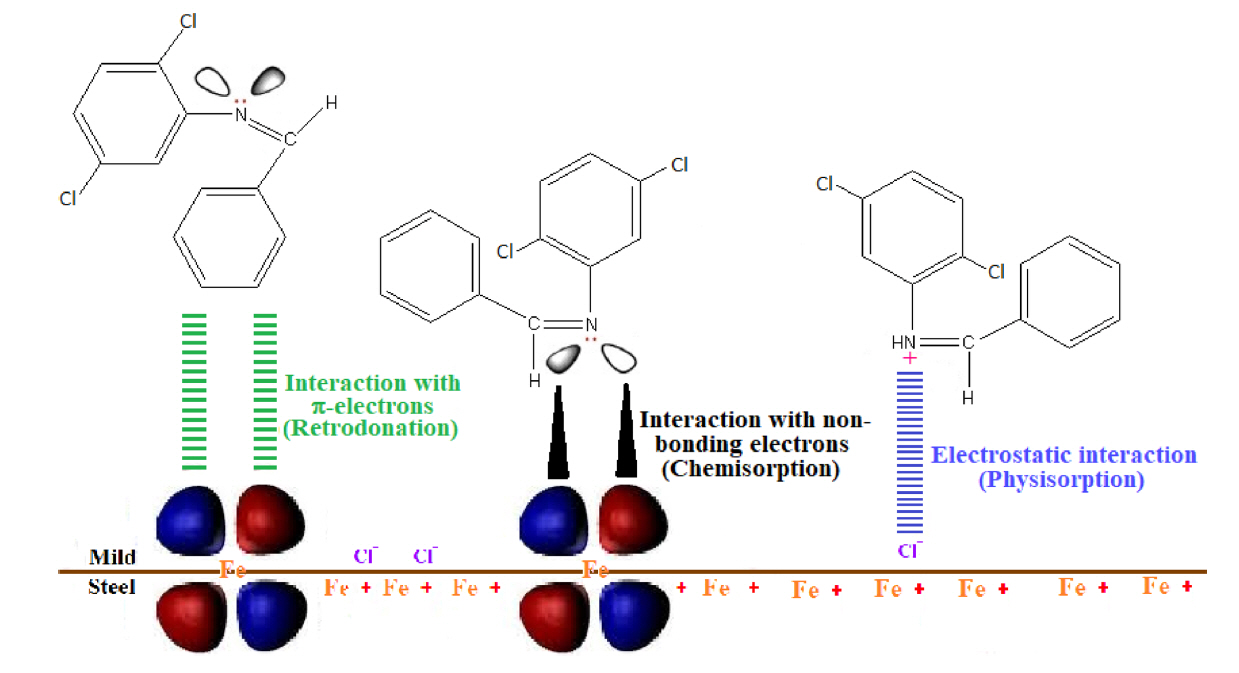
A probable schematic adsorption model between BDC and mild steel.
3.5. Activation energy of mild steel
The influence of temperature on the protection of mild steel was also examined in 1.0 M HCl for each concentration of BDC inhibitor. For this reason, the activation energy (Ea) of mild steel has been determined via Arrhenius equation [9,57] by using icorr values obtained from the potentiodynamic polarization technique in the corrosion process.
Where A symbolizes the pre-exponential factor, Ea the apparent activation energy, icorr the corrosion rate and R the gas constant. The Ea values were found by plotting a graph between ln (icorr) and 1/T, and are given in Fig. 11.
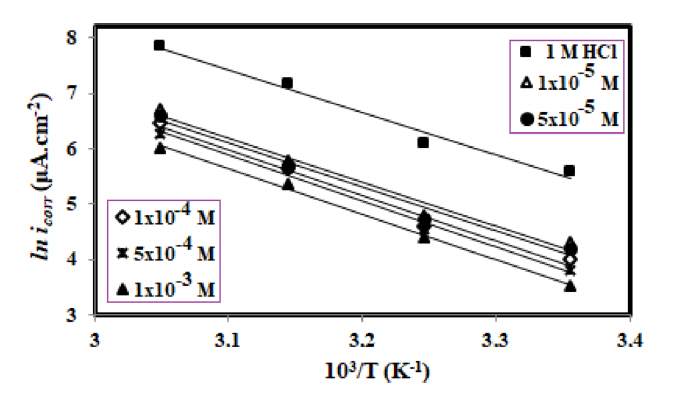
Arrhenius plots of mild steel in 1.0 M HCl solution with and without the presence of various concentrations of BDC Schiff base.
The calculated Ea values of mild steel were as 63.7, 66.0, 66.3, 68.2, 68.8 and 68.6 kJ/mol for blank solution and 1.0×10⁻⁵ M, 5.0×10⁻⁵ M, 1.0×10⁻⁴ M, 5.0×10⁻⁴ M and 1.0×10⁻³ M concentrations of BDC, respectively. As the inhibitor concentration increases, the Ea values are found slightly greater than that of the blank. Therefore, the BDC inhibitor can be defined between inhibitors whose inhibition efficiency is unchanged by the alteration of temperature and whose Ea is unchanged by the presence or absence of inhibitor. By this way, it can be said that Schiff base molecule is largely adsorbed to the active parts of mild steel surface. This slight enhancement in Ea value for inhibited solution reveals the constitution of higher energy barrier indicating that adsorbed BDC film on mild steel inhibits the reaction of charge transfer taking place on mild steel surface in the corrosion process. Furthermore, the slight diminish in inhibition efficiency with the rise of temperature for potentiodynamic polarization measurements displays the physisorption that happens during the first phase of adsorption in the corrosion process [7,37,58]. The growing value of Ea also exhibit that the contribution of BDC decreased the dissolution rate of mild steel owing to the constitution of the mild steel-BDC complex in acidic medium [59]. According to literature, lower/or unaltered Ea values in inhibited solutions compared to acidic medium have been informed to be demonstrative of chemical adsorption, otherwise higher Ea values imply the physisorption.
3.6. Surface analyses
Surface analyses were performed by SEM and AFM techniques in order to evaluate the surface morphology of the mild steel electrodes in 1.0 M HCl solution. For this, SEM and AFM images were taken in 1.0 M HCl solutions with (1.0×10⁻³ M) and without BDC Schiff base, while mild steel electrodes were held at 298 K for 120 h. SEM and AFM analyses were performed by cutting the mild steel electrodes at a distance of 0.5 cm from the surface with the help of an iron saw. Surface micrographs of the electrodes for the BDC inhibitor magnified 200-fold with SEM are given in Fig. 12. As can easily be observed from the Fig. 12a, large dark spots are observed in the pit-like appearance on the electrode surfaces that are immersed in the uninhibited solution. So, it can be clearly said that this sample is considerably damaged by the uninhibited solution. However, the mild steel surface is almost completely protected, that is, the sample appeared to be smooth because of the protective BDC layer formed on the mild steel surface against acidic medium with 1.0×10⁻³ M BDC Schiff base (Fig. 12b) [60,61].
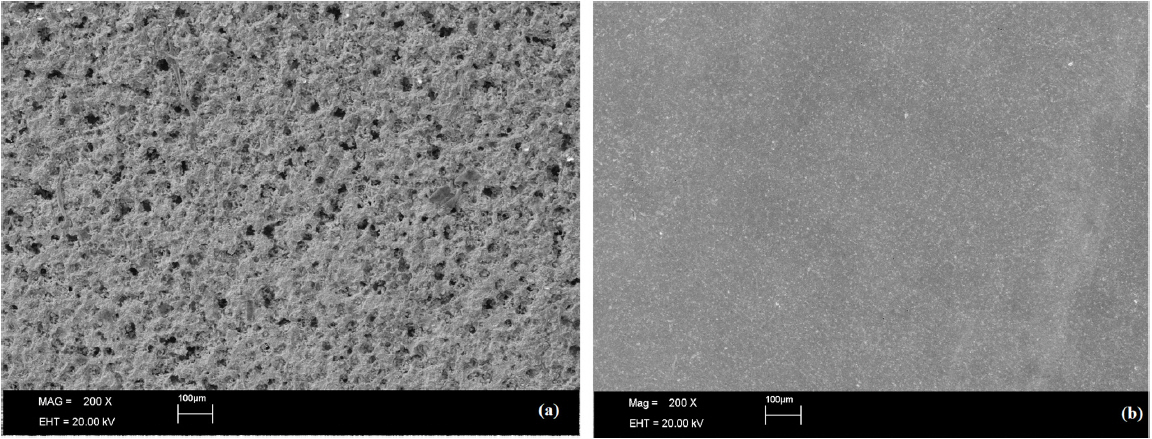
SEM images of blank (a) and 1.0×10⁻³ M BDC Schiff base (b) in 1.0 M HCl solution after 120 h.
AFM is a well-rounded and useful technique for investigating at the nano-scale. It is also very valuable because images can be obtained at the molecular level or can be taken directly from the surfaces. It can provide important information about surface properties, morphologies, and roughness [62,63]. The three-dimensional AFM images of electrodes subjected to in 1.0 M HCl with and without 1.0×10⁻³ M BDC Schiff base for 120 h are indicated in Fig. 13a and 13b, respectively.
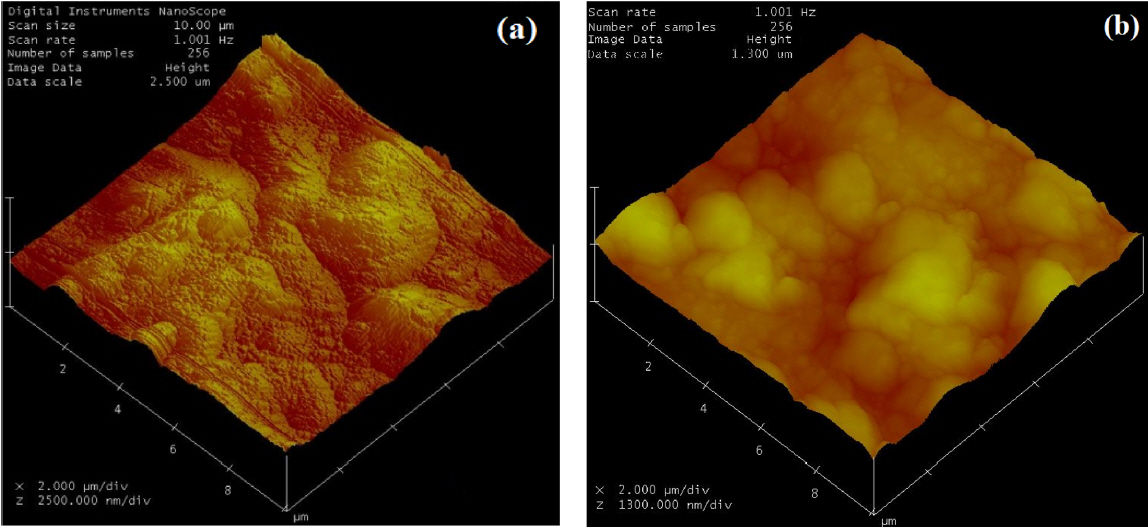
AFM images of mild steel surface after exposed to 1.0 M HCl solution without (a) and with the addition of 1.0×10⁻³ M BDC Schiff base (b) after 120 h.
The results of AFM analysis are very compatible with those of SEM. It can be seen from Fig. 13a, the mild steel surface is highly influenced by the corroded solution and turned into a rough surface with large and deep pits and it has a very porous structure (Fig. 13a). The average roughness of the surface was determined to be 349.14 nm. This value was measured as 132.30 nm when 1.0×10⁻³ M BDC was added to the acidic medium (Fig. 13b). It has also been confirmed by AFM technique that the electrode surface, which has been kept in BDC containing the solution for 120 h, has a smoother structure. The BDC molecules are adsorbed on the active parts and inhibited the metallic corrosion. When the average surface roughness values are taken into account, it is monitored that the value in the solution containing BDC is considerably less than the value in the blank solution. Thus, it can be said that the BDC Schiff base is another proof of the inhibition of the mild steel corrosion.
4. Conclusions
The BDC Schiff base was newly synthesized and its structure was illuminated by spectroscopic methods. It is also investigated the effect of corrosion inhibitor on mild steel in 1.0 M HCl for both long and short immersion times by using electrochemical measurement methods. The following results can be underlined:
BDC Schiff base has a good protective influence for mild steel corrosion in 1.0 M HCl. Its inhibition efficiency is not only dependent on the concentration but also on the duration of the immersion. The good inhibition of the BDC is ascribed to the adherent adsorption of Schiff base on the mild steel surface.
The potentiodynamic polarization curves demonstrated that BDC acted as predominantly cathodic controlled mixed-type inhibitor for all studied temperatures. The BDC molecule also protects the mild steel at higher temperatures.
The adsorption of BDC on the surface of mild steel obeys the Langmuir isotherm. The negative values of
AFM and SEM micrographs clearly indicate that the mild steel corrosion in 1.0 M HCl expresses the forming deep pitting and addition of BDC to this acidic medium excessively decrease the corrosion and its surface image gets smoother.
Supplementary Information
The 1H–NMR spectrum of synthesized BDC Schiff base.
Acknowledgement
The author thanks to Niğde Ömer Halisdemir University Scientific Research Projects Unit (BAGEP Project Number: FEB 2013/41) for their financial support throughout this research.