Effects of Cetyltrimethylammonium bromide on the Corrosion Inhibition of a Lead-free α-Brass by Sodium Gluconate in Sulfuric Acid
Article information
Abstract
The inhibition performance of sodium gluconate (SG), cetyltrimethylammonium bromide (CTAB) and their mixture (SG/CTAB) on the corrosion behavior of α-brass in 0.5 M H2SO4 solution has been investigated by potentiodynamic polarization, electrochemical impedance spectroscopy (EIS), Scanning Electron Microscope with Energy-Dispersive Spectrometer (SEM-EDS), Inductively Coupled Plasma Spectrometry (ICPS) and molecular dynamics (MD) simulation techniques. The results reveal that SG with 5ppm CTAB, noted SG/CTAB, acts as a good corrosion inhibitor and its inhibition efficiency reached 89% after 24 h immersion in sulfuric acid solution, but slightly decreased at higher temperatures. The polarization curves displayed that SG/CTAB acts as a cathodic-kind inhibitor. Electrochemical impedance spectroscopy (EIS) studies revealed that the addition of 5ppm CTAB to different concentrations of SG considerably increases the corrosion resistance of α-brass. The SEM-EDS and ICPS analyses support the experimental results. Further, molecular dynamics (MD) simulations were used to understand the adsorption profiles of SG/CTAB on Cu(111) and Zn(111) surfaces.
1. Introduction
The brass alloys are of particular interest because of their distinctive properties such as excellent mechanical properties, machinability and corrosion resistance [1,2]. These alloys were specially designed to meet the requirements of many industrial applications and their use in pipes, valves, aqueous fluid transport, medical and artistic applications, and other diverse engineering applications are widely known [3,4]. Over the years, different types of brasses have been developed by varying the proportions of zinc and copper and other trace elements to create an alloy with significant properties such as strength, wear resistance, hardness and corrosion resistance among others [5]. In certain cases, however, brasses undergo a selective corrosion during which the copper and zinc are the seats of cathodic and anodic reactions, respectively [6]. Owing to the importance of brass, its corrosion properties have attracted increasing attention from researchers, thus investigation in this regard is an absolute necessity and warranted [7,8]. Corrosion inhibitors, which can provide effective protection from corrosion, is one of the scientifically substantiated and economically expedient methods to overcome this unwanted problem [9–13]. Indeed, the vast majority of organic compounds used as corrosion inhibitors are exceptionally electron-rich compounds, which can interact readily with metal surface in an electrolyte [14]. Most of the well-known corrosion inhibitors contains heteroatoms, π-electron, long carbon chain and aromatic heterocycles in their structure, which cause a significant improvement in the inhibition process [15,16].
In reviewing the literature, many interesting outcomes regarding the use of CTAB in combination with different organic compounds were found in corrosion inhibition studies [17–19]. In our previous works, the importance of assembling CTAB with sodium gluconate for the corrosion inhibition of few alloys in different aggressive mediums has been shown. A study by Touir et al.[20] on the scale and corrosion inhibition of ordinary mild steel used for cooling water system treatment found that SG/CTAB mixture serves as an effective inhibitor for corrosion and scale with interesting inhibitive properties of SG at higher temperatures. In other work, the same research team examined the influence of SG/CTAB as a non-toxic formulation on the inhibition of corrosion, scale and biocorrosion of low carbon steel in cooling water systems and interesting results have also been obtained [21]. More recently, Azaroual et al.[22] studied the corrosion inhibition of galvanized steel in 3.0% NaCl solution using SG, CTAB and their mixture. The results showed an enhancement in the corrosion inhibition efficiency from 77% (SG) and 76% (CTAB) to 98% (SG/CTAB) as a direct cause of mixing both compounds. However, the corrosion inhibition study of α-brass in sulfuric acid solution by SG and CTAB has been still lacking until now. For that reason, SG/CTAB in a different medium (sulfuric acid) need to be adapted in a new effort to enhance the corrosion protection of brass.
Unfortunately, despite its importance, little attention was paid to the acidic corrosion mechanism of brass. Therefore, the present research contribution is to fill such gap of knowledge and to gain a better understanding of the corrosion inhibition mechanism that a single-phase (α) copper-zinc alloy experiences in sulfuric acid solution using a mixture of SG/CTAB. The α-brass used in this work which contains less than 37% zinc, is a lead-free brass alloy, has the ideal combination of machinability, forgeability and high strength and it is expected to possess higher corrosion resistance than those with greater zinc content. We probed the interaction between SG/CTAB and α-brass surface in 0.5 M H2SO4 using electrochemical and surface characterization techniques combined with MD studies. To the best of our knowledge, no such research has been conducted and this rarity prompted to report the case. This work is envisaged to have a positive scientific knowledge impact on the further use of this alloy.
2. Experimental
2.1. Materials and solutions
The chemical composition of α-brass samples was: 77.1 wt% Cu, 0.01 wt% Sn, 0.05 wt P, 0.02 wt% Fe, 3.3 wt% Si, and balance Zn. Cetyltrimethylammonium bromide (CTAB), sodium gluconate (SG) and sulfuric acid (H2SO4) (98%) were purchased from Sigma-Aldrich. All chemicals are of analytical grade unless otherwise mentioned. The test solution (H2SO4 of 0.5 M concentration) was prepared from the commercially obtained 98% H2SO4, by diluting with aid of distilled water. The range of concentrations of employed inhibitors was kept in between 1 × 10⁻⁶ to 1 × 10⁻³ M of sodium gluconate with 5 ppm of CTAB. The molecular structures of the above-mentioned compounds are illustrated in Fig. 1.
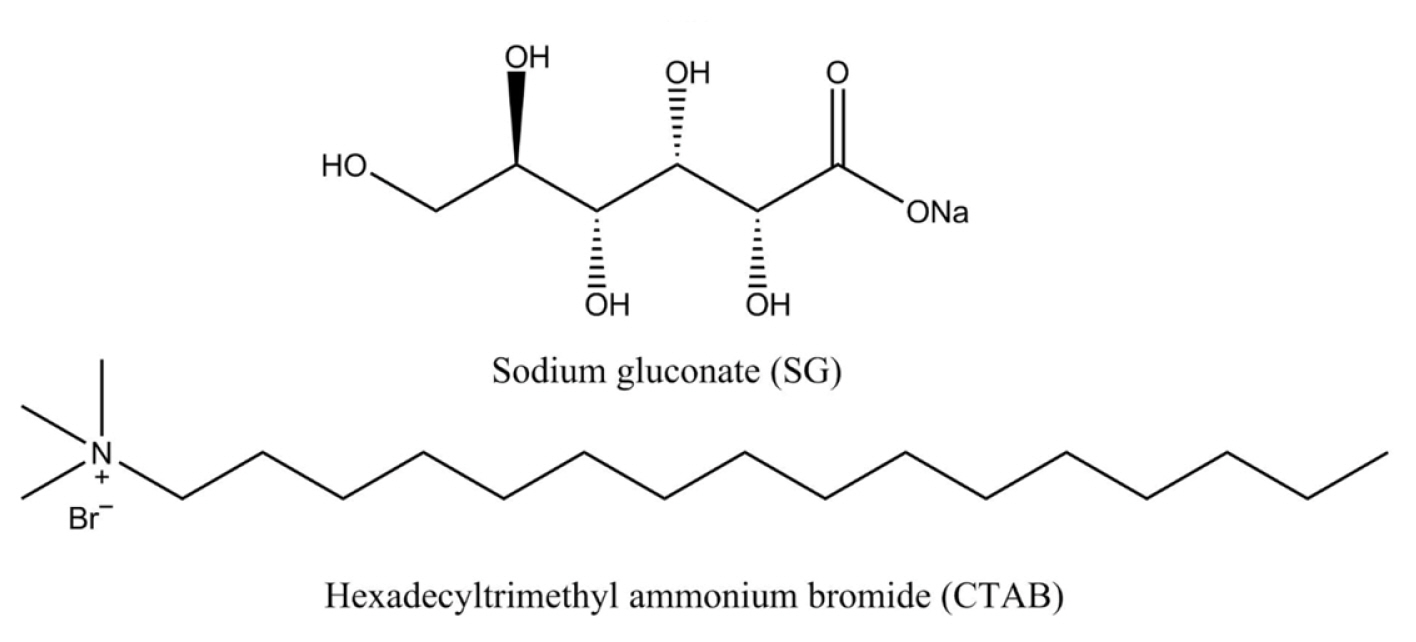
Schematic representation of the sodium gluconate and Cetyltrimethylammonium bromide
2.2. Electrochemical measurements
All electrochemical experiments were performed with the potentiostat/galvanostat PGZ100 electrochemical station. A standard three-electrode cell system was used. The three-electrode system consisted of a working electrode (α-brass), Pt as an auxiliary electrode alongside a saturated calomel reference electrode. The experimental temperature was fixed at 303K for concentration and immersion time effects and at 303, 313, 323 and 333K for temperature effect. At first, in order to be in equilibrium with the environment, the α-brass samples were dipped in the test solution for 30 min at the open circuit potential. Measurements of the impedance spectra were obtained in the frequency range of 10 MHz to 100 kHz and an AC amplitude of 10 mV. The polarization curves, anodic and cathodic, were recorded with a 1 mV s−1 constant sweep rate, from 200 mV to −800 mV around the open-circuit potential. Using the following equations, we calculated the inhibition efficiency from electrochemical impedance spectroscopy (EIS) (Eq. 1) and potentiodynamic polarization (PDP) (Eq. 2) data[23]:
In these equations, icorr and Rsum correspond to the corrosion current density and sum of resistances under uninhibited solutions, respectively whereas
2.3. SEM-EDS and Inductively Coupled Plasma Spectrometry
α-brass samples were scanned using a Hitachi TM-1000 SEM after 12h of immersion in sulfuric acid solution without and with SG, CTAB and SG/CTAB. Using inductively coupled plasma spectrometry, α-brass samples, i.e. uninhibited, with SG and SG/CTAB immersed in the sulfuric acid solution in sterile tubes were analyzed after the immersion period (12h). The ICP-OES experiments were carried out at 303K.
2.4. MD simulations
Density functional theory (DFT) calculations have been extensively used to examine electronic properties and to predict the trend of the inhibition performance of corrosion inhibitors. However, in many cases, these calculations fail to explain the inhibitor-metal interaction since they do not consider the presence of the metal and the solvent. Therefore, it is imperative to search for a robust method for the modeling of inhibitor-metal interactions in the presence of water and corrosive particles to mimic the real experimental condition [24–26]. In this work, MD studies were accomplished using Materials Studio (MS) package [27] to gain insight at an atomic level into the interaction of SG/CTAB with Cu(111) and Zn(111) surfaces, which are the main constituent of α-brass, in a simulated sulfuric acid solution. Surfaces of Cu and Zn were imported from MS database, cleaved to (111) and enlarged to 10×10 super cell. A simulation box that contains water and inhibitor molecules along with sulfate and hydronium ions was created to reproduce the real conditions as much as possible. MD simulation was performed under 303 K, NVT ensemble (also known as constant-temperature, constant-volume ensemble, where the moles (N), volume (V), and temperature (T) are fixed for the system), at a time step of 1.0 fs and a simulation time of 2000ps. All simulations were performed using the COMPASS force field [28]. The total energy of the entire system referred as Etotal, the total energy of metal and uninhibited solution referred as Esurface+solution and the total energy of the inhibitor molecules Einhibitor were calculated from the MD trajectory and used to determine interaction and binding energies using the following equations[15,24]:
and
3. Results and Discussion
3.1. Potentiodynamic polarization
Potentiodynamic polarization measurements were used to evaluate the effects of various concentrations of SG and SG with 5ppm CTAB on the corrosion behavior of α-brass in 0.5 M H2SO4. Fig. 2 and Table 1 represent potentiodynamic polarization curves and the electrochemical parameters derived from PDP experiments.
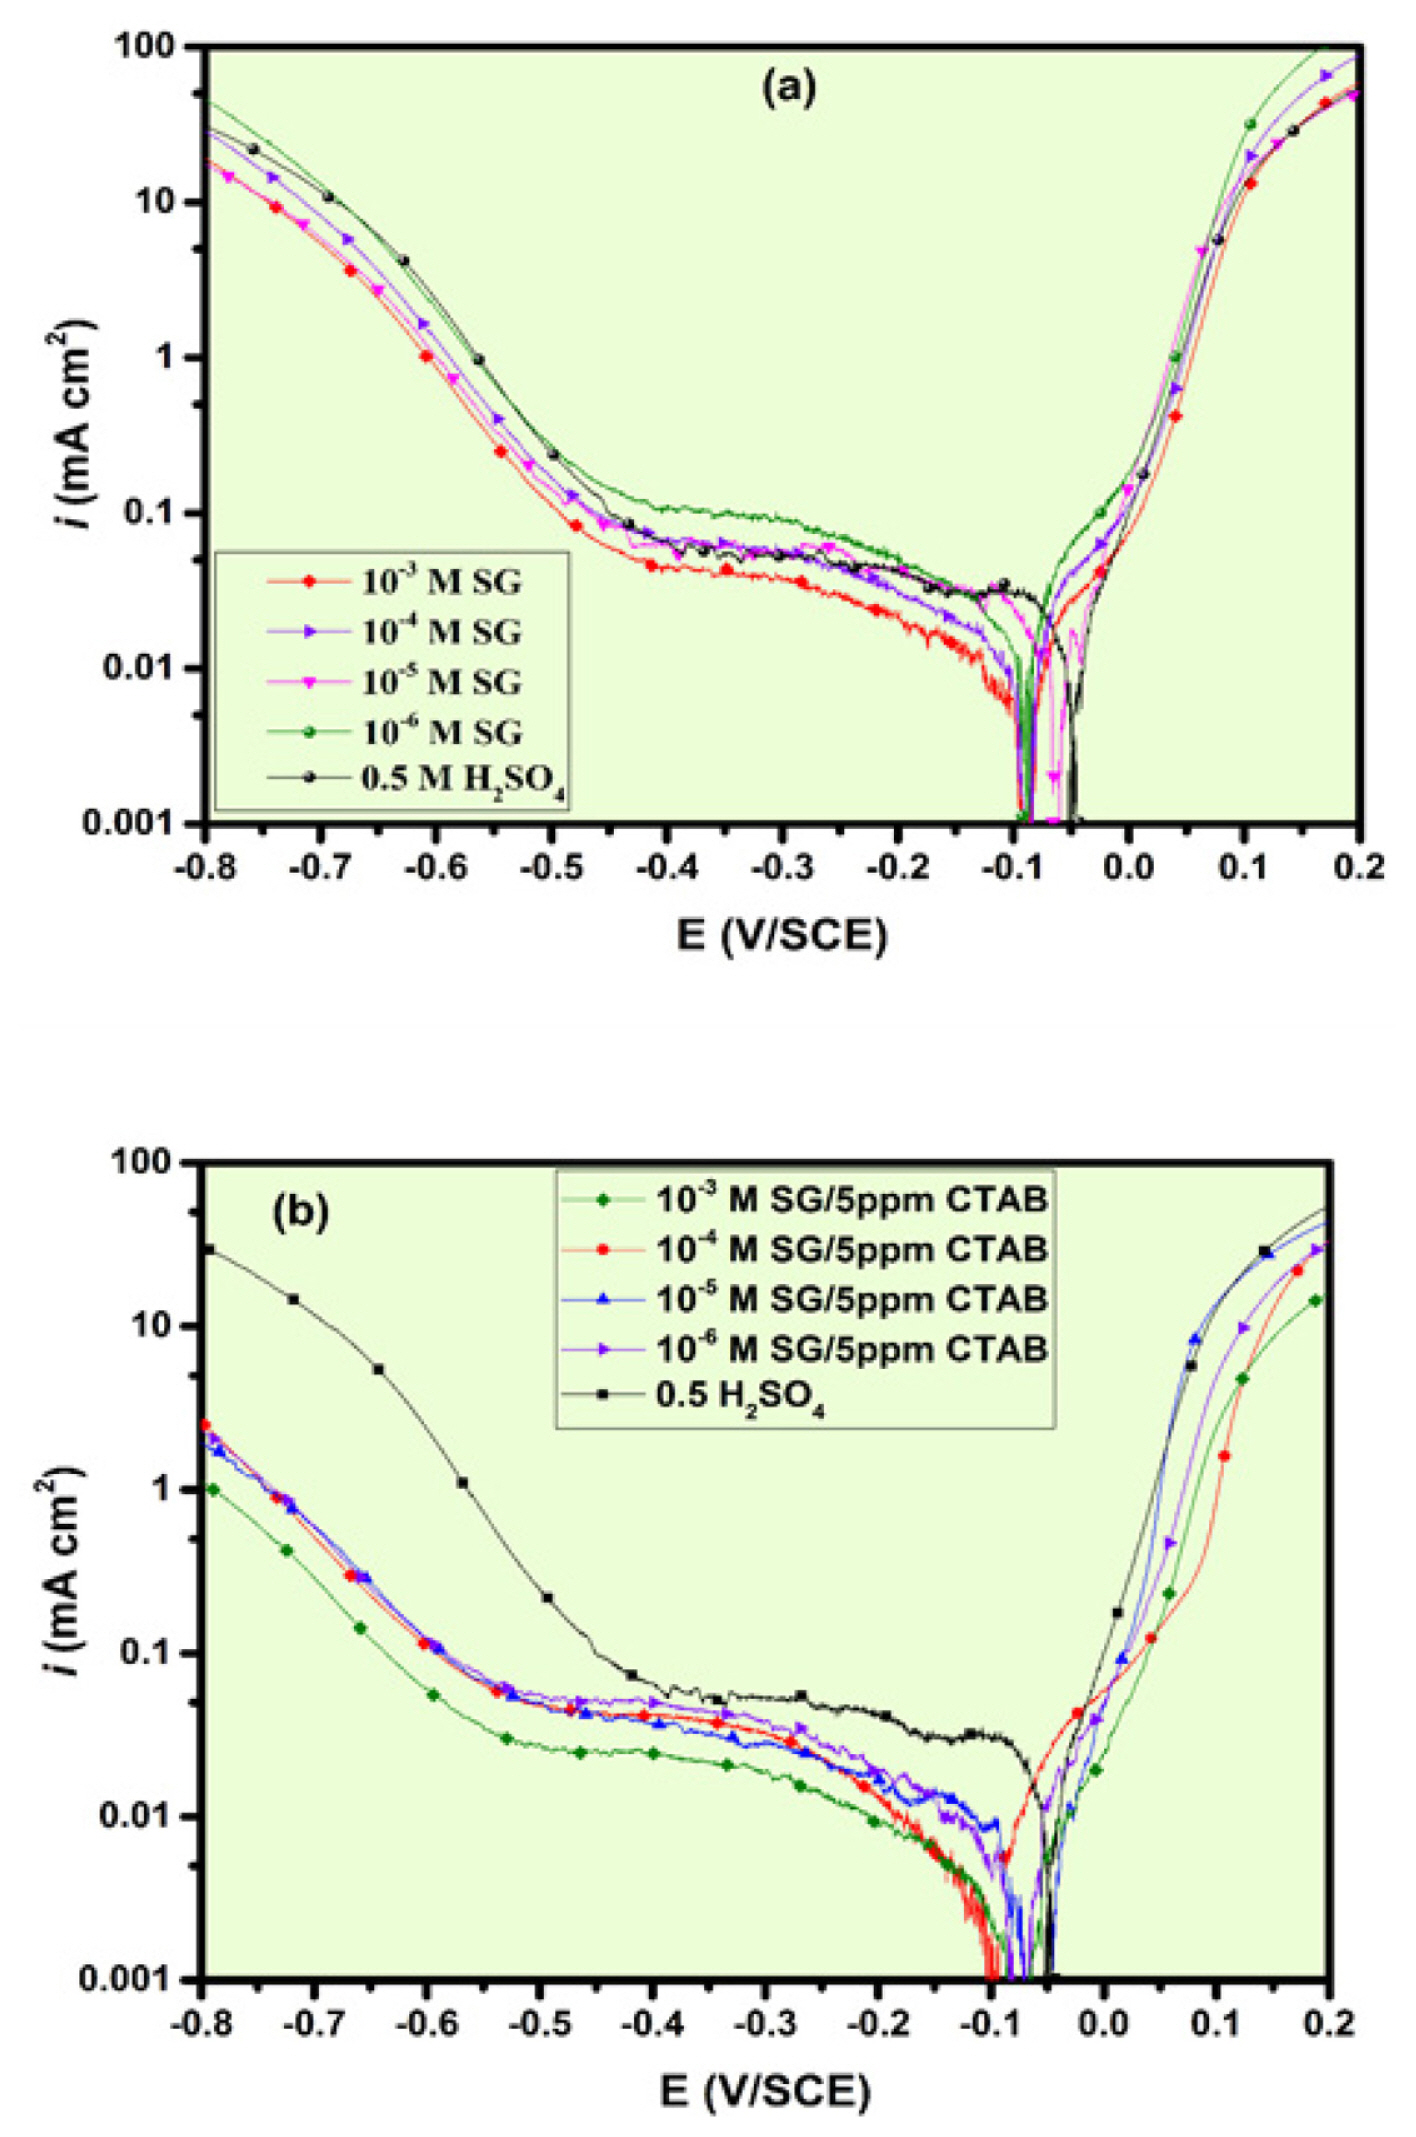
Potentiodynamic polarization curves of α-brass in 0.5 M H2SO4 at (a) various concentrations of SG and (b) SG with 5ppm CTAB at 303K
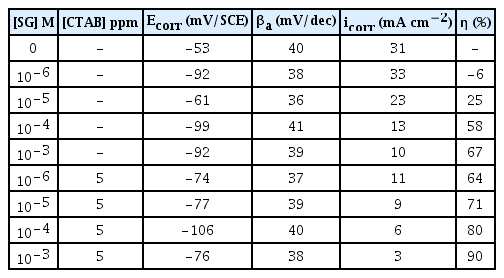
The PDP parameters for the corrosion of α-brass in 0.5 M H2SO4 in the absence and presence of different concentrations of SG and SG with 5ppm CTAB at 303K
It can be seen from Fig. 2 that after adding different concentrations of SG and SG with 5 ppm CTAB to the H2SO4 solution, the corrosion current densities in the cathode and anode regions move toward the lower values. Although the effect of SG alone on the corrosion of α-brass is apparent, a considerable decrease in the current density was observed after addition of SG/CTAB. Furthermore, the effect was more pronounced on the cathodic Tafel region while the change in the anodic Tafel region is insignificant. This result indicates that SG/CTAB can effectively inhibit the corrosion behavior of H2SO4 solution on α-brass. Though the corrosion potential has a slight displacement toward the negative values, it seems that both SG and SG/CTAB have better corrosion inhibition effect on the cathode than the anode. A close inspection of Fig. 2 reveals that cathodic parts of the polarization curves represent a limiting current associated with the oxygen reduction process. This means that the cathodic process is controlled by diffusion of oxygen gas from the bulk solution to the metal surface rather than activation polarization, which prevented a clear linear extrapolation of the cathodic curves. The copper ion re-deposition and the diffusion of sulfate ions from solution to surface via defects in the inhibitor layer can also contribute to the cathodic process. Thus, it was not possible to extract the cathodic Tafel slopes by linear extrapolation to Ecorr [29]. This behavior is similar to that obtained by other authors who studied the corrosion and corrosion inhibition of α-brass in H2SO4 solutions [30–32]. At a more negative potential, an apparent increase of current density was observed which is probably due to hydrogen evolution [29].
It can be noted from the results in Table 1 that the anodic Tafel slope of both inhibited solutions remains almost unchanged. Thus, as the effect of SG/CTAB on the corrosion rate is very clear, the cathodic Tafel slopes should increase after adding inhibitor molecules. This is confirmed from the corrosion potential values that are slightly shifted toward cathodic region confirming, therefore, the predominant of the cathodic process. It is worth noting that there is a noticeable increase in the inhibition efficiency after the addition of 5 ppm CTAB to SG. The inhibition efficiency increases exponentially with increasing SG/CTAB concentration which indicates the success of the used formulation in inhibiting the acid attack.
3.2. Electrochemical impedance spectroscopy
3.2.1. Effect of inhibitor concentrations
Fig. 3 shows the impedance results of α-brass under different conditions in 0.5 M H2SO4 solution at 303K. Fig. 4(b) is the Bode diagrams of α-brass in bank and H2SO4 solution with different concentrations of SG alone and with 5ppm CTAB. As can be seen from Fig. 3, the diameter of the impedance arc of inhibited solutions is significantly larger than that of the blank, which indicates that tested inhibitors, i.e. SG and SG/CTAB have a strong inhibition effect on α-brass corrosion. From the Bode diagram, two-time constants were seen, an adsorbed inhibitor layer at higher frequencies and a surface double layer at low frequencies [32]. The equivalent circuit diagram used to fit Nyquist plots is shown in Fig. 4(a). Rs is the solution resistance, CPE is the constant phase element (CPEdl related to double layer and CPEL the adsorbed inhibitor layer), Rp is the polarization resistance and RL is the inhibitor layer resistance. Due to the dispersion effect caused by surface heterogeneities, the behavior of the electric double layer capacitor is not equivalent to the pure capacitance, so the constant phase elements CPEs are used instead of the capacitor [24]. This component is usually used to describe the behavior of systems having heterogeneities within their microstructures. A close-up look in Fig. 3 shows that a good fit of the impedance spectra has been obtained. The impedance of the CPE (ZCPE) is defined by the following equation [24]:
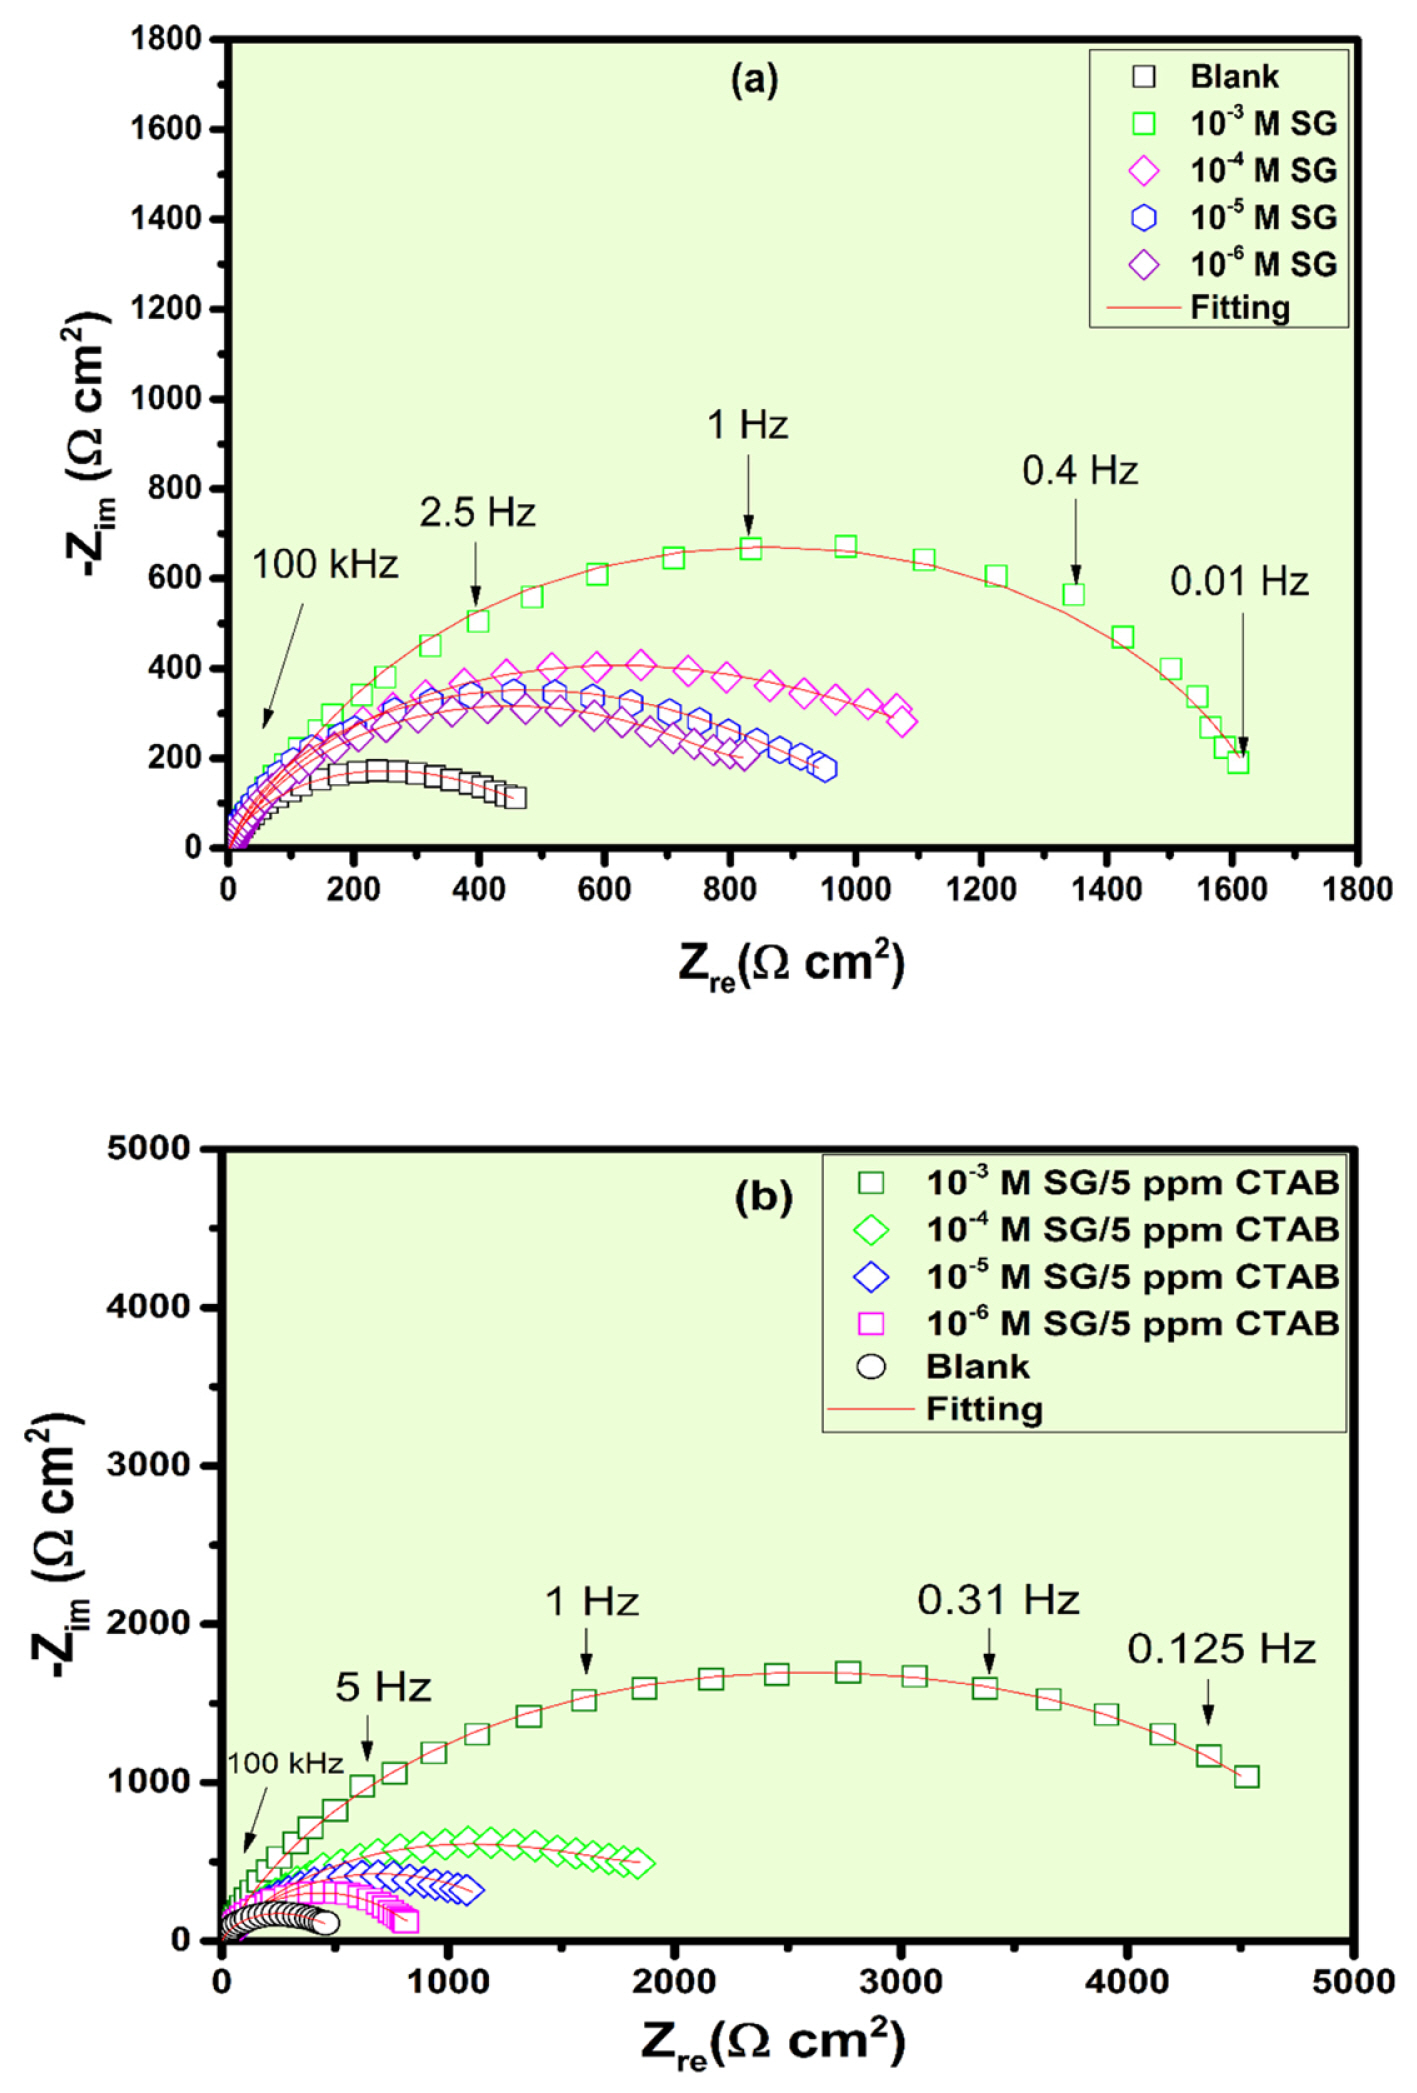
Nyquist diagrams of α-brass in 0.5 M H2SO4 at (a) various concentrations of SG and (b) SG with 5ppm CTAB at 303K
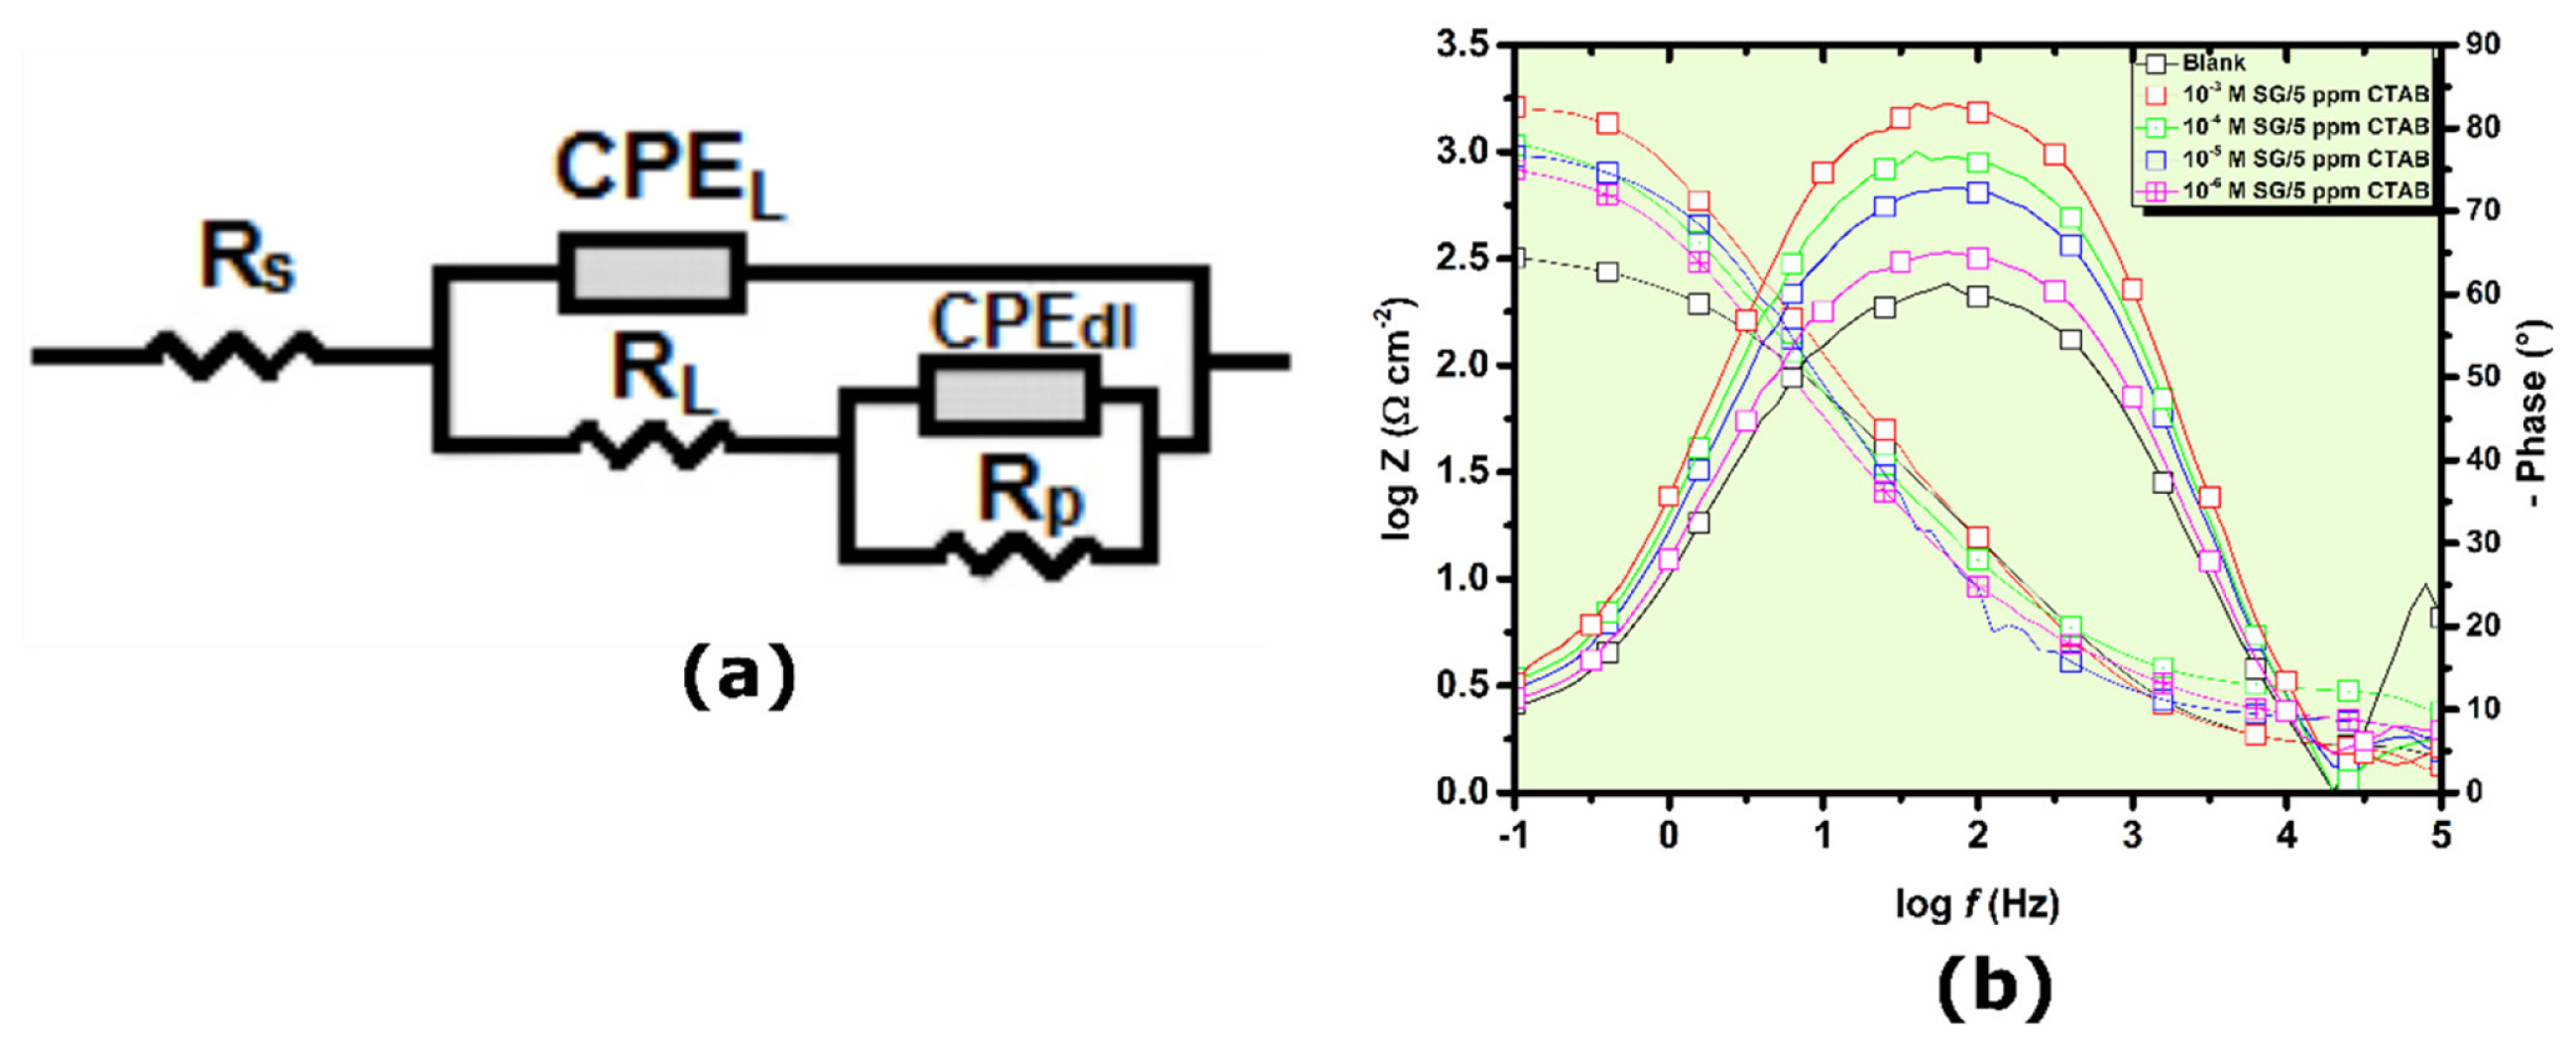
(a) Equivalent circuit model and (a) Bode plots of α-brass in 0.5 M H2SO4 at various concentrations of SG with 5ppm CTAB at 303K
where Q is a proportionality coefficient, ω is the angular frequency for which imaginary part of the impedance reaches its maximum (Eq. 11) [33], i is the imaginary unit and n is a measure of surface irregularity. For the whole number of n = −1, 0, 1, CPE represent inductance (L), resistance (R) and capacitance (C), respectively. Herein, double layer capacitance values (Cdl) are obtained using the following relationship [34]:
On the other hand, the corrosion inhibition performance was discussed in view of the Rsum (Rsum = Rs + Rp + RL) values. Thus, as the Rsum increases, the anti-corrosion performance of α-brass increases. The Rsum along with electrochemical parameters obtained by fitting are shown in Table 2. As it is seen from Table 2, the solution resistance Rs hardly changes, indicating that the addition of the corrosion inhibitor does not significantly change the properties of the entire electrolyte solution. The results as displayed in Table 2 indicate that the α-brass electrode immersed in H2SO4 has the lowest Rsum value, which is a sign of the poor corrosion resistance and that ions diffusion rate is large under the blank condition whereas the charge transfer resistance is small. This leads to the formation of corrosion products on the α-brass surface. After the corrosion inhibitors are added, a protective film would form on the α-brass surface through adsorbed inhibitor molecules. The Rsum values of the α-brass in presence of SG/CTAB are very higher compared to those with only SG inhibitor. This suggests that SG/CTAB provides an effective protection of α-brass electrode, thereby hindering the diffusion of ions; and as the concentration of SG/CTAB increases, the corrosion resistance gradually increases and the corrosion inhibition rate increases. On the other hand, it is worth mentioning that there is no strong correlation between the inhibition performance and the Cdl values. This is in contrast to what is usually observed in the corrosion inhibition of steels. For steels, the Cdl values decrease with increase in inhibitor concentration due to either the decrease in dielectric constant or increase in the surface film thickness [24]. Obviously, this is not always the case for brass alloys [32]. As observed in the present work, it seems that there is no close correlation between inhibitor concentrations on one hand and dielectric constant and surface film thickness values on the other. This behavior is mainly due to the difference between the surface conditions of α-brass alloys and steels in terms of the effect of the substrate structure, the roughness on the corrosion resistance. At the same concentration, a higher increase in the inhibition efficiency can be observed after addition of 5 ppm CTAB, which is consistent with the results of potentiodynamic polarization tests.
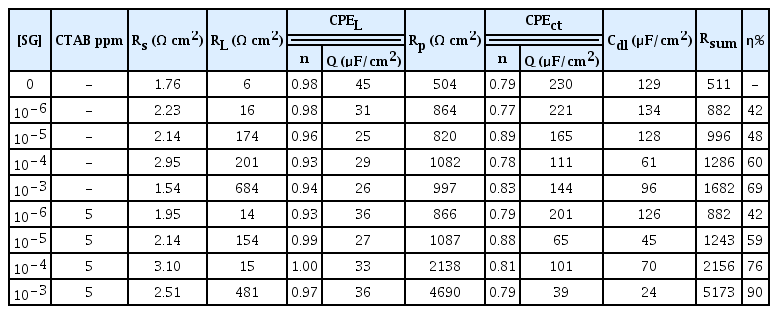
Impedance parameters recorded for α-brass electrode in 0.5 M H2SO4 solution in the absence and presence of SG and SG with 5ppm CTAB
3.2.2. Effect of immersion time
Fig. 5 displays the results of the electrochemical impedance spectroscopy of α-brass electrode in 0.5 M H2SO4 in presence of 10−3 M SG with 5 ppm CTAB at different immersion time. The electrochemical parameters derived from EIS spectra were listed in Table 3. As can be seen from Fig. 5, the EIS plots are similar to those obtained in different inhibitor concentration and the same behavior was observed at different immersion time. The diameter of the impedance spectra in presence of SG/CTAB decreased slowly as the immersion time increased. The decrease in the impedance diameter indicates that the layer formed at low immersion time exhibited significantly larger barrier properties compared to that formed at long immersion time. However, there was no obvious decrease in inhibition efficiency, indicating the potent inhibitive properties of SG/CTAB.
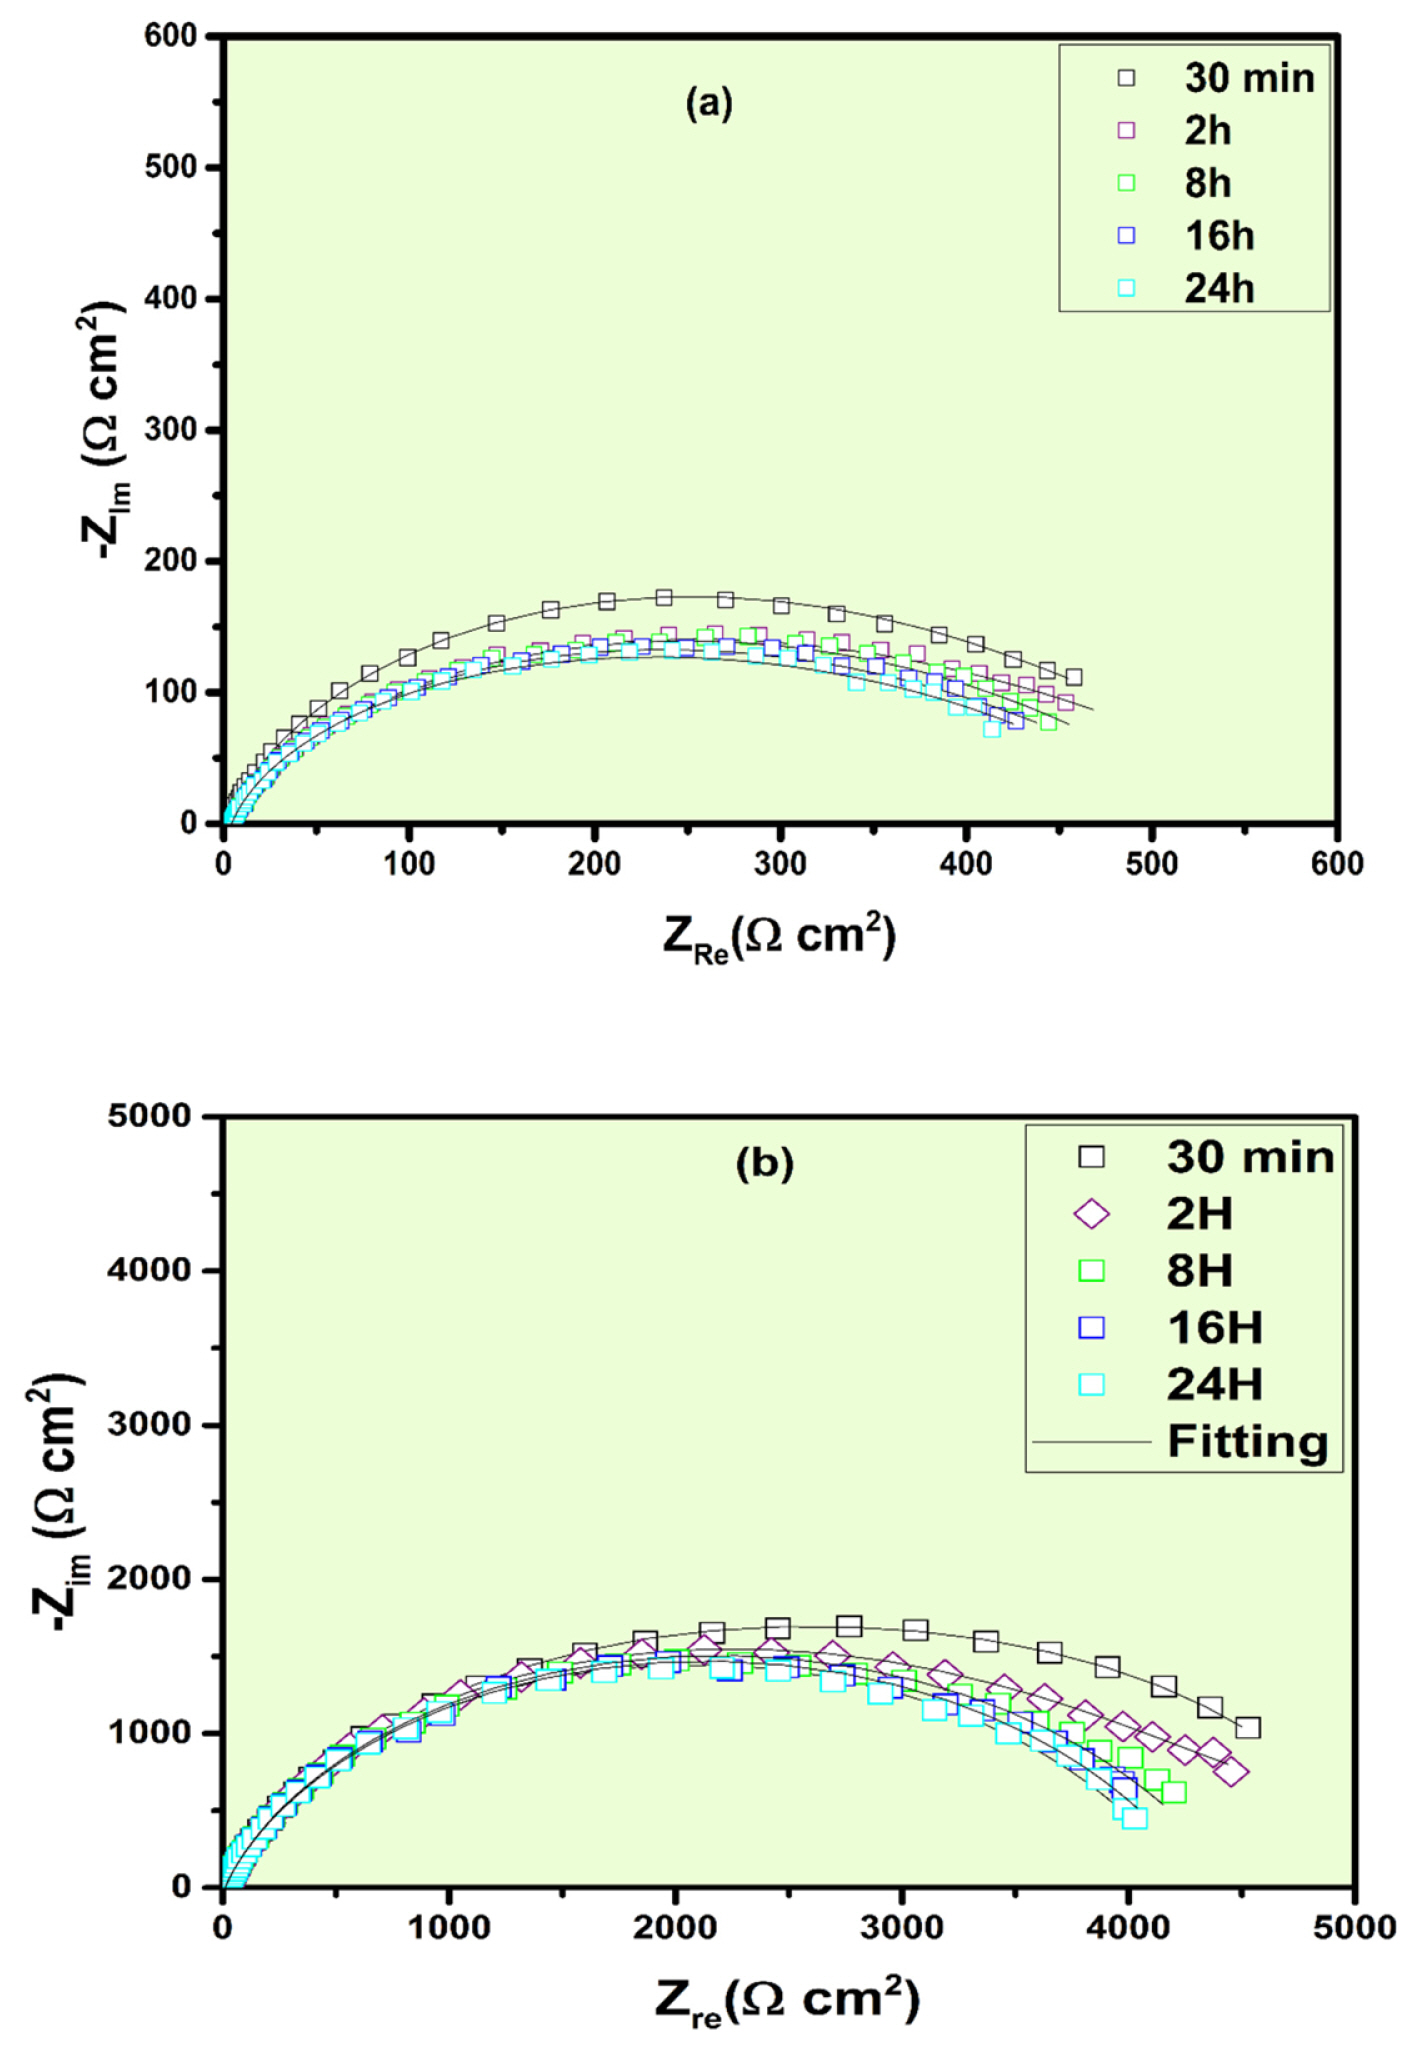
Nyquist diagrams of α-brass in 0.5 M H2SO4 in (a) absence and (b) presence of 10−3 M SG with 5ppm CTAB at different immersion time at 303K
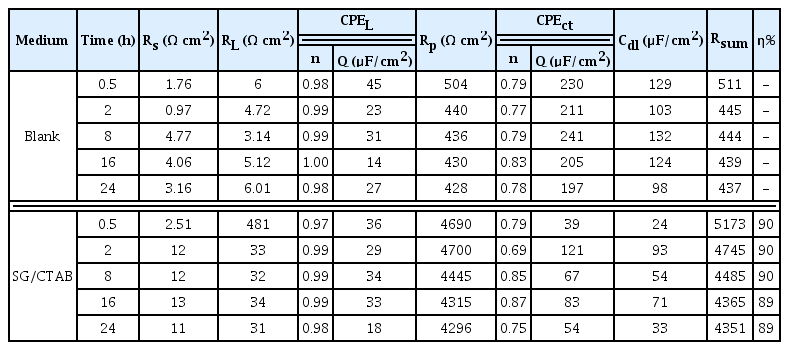
Impedance parameters recorded for α-brass electrode in 0.5 M H2SO4 solution in the absence and presence of 10−3 M SG with 5ppm CTAB at different immersion time
3.3. Temperature effect and Kinetic parameters
To study the effect of temperature on the metal-inhibitor interaction and mode of inhibition of the α-brass corrosion by the studied inhibitors, PDP measurements were carried out at different temperatures i.e. 303,313, 323 and 333 K without and with SG/CTAB (10−3 M SG with 5 ppm CTAB). The corresponding plots and the computed parameters are represented in Fig. 6 and Table 4, respectively. Results from Table revealed a slight decrease in the η(%) with corresponding increase in the corrosion current density (icorr) values, this observation can be attributable to the conclusion that inhibitor molecules got desorption, decomposition and/or rearrangement with the rise in the temperature[35]. However, an inhibitive performance of 70% can be considered a good inhibition efficiency at higher temperatures and mainly due to the presence of some chemical interactions between inhibitor molecules and α-brass surface.
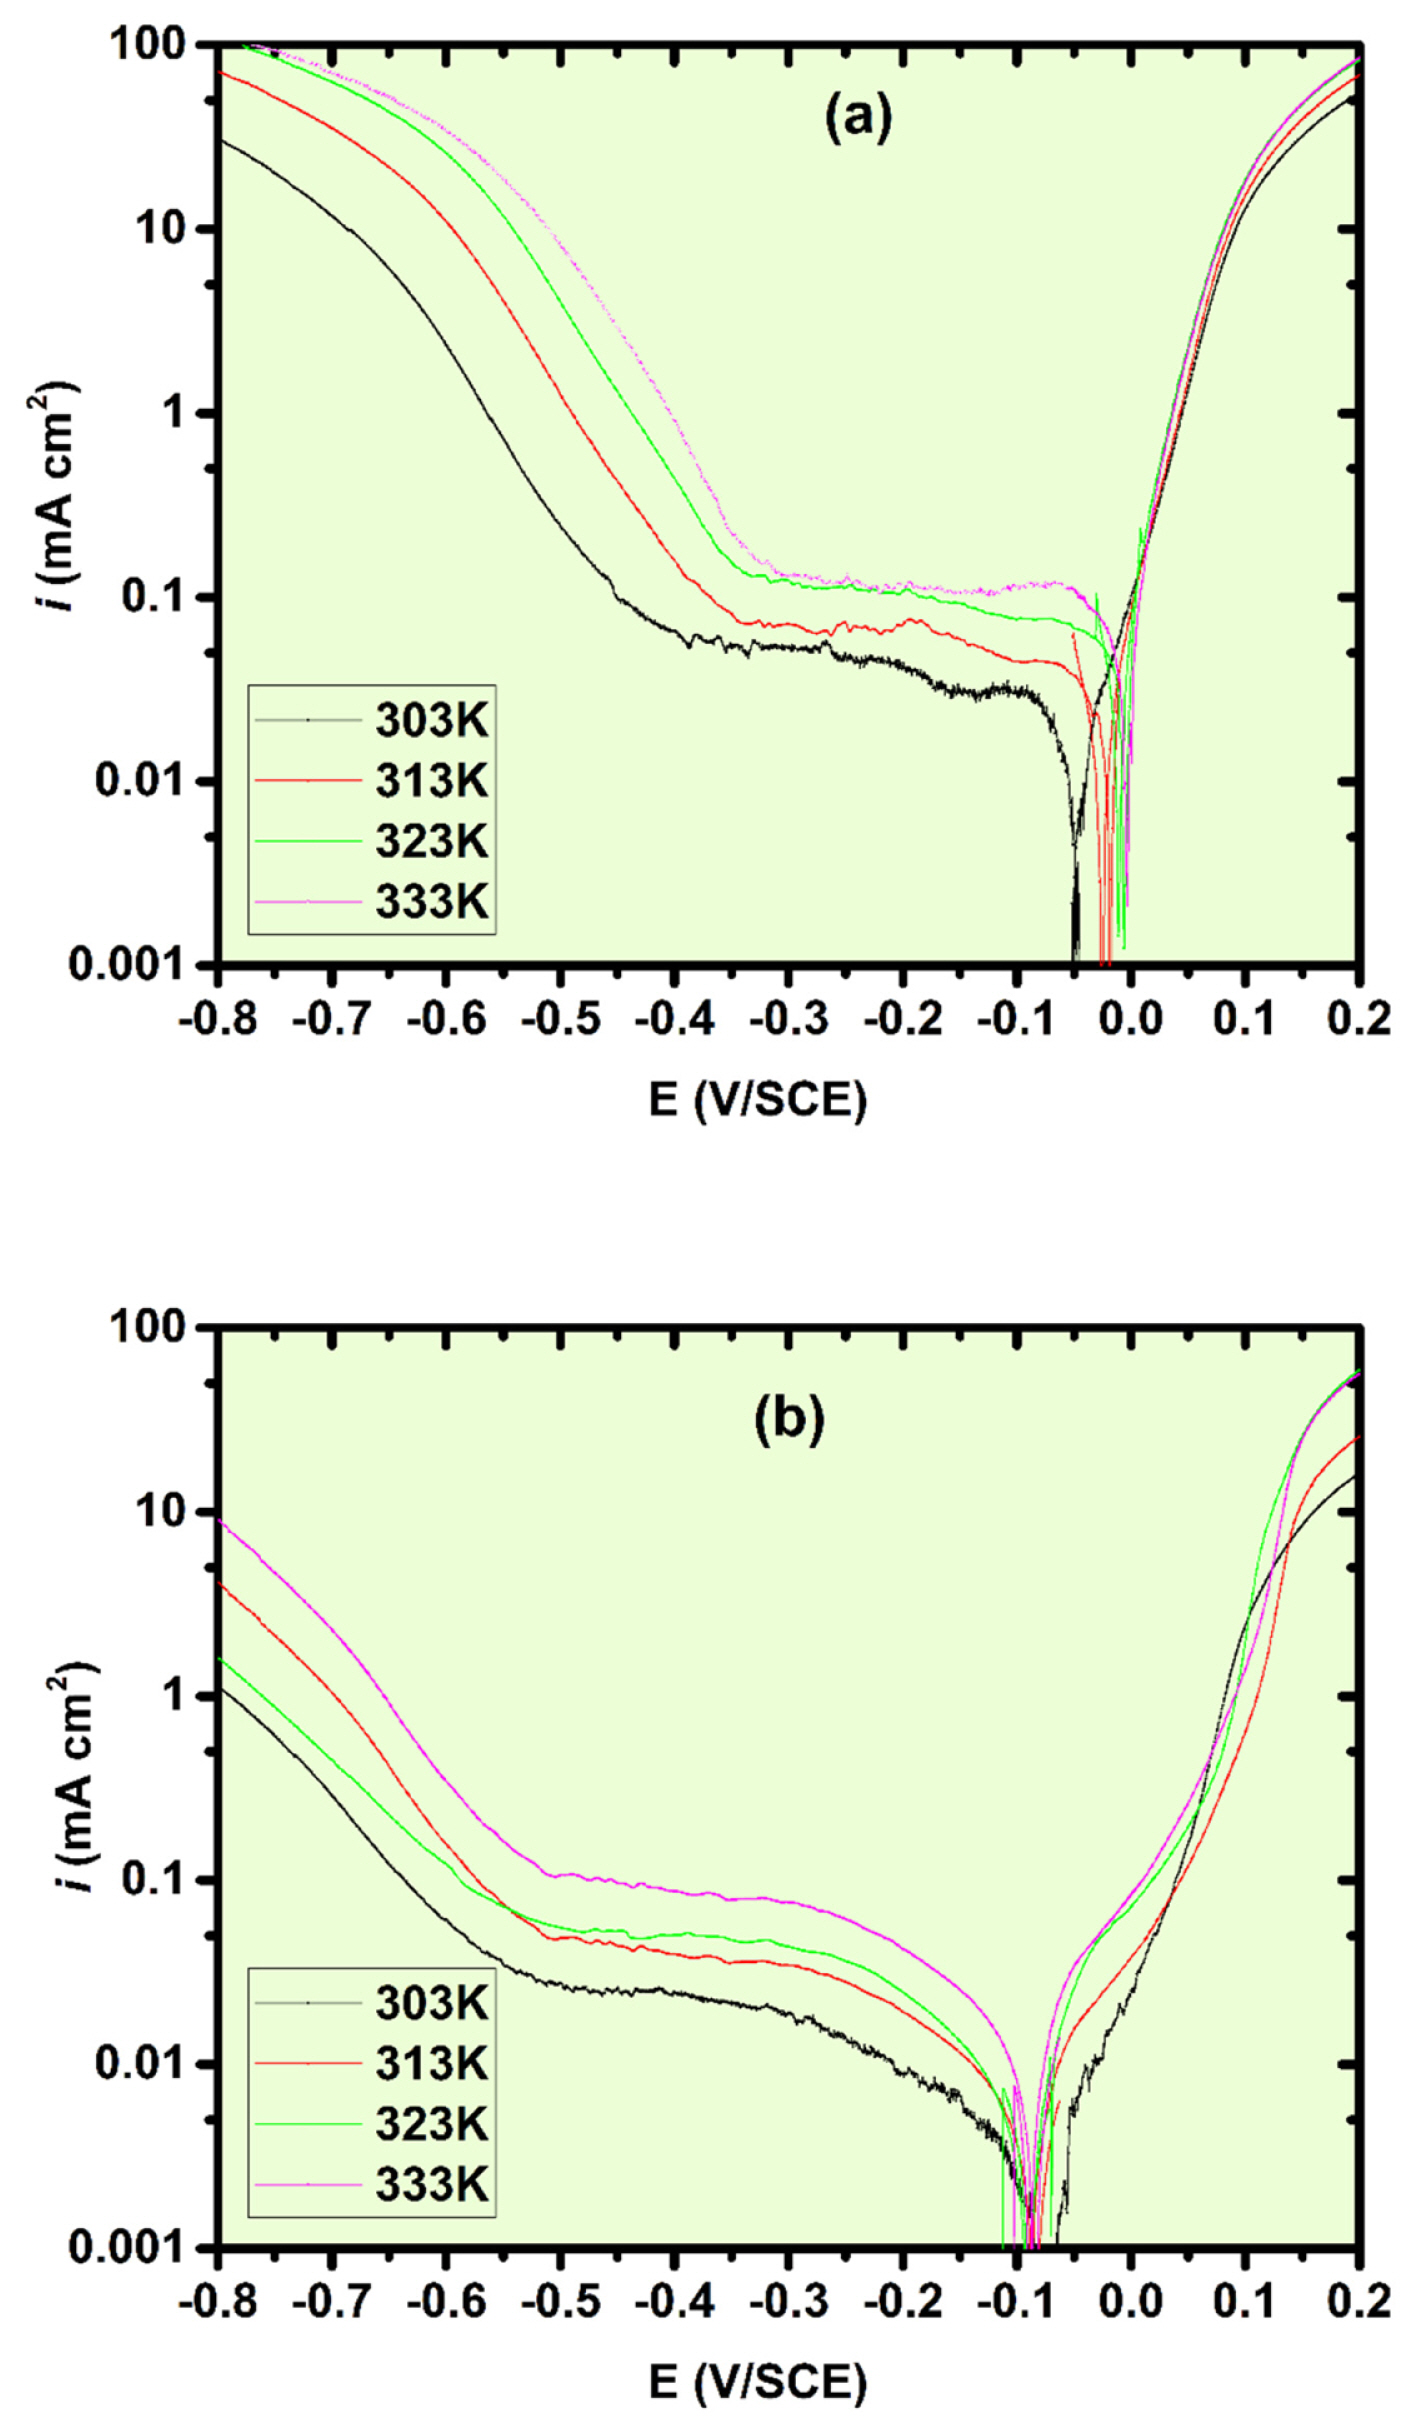
Potentiodynamic polarization curves of α-brass in 0.5 M H2SO4 at different temperatures: (a) blank and (b) 10−3 M SG with 5ppm CTAB
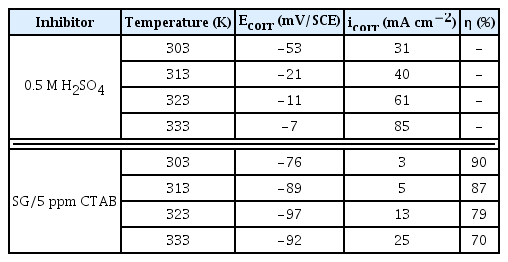
The PDP parameters for the corrosion of α-brass in 0.5 M H2SO4 in the absence and presence of 10−3 M SG with 5 ppm CTAB at different temperatures
The values of the activation energy (Ea) for the corrosion of α-brass in 0.5 M H2SO4 solution without or with inhibitors were calculated by employing the Arrhenius equation[36]:
Where R = the universal gas constant and k = the Arrhenius pre-exponential factor.
Fig. 7 illustrated a straight line obtained for the variation of the ln icorr versus 1/T for the inhibited and uninhibited α-brass specimens. The slope obtained from the straight line gives the apparent activation energy using the relation [37]:

(a) Arrhenius and (b) transition state plots for corrosion inhibition of α-brass in absence and presence of 10−3 M SG with 5ppm CTAB in 0.5 M H2SO4
The Ea obtained from the plot are listed in Table 5. It can easily be concluded from the data that the value of Ea is high in the presence of 10−3 M SG with 5 ppm CTAB as compared to that for the uninhibited solution, indicating the decreased corrosion of α-brass due to the formation of a barrier film by adsorbed SG and CTAB molecules.
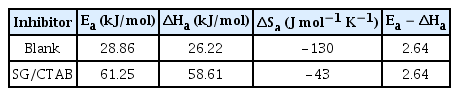
Corrosion kinetic parameters for α-brass in 0.5 M H2SO4 in the presence and absence of 10−3 M SG with 5 ppm CTAB at different temperatures
The activation parameters like enthalpy (ΔHa) and entropy of activation (ΔSa) were computed by employing Arrhenius’ transition equation [38]:
Where h is the Planck’s constant and N is the Avogadro’s number.
From the data, it can be concluded that the corrosion of α-brass reflects the endothermic nature in the presence of SG/CTAB and can be proven by the positive sign of ΔHa. The values of both ΔH and Ea follows the similar trends, which permit to verify the known thermodynamic equation between the Ea and ΔHa:
The close inspection of the data reveals that the formation of an activated complex in the rate-determining step is the association step, as the values of ΔSa are negative. This refers towards more ordering in the transformation from reactants to activated complexes due to desorption of water molecules from the α-brass specimen’s surface followed by the adsorption of SG/CTAB molecules [16].
3.4. SEM-EDS analysis
Surface morphological study of the α-brass surface retracted from immersion in 0.5 M H2SO4 without and with SG and CTAB alone and in combination after 12h are illustrated in Fig. 8. Without CTAB and SG, the α-brass specimen surface is attacked markedly by the aggressive solution and the surface showed very rough morphology with many cavities. Corrosion products and pits that spread over the surface of brass are due to the dezincification process, which initiates by selective dissolution of zinc and continues by a simultaneous dissolution of copper and zinc followed by re-deposition of copper. It is observed from the SEM image of corroded brass that there are some localized regions where the dezincification process is more pronounced. In contrast, the surface heterogeneity of the α-brass samples is decreased in the presence of SG and CTAB, this improvement in surface morphology is mainly due to the inhibition effect of inhibitors on brass surface. The surface smoothness of the α-brass specimens retrieved from SG/CTAB containing corrosive media is further improved suggesting its superior inhibition effect.
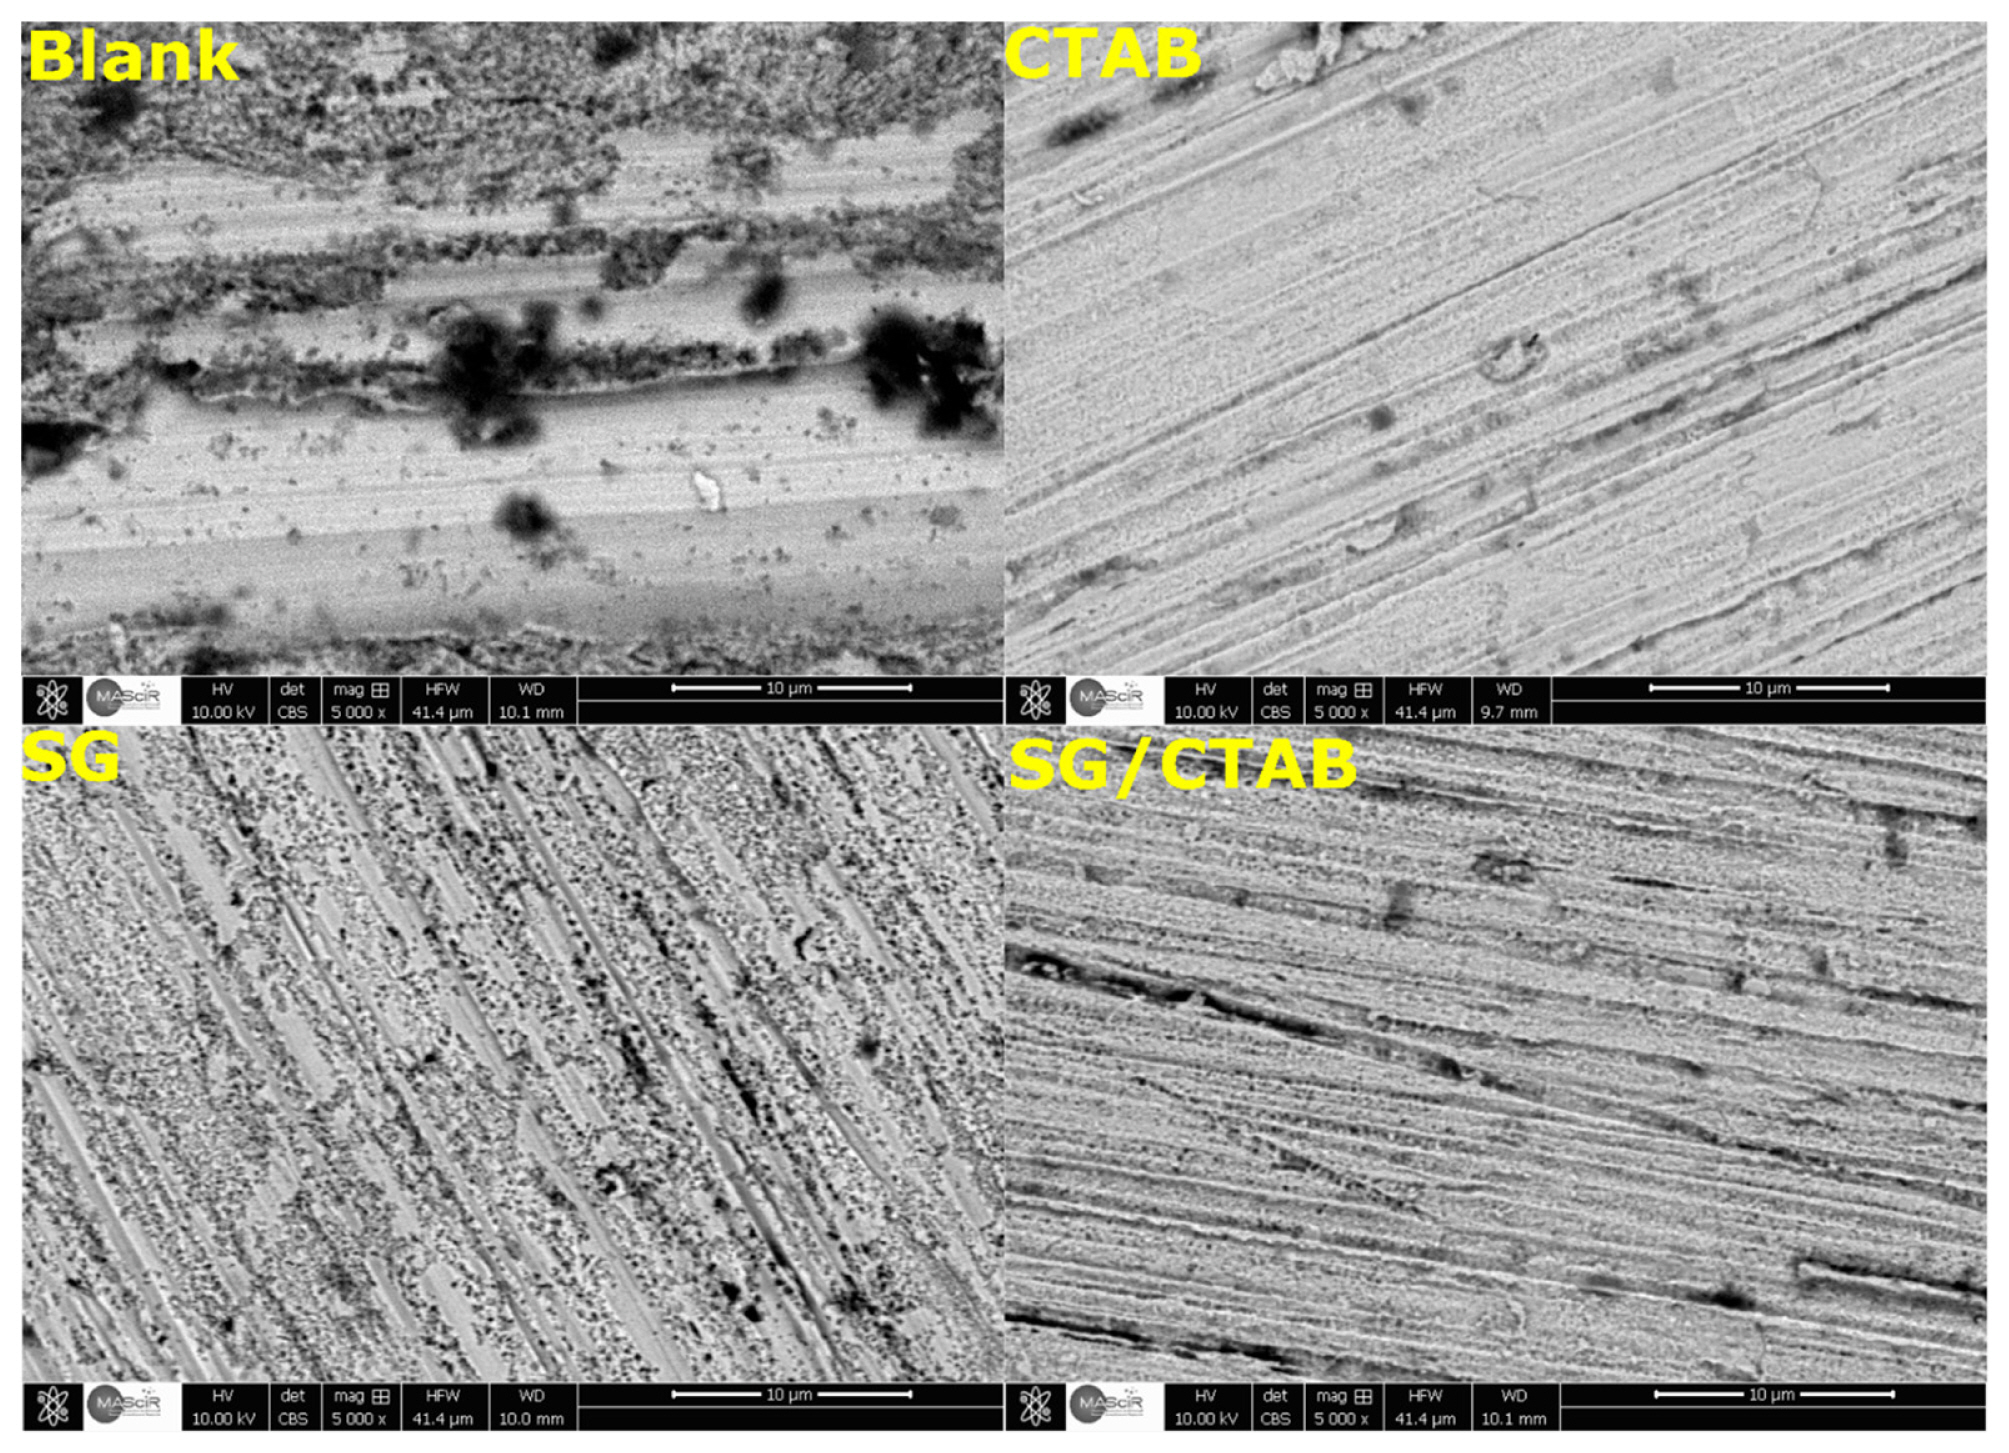
SEM images of α-brass: (a) exposed to 0.5 M H2SO4, (b), (c) and (d) exposed to 0.5 M H2SO4 with CTAB, SG, and 10−3 M SG/5ppm CTAB respectively, after 12 h of immersion time at 303 K
The elemental studies of the α-brass surface retracted from immersion in 0.5 M H2SO4 without and with SG and CTAB alone and in combination after 12h are illustrated in Fig. 9. The tabulated elemental analysis obtained by EDS (expressed in wt%) of the α-brass is depicted in Table 6. The EDS spectrum of the blank sample revealed the presence of O (7.08%) and S (6.78%) peaks in the respective EDS spectra. The presence of sulfur and oxygen in the blank sample is mainly resulted from corrosion products formed on the brass surface. Results indicate that the oxygen detected in SG/CTAB is higher than that observed in SG and CTAB samples. This result suggests the strong adsorption of SG on the brass surface and confirms the fact that the presence of CTAB attracts more SG molecules to brass surface thereby increasing the corrosion protection. The EDS spectra for the α-brass specimen retracted from the inhibited test solution revealed the presence of the C (18.69%, 20.77% and 18.01%) and N peaks (2.43% and 1.60%). The elevated carbon content is apparently due to an increase in inhibitors adsorption, especially through n-cetyl of CTAB and carbon sites of SG molecules [39]. There is also suppression in the Cu, Zn, and Si peaks when compared with the EDS spectrum of α-brass in absence of inhibitors, this is suggestive for the adsorption of the SG/CTAB molecules onto the α-brass surface, thus indicative of the successful prevention of the surface from the direct attack by the corrosive media.
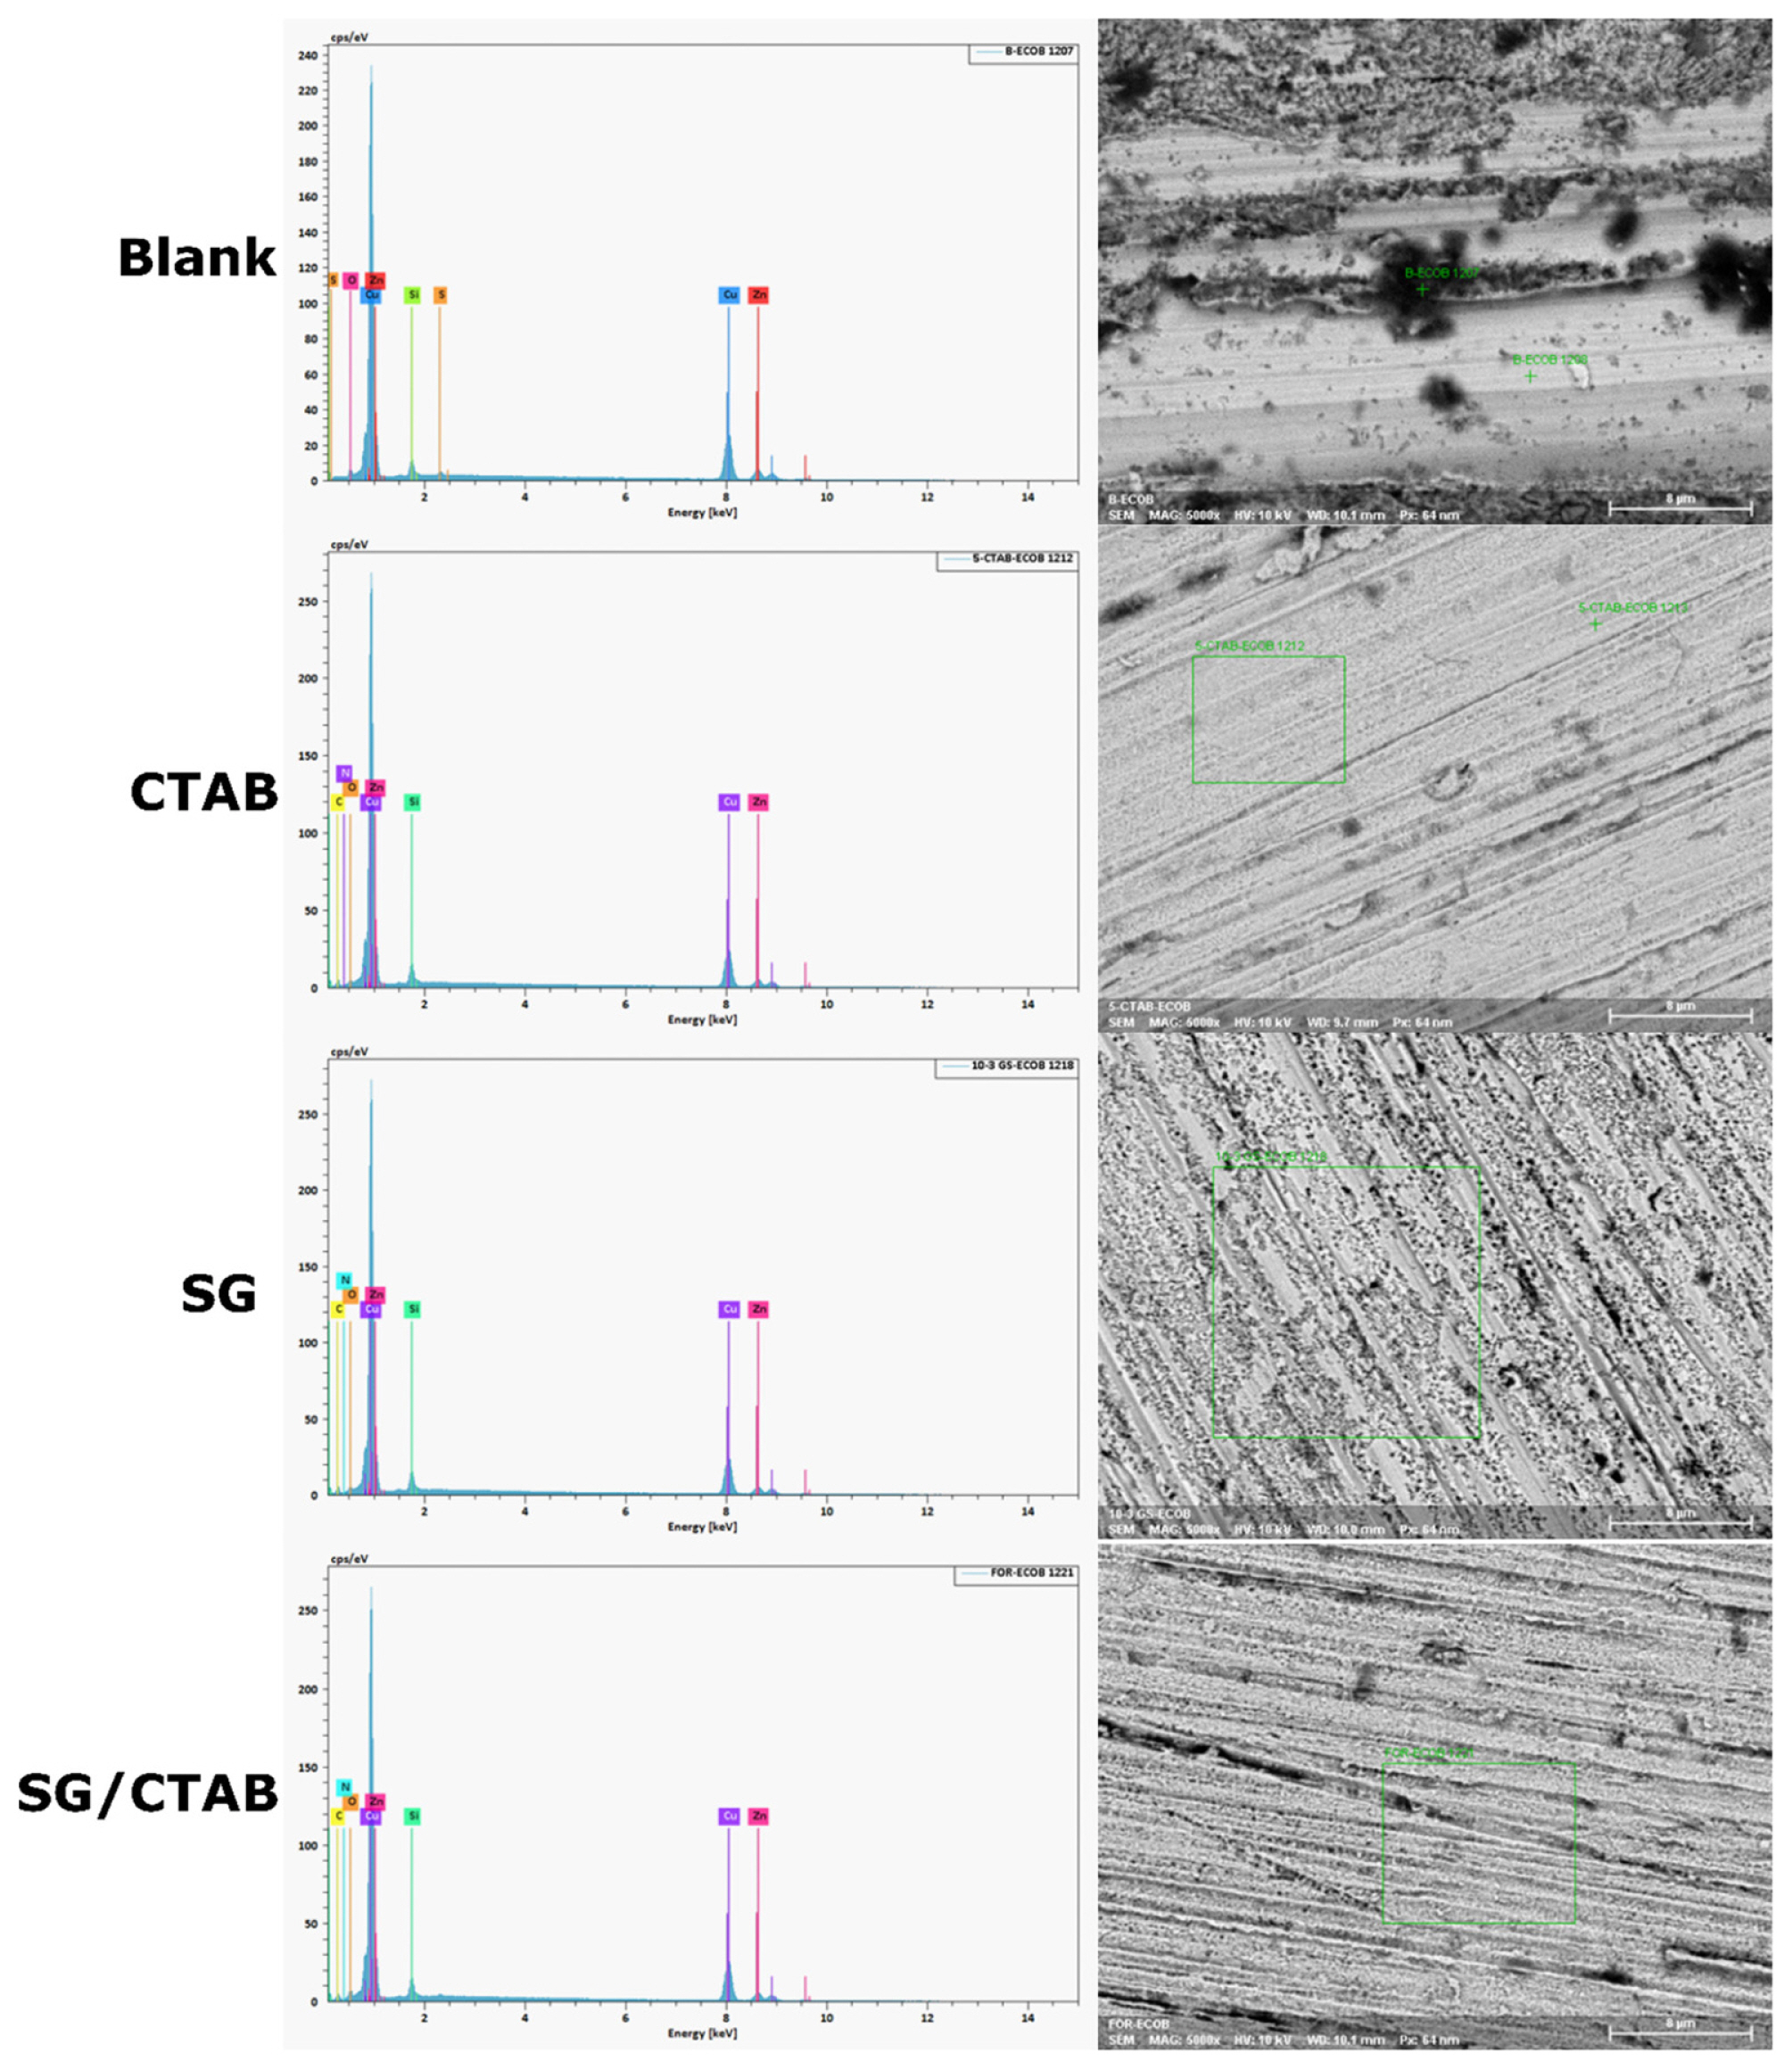
EDS analysis of α-brass sample derived from SEM tests
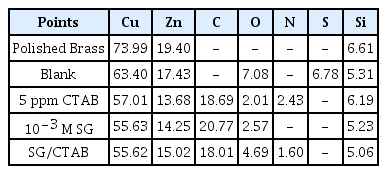
EDS analysis data (expressed in wt%) of the polished, blank and inhibited brass samples after 12 h of immersion.
3.5. Inductively Coupled Plasma Spectrometry (ICPS)
Inductively coupled plasma spectrometry is one of the conventional methods for determining the concentration of ions in solution. Better knowledge about the concentration of copper and zinc ions in blank and inhibited solutions might open new evidence about the effectiveness of tested compounds in controlling the α-brass dissolution. Fig. 10 represents the concentration of copper and zinc ions in 0.5 M H2SO4 alone and in the presence of CTAB, SG and SG/CTAB after 12h immersion at 303K. Examination of the results shows that in 0.5 M H2SO4 solution, the copper ions are predominant due to the higher percentage of copper in α-brass. After addition of CTAB, a considerable decrease in copper and zinc ions can be observed whereas the effect of SG was relatively small. Besides, by mixing both compounds, there is a drastic improvement in the control of ions release. A noticeable difference between different mediums is shown in Fig. 10, which may reflect the role of each inhibitor in the inhibition process. Previously, it was reported that brass surface exhibits positive charge in sulfuric acid solution. Thus, intermediates species like bromide ions could be strongly adsorbed on the brass surface. Therefore, the C16H33N(CH3)3 + can be electrostatically adsorbed on the alloy surface [39], which explains its higher inhibitive effect. However, this physical adsorption cannot provide a stable protection. In SG/CTAB medium, along with the electrostatic adsorption, the chemisorption of n-cetyl and SG on the alloy surface is also considered, from which there is better corrosion protection [39]. Once again, these results confirmed the crucial role of SG/CTAB in inhibiting the α-brass corrosion in H2SO4 solution, which was also observed in the electrochemical study.
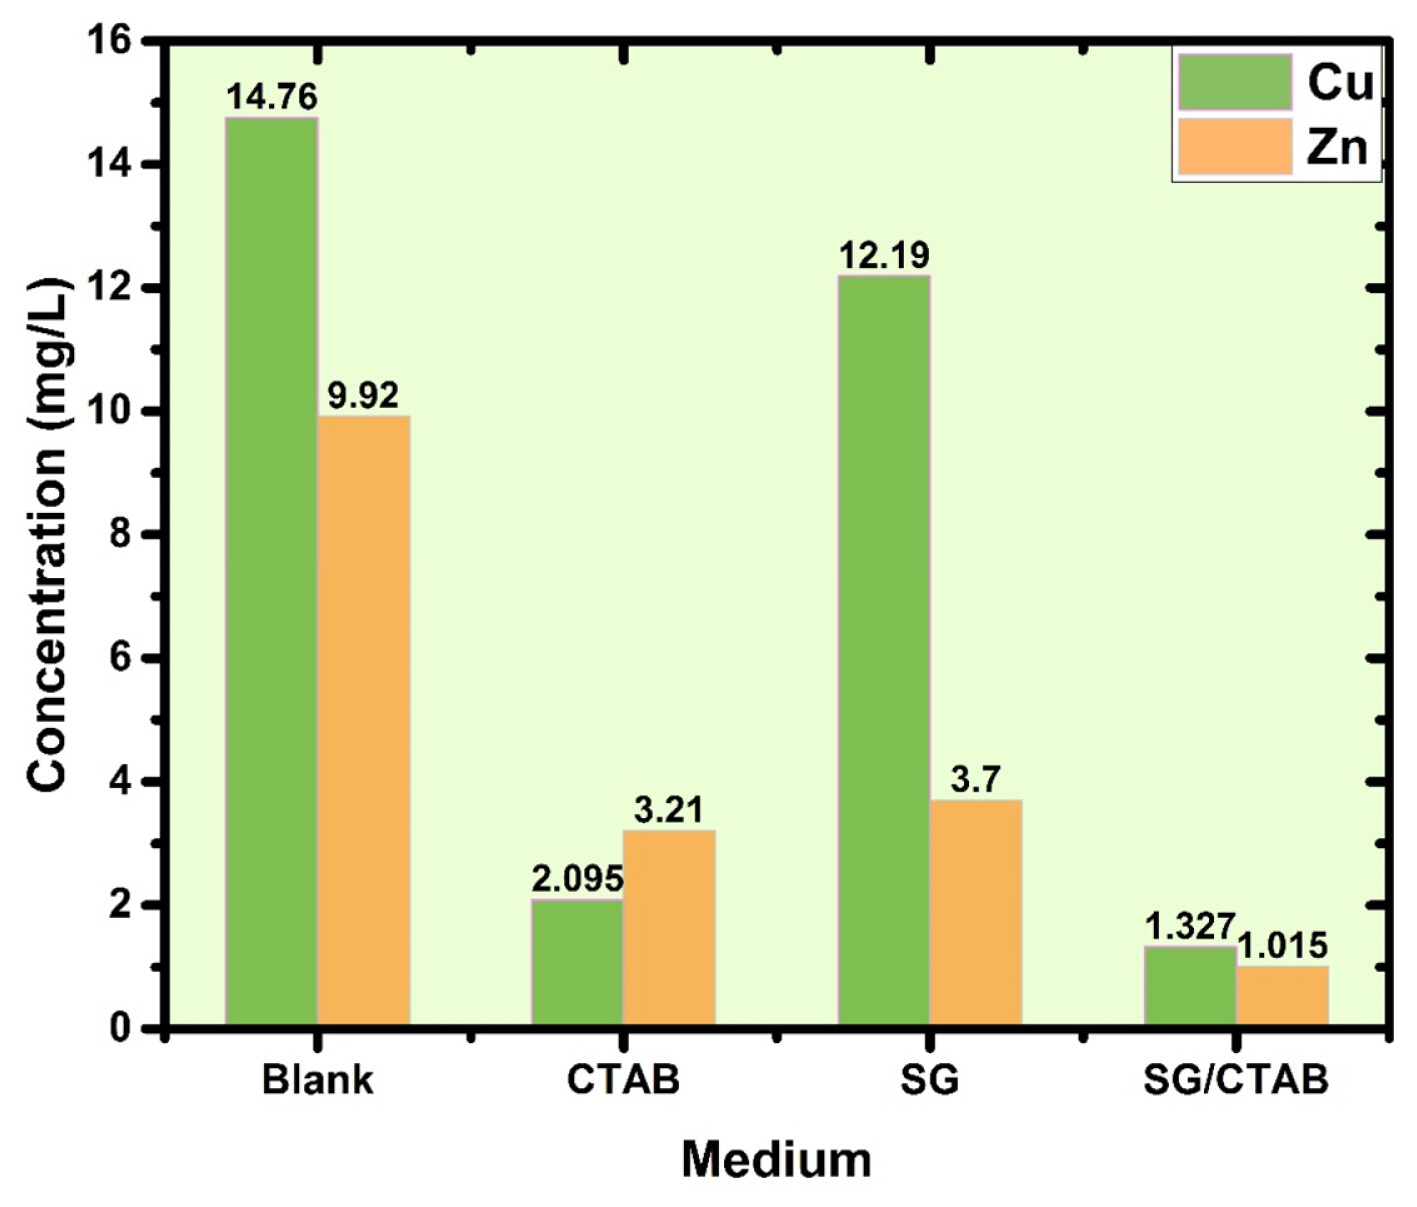
ICPS of α-brass immersed in 0.5 M H2SO4 and in presence of CTAB, SG and SG/CTAB after 12h immersion time at 303K
3.6. MD simulations
Computational methods like molecular dynamic simulation studies have helped researchers understand the structural features of inhibitor molecules and their interaction with metal surfaces [24,40]. During the present study, molecular dynamic simulations were used to gain a valuable information about the interaction of SG/CTAB on zinc and copper surfaces. Such simulations can be useful in understanding the adsorption profile of tested inhibitors on both surfaces at an atomic level, which is difficult to know from experimental findings. Figs. 11 and 12 show the initial and final adsorption configurations of inhibitors on Zn(111) and Cu(111) surfaces. All simulations were run until the systems reached equilibrium and both the energy and temperature reached balance [41,42]. It can be observed from the results in Fig.s 11 and 12 that both inhibitor molecules i.e. SG and CTAB are moved gradually toward metal surfaces, which explains their greater affinity toward zinc and copper surfaces. The outcome of the simulation system reveals that the SG adsorbed on both surfaces in a parallel manner and are near to the surface. Such situations can help to produce a strong inhibition effect and thereby increase the adsorption rate of tested inhibitors. As evidenced by experimental results, the proposed formulation can provide an effective protection of brass surface mainly through a synergistic effect.
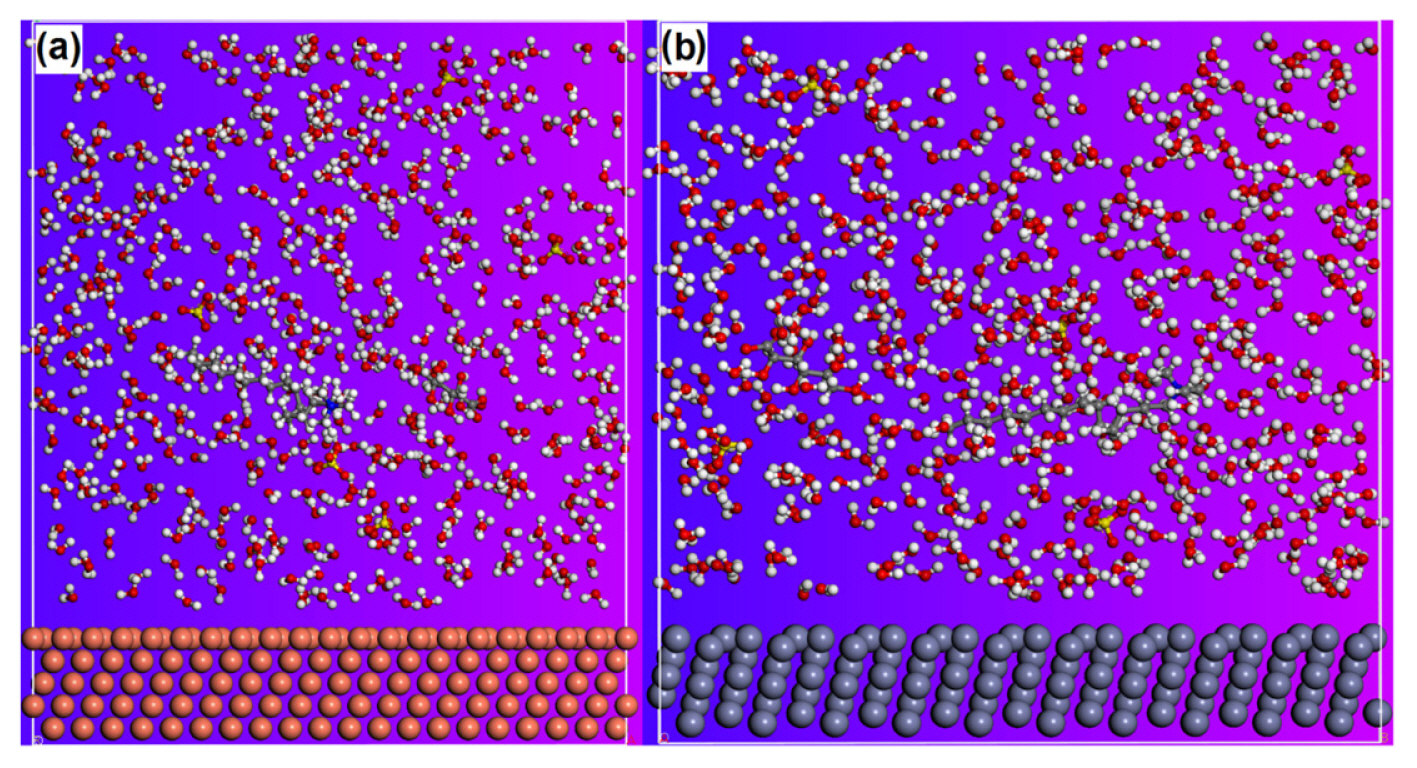
Side views of the initial adsorption of the CTAB and SG on the Cu(111) and Zn(111) surfaces in solution
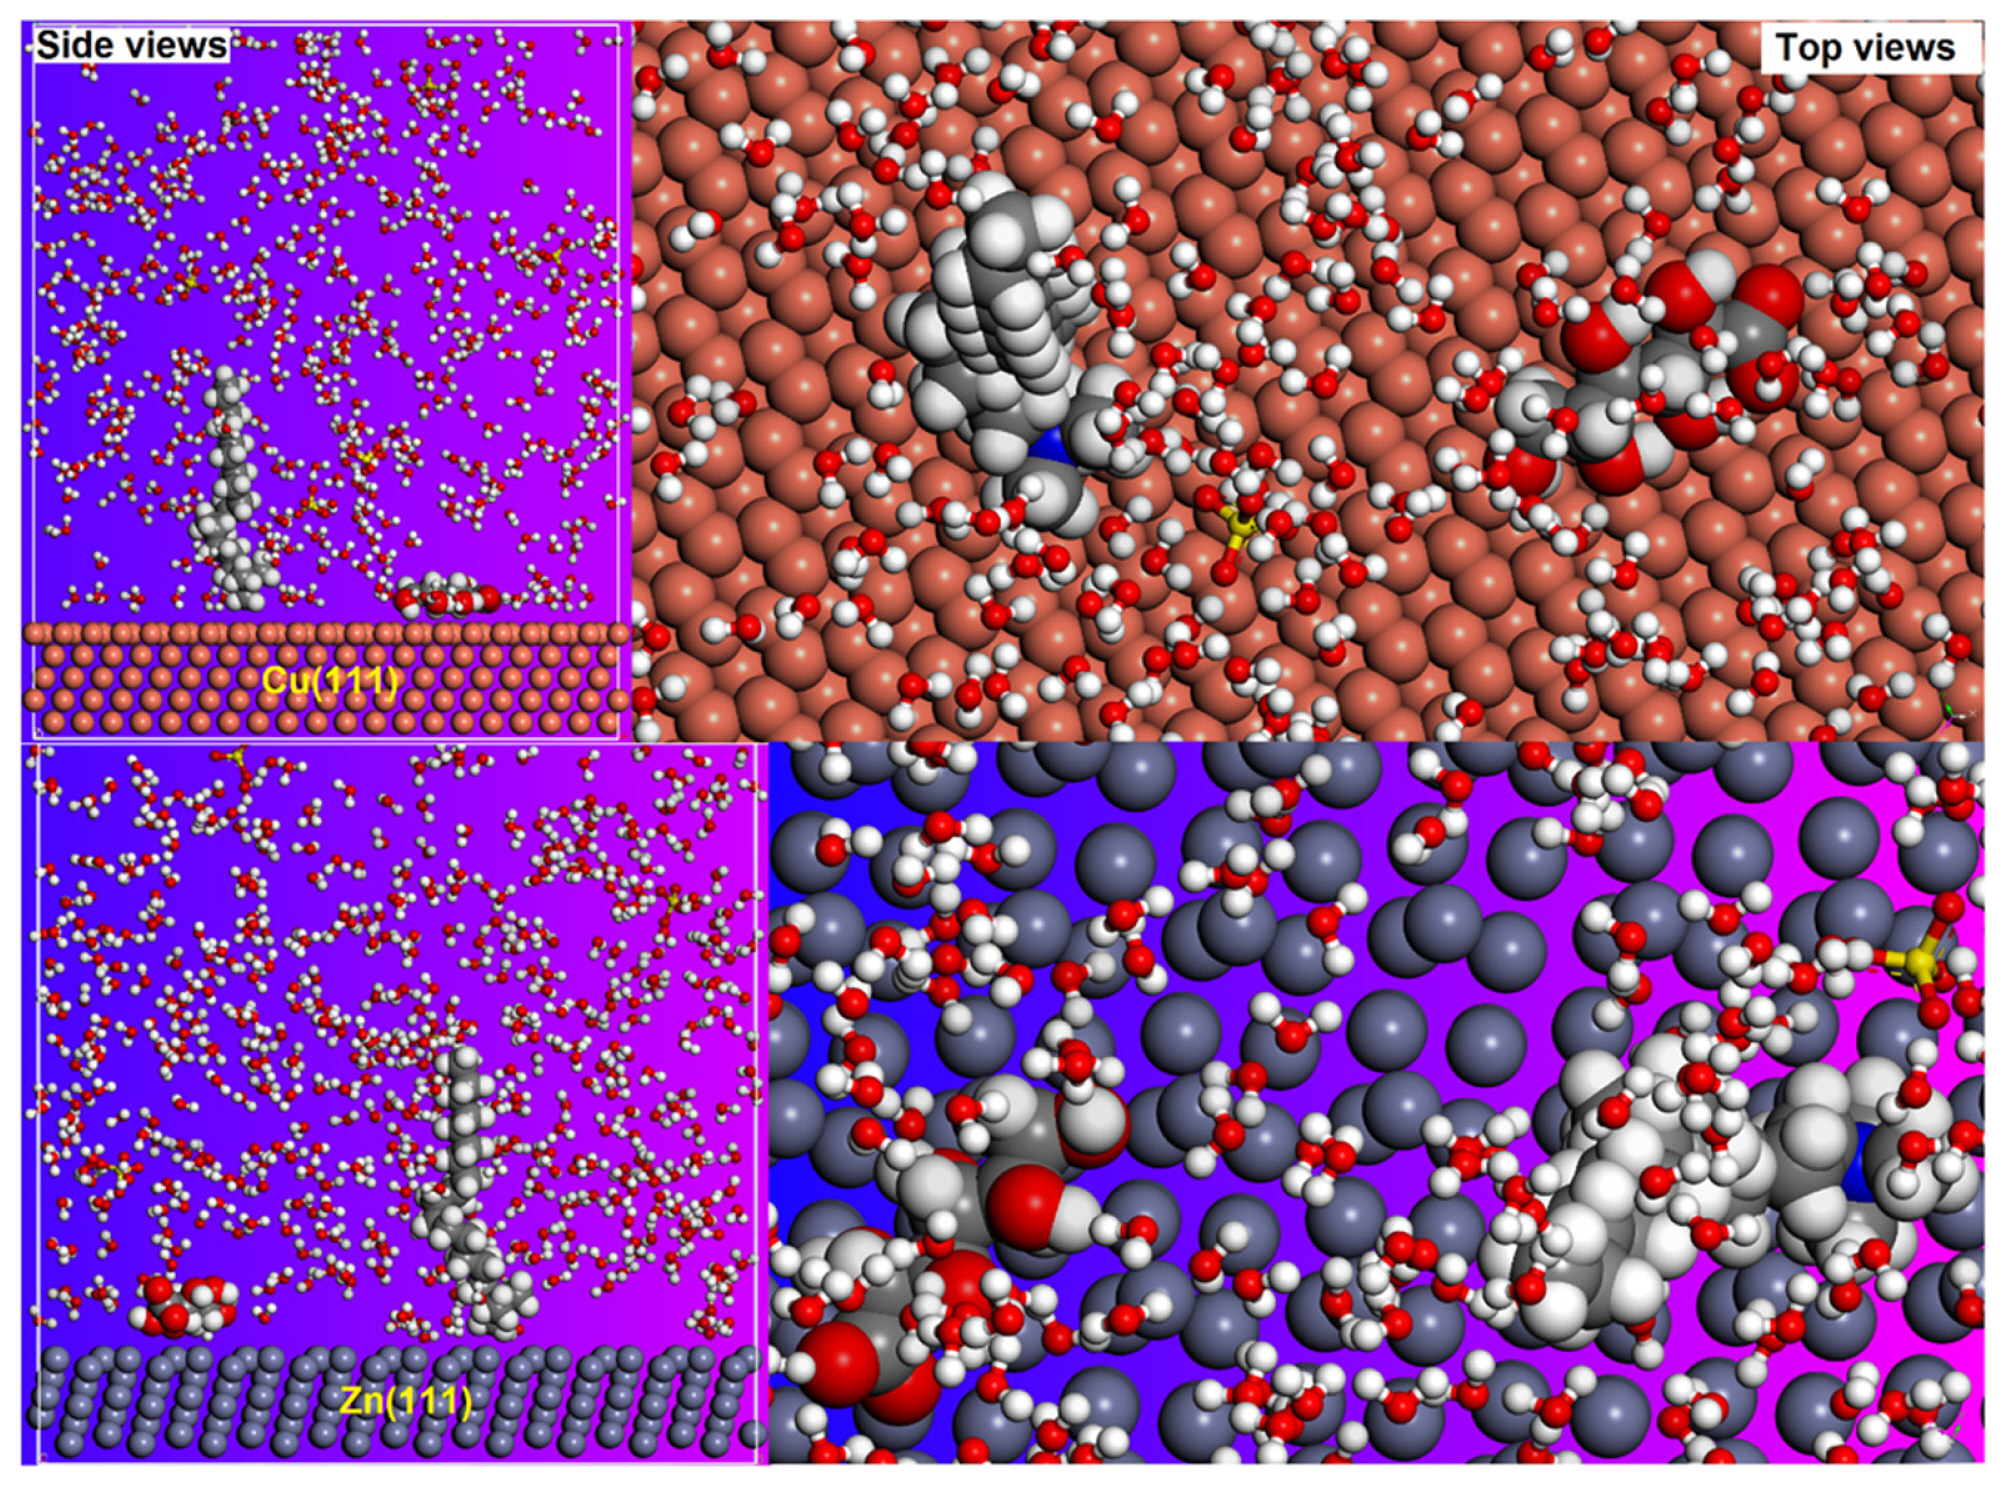
Side and top views of the final adsorption of the CTAB and SG on the Cu(111) and Zn(111) surfaces in solution
The binding (interaction) energies of inhibitor molecules obtained under equilibrium conditions for zinc and copper surfaces are 254 kJ/mol (−254 kJ/mol) and 248 kJ/mol (−248 kJ/mol) respectively. As it is clear in the energy results, the adsorption extent of compounds is almost the same in both systems, which suggests that tested compounds have roughly equivalent binding affinity to copper and zinc surfaces. It is observed from PDP and EIS results that the inhibition efficiency of SG is significantly increased due to the addition of CTAB in sulfuric acid solution. These results can be linked to MD results; both inhibitor molecules are adsorbed parallel to the zinc and copper surfaces and cover maximum surface area. The SG molecule has heteroatoms in its molecular skeleton, which can provide sufficient number of electrons to the vacant d-orbitals of copper and zinc. On the other hand, CTAB molecules could be electrostatically adsorbed on the zinc and copper surface through bromide ions as intermediates species [39]. In this way, a strong inhibition performance can be obtained, which is the case in this study. Though these parameters gave useful information about the extent of the adsorption of tested compounds. However, the trend of the extent of adsorption could not be successfully interpreted on the basis of only one inhibitor. Thus, such information will be helpful for further research efforts.
4. Conclusions
Sodium Gluconate (SG) and Cetyltrimethylammonium bromide (CTAB) have been proposed as corrosion inhibitors for α-brass in 0.5 M H2SO4. The results show that SG/CTAB can act as effective inhibitors and provide a significant improvement in corrosion resistance of α-brass. From the experimental and simulation results, the following conclusions and recommendations can be drawn:
- The electrochemical results illustrate that the SG/CTAB mainly behaves as cathodic type inhibitors; leading to a high increase of the corrosion resistance and lower corrosion current density.
- The results showed that an inhibitor layer was formed on the α-brass surface and it is a stable at different immersion time.
- SEM-EDS and ICPS studies confirm the presence of strong inhibitor-steel interactions and support the effective adsorption of inhibitors.
- Molecular dynamics simulations support the understanding of experimental findings and clearly suggest that SG and CTAB have almost equivalent binding affinity to copper and zinc surfaces.
Notes
Declarations of interest
The authors declare that they have no conflict of interest.