1. Introduction
One of the essential vitamins in the human diet is ascorbic acid (AA) and that is present in the mammalian brain along with various neurotransmitter amines [1]. Its utilization is in drinks and foods as an antioxidant to prevent and treatment of mental illness, common cold, infertility, cancer, and AIDS [2]. Dopamine (DA) is a prominent neurotransmitter, which its responsibility is in the function of the central nervous, renal, hormonal and cardiovascular system [3ŌĆō5]. Several serious neurological diseases such as ParkinsonŌĆÖs and schizophrenia are due to DA deficiency in the human body [6]. Another analyte that is the primary final purine metabolism product in the human body is Uric acid (UA). The abnormal amount of UA causes some of the diseases, such as Lesch-Nyhan syndrome and hyperuricemia, and gout [7]. A water-soluble vitamin folic acid (FA, N-[p-{[(2-amino-4-hydroxy-6-pteridinyl) methyl] amino} benzoyl]-l-glutamic acid, Vitamin M) is synthesized in nature by plants (green leaves, algae) and microorganisms (yeast, bacteria). FA determination in the food, pharmaceutical, and clinical samples has received much attention because newborns neural tube defects and diseases like megaloblastic anemia, cancer, AlzheimerŌĆÖs are due to fail of that. FA participates in the synthesis of nucleotide, cell division, gene expression, and gene expression with vitamin B12 [8,9]. The AA, DA, UA, and FA levels have intercommunication with the human physiological function. Deficiency or maladjustment in their levels may lead to many diseases. Therefore, simultaneous determination of AA, DA, UA, and FA has great importance in diagnoses, and controlling mentioned diseases.
A range of analytical techniques such as chromatography [10], spectrophotometry [11], chemiluminescence [12], capillary electrophoresis [13], FTIR and Raman spectrometry [14] and flow injection analysis using various methods of detection [15,16] are reported in the literature for detection of these biological molecules. All these methods have disadvantages, for example long analysis times, high costs, the requirement for sample pretreatment and compressing system, temperature control systems, separation systems and other spectrophotometric or electric detection systems and in some cases low sensitivity and selectivity [17,18]. In comparison, the advantages of electrochemical methods are low cost, high sensitivity and short measurement time. However, one major problem is that the oxidation peaks of these electro active species are too close at an unmodified electrode, which results in overlapping voltammetric response and making their simultaneous detection highly difficult [19]. To overcome this problem, it is necessary to modifying the electrode. In most cases, this modification increases the sensitivity, selectivity and reproducibility compared to conventional electrodes. A number of modified electrodes have been utilized for the simultaneous detection of these molecules such as Ni NPs@Poly1,5-DAN/GCE [20], Ag-PPy/GCE [21], and AuNCs/ AGR/MWCNT/GCE [22].
Numerous of this nanomaterials modified electrodes are ideal candidates to tackle the challenge of bioanalytical problems owing to their unique mechanical, physical and chemical properties.
A kind of crucial carbon material, namely graphene with a flat monolayer of carbon atoms in a hexagonal lattice had attracted innumerable attention since it was first reported in 2004 [23]. One of the graphene usages is the sensitive determination of various drugs molecules, due to their excellent conductivity because of ŽĆ-ŽĆ stacking and synergetic effects with other materials [24,25].
Polypyrrole (PPy) is one of the most important conducting polymers and can be considered as a promising material with several characteristics, such as relative good conductivity, easy synthesis, large surface area, and low cost. Studies have also been conducted on the biosensor applications of PPy [26].
It should mention that, for nanofilling of polymer matrices, graphene sheets can be used and so high electrical conductivity, excellent mechanical strength, high chemical stability, and high surface area achieved [27].
Transition metals like copper, zinc, nickel, silver and cobalt and their oxides have been used in the sensors, solar cells, catalysis, and the photocatalyst. Two of them are Zinc oxide (ZnO), (an n-type metal oxide semiconductor, 3.37 eV band gap), and Copper oxide (CuO) (a p-type semiconductor, 1.2 eV band gap) [28,29].
Actually, the concept of using p- and n-type semiconductors as well as their mixtures to improve sensor performance has been reported [30ŌĆō32]. It has been suggested that alloying CuxO into ZnO can help form the p-n junction that leads to electron transfer became easier [33]. Metal nanoparticles (MNPs) can be incorporated into conductive polymers that cause to improve electrocatalytic properties and system conductivities [34,35].
In this article, fast and simple preparation of a glassy carbon electrode modified with CuxO-ZnO/ PPy/RGO nanocomposites was reported and the electrocatalytic oxidations of AA, DA, UA, and FA were studied. Amazing results were achieved for simultaneous electrocatalytic detection of AA, DA, UA, and FA within a long linear range and low detection limit.
2. Experimental
2.1 Chemicals and instrumentation
AA, DA, UA, and FA were purchased from Sigma-Aldrich. Pyrrole, acetic acid, zinc nitrate, copper nitrate, and sodium hydroxide were obtained from Merck. All other chemicals were of analytical grade and used as received. Pyrrole was distilled under vacuum and stored froze. Phosphate buffer solution (PBS, 0.1 M, pH 7.0) was employed as a supporting electrolyte. All the solution prepared by double distilled water.
The surface morphological characterization of CuxO-ZnO/PPy/RGO/GCE was examined by means of field emission scanning electron microscopy (FE-SEM) (MIRA3, TESCANZ, Czech Republic) at an accelerating voltage of 20 kV, Raman spectra were recorded on a Thermo Nicolet Dispersive Raman Spectrometer, with a 532 nm Laser beam at 30 mW and a charge coupled device detector with a 4 cmŌłÆ1 resolution. The spectra were accumulated three times for 30 s each. Electrochemical impedance spectroscopy (EIS) was performed by Zahnner PP201, Germany that was a 4-quadrant power potentiostat designed to apply and sink high currents up to ┬▒20 A at a voltage range of ┬▒10V. The total power dissipation of the PP201 was 200W. An electrochemical system analyzer (Sama Instruments, Iran) performed electrochemical measurements. A conventional three-electrode system was used, containing an Ag/ AgCl/saturated KCl as a reference electrode, a Pt wire as a counter electrode, and a bare or modified glassy carbon electrode (GCE) as working electrode.
2.2 Preparation of the modified electrodes
The preconditioning of a bare GCE was done in this way, polishing successively with 0.05 ╬╝m alumina slurry on a synthetic cloth, rinsed with pure water, and sonicated subsequently in a 1:1 double distilled water and ethanol for 5 min. Graphene oxide (GO) was synthesized directly from graphite by Hummers method [36,37]. In this paper, CuxO-ZnO/ PPy/RGO nanocomposites were synthesized according to our previous works [26]. The procedure was briefly described as follows: The GO was deposited and reduced simultaneously on the GCE by applying a constant potential of ŌłÆ2.0 V vs. Ag/AgCl for 100 s. After that, PPy nanofibers were electrosynthesized on RGO/GCE potentiostatically by applying a constant potential 0.8 V vs. Ag/AgCl for 150 s. Then, electrodeposition of ZnO nanosheets was carried out potentiostatically = (ŌłÆ0.7 V for 20 min). Finally, the CuxO nanoparticles were electrochemically deposited on the ZnO/PPy/RGO/GCE surface by applying a constant potential of ŌłÆ0.6 V for 420 s. All of these procedures are depicted pictorially in scheme 1.
2.3 Method validation and optimization
All experimental parameters that may affect determination process including buffer pH, scan rate, electrodeposit ion time of RGO, ZnO, CuO, and electrosynthesis time of PPy were optimized for sensor preparation to obtain the best potential peaks separation and highest currents of all four species. The results are shown in the supplementary information (Figures S1ŌĆōS4). The method was validated according to ICH guidelines [38] including linearity, specificity, accuracy and precision.
3. Results and Discussion
3.1 Characterization of the CuxO-ZnO/PPy/RGO/GCE
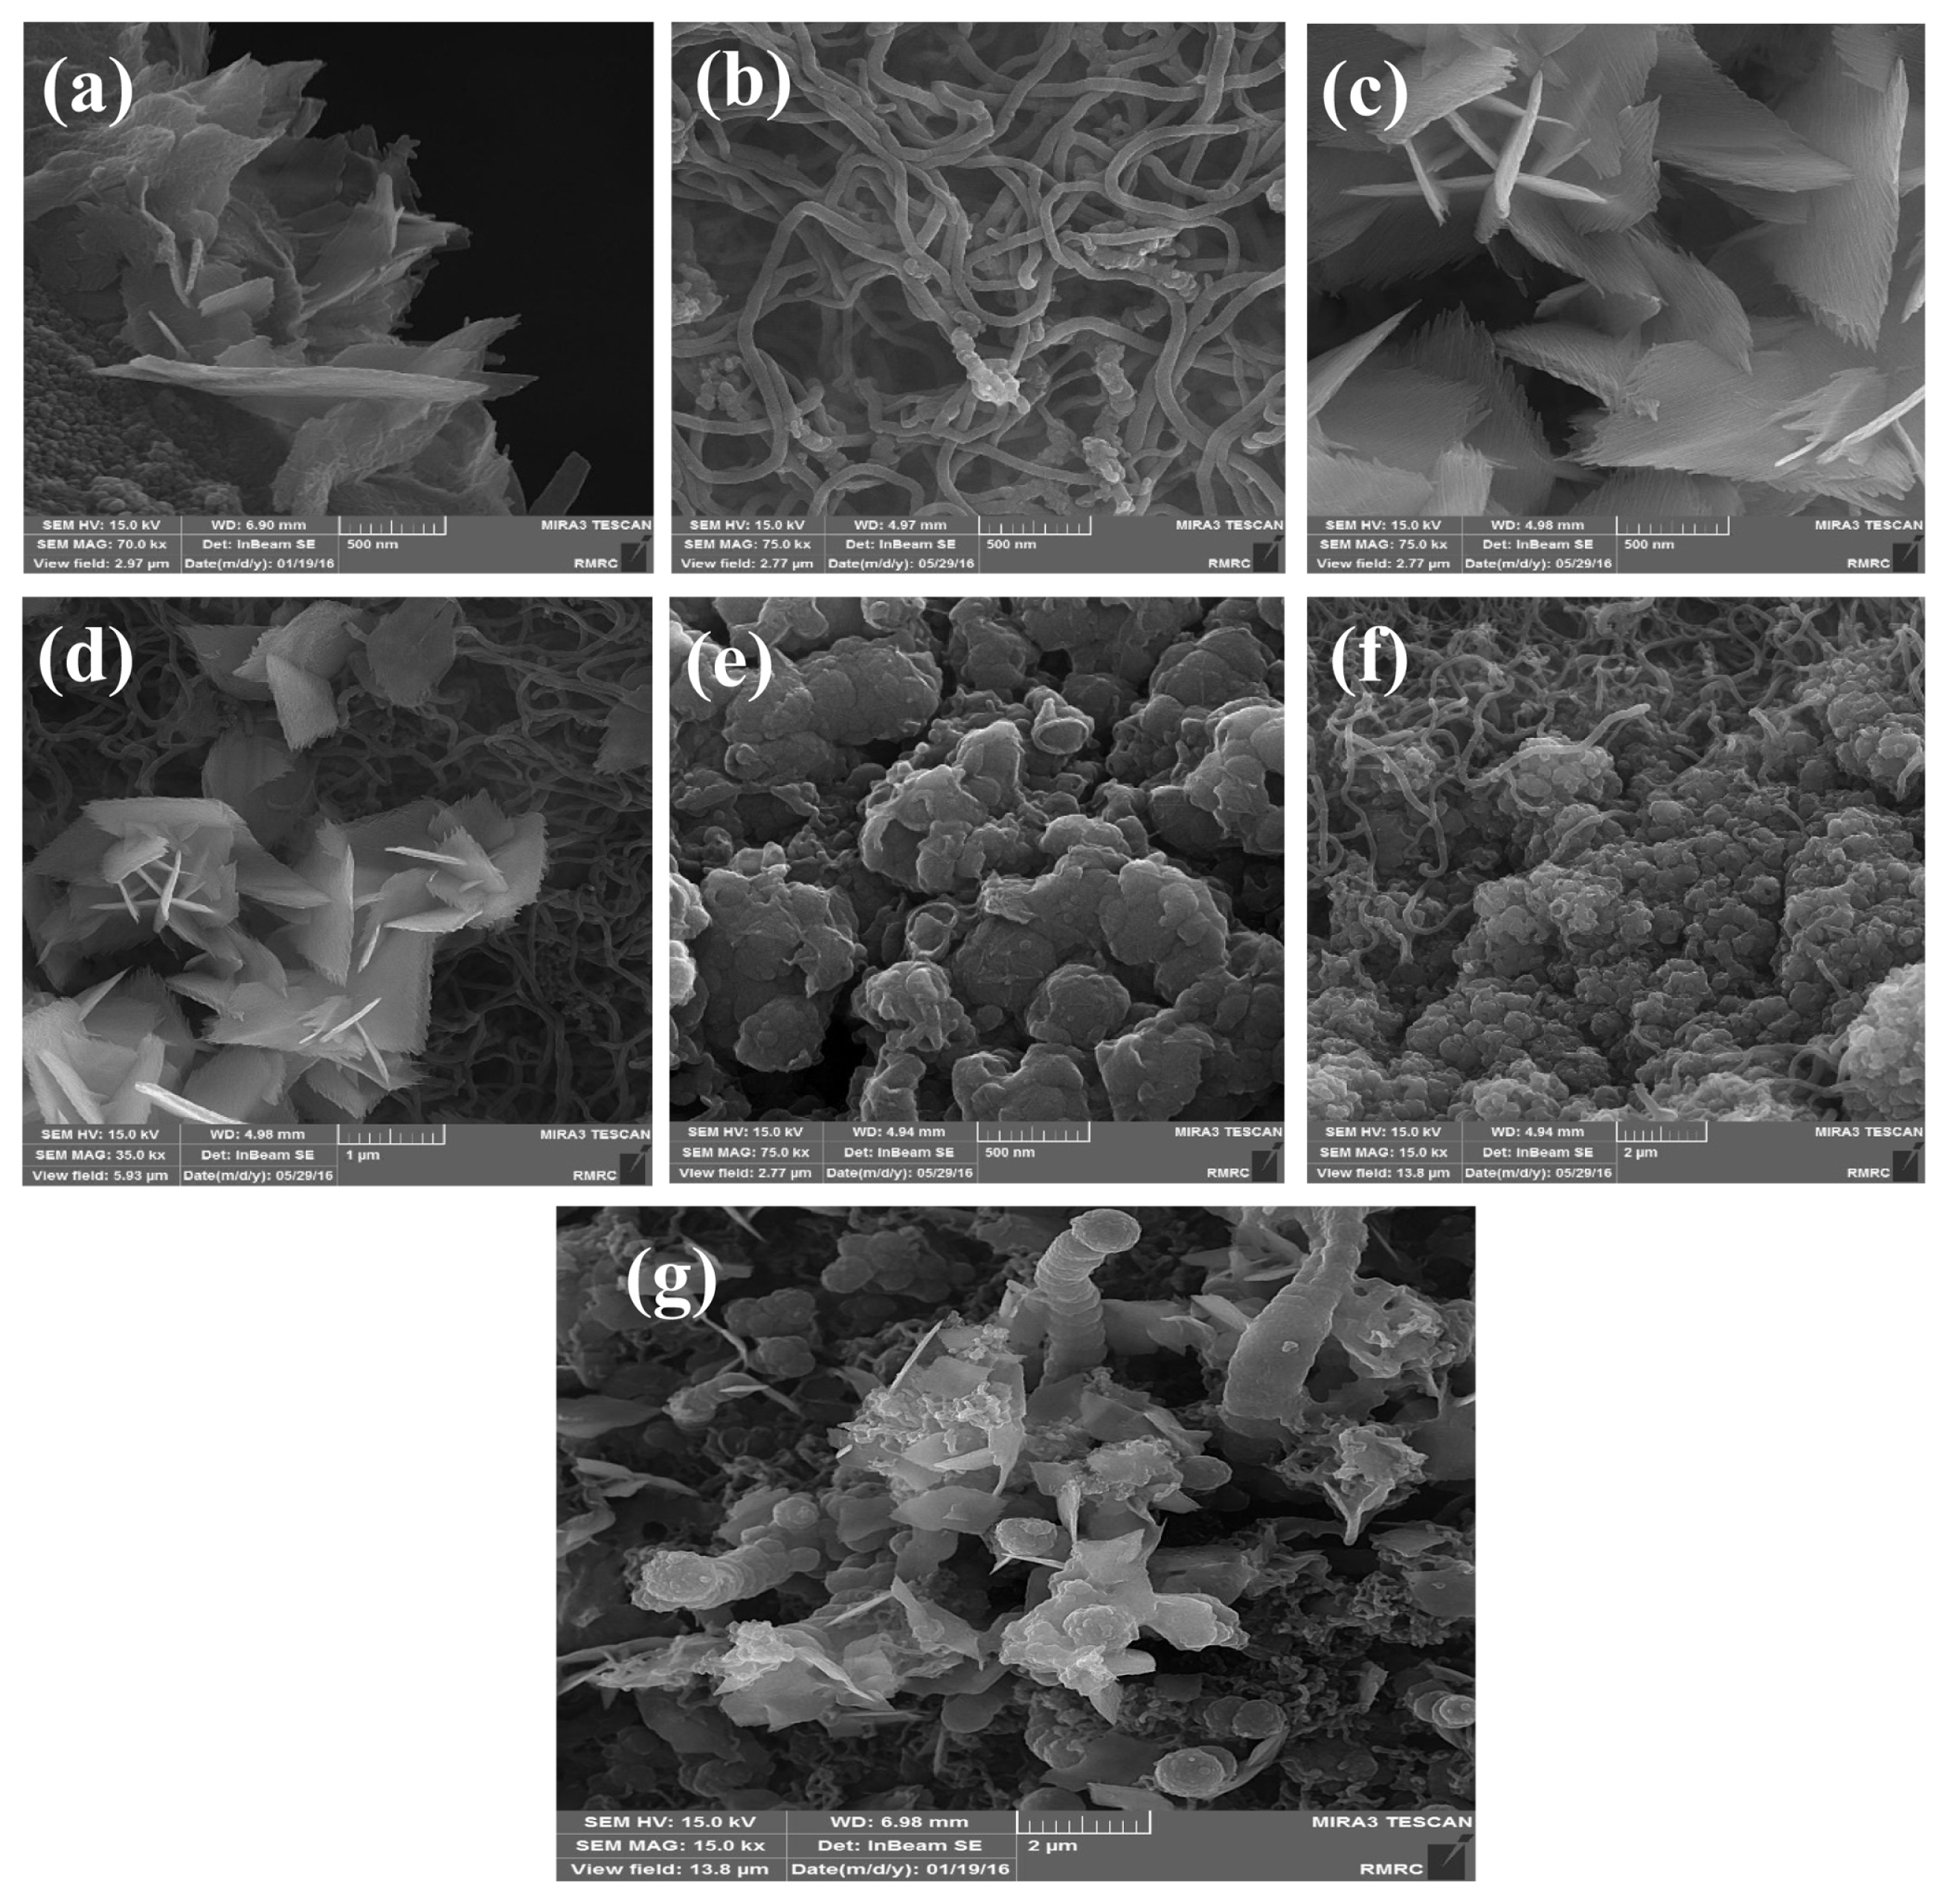
Fig. 1 shows a comparison of the morphology of RGO/GCE, PPy/GCE, ZnO/RGO/GCE, ZnO/PPy/ RGO/GCE, CuxO/RGO/GCE CuxO/PPy/RGO/GCE, and CuxO-ZnO/PPy/RGO/GCE by FE-SEM. As you see in Fig. 1a RGO sheets possess many wrinkles on their surfaces and edges, which provide them with large specific surface area. In Fig. 1b PPy nanofibers film have a very large surface to volume ratio due to a well-ordered polymer chain structure, which is useful for the incorporation of nanoparticles and transport of electrical carriers along one controllable direction. Fig. 1c and d show ZnO/RGO/GCE and ZnO/PPy/RGO/GCE, respectively. As you see, the ZnO have nanosheets shape with a very low thickness of a few nanometers. Fig. 1e and f show CuxO / RGO/GCE and CuxO /PPy/RGO/GCE, respectively. In these pictures, you see CuxO nanoparticles with globular shapes and small sizes. Finally, in Fig. 1g, showed spherical flower-like microsphere morphology, with the globular 3D structure of the CuxO and nanostructures of ZnO. As you see, the ZnO nanosheets and CuxO nanoparticles evenly distributed on the polypyrrole nanofibers and graphene sheets.
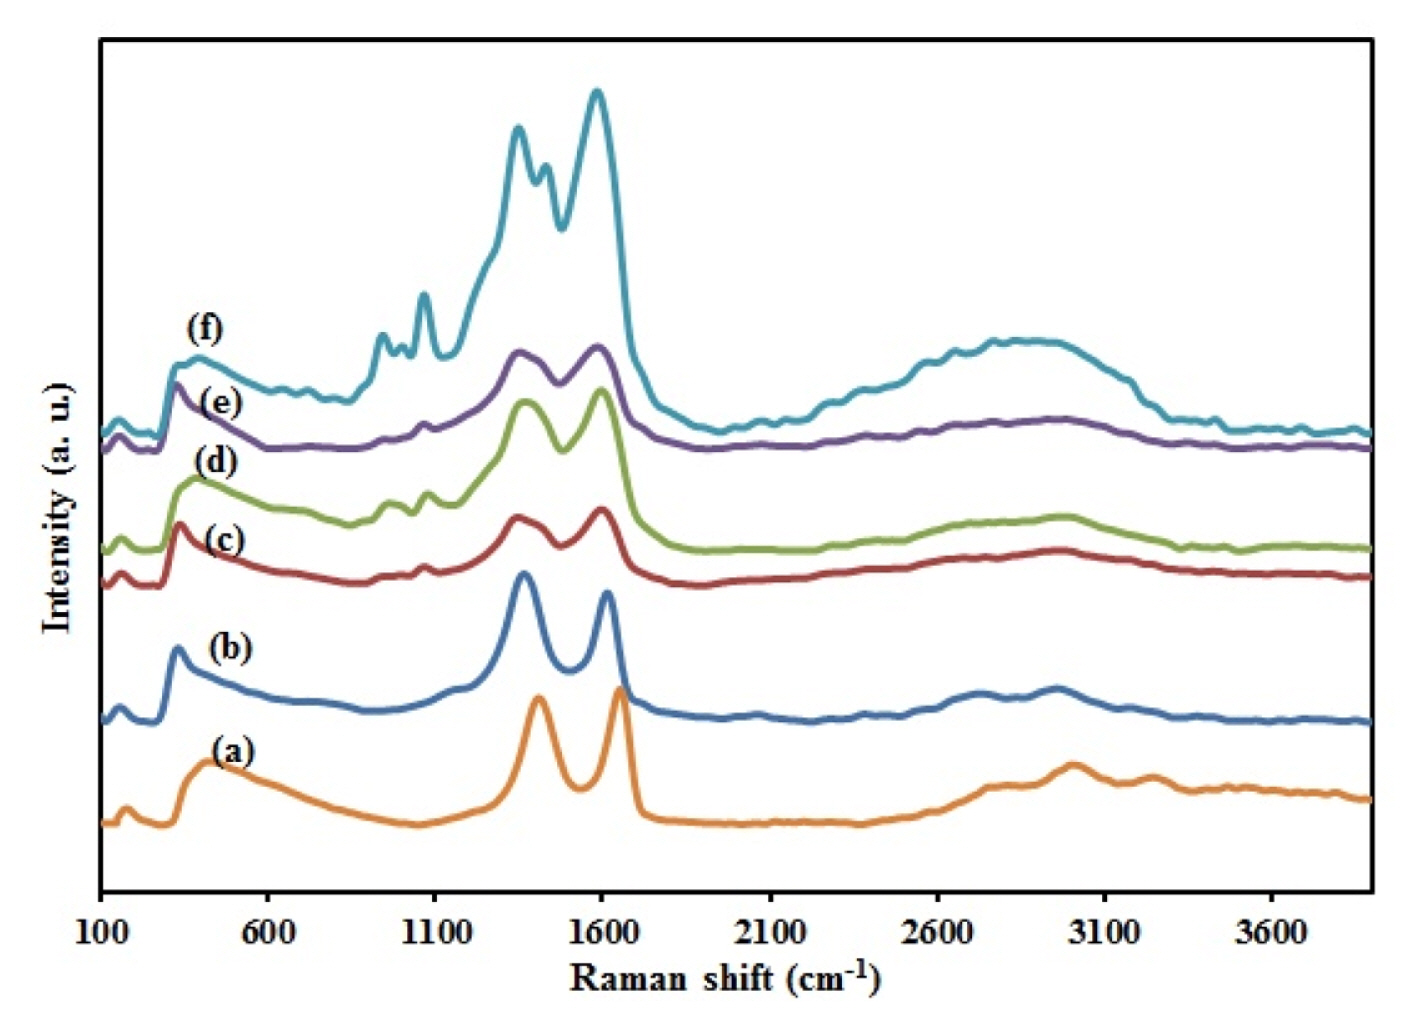
One of the most widely used techniques to characterize the structural and electronic properties of carbon materials is Raman spectroscopy. As shown in Fig. 2a, it is clear that GO exhibits two main intrinsic peaks: the D band (at ~1350 cmŌłÆ1), arising from a breathing mode of k-point photons of A1g symmetry; and the G band (at ~1600 cmŌłÆ1) originating from the first-order scattering of E2g phonon of sp2 carbon atoms. Raman spectrum of RGO also shows two other bands, a 2D band at ~2700 cmŌłÆ1 and the S3 band at ~2900 cmŌłÆ1, showing the graphitization the carbon framework. At the same time, an increased ID/IG ratio is attributable to a lower degree of crystallinity in graphitic materials and usually reflects the order of defects in GO or graphene that indicate a decrease in the size of the in-plane sp2 domains and a partially ordered crystal structure of the graphene. The calculated ID/IG was 0.92 and 1.13 in Fig. 2a and b, respectively for GO and RGO. So because of increase in the ratio, it was proved that GO was successfully reduced to RGO. In the case of PPy/RGO (Fig. 2c), the characteristic Raman bands with a maximum at ~1000 cmŌłÆ1 are assigned to the C-H in-plane deformation vibrations. The band at ~900 cmŌłÆ1 belongs to in-plane deformations of the pyrrole ring in a dictation-bearing unit. As shown in Fig. 2d stretching modes of C=C are shifted to lower wavenumbers because of the incorporation of ZnO. Fig. 2e indicates the Raman spectra of the stretching modes of C=C that are shifted to lower wavenumbers. These red shifts may be due to the incorporation of CuO and Cu2O into PPy nanofibers. Fig. 2f indicates that the main characteristic bands of RGO, PPy, ZnO, and CuxO all appear in raman spectra of CuxO-ZnO/PPy/ RGO nanocomposite. In the case of CuxO/PPy/RGO, ZnO/PPy/RGO, and CuxO-ZnO/PPy/RGO, the bands are observed at the frequency lower than 600 cmŌłÆ1 attributed to metal oxide vibration modes. Also compared to RGO, CuxO-ZnO/PPy/RGO nanocomposites show two differences in the Raman spectra. First, the calculated ID/IG of the samples CuxO-ZnO/PPy/RGO (0.94) was lower than that of RGO (1.13), indicating a lower density of defects present in CuxO-ZnO /PPy/ RGO. Second, the shift toward lower frequencies from RGO to CuxO-ZnO/PPy/RGO nanocomposite in Raman bands shows the interfacial strapping amalgamation of CuxO-ZnO nanoparticles with the PPy film and clearly credited to the deposition of CuxO-ZnO nanoparticles on the surface of PPy films and the ŽĆ-ŽĆ interactions between PPy and CuxO-ZnO nanoparticles [39ŌĆō41]. Raman results indicate that exfoliated RGO sheets, PPy nanofibers, and CuxO-ZnO nanocrystals coexist in the prepared nanocomposite.
The technique of EIS is effective to monitor the surface features, which could be used as a parameter to understand the chemical transformations and processes associated with the conductive surface [42]. A typical impedance spectrum includes a semicircle portion at higher frequencies corresponding to the electron transfer-limited process and a linear part at lower frequency range representing the diffusionlimited process. The semicircle diameter corresponds to the electron-transfer resistance (Rct), which can be used to describing the interface properties of the electrode. The experiment was carried out in 1:1 mixture of 0.1 M KCl and 5 mM K3Fe(CN)6 solution over the frequency range 100 kHz to 10 mHz. The resulting Nyquist plots observed for the unmodified GCE, RGO/GCE, PPy/RGO/GCE, ZnO/ PPy/RGO/GCE, and CuxO-ZnO/PPy/RGO/GCE are shown in Fig. 3. The Rct values are found to be about 8800, 7200, 5900, 4200 and 1900 ╬® for unmodified GCE, RGO/GCE, PPy/RGO/GCE, ZnO/PPy/RGO/ GCE, and CuxO-ZnO/PPy/RGO/GCE, respectively. Lower Rct value of CuxO-ZnO/PPy/RGO/GCE suggested CuxO-ZnO/PPy/RGO nanocomposite might form a smooth electron conduction pathway on the electrode that facilitates smooth electron transfer. This may be ascribed to the high surface area and better conductivity of CuxO-ZnO/PPy/RGO. This is supported by the morphological observation which suggested that in PPy/RGO/GCE is having highly ordered PPy nanofibers on the surface of RGO/GCE whereas CuxO-ZnO/PPy/RGO/GCE, the surface of GCE is covered with CuxO-ZnO nanoparticles patterned PPy nanofibers.
3.2 Electrochemical behaviors of AA, DA, UA, and FA at different electrodes
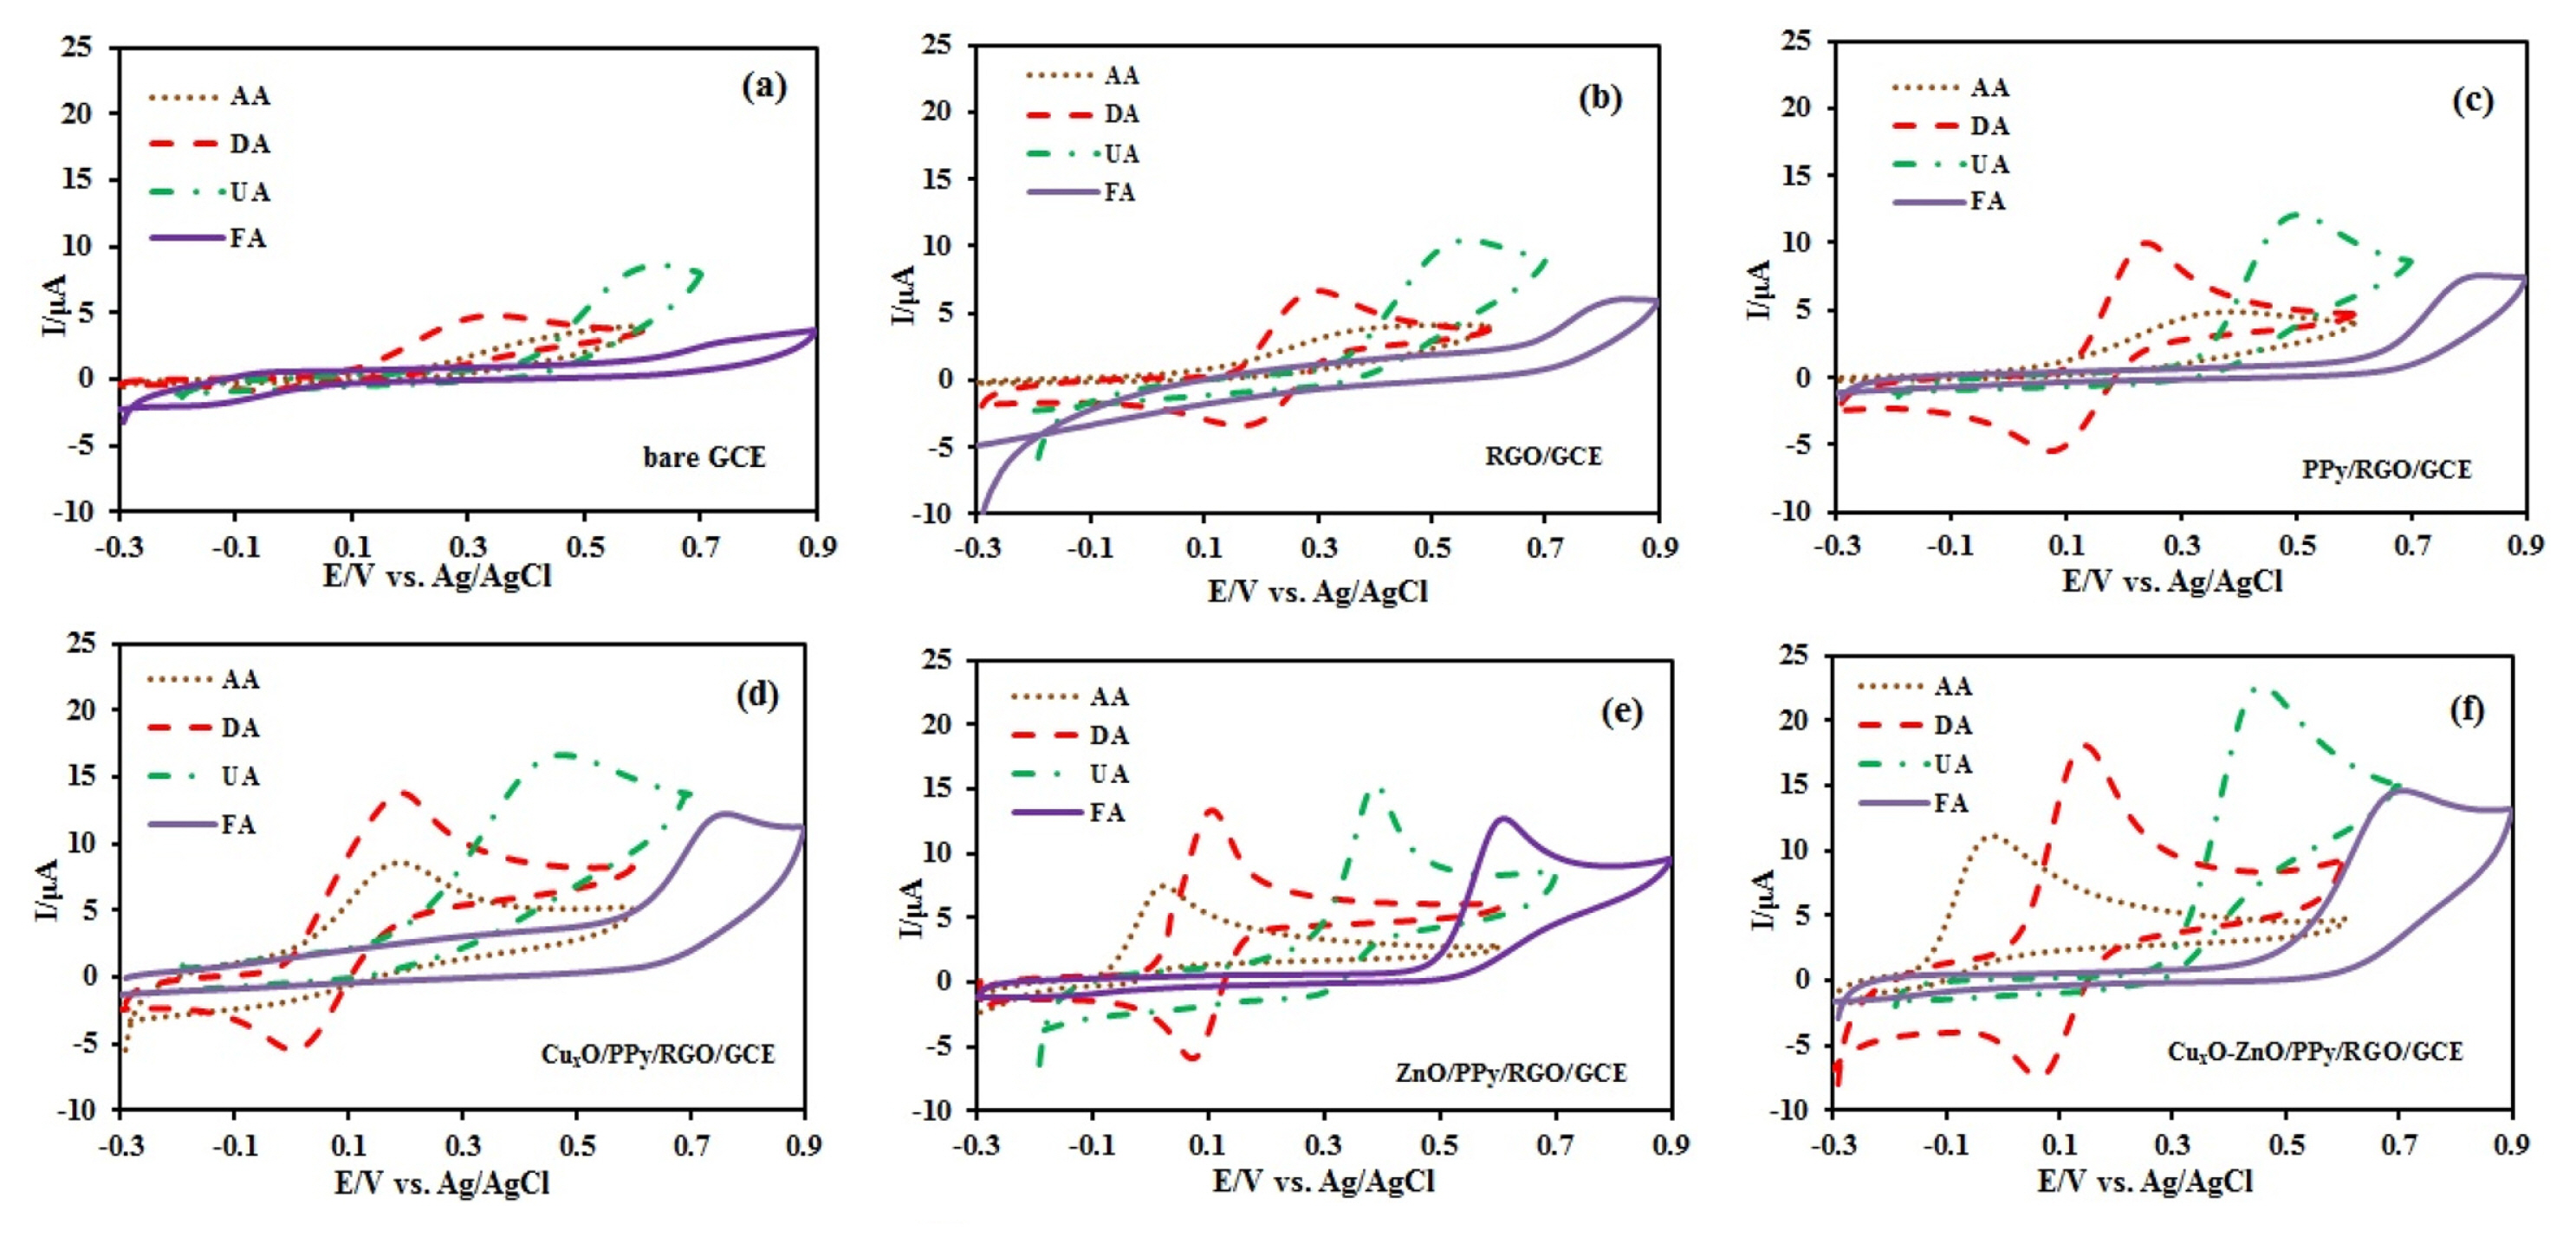
In Fig. 4, the cyclic voltammograms of the 500 ╬╝M AA, 500 ╬╝M DA, 200 ╬╝M UA, and 200 ╬╝M FA at GCE, RGO/GCE, PPy/RGO/GCE, ZnO/PPy/RGO/ GCE, CuxO/PPy/RGO/GCE, and CuxO-ZnO/PPy/ RGO/GCE were recorded in 0.1 M Phosphate buffer (PBS) solution. At bare GCE (Fig. 4a), AA and FA had no clear peak, and the anodic peaks of DA and UA appeared at 0.35 and 0.61 V, respectively. The distinction of oxidation potential among them was not clear. Therefore, it is very important to measure simultaneously these species without interferences. Fig. 4b, at the surface of RGO/GCE the shapes of peaks is better. This is due to the unique electronic structure of RGO that accelerate the electron transfer. AA, UA, and FA had an irreversible peak at 0.45, 0.56, and 0.84 V, respectively. DA had a couple of redox peaks with the anodic and cathodic peak potential at 0.30 V and 0.16 V, respectively. In this case, the oxidation peak potentials of four species are very close to each other yet. Therefore, we decided to modify this electrode by PPy nanofibers. In Fig. 4c you see the peaks of four species at the surface of PPy/RGO/GCE. AA, UA, and FA had an irreversible peak at 0.30, 0.51, and 0.80 V, respectively. DA had a couple of redox peaks with the anodic and cathodic peak potential at 0.22 V and 0.10 V, respectively. It is clear that the peaks potentials shifted toward minus value and the currents have increased, this notably enhanced electrochemical activity of RGO/GCE was related to the unique electronic properties of PPy/RGO. As shown in Fig. 4d, AA, DA, UA and FA exhibited more negative oxidation potential on CuxO/PPy/RGO/GCE (0.18, 0.18, 0.47 and 0.76 V), respectively and on ZnO/PPy/RGO/GCE (0.03, 0.09, 0.39 and 0.61 V), respectively (Fig. 4e). The peak potential separation of DA on CuxO/PPy/ RGO/GCE, and ZnO/PPy/RGO/GCE was 150 mV and 10 mV, respectively. Finally, at the surface of CuxO-ZnO /PPy/RGO/GCE (Fig. 4f), the anodic peaks for oxidation of AA, UA, and FA appeared at ŌłÆ0.03, 0.45, and 0.7 V respectively. DA showed a couple of well-shaped redox peaks with the anodic and cathodic peak potential at 0.14 V and 0.06 V, respectively. Improved kinetics for the oxidation of the four biomolecules at CuxO-ZnO /PPy/RGO/GCE surface is attributed to the Zinc oxide-copper oxide p-n junction heterostructures. Separation values of the oxidation peak potentials for AA-DA, DA-UA, and UA-FA were approximately 170 mV, 310 mV, and 250 mV, respectively.
3.3 The influence of scan rates
The relation between scan rate and the electrochemical behaviors of 500 ╬╝M AA, 500 ╬╝M DA, 200 ╬╝M UA, and 200 ╬╝M FA in 0.1 M PBS (pH = 7.0) was investigated. The cyclic voltammograms with different scan rates in the range of 10 to 100 mV sŌłÆ1 at the CuxO-ZnO/PPy/RGO/GCE are shown in Fig. 5(AŌĆōD) for AA, DA, UA, and FA, respectively. In the case of AA, DA, UA, and FA, the peak currents showed a linear relationship with the square root of the scan rate (Insets (a) in Fig. 5), indicating the diffusion controlled process dominated for AA, DA, UA, and FA, because of the fast electron transfer rate on nanocomposite. As shown in Fig. 5, the following linear relationships were observed: ip (╬╝A)=1.008(┬▒0.032) Žģ1/2 (mV/s) ŌłÆ1.321 (┬▒0.251), ip (╬╝A)=1.944(┬▒0.052) Žģ 1/2 (mV/s) 1/2 ŌłÆ2.034(┬▒0.371), ip (╬╝A)=2.189(┬▒0.061) Žģ1 / 2 (mV/ s) 1 / 2 + 0.103(┬▒0.455), ip (╬╝A)=1.453(┬▒0.042) Žģ1/2 (mV/s) 1/2 ŌłÆ0.452(┬▒0.331) for AA, DA, UA, and FA, respectively and the plot showed good linearity, with a correlation coefficient of 0.9908, 0.9946, 0.9937, and 0.9926 for AA, DA, UA, and FA, respectively.
In a further investigation of the effect of scan rates on peak potential for DA (inset b of Fig. 5B), it was found that the oxidation peak potential (Epa) shifted positively and the reduction peak potential (Epc) shifted negatively with the increasing of the scan rates and the redox peak potential (Ep) is linear to the natural logarithm of scan rate (lnv) at the rates of 10ŌĆō50 mV sŌłÆ1. By considering Laviron theory, the electron-transfer coefficient (╬▒) and electron-transfer rate constant (Ks) have been calculated as follows [43]:
where ╬Į is the scan rate, n is the electron transfer number, T = 298 K, R = 8.314 J molŌłÆ1 KŌłÆ1 and F = 96485 C molŌłÆ1, is the formal potential. The slopes of the linear regression equations are in accordance with RT/(1 ŌłÆ ╬▒)nF and RT/╬▒nF, for anodic and cathodic reactions, respectively. The linear regression equations calculated were Epa = 0.014(┬▒0.004) + 0.033(┬▒0.001) lnv, R2 = 0.9954; Epc = 0.092(┬▒0.005)-0.028(┬▒0.001) lnv, R2 = 0.9908. The charge transfers coefficient (╬▒) and the number of electrons (n) were calculated according to Eqs (1) and (2) to be 0.53 and 1.68, respectively. Under these conditions, the ks of DA can also be calculated using Eq (3) to be ks = 0.162 cm sŌłÆ1. According to the kinetics of the electrode process, when the rate constant is larger than 10ŌłÆ2 cm sŌłÆ1, the electron-transfer process is quite fast, and the electrode reaction is reversible. Thus, the above result reveals that the redox reaction process of DA is reversible.
According to the Laviron theory for an irreversible electrode process, Ep is calculated by the following equation [44]:
The equations of the plots are Epa = 0.025(┬▒0.002) lnŽģ ŌłÆ0.138(┬▒0.006) (R2 = 0.9859 ), Epa = 0.026(┬▒0.001) lnŽģ + 0.353(┬▒0.003) (R2 = 0.9962) and Epa = 0.035(┬▒0.001) lnŽģ + 0.537(┬▒0.005) (R2 = 0.9928) for AA, UA, and FA, respectively. From the slope of the Ep versus ln╬Į plot (inset b of Figures A, C and D), ╬▒ and n were calculated. The ╬▒n value of these molecules was calculated as 1.02, 0.99 and 0.85. If we assume ╬▒ = 0.5, which is used for irreversible redox reactions, the number of electrons transferred in oxidation processes of AA, UA and FA were found to be 2.05, 1.97 and 1.71, respectively, that assuming n = 2.
In order to understand the oxidation mechanism of AA, DA, UA, and FA on the CuxO-ZnO/PPy/RGO/ GCE, current function analysis (1) along with the dependence on the scan rate was carried out [45].
As IPa ╬ĮŌłÆ1/2 is proportional to Žł the first relationship can be studied as if it were Žł vs. v [46,47]. From inset c of Fig. 5B, it can be observed that the curve for DA shows a slightly negative slope that could be interpreted as a reversible charge transfer along with irreversible chemical reaction [48,49]. Fig. 5B (inset d) shows the IPa/IPc vs. v plot. From the analysis of the ratio IPa/IPc for modified electrode it can be observed that the IPa/IPc ratio is about 2.4, and the cathodic wave is smaller than the anodic process indicating that the oxidized product is not stable and probably decomposes or undergoes a subsequent chemical reaction that prevents to be reduced to the original reagent. This result complements the analysis from Ipa ╬ĮŌłÆ1/2 vs. v.
On the other hand, AA, UA, and FA (inset c of Fig. 5(A,C and D)) shows a slightly positive slope according to an irreversible charge transfer and exhibits a characteristic shape typical of an EC (The symbols (E) and (C) represent the electrochemical and chemical reactions) process [50]. These results signify that the overall electrochemical oxidation of AA, UA, and FA at a modified electrode might be controlled by a cross-exchange process operating between the redox site of the CuxO-ZnO/PPy/RGO/GCE and these compounds and the diffusion of them.
3.4 Optimization of pH for AA, DA, UA, and FA detection at CuxO-ZnO/PPy/RGO/GCE
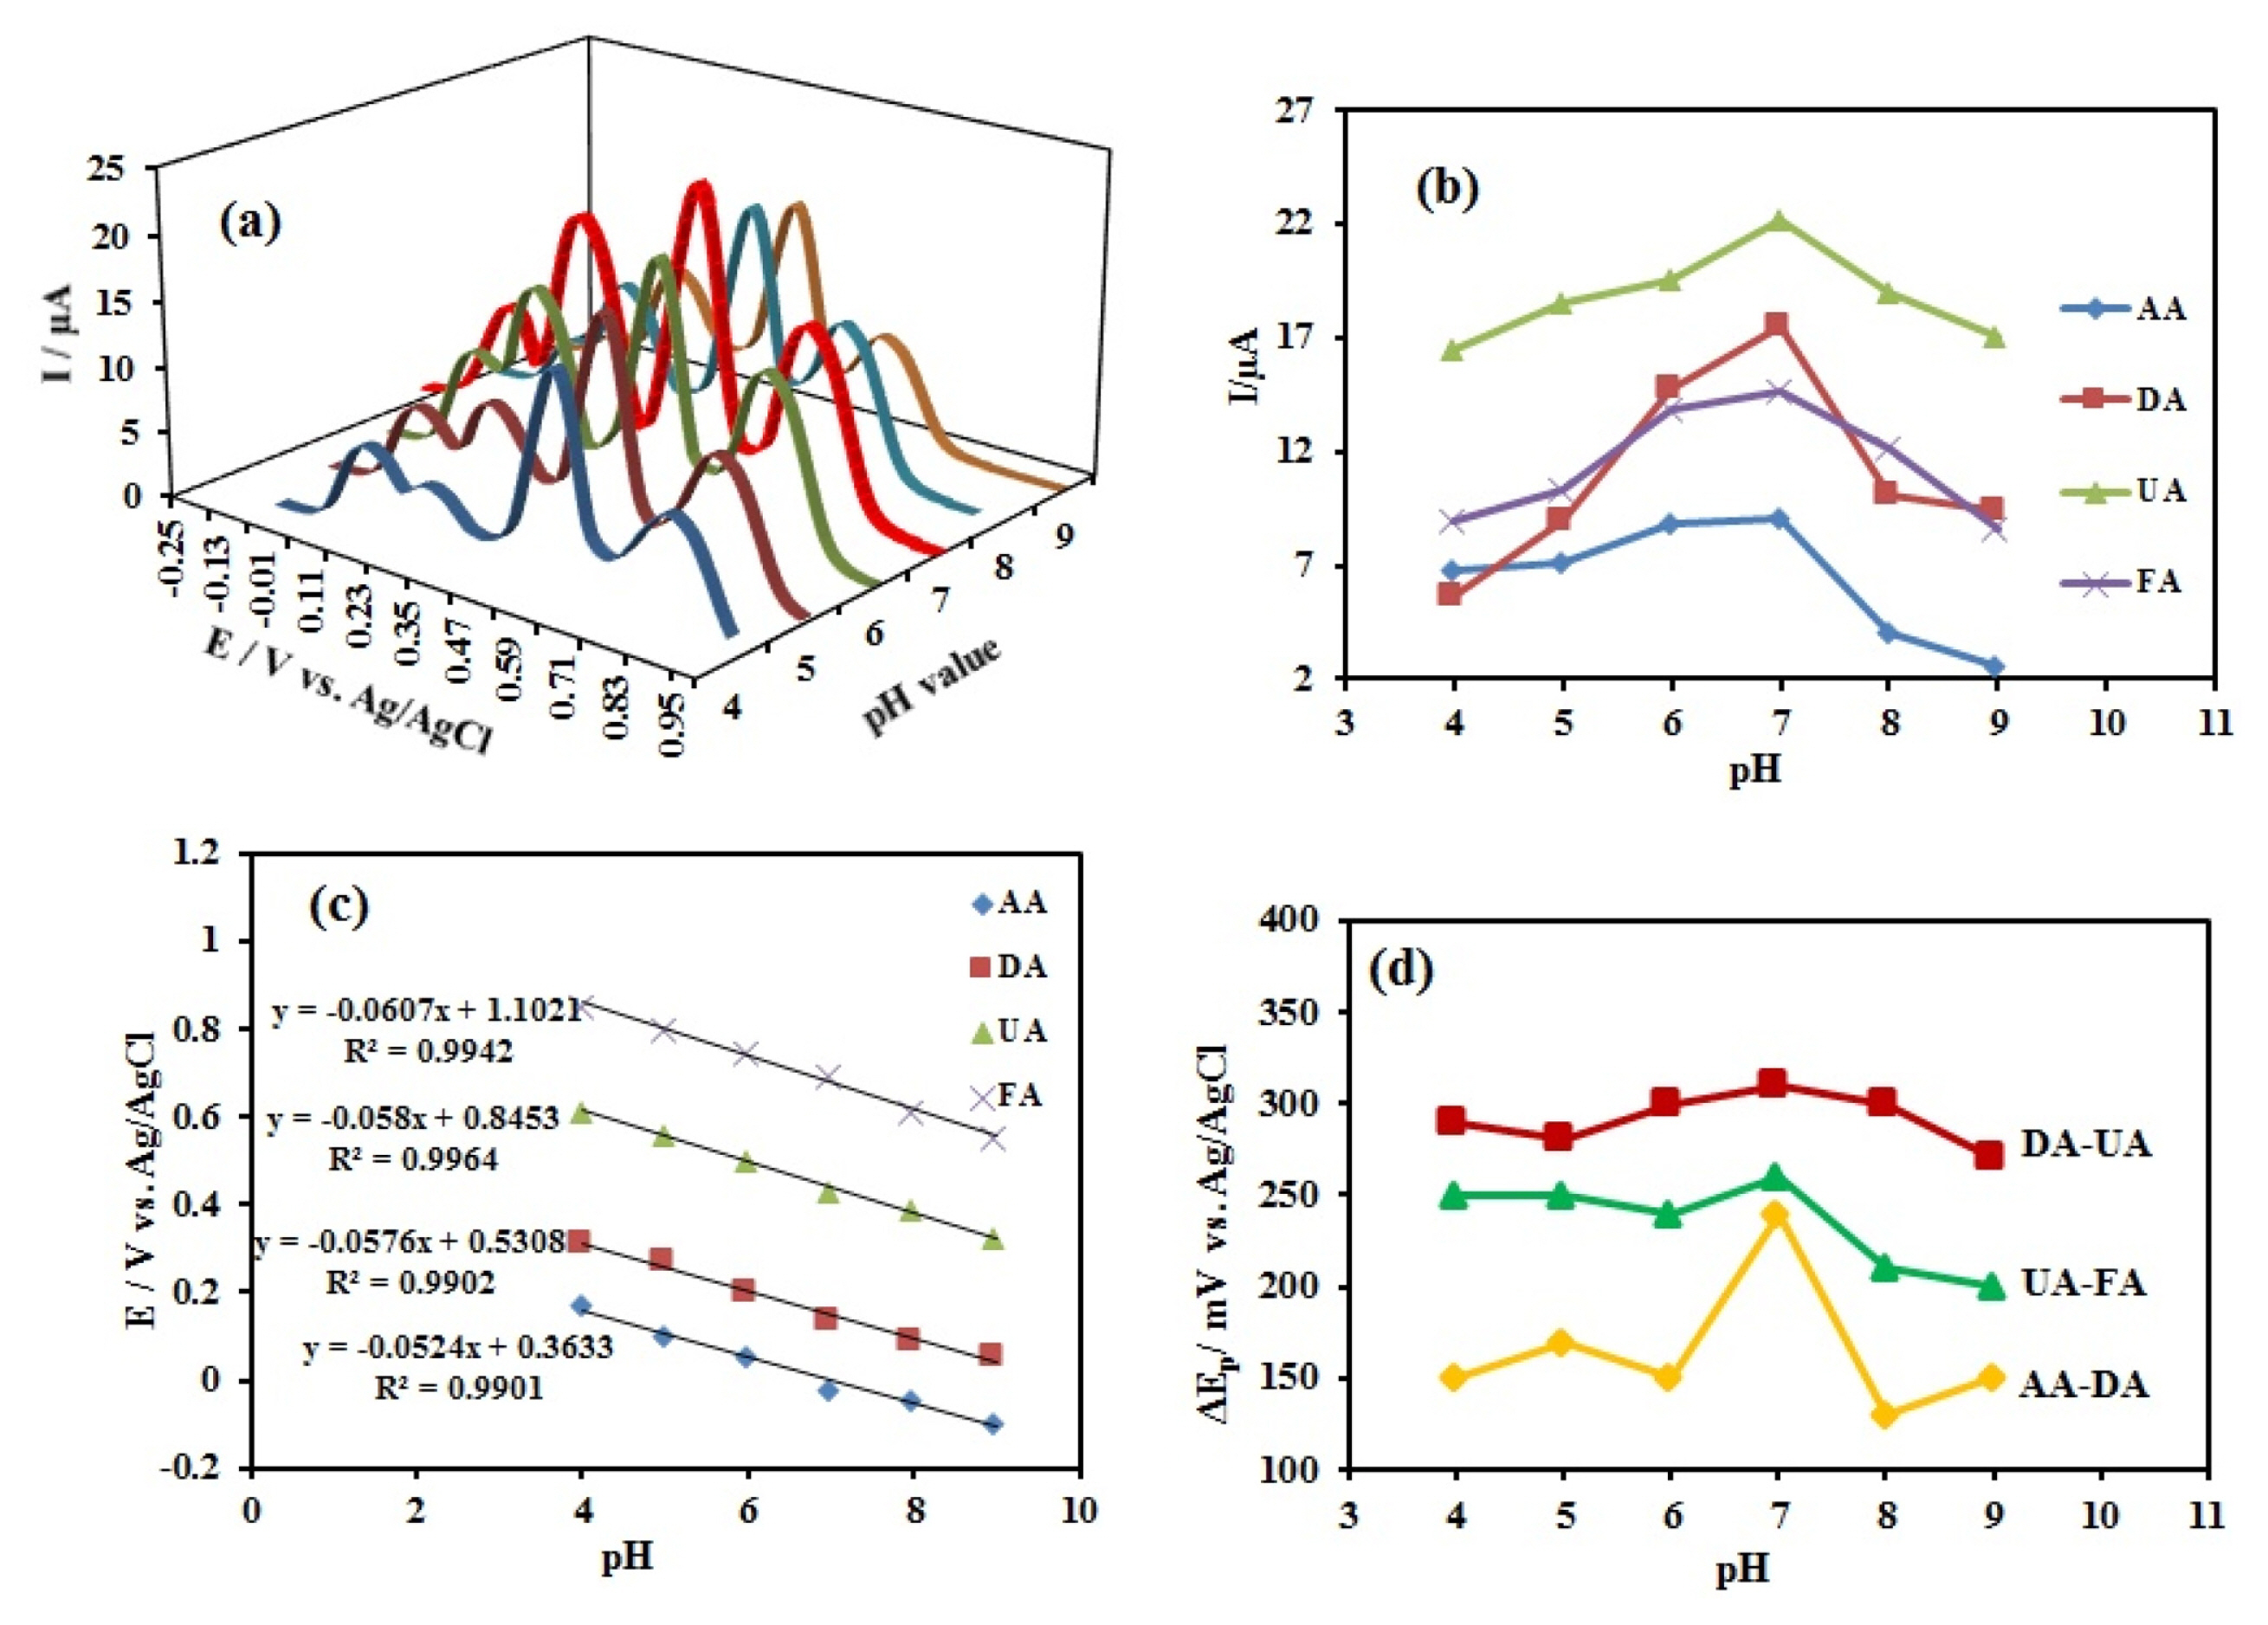
The pH of supporting electrolyte had a significant influence on the AA, DA, UA, and FA electro-oxidation at the CuxO-ZnO/PPy/RGO/GCE because it affects both peak potential and current. The Fig. 6 show over the pH range 4ŌĆō9 in phosphate buffer. The effect of solution pH on the electrochemical behavior in the simultaneous determination of these species was studied using CV method for each species separately (Fig. S5) and DPV method in the mixture (Fig. 6). The oxidation peak currents for all four compounds increased gradually as raising pH, and peaked at pH 7.0 and then reduced significantly with the increase of pH. With due attention to the obtained results, pH 7.0 was chosen as an optimum solution pH for further experiments. As shown in Fig. S5 (aŌĆōd), the peak potential of four biologic molecules shifted toward less positive value as pH of the medium was increased. Since pH 7.0 is the physiological pH and four molecules had maximum current in pH 7.0 we choose this pH for electrochemical detection. The oxidation peak potentials of AA, DA, UA and FA obey the following equations:
E pa = - 0.052 ( ┬▒ 0.003 ) pH + 0.363 ŌĆē ( ┬▒ 0.020 ) ŌĆē ( R 2 = 0.9901 ) , E pa = - 0.058 ( ┬▒ 0.003 ) pH + 0.531 ( ┬▒ 0.018 ) ŌĆē ( R 2 = 0.9902 ) , E pa = - 0.058 ( ┬▒ 0.002 ) pH + 0.845 ( ┬▒ 0.012 ) ŌĆē ( R 2 = 0.9964 ) ,
The effect of solution pH was examined by DPV method in a mixture of four compounds that are shown in Fig. 6a. As shown, in this case, the oxidation peak currents for four analytes increased from pH 4.0 to 7.0 and then decreased with pH changes from 7.0 to 10.0 (Fig. 6b). Therefore, the PBS with a pH of 7.0 was selected as an optimal supporting electrolyte for the simultaneous electrochemical determination of AA, DA, UA, and FA in the mixture. Also, the results showed that the corresponding anodic peak potentials (Epa) of AA, DA, UA, and FA were changed linearly with variation in pH solution (Fig. 6c). In the pH, 7.0 separation values of the oxidation peak potentials for AA-DA, DA-UA, and UA-FA were approximately 240 mV, 310 mV, and 260 mV, respectively (Fig. 6d).
3.5 Simultaneous determination of AA, DA, UA and FA
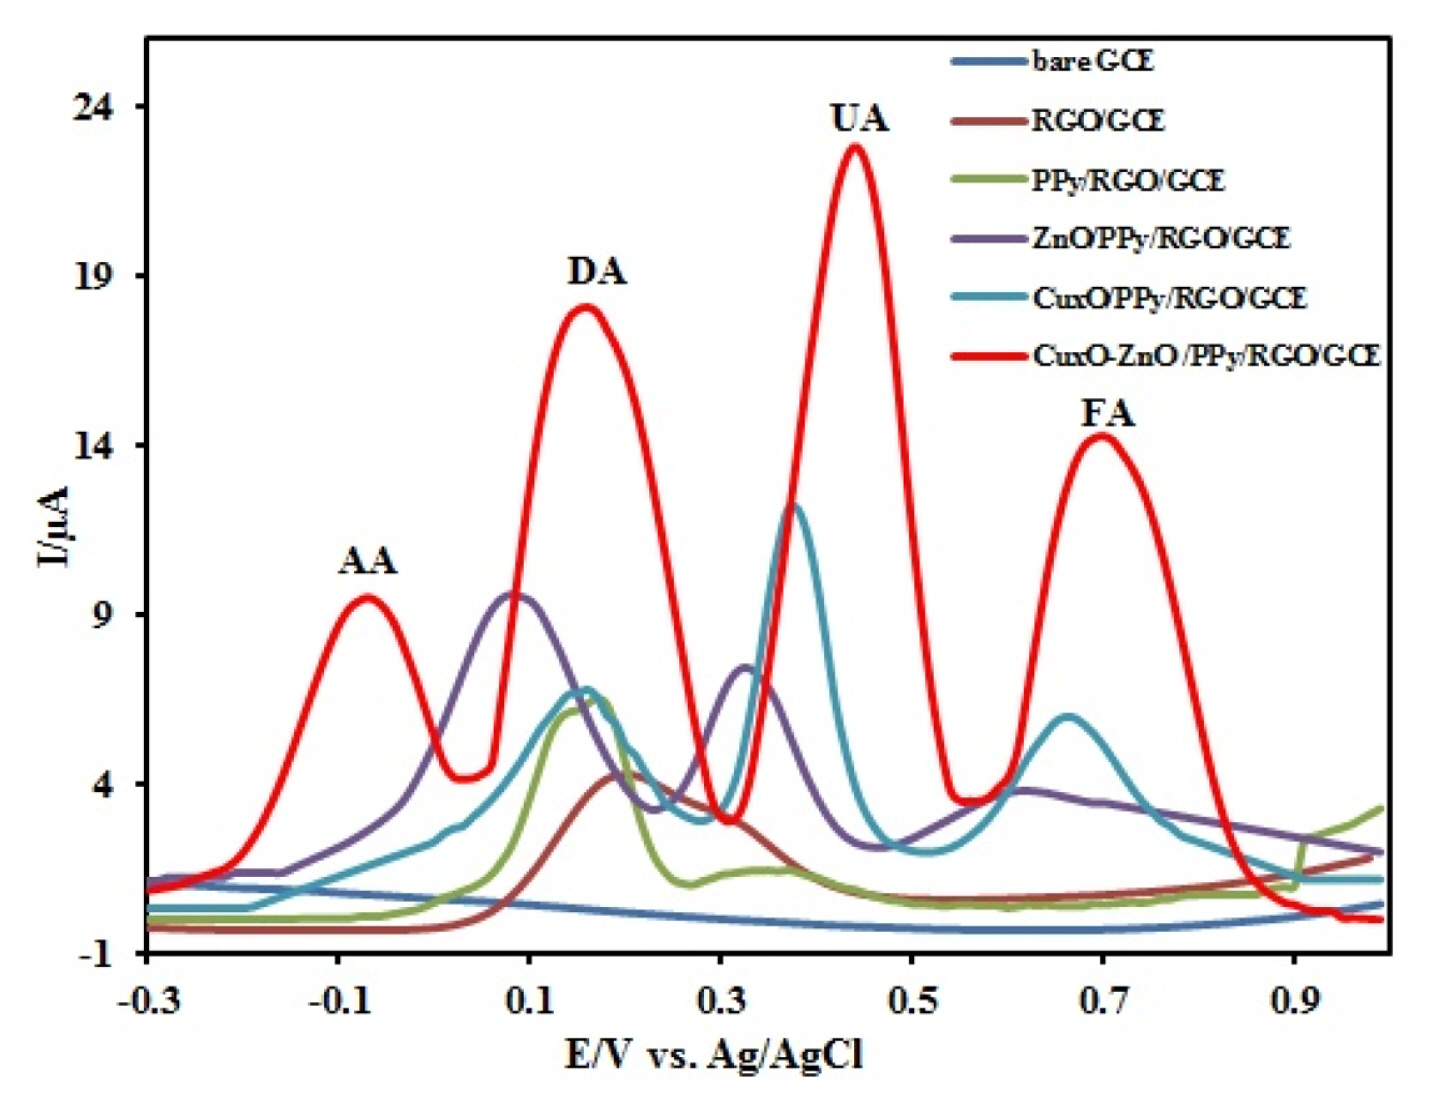
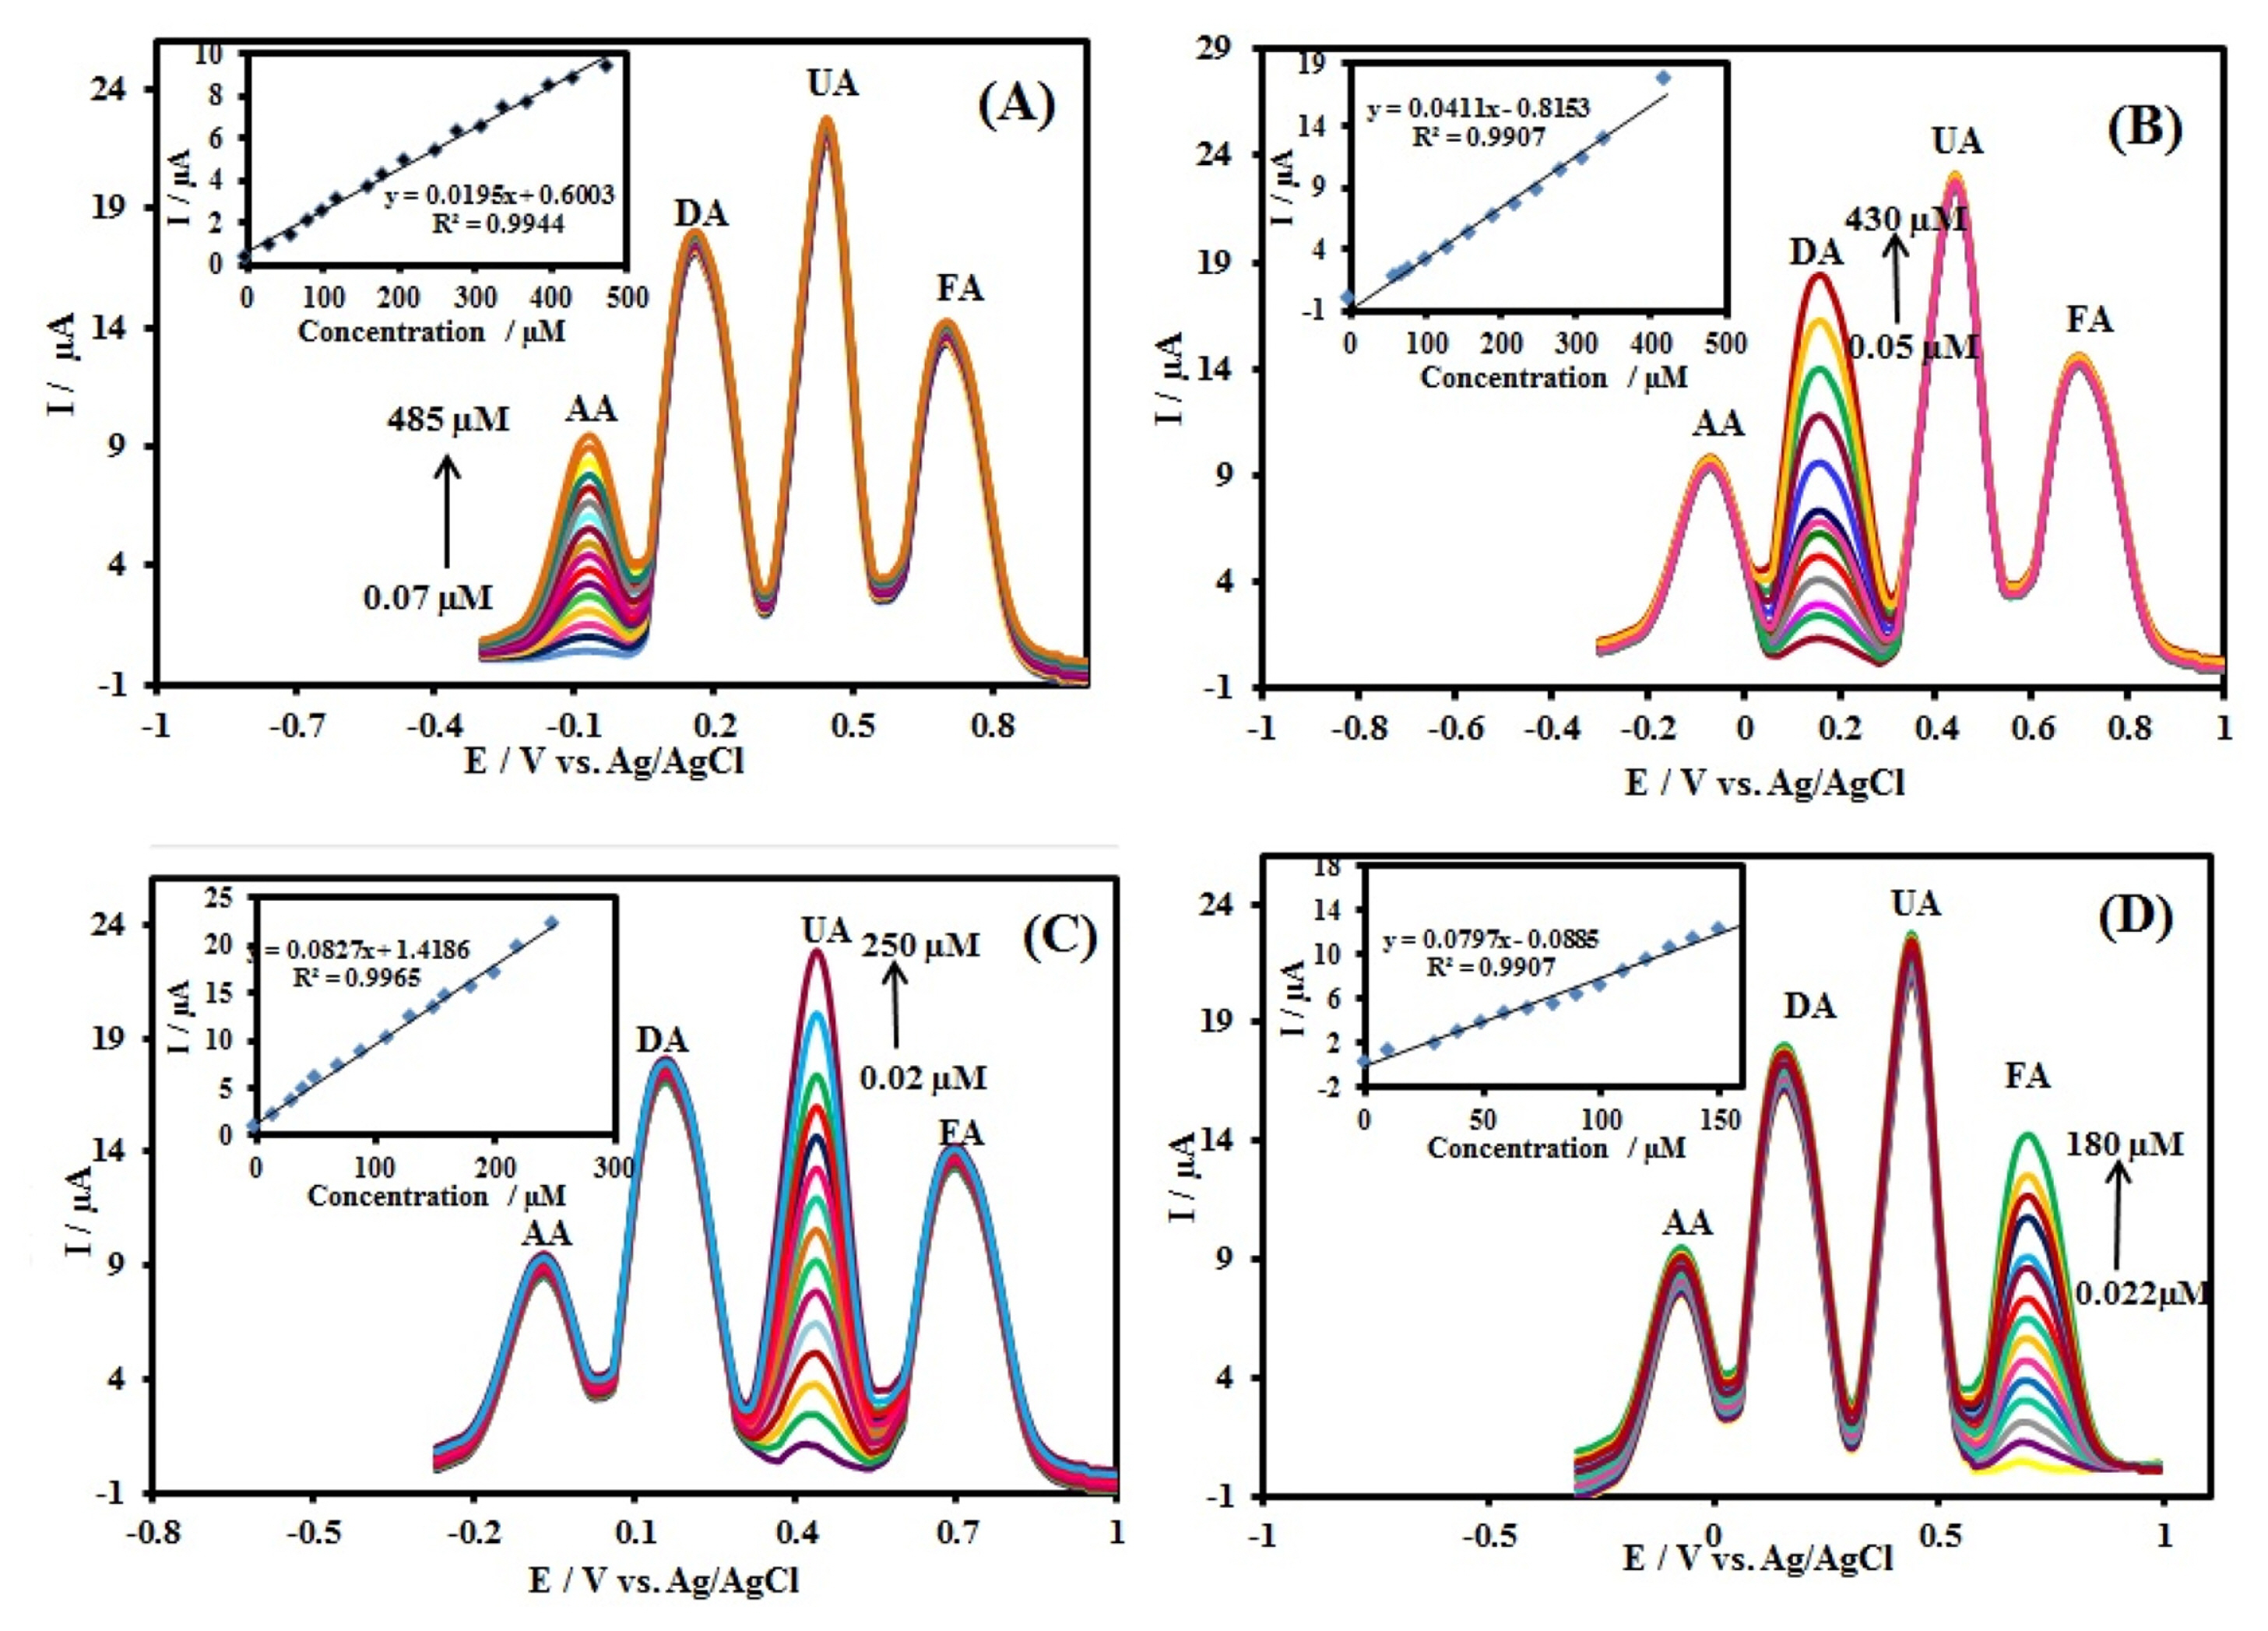
Sensitivity and selectivity of an electrode (III) for the simultaneous determination of AA, DA, UA, and FA were evaluated for a mixture of these species at CuxO-ZnO/PPy/RGO/GCE. Fig. 7 shows the Differential pulse voltammograms, DPVs, recorded for a mixture of AA (500 ╬╝M), DA (500 ╬╝M), UA (200 ╬╝M), and FA (200 ╬╝M) in 0.1 M PBS (pH 7.0) at GCE, RGO/GCE, PPY/RGO/GCE, ZnO/PPy/ RGO/GCE, CuxO/PPy/RGO/GCE and CuxO/ZnO/ PPy/RGO/GCE. The results showed that the oxidation peaks of AA, DA, UA, and FA are indistinguishable and broad at the bare GCE, RGO/GCE and PPy/ RGO/GCE. On the other hand, the oxidation peak potentials of DA, UA, and FA separate into three well-defined peaks using ZnO/PPy/RGO/GCE, and CuxO/ PPy/RGO/GCE but the oxidation peak of ascorbic acid cannot be seen. At the CuxO/ZnO/PPy/ RGO/GCE, four oxidation peaks corresponding AA, DA, UA, and FA were observed, indicating that their oxidation takes place independently at the modified electrode. In addition, the separations of the DPV peak potentials and calculated to be 230 mV, 270 mV, and 260 mV between AA-DA, DA-UA, and UA-FA, respectively. The separations were large enough to allow selectively determining AA, DA, UA, and FA simultaneously in their mixture solution. The Ipa of AA, DA, UA, and FA were 9.5 ╬╝A, 13.9 ╬╝A, 19.7 ╬╝A, and 11.1 ╬╝A, which were all much larger than other electrodes, respectively. The obtained results also indicate that simultaneous determination of AA, DA, UA, and FA could be achieved with sensitivity and selectivity. The DPV method was used for the deep study of the simultaneous determination of AA, DA, UA, and FA because it has much higher sensitivity and a better resolution compared to CV method for quantitative analysis. The results are shown in Fig. 8. In a quadruple mixture, the concentration of one compound changed, and those of other three compounds remained constant.
The peak current of AA in 0.1 M PBS (pH 7.0) containing 500 ╬╝M DA, 200 ╬╝M UA, and 200 ╬╝M FA increased linearly with the concentration increase of the AA from 0.07 to 485 ╬╝M (Fig. 8A). The following linear equations is Ip,AA (╬╝A) = 0.600 (┬▒ 0.091) +0.019 (┬▒ 0.001) CAA (╬╝M) (R2=0.9944). Similarly, as shown in Fig. 8B, the oxidation peak current of DA in 0.1 M PBS containing 500 ╬╝M AA, 200 ╬╝M UA, and 200 ╬╝M FA increased with the concentration increase of the DA from 0.05 to 430 ╬╝M (Fig. 8B). The following linear equations is Ip,DA (╬╝A)=ŌłÆ0.815 (┬▒ 0.281) + 0.041 (┬▒ 0.001) CDA (╬╝M) (R2=0.9907). In the case of UA (Fig. 8C), the oxidation peaks in 0.1 M PBS containing 500 ╬╝M AA, 500 ╬╝M DA, and 200 ╬╝M FA increased gradually from 0.02 to 250 ╬╝M with an increase in the UA concentration, and Ipa showed a good linear relationship according to following linear equations: Ip,UA (╬╝A) = 1.419 (┬▒ 0.195) + 0.083 (┬▒ 0.002) CUA (╬╝M) (R2=0.9965). Similarly, Fig. 8D shows the DPV curves of FA in 0.1 M PBS (pH 7.0) containing 500 ╬╝M AA, 500 ╬╝M DA, and 200 ╬╝M UA with increasing concentration of FA from 0.022 to 180 ╬╝M. The peak currents of FA increased linearly with an increase in its concentration, according to the linear function: Ip,FA (╬╝A )= ŌłÆ0.088 (┬▒ 0.228) + 0.080 (┬▒0.003) CFA (╬╝M) (R2=0.9907). Based on the signal-to-noise (S/N = 3) characteristic, the limit of detection (LOD) was estimated to be 22 nM, 10 nM, 5 nM, and 6 nM for AA, DA, UA, and FA, respectively.
3.6 Method validation
3.6.1 Linearity and LOD
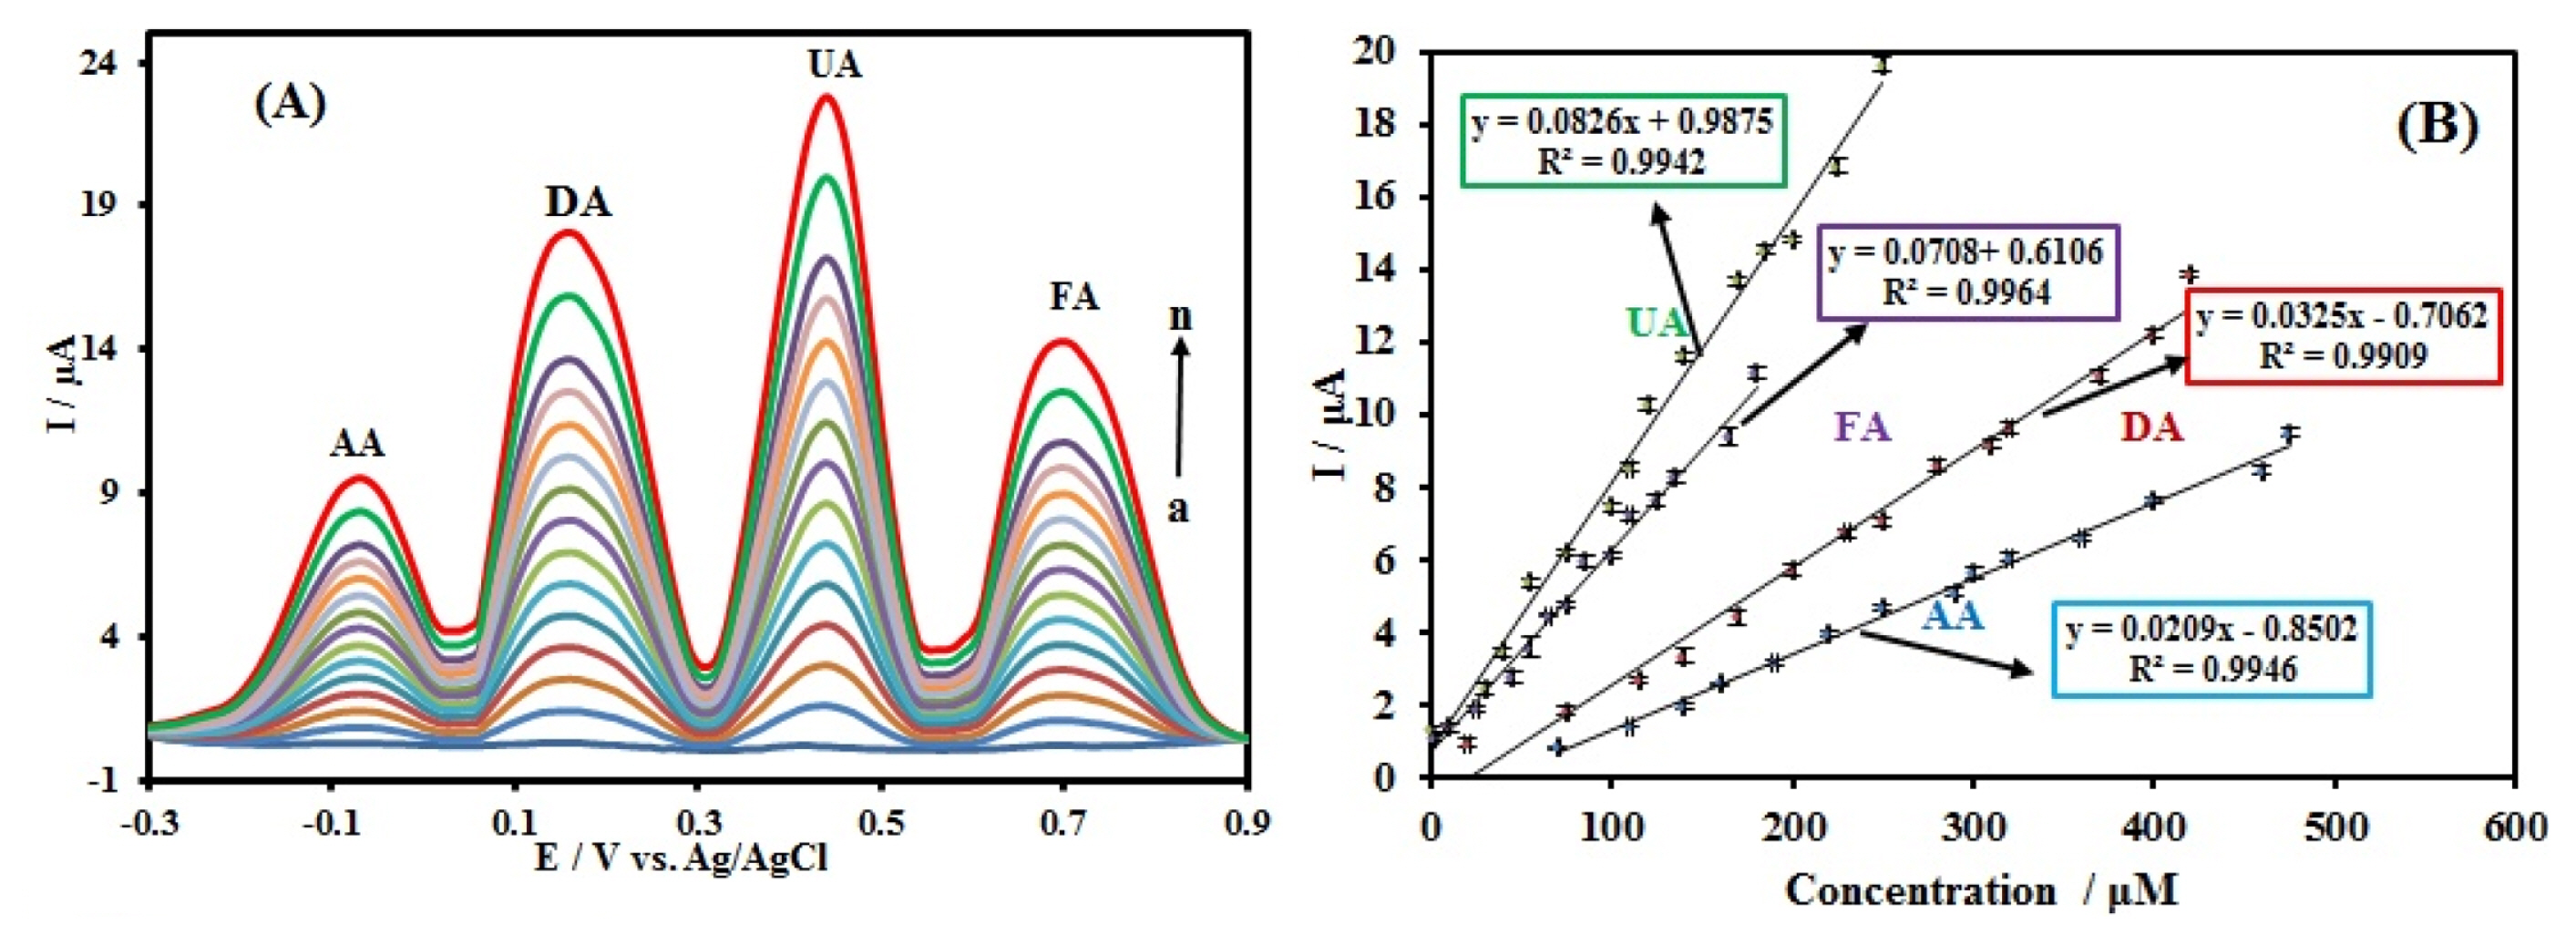
The electrochemical responses of the simultaneous detection of AA, DA, UA, and FA in PBS at the CuxO-ZnO/PPy/RGO/GCE using DPV were depicted in Fig. 9. The linear ranges and detection limits (S/N = 3) for AA, DA, UA, and FA were presented in Table 1. The results suggest that the simultaneous detection of AA, DA, UA, and FA is feasible at CuxO-ZnO/PPy/RGO modified GCE.
In Table 2 the comparison with previously developed modified electrodes had reported and it is clear that the proposed electrode exhibits better analytical performance.
3.6.2 Accuracy and precision
The accuracy was determined using the regression equation that was obtained from the constructed calibration curves at three concentration levels covering low, medium and high range. Good recoveries were achieved and presented in Table 3. For study Intraday precision at three different concentration levels in the same day experiments were done, while for study inter-day precision at different three consecutive days experiments were done. Clearly, the values of RSD in Table 3 could indicate that, the proposed method was highly precise.
3.7 Effect of interferences on the behaviors of AA, DA, UA, and FA
Under optimal experimental conditions, the potential influence of some interference was also investigated to evaluate the anti-interferential ability of the modified electrode for the determination of AA, DA, UA, and FA. The results are shown in Table 4. Most common usual interference being derived from any of the cysteine (Cys), glucose (Glu), Na+, K+, Mg2+, Fe3+, Cu2+, Zn2+, Ca2+, SO42ŌłÆ, ClŌłÆ, SCNŌłÆ, NO3ŌłÆ, and CO32ŌłÆ. Among these compounds, the interference from any of AA, DA, UA, and FA are very important because their oxidation peak potential are close to each other and they usually are present in real biological samples simultaneously. The data show that interferences are only significant at relatively high concentrations and we can say that this biosensor is free from common interfering species.
3.8 Real Sample Analysis, Reproducibility, and Stability
In order to evaluate the applicability of the proposed method, it was used for the determination of AA, DA, UA, and FA in the human plasmatic serum sample. The human plasmatic serum sample was diluted 100 times using 0.1 M PBS (pH 7.0). Differential pulse voltammograms were used for the tests. Concentrations were measured by applying the calibration plot using the standard addition method. The results are shown in Table 5. Recovery studies were also conducted using blood serum and recoveries between 99.83% to 101.70% for AA, 99.06% to 100.26% for DA, 99.47% to 100.97% for UA, and 99.07% to 101.24% for FA were obtained.
By using the standard addition method, determinations of AA, DA, UA, and FA in two human urine real samples were performed. To determine the accuracy of the results, the urine samples were diluted 50 times with 0.1 M PBS (pH 7.0) before the measurement to reduce the matrix effect. Then a certain amount of AA, DA, UA, and FA was added to the sample (three times) to evaluate the recoveries. The results are shown in Table 6. The recovery of the spiked samples ranged between 99.50% and 101.93%, relative standard deviation (RSD, n=3) ranged within 0.86ŌĆō1.17% (Table 6). The results indicating the successful application of the CuxO-ZnO/ PPy/RGO nanocomposite for the determination of AA, DA, UA and FA in real samples.
The reproducibility of CuxO-ZnO/PPy/RGO/GCE was evaluated by preparing five parallel electrodes for the determination of 500 ╬╝M AA, 500 ╬╝M DA, 200 ╬╝M UA and 200 ╬╝M FA. The relative standard deviations of the five electrodes were 3.5%, 1.75%, 2.5%, and 3.1% for AA, DA, UA, and FA, respectively.
The stability of the modified electrode was also investigated. After kiping the modified electrode at ambient temperature for 21 days, repeatable sensing performance was achieved for the detection of AA, DA, UA, and FA, suggesting that the sensor has good stability.
4. Conclusions
CuxO-ZnO/PPy/RGO/GCE was synthesized by electrochemical methods. The CuxO-ZnO/PPy/RGO/ GCE modified electrode is able to simultaneously detect AA, DA, UA, and FA. The method exhibits a wide linear range, high sensitivity, good reproducibility and stability. The human blood serum samples analysis results showed good recoveries. It shows that CuxO-ZnO/PPy/RGO is a promising electrocatalyst for the detection of AA, DA, UA, and FA.