Theoretical and Experimental Studies on the Adsorption of N- [(E)-Pyridin-2-ylmethylidene] Aniline, a Schiff Base, on Mild Steel Surface in Acid Media
Article information
Abstract
The adsorption of N-[(E)-Pyridin-2-ylmethylidene] aniline, a Schiff base, on to mild steel surface in 1M HCl and 0.5M H2SO4 solutions and the consequent corrosion protection were studied employing weight loss method, electrochemical impedance spectroscopy and potentiodynamic polarization measurements. DFT calculations were performed to investigate its interaction with the metal surface at the atomic level to understand its inhibition mechanism. The adsorption process is well described by the Langmuir isotherm. The thermodynamic parameters indicated that the adsorption is spontaneous and the interaction of the inhibitor at the mild steel surface is mainly through physisorption. The Ra values obtained in AFM studies for the uninhibited and inhibited sample in HCl media respectively are 0.756 and 0.559 μm, and that in H2SO4 media are 0.411 and 0.406 μm. The lesser roughness values of the inhibited sample shows the adsorption of the molecules onto the mild surface. The inhibition efficiencies were found to improve with concentration of the inhibitor and the maximum efficiency was observed at 400ppm in all the investigation methods adopted. The inhibitor was found to exhibit a higher efficiency in HCl media (95.7%) than in H2SO4 (92.8%). The theoretical and experimental results are found to be in good agreement.
1. Introduction
Iron, the most widely used metal in many industries, undergoes corrosion in mild as well as in aggressive environments. Various methods are available for corrosion control and the use of organic inhibitors is one amongst the most appropriate ways to achieve this objective [1,2]. The organic compounds containing polar functional groups with nitrogen, oxygen or sulphur atoms and conjugated system act as good corrosion inhibitors in acid media [3–7]. The inhibitive property of organic molecules depends on several factors such as structure and the charge distribution, the number and types of adsorption sites on the metal surface and the nature of interaction between them [8–10]. The inhibitive nature is attributed to the adsorption ability of the organic molecules on the corroding metal surface follows some known adsorption isotherms with respect to the reactive centres in the inhibitor resulted from polar functional groups. The resulting adsorbed film acts as a diffusion barrier for the aggressive environments [11]. The kinetics of the electrochemical reactions that constitute the corrosion processes are generally influenced by the metal-solution interface and thereby modify the metal dissolution in acid media by changing the structure of electrical double layer [12,13]. Investigations on corrosion inhibition of the organic molecules attained great attention, and various investigations have given series of reports proving that schiff bases could function as effective corrosion inhibitors [14–16]. Apart from the requirements of the presence of an electron cloud on the aromatic ring, the synthesized Schiff base possess electronegative nitrogen atom and the presence of a C=N group, all of them expected to facilitate greater adsorption of the compound onto the steel surface importing effective inhibition, the synthesis of the current Schiff base involved an easy synthetic route using low cost starting material [17]. Several industrial processes are carried out using acid solutions especially sulphuric and hydrochloric acids. Therefore in the present investigation the inhibition efficiency of the compound in 1 M HCl and 0.5M H2SO4 have been studied and compared using weight loss method and electrochemical techniques such as Electrochemical impedance spectroscopy (EIS) and potentiodynamic polarization studies. The mechanism of inhibition is also discussed based on the Potential of Zero Charge (PZC) and adsorption isotherm. Quantum chemical calculations have also been performed to substantiate the experimental observations [18,19].
2. Experimental
2.1 Materials
The mild steel specimen used for gravimetric study has the dimension of 2.5 × 1 × 0.1 cm with the elemental composition of 0.084% C, 0.037% Mn, 0.026% P, 0.021% S and the balance Fe. Emery sheets of different grades like 220, 400, 600, 800 and 1200 were used to polish the specimens mechanically and washed with double distilled water. The specimens were degreased with acetone and then dried. A Teflon coated cylindrical mild steel rod of exposed area 1 cm2 was used for electrochemical studies. All the solutions were prepared using double distilled water.
2.2 Synthesis of Schiff base
Equimolar mixture of Pyridine-2-carboxaldehyde and aniline in ethanol was stirred for 30 minutes at room temperature and the precipitated schiff base, N- [(E)-Pyridin-2-ylmethylidene] aniline (PMA) was washed with ethanol and dried at room temperature. Purity of the schiff base was confirmed from the appearance of a single spot in TLC. The structure of the schiff base is shown in Fig. 1.

Structure of the synthesized schiff base N-[(E)- Pyridin-2-ylmethylidene] aniline (PMA).
The disappearance of the characteristic peak for C = O at 1700 cm−1 and the appearance of a new peak at 1679 cm−1 for C = N in the FTIR spectra confirmed the formation of the schiff base (Fig. 2)

IR spectrum of the schiff base (PMA).
2.3 Weight loss measurements
ASTM procedure was followed for weight loss measurements to quantify the rate of corrosion and inhibitor effectiveness [20]. The prepared mild steel samples in triplicate were completely immersed in 100 mL of 1M HCl and 0.5M H2SO4 solutions with different concentrations 10, 50, 100, 200, 300, 400, 500, 600 and 700 ppm ) of the inhibitor at 30 ± 1°C for 2 hours and then washed, dried and weighed. The average of the weight loss was taken for corrosion rate calculations and the inhibitor efficiency was determined from the following relationship [21].
Where, IE is the inhibitor efficiency, WB.S. is the weight loss in blank solution, WI.S. is the weight loss in inhibited solution.
2.4 Electrochemical Impedance measurements
Electrochemical studies have been carried out using a Potentiostat/Galvanostat (Gamry Reference 600). In the three electrode system, a teflon coated mild steel rod with an exposed area of 1 cm2 served as the working electrode, a saturated calomel electrode as the reference and a platinum mesh served as the counter electrode. The EIS measurement was performed in the frequency range from 106 to 10−2 Hz at the open circuit potentials by imposing a sinusoidal AC perturbation of 10 mV, after immersion for 30 min in the acid media. The charge transfer resistance (Rct) values were used to determine the inhibition efficiencies as per the following relationship [22].
Where R’ct is the charge transfer resistance in the inhibited solution, Rct is the charge transfer resistance in the uninhibited solution. The reproducibility of the results was ensured by repeating the experiments for a minimum of 3 times and the average of the results obtained were used to calculate the inhibition efficiencies [23].
2.5 Potentiodynamic polarization measurements
The potentiodynamic polarization curves were recorded from a more negative potential than Eocp to a more positive potential than Eocp through Ecorr at a sweep rate of 1.67 mV / s. The inhibition efficiencies were calculated using the equation (3) [24].
Where icorr is the corrosion current density in uninhibited solution and i’corr is the corrosion current density of inhibited solution.
2.6 Potential of zero charge (PZC)
The double layer capacitance (Cdl) values were obtained from the impedance response of the corroding electrode at 100 Hz at an AC amplitude of 10 mV at different applied DC potentials and PZC was determined by plotting the differential capacitance values against the applied DC potential.
Adsorption of the inhibitor on the metal surface mainly depends on the surface charge on the metal. The sign of Er can be found using the following formula (7) [25].
Where,
EPZC = Potential of zero charge
Er = Antropov’s rational corrosion potential
EOCP = Open circuit potential
2.7 Surface analysis
AFM surface morphological study was carried out as per the literature [26]. Freshly pre-treated mild steel coupons were immersed in the media (1.0 M HCl and 0.5 M H2SO4) in the absence and in the presence of the inhibitor. The specimens were retrieved after 3 hours, washed with distilled water and dried before subjecting to AFM analysis [27]. An Atomic Force Microscope (APE Research, Italy- A100) was used to image the sample’s surface in contact mode at a scan area of 30 μm × 30 μm at 5000 nm/s scan rate. The Gwyddion 2.47 program was used for image processing.
3. Results and Discussion
3.1 Weight loss method
The corrosion inhibition efficiencies of the schiff base (PMA) for mild steel in both the acid media are shown in Table 1. Increase in inhibitor concentration increases its efficiency. When a mild steel surface is immersed in an acid solution containing an inhibitor, a portion of the surface gets covered, termed as surface coverage which is represented by θ [28]. Linear relationship between inhibitor concentration and θ is observed till the formation of completely covered surface, beyond which, addition of inhibitor has no influence [20,29].

Inhibitor efficiencies from weight loss measurement for mild steel in 1.0M HCl and 0.5M H2SO4 solutions in the presence and in the absence of the inhibitor.
Maximum inhibition efficiencies were found to be 80% and 76% respectively in HCl and H2SO4 medium at 400ppm of inhibitor and the difference in efficiencies with respect to acid is due to the influence of anion adsorption on the surface of the metal [30]. The specific adsorption of anions is expected to be more pronounced with anions having a smaller degree of hydration such as chloride ions (Cl−). As they are being specifically adsorbed, they create an excess negative charge towards the solution phase and favour enhanced adsorption of the amine cations leading to an increased inhibition of corrosion [31]. Thus adsorption of organic molecules is not always directly on to the metal surface [32] but in some cases occurs through already adsorbed chloride or sulphate ions at the interface. The lesser interference by sulphate ions might be the reason for the lower adsorption and the inhibition of corrosion [33]. Beyond 400ppm, further increase in surface coverage with inhibitor concentration is marginal, showing that an optimum concentration has been reached (Fig. 3).

Variation of surface coverage in the presence of different concentrations of PMA in 1 M HCl and 0.5 M H2SO4 on mild steel after 2 hours immersion time.
3.2 EIS
The EIS results were analysed using the equivalent circuit [−R (CR) −]. The Nyquist plot at various concentrations of the inhibitor showed single depressed capacitive semicircles and the diameter of the capacitive loop increased with increase in inhibitor concentration (Fig. 4), suggesting that inhibition of corrosion is achieved by controlling the charge transfer process [34]. In this equivalent circuit, Rs is the solution resistance, Rct is the charge transfer resistance and CPE is a constant phase element which is placed in parallel to the charge transfer resistance element. Thus, in this situation pure double layer capacitance (Cdl) is better described by a transfer function with constant phase element to give a more accurate fit [35,36].

(a) Nyquist plots for mild steel in 1M HCl solution in absence and presence of various concentration of PMA (b) Nyquist plots for mild steel in 0.5 M H2SO4 solution in absence and presence of various concentration of PMA
Where,
Y0 is admittance of the corrosive system at 1 rad s−1
n is a constant (−1 ≤ n ≤ 1). While n = 0, the CPE represents a pure resistor, if n = +1, it represents a pure capacitor and if n = −1, it represents an inductor [20]. ω is the angular frequency at which the imaginary part of the impedance is the maximum.
The capacitive loops have depressed semicircular appearance, 0.5 ≤ n ≤ 1, which is referred to as frequency dispersion as a result of the non-homogeneity [37,38] or the roughness [39] of the solid surface. The value of angular frequency can be calculated using the following expression [20].
The double layer capacitance, Cdl, for a circuit indicating a CPE is calculated from the following equation [40,36].
As a result increased surface coverage (θ) Rct values increase with increase in inhibitor concentration as evidence from Table 2 [41]. The decrease in local dielectric constant and / or an increase in the thickness of the electrical double layer is the cause for the decrease in Cdl and Yo values with increase in the inhibitor concentration, which might also be due to the gradual replacement of water molecules by the organic molecules on the metal surface [42]. Slightly higher IE values is observed in EIS studies, when compared to that of weight loss measurement and the efficiencies were found to be 95.7% and 92.8% at 400ppm inhibitor concentration in HCl and H2SO4 media respectively. The result confirms that the inhibitive performance of the schiff base (PMA) is better in HCl rather than in H2SO4 medium.

Electrochemical impedance parameters obtained for the corrosion of mild steel in 1.0M HCl and 0.5M H2SO4 solutions at different concentrations of the inhibitor.
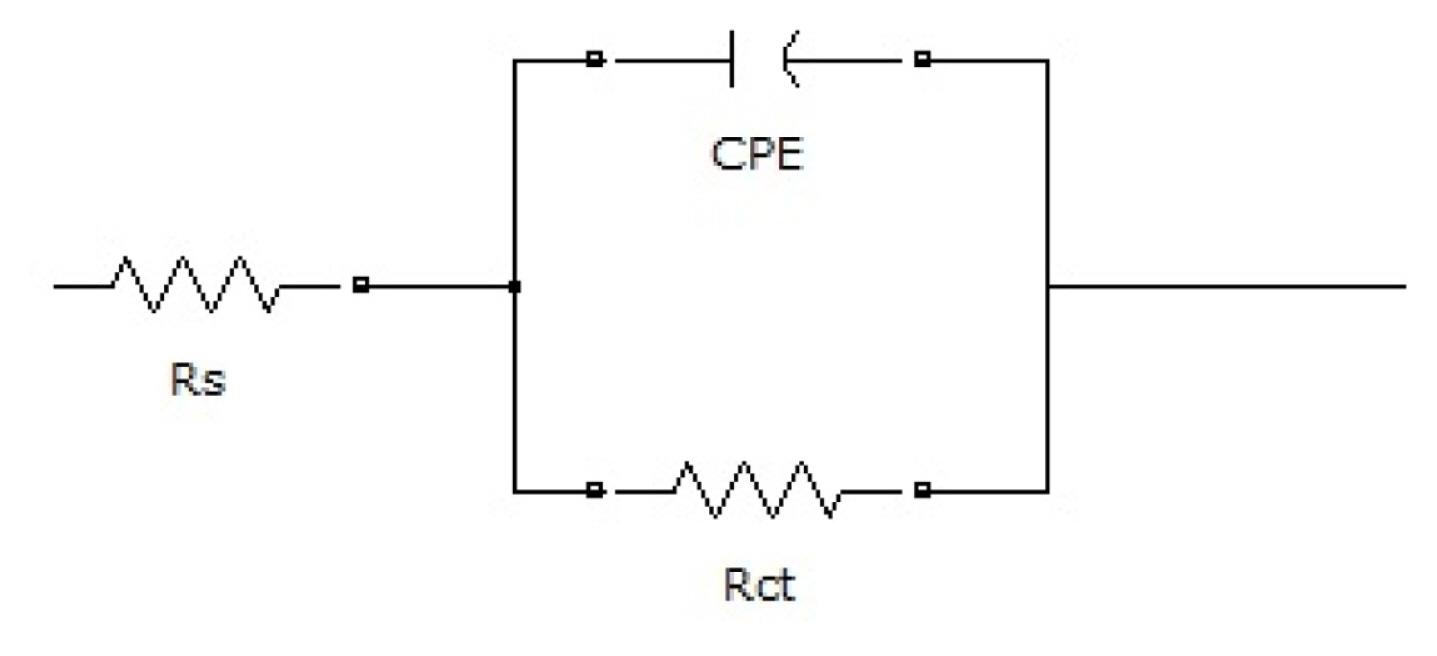
Equivalent circuit for the mild steel surface / corrosive media interface with CPE.
3.3 Potentiodynamic polarization measurements
Representative polarization curves for the corrosion of mild steel in the acids with different concentrations of the inhibitor are respectively presented in Fig. 6. The associated electrochemical parameters namely, corrosion potential (Ecorr), corrosion current density (icorr), Tafel slopes (βa, βc), corrosion rate (CR) and the calculated inhibition efficiencies are presented in Table 3. From these results, it is observed that, upon increasing the inhibitor concentration, the corrosion current density decreases and the inhibitor efficiency increases. The addition of the inhibitor affects the anodic mild steel dissolution as well as the cathodic hydrogen evolution reactions as it is evident from the shifts in βa and βc values. This implies that PMA is a mixed type inhibitor [43].
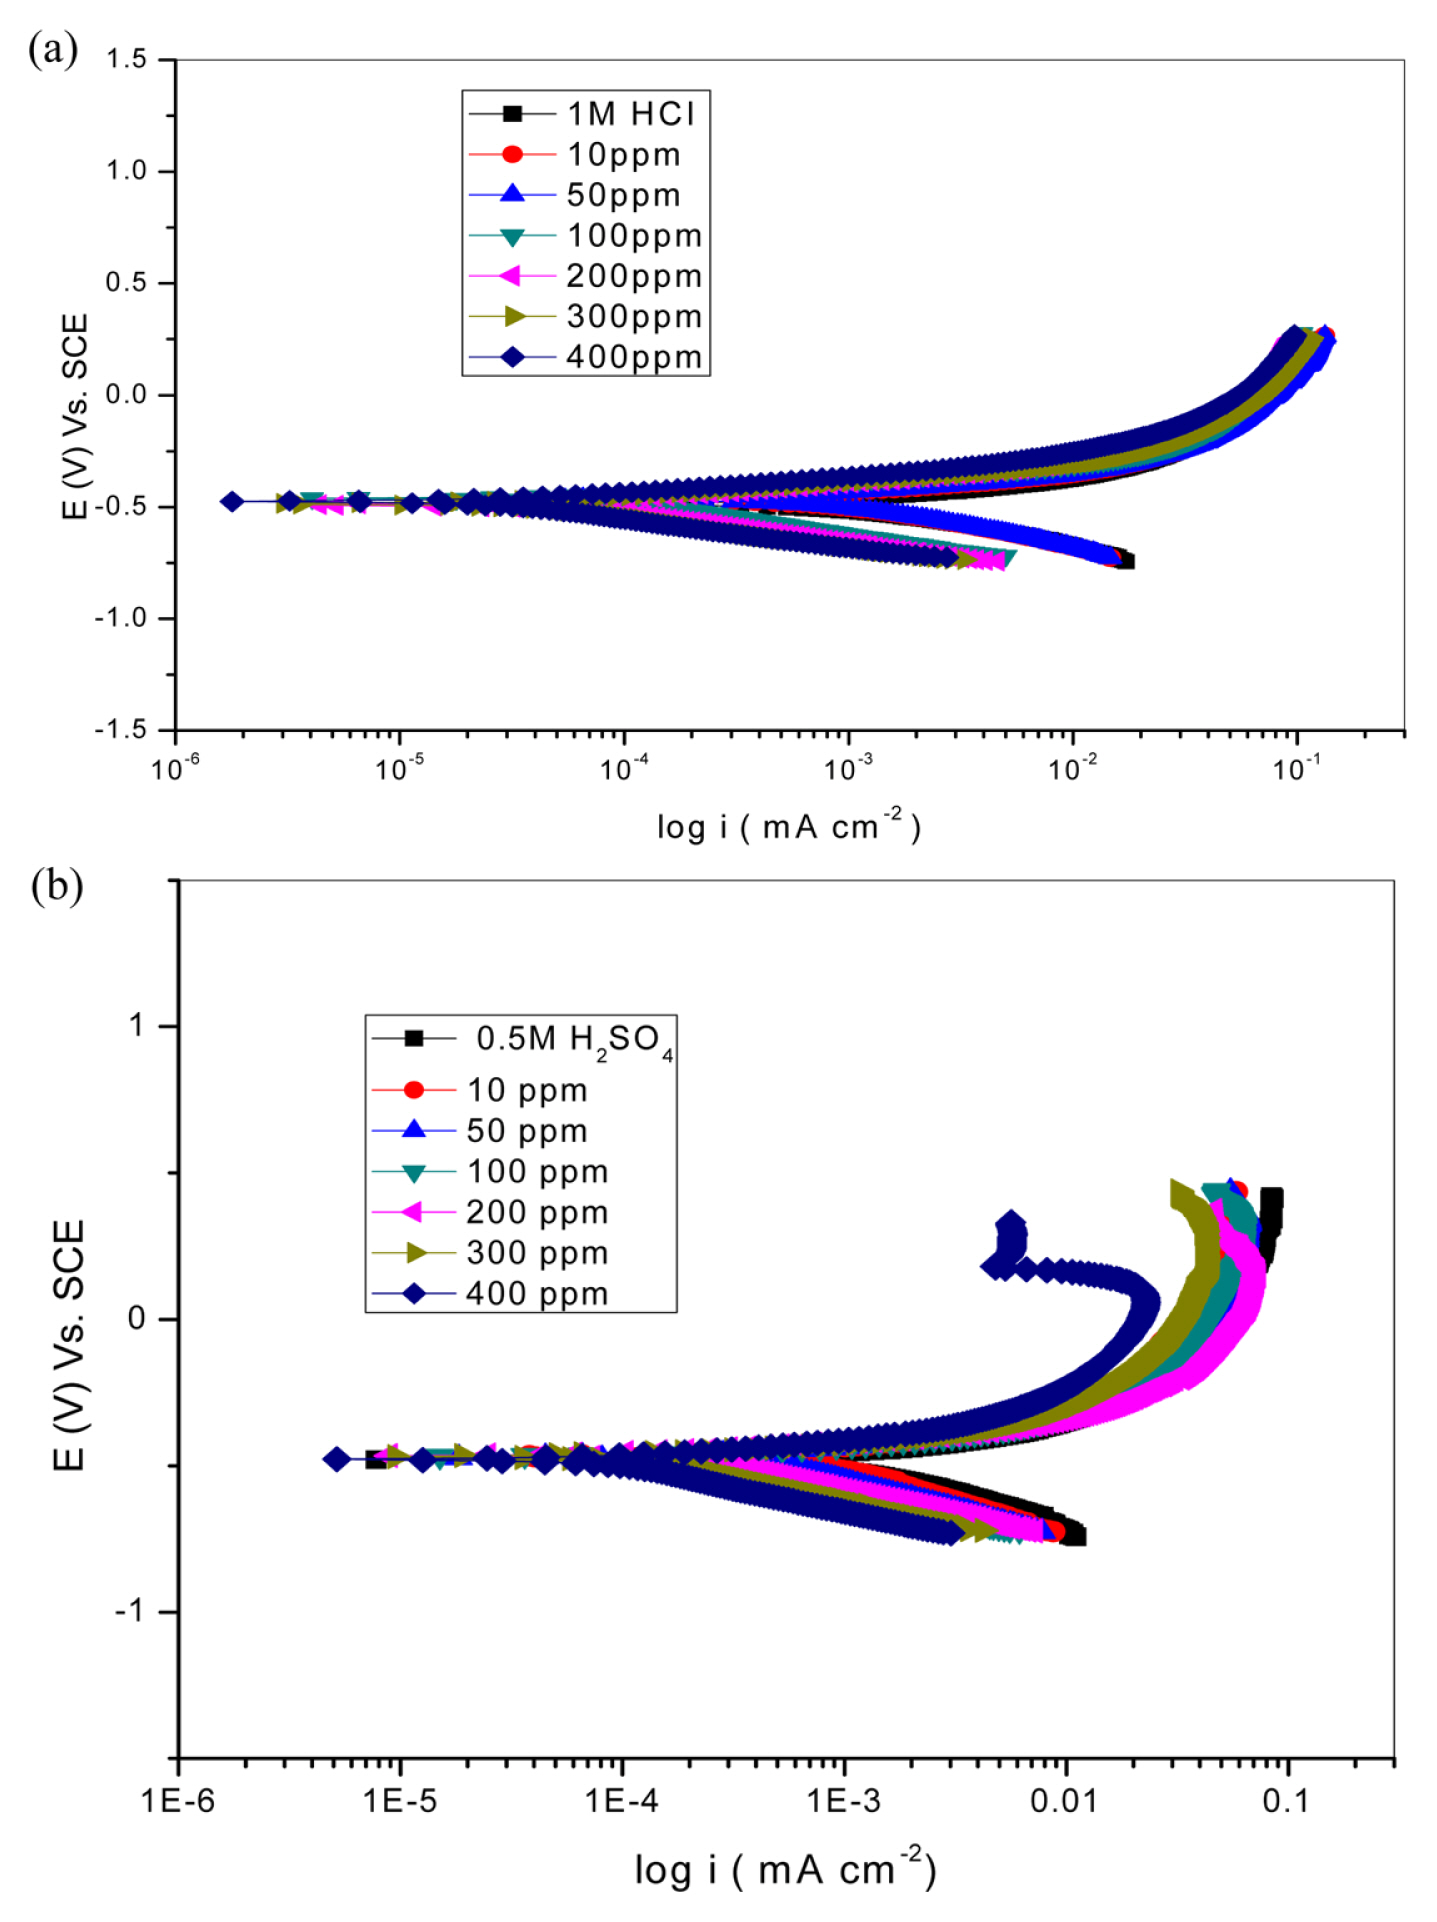
Tafel plots for the corrosion of mild steel in (a) 1M HCl solution at various concentration of PMA (b) 0.5M H2SO4 solution at various concentration of PMA.

Electrochemical polarization parameters recorded during corrosion of mild steel in 1.0M HCl and 0.5M H2SO4 at various concentrations of the inhibitor.
In general, a compound is considered to be anodic or cathodic type when the shift in Ecorr is greater than 85 mV; otherwise, it is a mixed type [44]. However, the Ecorr records no significant change in these studies indicating that the inhibitor prevents both the anodic and cathodic reaction by blocking the available active surface by adsorption [45].
3.4 Potential of zero charge (PZC)
In both the medium, the blank and the protected samples show more negative Epzc than that of Eocp as observed from differential capacitance plot (Fig. 7) and reveals that the mild steel surface possess a positive charge and the values are presented in Table 4.

The plot of differential capacitance vs. applied DC potential in (a) 1M HCl solution (b) 1M HCl containing 400 mg/ L of the inhibitor (c) 0.5M H2SO4 solution d) 0.5M H2SO4 containing 400 mg/L of the inhibitor solution.

Excess charge on mild steel electrode in 1.0M HCl and 0.5M H2SO4 solutions
Based on the surface charge, the mechanism is proposed that the reversible adsorption of the anions (Cl− or SO4 2−) followed by anodic dissolution involving the release of electrons from the adsorbed anions to the metal surface and desorption of the adsorbed anions along with Fe2+ ions, after picking up electrons from the Fe atoms [45–49]. The mechanistic steps of dissolution of Fe is presented in the following scheme [47,48]. The schiff’s base molecules, in the protonated form are in equilibrium with the corresponding molecular (unprotonated) form in both the acid solutions. Thus, because of electrostatic repulsion, it is very difficult for the positively charged inhibitor to approach the positively charged metal surface. The anions act as connecting bridges between the positively charged metal surface and the protonated organic inhibitors.
The inhibitor performance of the schiff’s base could occur through the following two processes [50].
Adsorption of the protonated species through electrostatic interaction with the negatively charged surface, which is provided with the specifically adsorbed anion on the metal surface [(FeCl−)ads species]
Chemisorption of the unprotonated schiff base molecules, which are in equilibrium with the protonated ones, through the interaction of unshared electron pair on N atom with the metal surface.
3.5 IR Spectral studies
FTIR spectra were recorded to understand the interaction of inhibitor molecules with the metal surface. Figs. 8 shows the IR spectra of polished metal surface and the inhibitor adsorbed metal surface taken in attenuated total reflection mode in the acid media. The attenuated total reflection infrared (ATR IR) spectra of polished metal surface and corroded metal surface in the presence of inhibitor are different. The appearance of many new peaks could be due to the adsorbed inhibitor molecules onto the metal surface.
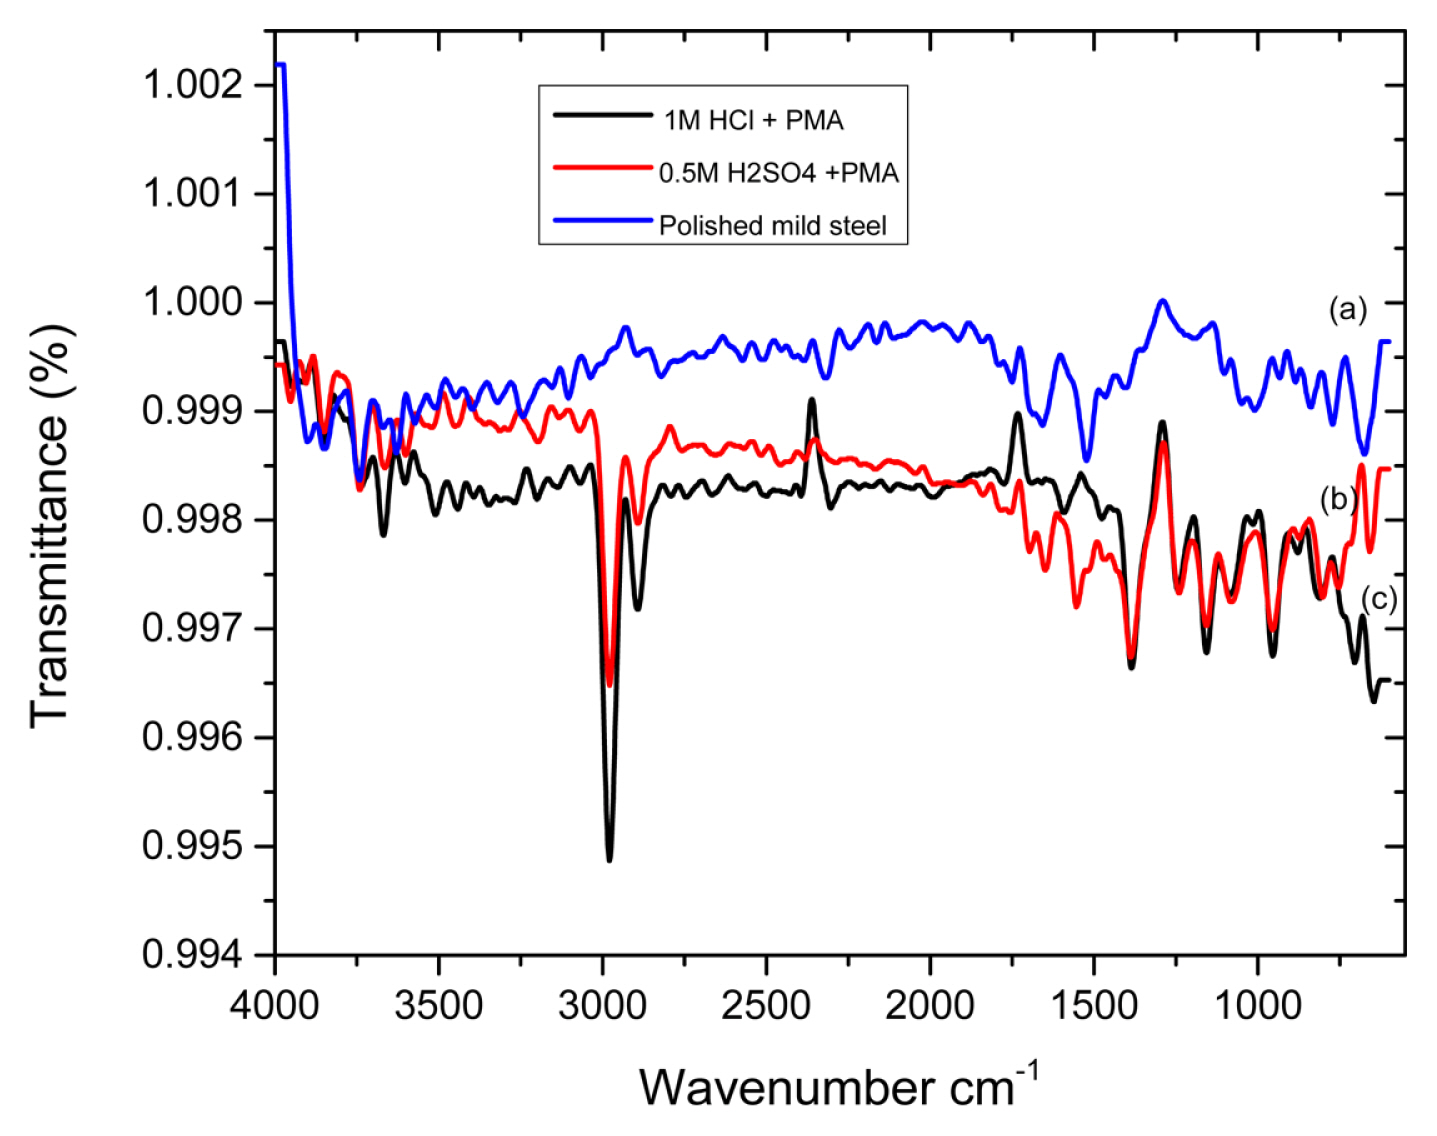
ATR spectra of (a) Polished mild steel (b) 0.5 M H2SO4 and PMA (c) 1 M HCl and PMA.
3.6 Atomic Force Microscope
AFM is considered to be a powerful tool to explore the surface morphology at nano to microscale and has become a new choice to discuss the corrosion process at the metal/solution interface. The three-dimensional (3D) AFM images of the surface of polished mild steel, those immersed in acid (1 M HCl and 0.5M H2SO4) solutions and in acid solution containing 400 ppm of PMA (1 M HCl+ PMA and 0.5 M H2SO4 + PMA) are shown in Fig. 9. The average roughness (Ra) values for the polished mild steel surface, unprotected and protected surfaces are given in Table 5. Lower Ra values for inhibited sample indicates the existence of smoother surface and hence a lower corrosion rate as a result of formation of protective film by adsorption of inhibitor molecules on the surface of mild steel [51,52].
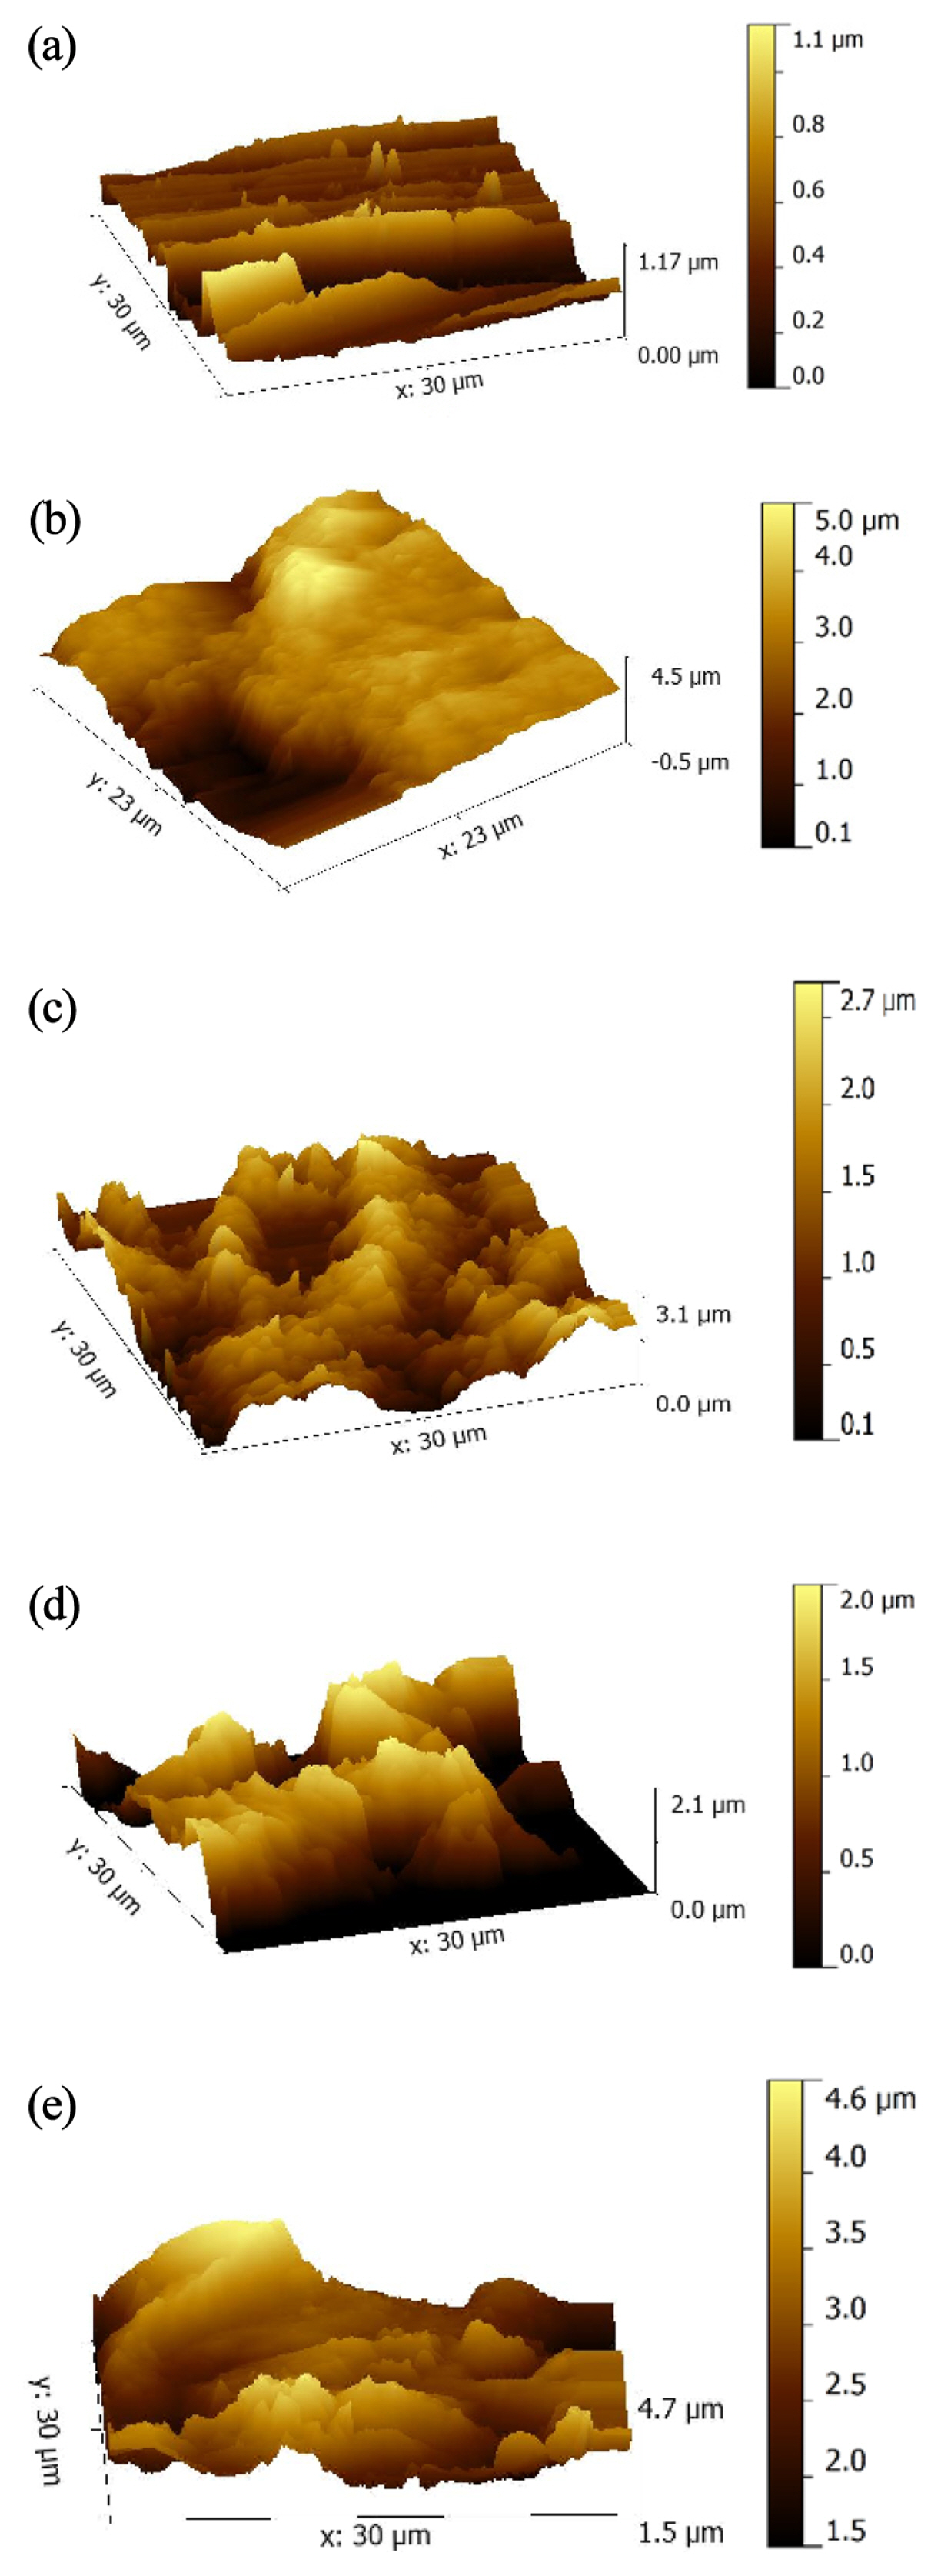
AFM images of mild steel (a) with Polished surface (b) in 1 M HCl (c) in 0.5M H2SO4 (d) in 1 M HCl containing 400ppm of PMA (e) in 0.5M H2SO4 containing 400ppm of PMA.

AFM data for mild steel surface in different environment
3.7 Adsorption isotherm
Inhibition of corrosion of metals by organic inhibitors is a result of their adsorption on the metal surface. Four types of interactions may take place involving organic molecule at the metal solution interface [53]:
Electrostatic attraction between charged molecules and charged metal surface
Interaction of unshared electron pairs in the molecules with the metal surface
Interaction of π - electron of the inhibitor molecule with the metal surface and
A combination of all the above.
Adsorption isotherms can provide important clues on the nature of metal inhibitor interaction and determination of the type of adsorption isotherm is achieved by taking into account the degree of surface coverage (θ) as a function of inhibitor concentration [54]. The surface coverage values were calculated employing equation (8).
where,
icorr & i’corr = Corrosion current densities of inhibited and uninhibited systems respectively
Rct & R’ct = Charge transfer resistance at inhibited and uninhibited systems respectively
CRinh = Corrosion rate of the metal in inhibited solution
CRb = Corrosion rate of the metal in blank solution
The plot of C/θ against inhibitor concentration C is a straight line (Fig. 10). The linear plot with high correlation coefficient (0.9775 and 0.9765) clearly reveals that the adsorption process obeys the Langmuir isotherm, which could be expressed as follows [55].
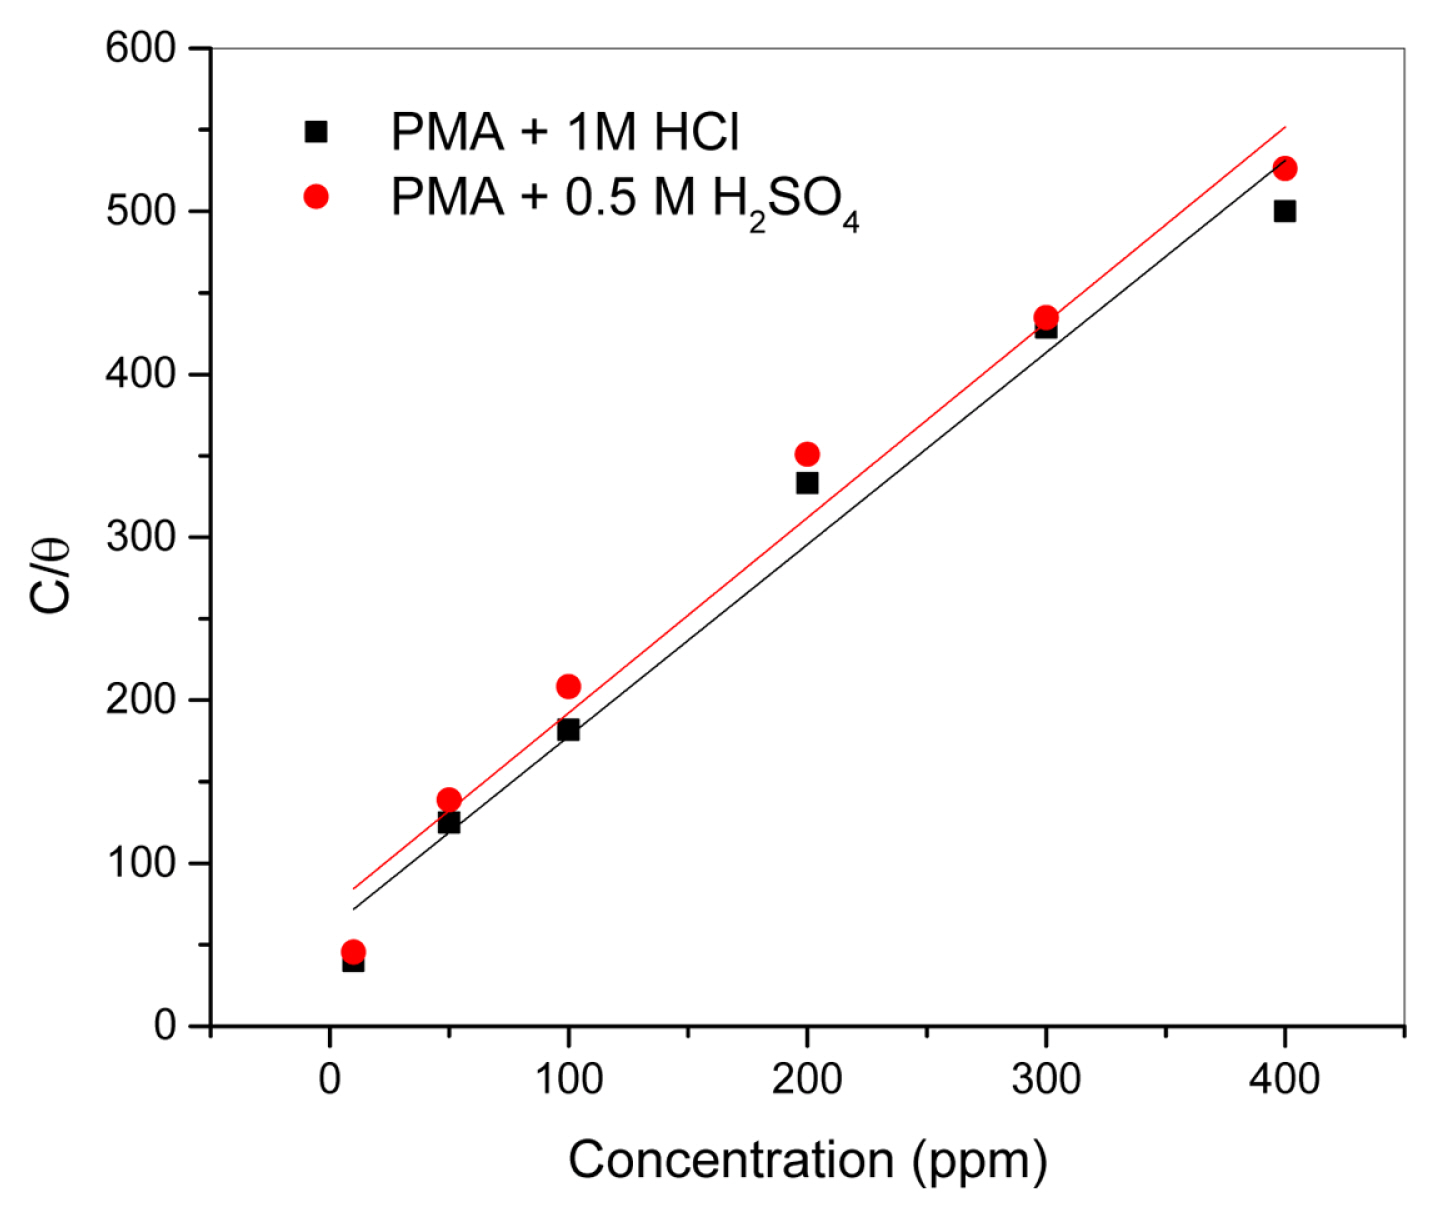
Langmuir adsorption plots for mild steel in 1 M HCl and 0.5M H2SO4 containing various concentrations of PMA at 30°C.
Where, Kads is a adsorption equilibrium constant.
Free energy of adsorption (ΔGads) can be calculated using equation 10.
The value of ΔGads for adsorption of PMA in 1M HCl and 0.5 M H2SO4 solution was found to be −25.00 and −24.02 respectively. The negative value of ΔGads suggests that PMA is spontaneously adsorbed on to the mild steel surface. According to literature, if ΔGads values are in the range of −20 kJ/ mol and −40 kJ/mol represent both physisorption and chemisorption [56] on the metal surface. Thus in the present study on HCl and H2SO4 solution the PMA molecules get adsorbed on the metal surface by both physisorption and chemisorption through electrostatic interaction between the anion bridges and the protonated inhibitor and also through direct interaction between the heteroatoms of the inhibitor and the metal surface respectively.
3.8 Adsorption kinetics
The corrosion process is a chemical reaction in which the Fe atoms at the metal surface react with the negatively charged anions (OH−, Cl−, SO4 2−). Temperature has its influence on the interaction between the mild steel surface and the acidic media in the absence and in the presence of inhibitors [57]. To assess the influence of temperature on corrosion and corrosion inhibition processes, the weight loss measurements were carried out at 30 – 60°C temperature range. The results obtained indicate that corrosion rate increase with temperature both in inhibited and uninhibited solutions. The dependence of corrosion rate on the temperature can be regarded as an Arhenius-type process, the rate of which is given by equation 11 [58].
Where,
CR = corrosion rate, Ea = Activation energy,
R = Molar gas constant, T = Absolute temperature,
A = Frequency factor
The Arhenius plots of 1/T against log CR (Fig. 11) were constructed and from the slopes Ea values were calculated and summarized in Table 6. It is evident that the values of the apparent activation energies for the inhibited solutions are higher than that in the uninhibited solutions indicating that the inhibitor induces an energy barrier for the corrosion reaction leading to the decrease in rate of corrosion [59]. Literature revealed that the higher Ea value for corrosion process in the presence of the inhibitor is ascribed to its physical nature of adsorption [60].
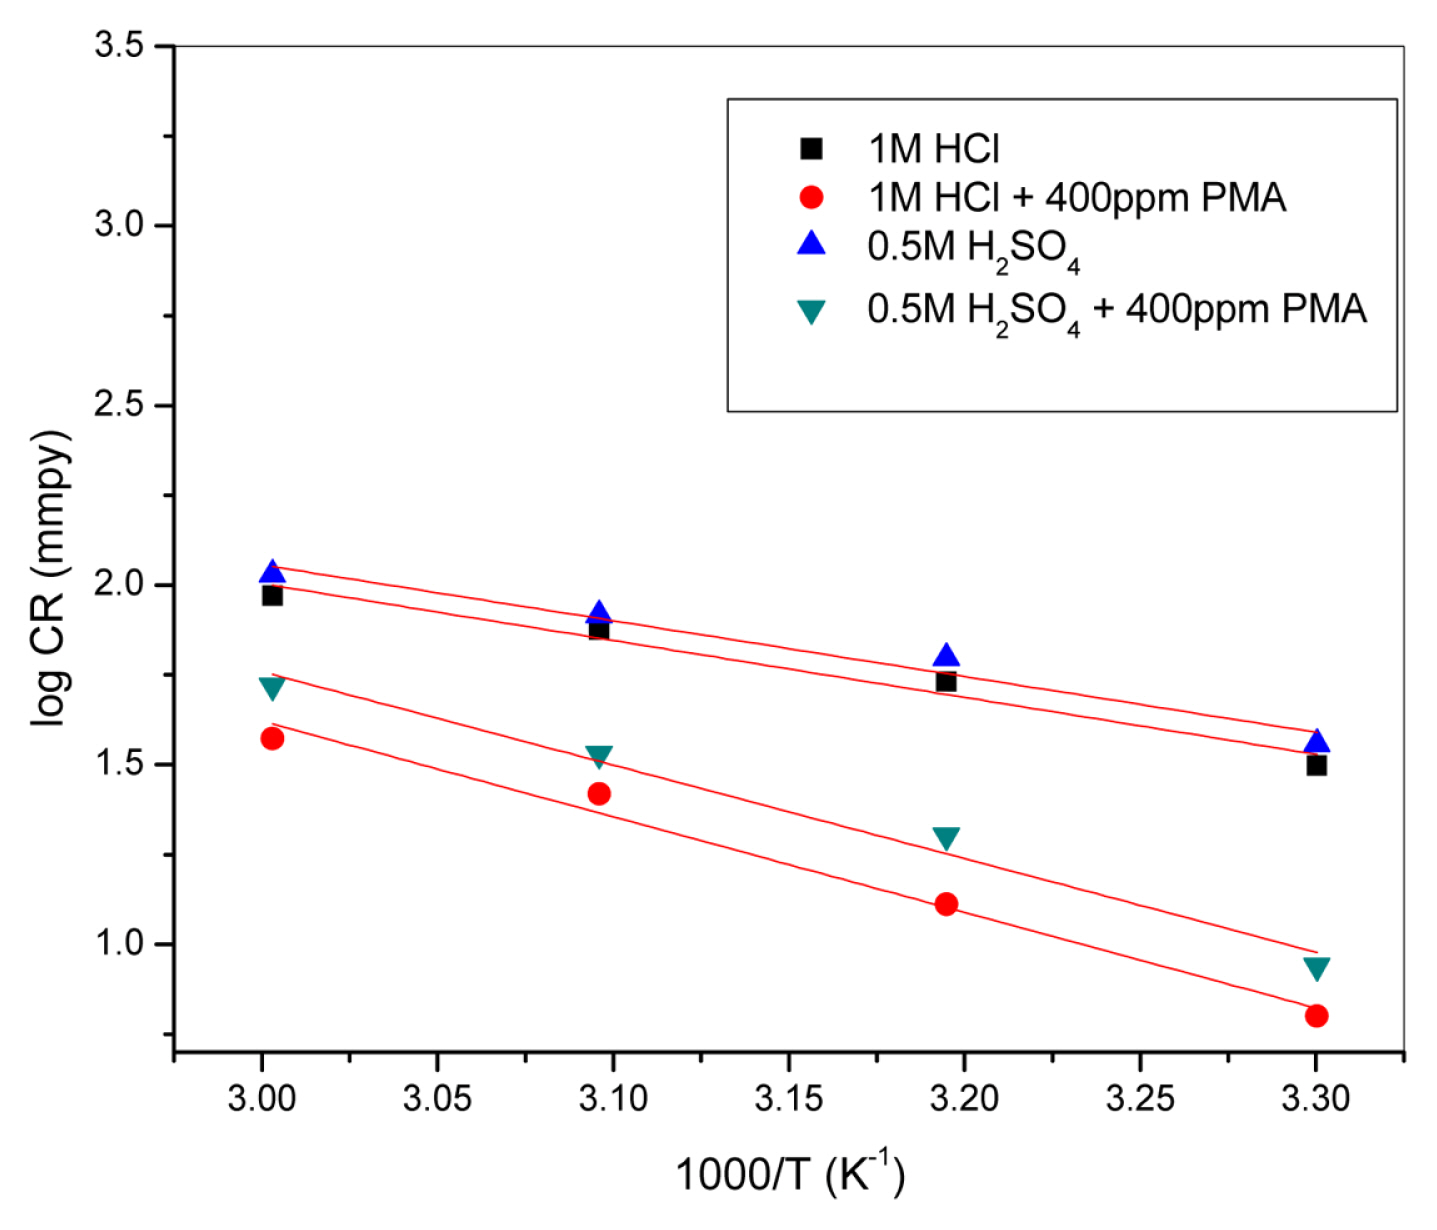
Arhenius plots for corrosion of mild steel in (■) 1M HCl solution (●) 1.0M HCl containing 400 mg/L of the inhibitor, (▲) 0.5M H2SO4 solution (▼) 0.5M H2SO4 containing 400 mg/L of the inhibitor.

Values of Ea of PMA adsorbed on mild steel surface at 30°C, 40°C, 50°C and 60°C.
4. Quantum Chemical Studies
Density Functional Theory is found to be successful in providing insights into the chemical reactivity and selectivity in terms of global parameters, such as electronegativity (χ), hardness (η) softness (S), fraction of electron transferred (ΔN), chemical potential (μ), EHOMO, ELUMO and energy difference between LUMO and HOMO (ΔE) [64]. By using density functional theory (DFT) theoretical calculations were made in Spartan 08 program package, at B3LYP/6–31 G (d, p) level of theory. Optimization of the molecular structure was performed in a water phase [65–67]. Unoccupied d-orbitals of a Fe atom in the neutral form accept the electrons from inhibitor molecule and form a co-ordinate bond (Chemisorption). Simultaneously antibonding orbitals of Fe back donate the electrons to the inhibitor molecule (physisorption) which is in the protonated form [68]. This co-ordination and back donation process strengthens the adsorption of different structures of PMA molecule on the mild steel surface.
The HOMO and LUMO population of the studied PMA molecule and the corresponding cases of protonated forms are shown in Fig. 12 and the values are presented in Table 7.
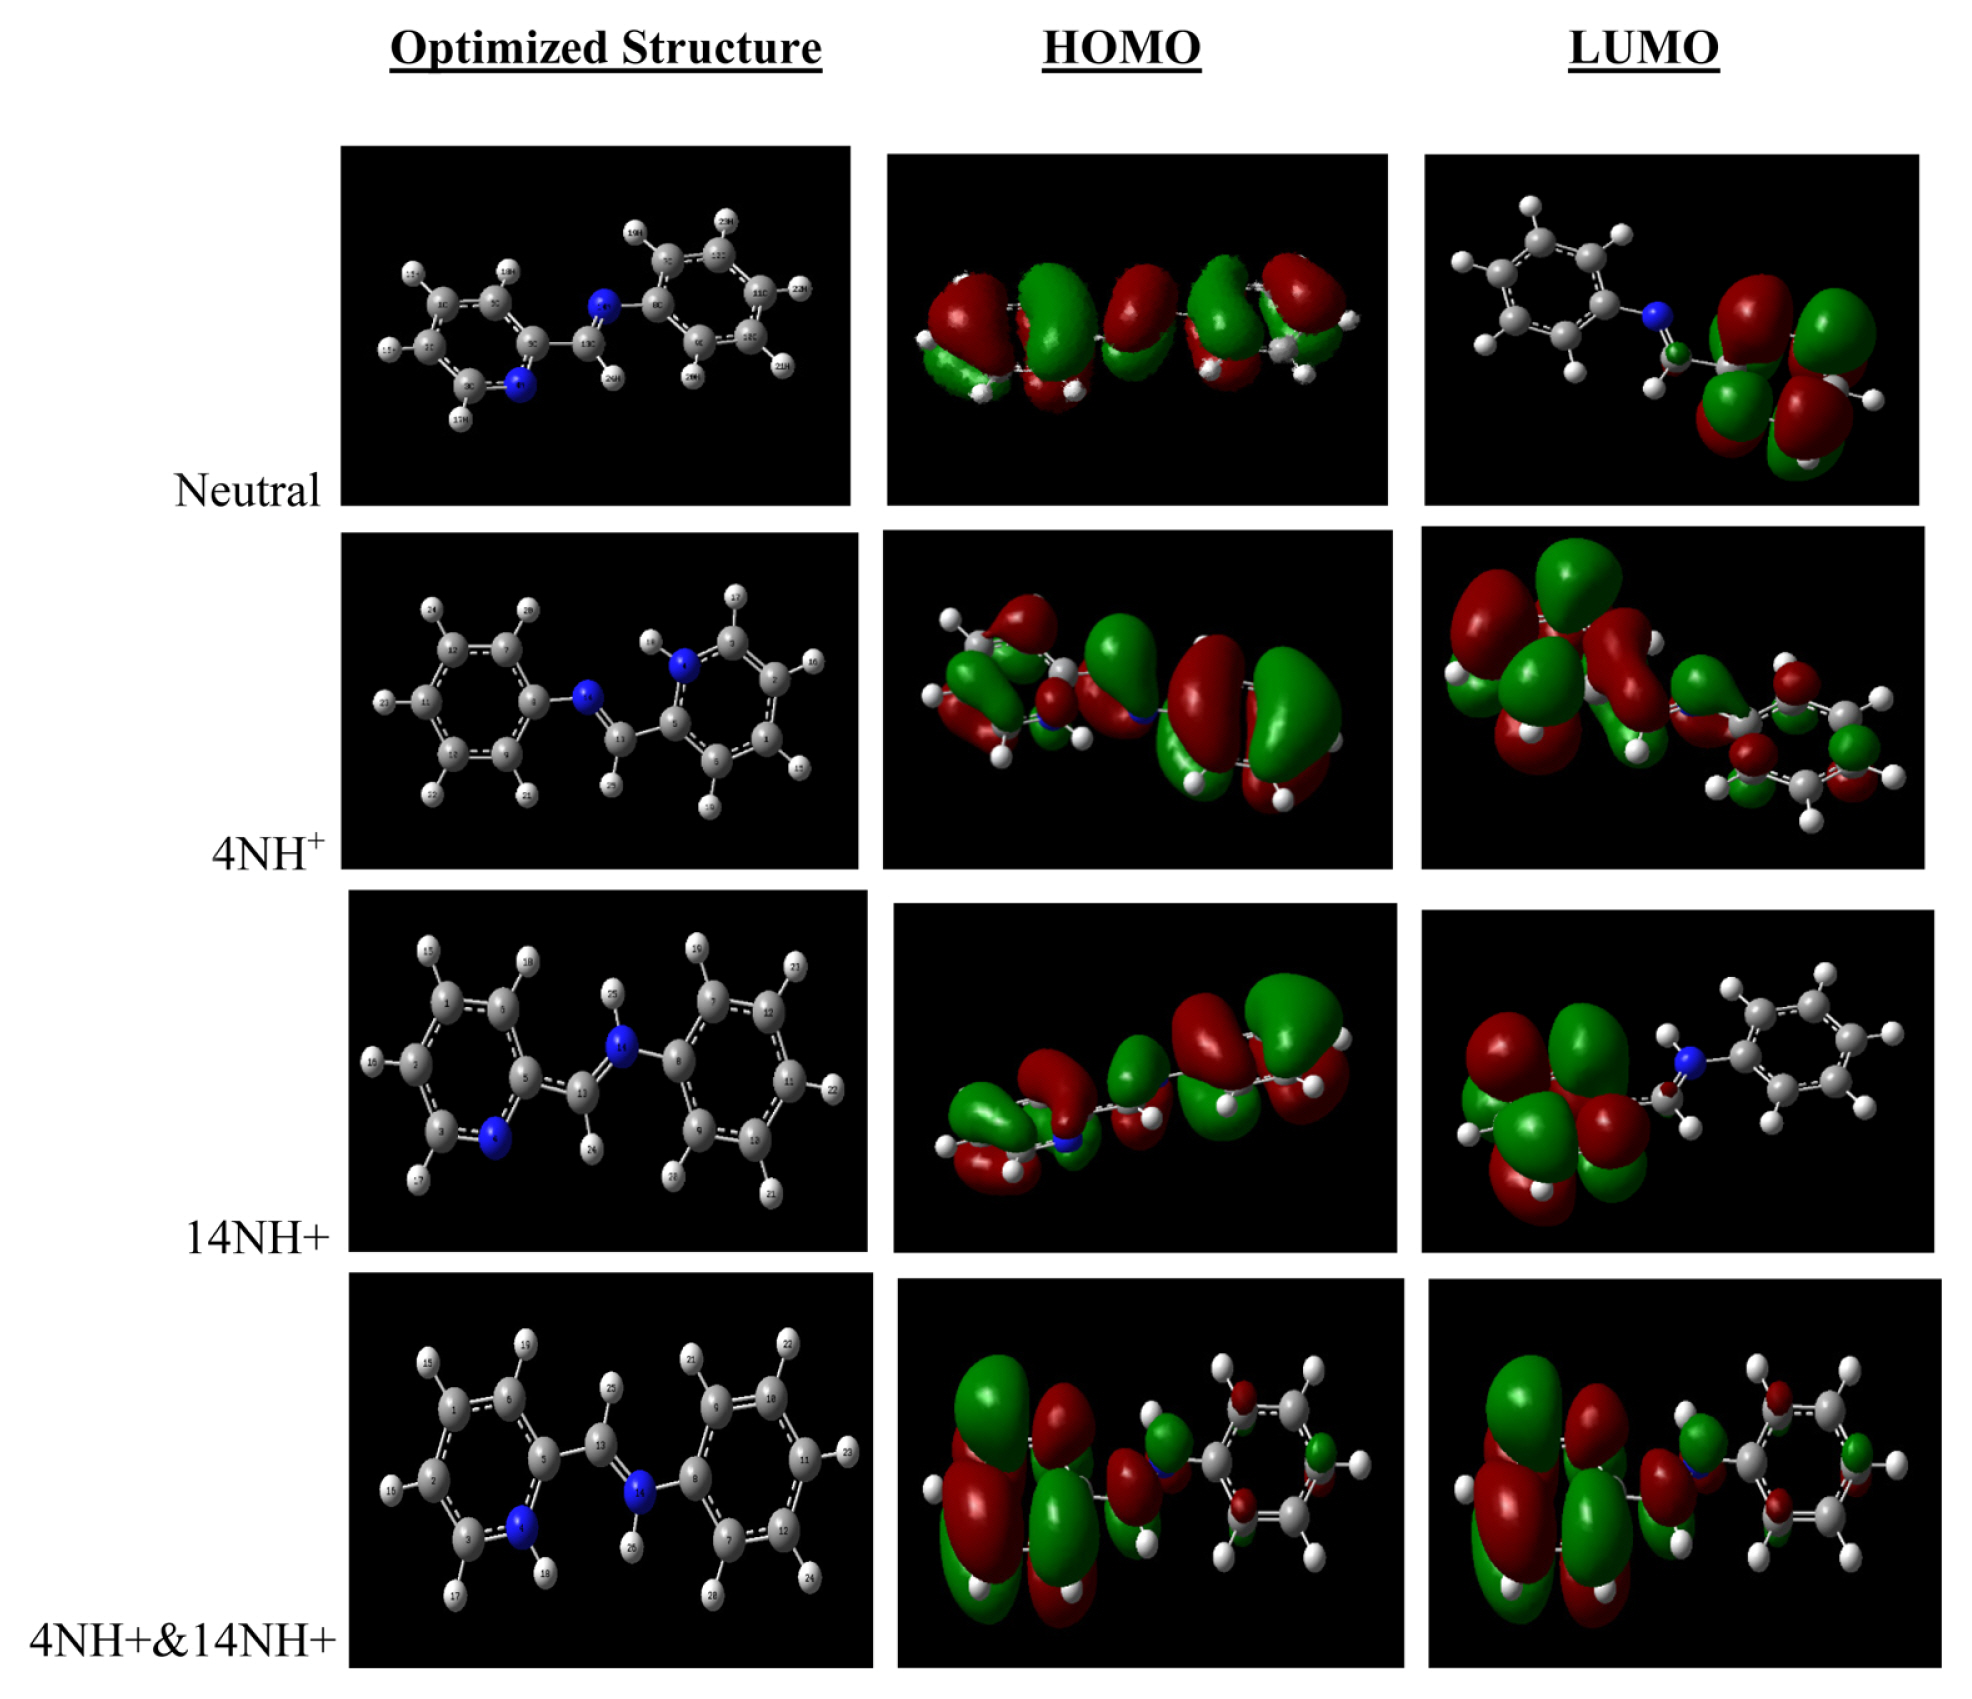
Optimized molecular structure, HOMO and LUMO molecular orbitals of PMA.

Quantum Chemical parameters of PMA
Highest EHOMO observed in protonated structure denotes that it has greater tendency to donate electrons to mild steel surface [68]. However, Lowest ELUMO is observed for neutral form shows its involvement in adsorption process [69]. EHOMO and ELUMO depict the adsorption of both protonated and neutral form during inhibition.
The important parameter that determines the reactivity of the inhibitor molecule towards its adsorption on to the metallic surface is the energy gap between the HOMO and LUMO of the molecule. For effective overlapping, the energy gap must be low. As ΔE decreases, the reactivity of the molecule increases leading to increase in the inhibition efficiency of the molecule [69]. The lower ΔE values observed for the protonated structures (7.662, 6.901 and 7.052) when compared to that of the neutral form of the inhibitor molecule (8.173) reveals that the adsorption occurs predominantly through protonated structures [70,71].
The information on the contact surface between the inhibitor and the metal is given by the molar volume. The inhibition efficiency is usually proportional to the fraction of the surface covered by the adsorbed inhibitor [72]. The protonated structure of PMA has the highest molar volume than the neutral form which provides the largest coverage area and the highest inhibition efficiency.
The fraction of electrons transferred to the metal from the inhibitor is another vital factor. In general, the inhibitor efficiency increases with increase in electron donating ability of the metal surface provided the ΔN should be less than 3.6 [73,74]. Hence, the fraction of electrons transferred (ΔN) from the Schiff base to the metal is calculated from following equation 12 and presented in Table 11 [67,70].
In the present study, protonated form of PMA has a higher ΔN and hence shows better inhibition.
The hardness and softness are also very important to measure the molecular reactivity. Molecule with low hardness and high softness value can be expected to have highest inhibition efficiency [75,76]. Protonated form of PMA has low hardness and high softness values. Hence it adsorbs more easily than the neutral form.
From the above results, it is clear that both physisorption and chemisorption are possible and also it is noted that physisorption dominates. The results are in accordance with the observed ΔGads values (−25.00 and −24.02 for HCl and H2SO4 respectively).
To find the protonation place on the inhibitor, Mulliken population analysis was carried out. It is clear from Table 8 that in the protonated structure, electron density is accumulated more on nitrogen atom. Hence in acidic solution, the nitrogen can get protonated easily and electrostatically adsorb on to the metal surface via anion bridge [77]. This is in accordance with the ΔGo values calculated from the Langmuir adsorption isotherm and physisorption dominates over chemisorption.

Mulliken Charge distribution of PMA
5. Conclusions
The effectiveness of the newly synthesised schiff base PMA as an inhibitor for the corrosion of mild steel in 1 M HCl and 0.5 M H2SO4 solutions was studied by using weight loss, electrochemical and quantum chemical methods. The following are the conclusions drawn:
The schiff base is a good inhibitor for mild steel in both the media.
Protection efficiency has increased with increase in inhibitor concentration and a 400ppm dose was observed to be an optimum concentration.
The results of EIS showed that the increase in Rct and decrease in Cdl with inhibitor concentration is due to the increase in the thickness of the electrical double layer and a decrease in local dielectric constant respectively.
Tafel curves indicate that the inhibitor acts as a mixed type
Inhibition is achieved by the adsorption of the molecules on to the mild steel surface which follows
Langmuir isotherm. The calculated value of ΔG indicates that the adsorption is spontaneous as well as physical in nature.
Surface charge determination shows that the surface of the mild steel is positively charged in these media. The Cl− and SO4 2− act as connecting bridge between the positively charged metal surface and the protonated inhibitor molecule.
The efficiency of the inhibitor obtained from weight loss method, electrochemical methods and Quantum chemical calculations are in good agreement.