1. Introduction
Corrosion is, unfortunately, a natural cycle that requires a precautionary effort in the nature. Therefore, we can define corrosion as a kind of natural disaster. In fact, corrosion is almost an inevitable and bleeding disaster for the whole world. Even today, the aging of a person can be described as a natural corrosion [1]. Perhaps natural corrosion, aging cannot be avoided, but measures of metal decay can be taken. One of them is inhibitor utilization. There are many dyes used in commercial and industrial areas. However, they are rarely used in corrosion inhibition. Azo dyes are utilized in industrial processes such as textiles, pharmaceutical, cosmetics, dye manufacturing etc. [2].
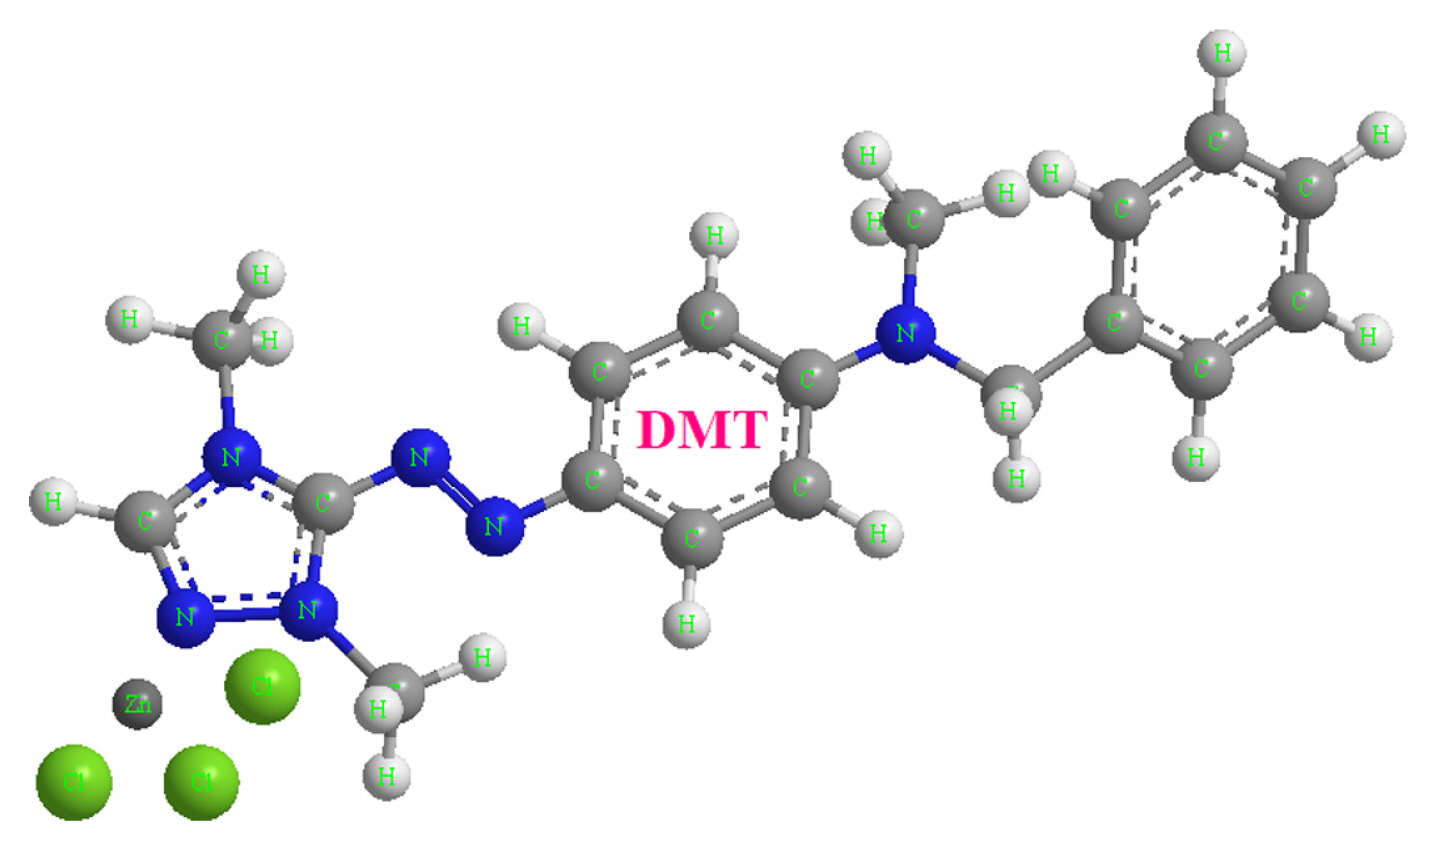
This compound examined in this study that comes from the azo dyes class, and is investigated for its inhibitor property, is known as Maxilon Red GRL in industrial processes. DMT is an industrial dye and has been used as a represented compound of azo dyes worldwide for many years. These kinds of dyes are described as among the azo dyes which must be taken into consideration in terms of living organisms for industrial fields [3,4]. When we compare azo dyes with other dyes, they have many advantages such as low cost, simple and short synthesis process etc. [5]. The most widely used azo dyes among the inhibitors are often preferred due to their economical easy availability and applications in industrial areas such as carpet, fibre dyeing [6–8]. DMT is a type of cationic azo dye according to the chemical structure (Fig. 1). Azo dyes like DMT have good high build up and exhaustion rate and have been used for the acrylic printing and wet tow dyeing.
The -(N=N)-group, which is found in the chemical structures of azo dyes and is specific for them, is primarily the most effective part of the inhibitor in corrosion process. While this group helps prevent corrosion of the metal, it also increases the adsorption effect on the metal surface. These atoms act as adsorption centres and block the active corrosion sites in the acidic solution, because they contain heteroatom in its structure, such as nitrogen, have highly electron-donor ability, and interact with the metal surface and contain unpaired electron pairs in their structures [6,9–12]. Besides, π-electrons that are delocalized in the aromatic ring are also very important for the adsorption of corrosion inhibitors. Since the electrons are donated to the ring through the π-electrons, making the aromatic ring effective against corrosion [13]. According to literature, no results have been published concerning the corrosion inhibition of the DMT, cationic azo dye on mild steel in 1.0 M HCl solution.
The objective of this study is to examine the effect of DMT, a cationic azo dye, in 1.0 M HCl solution as an industrially applicable inhibitor on mild steel corrosion by implementing electrochemical methods. It is also aimed to include this inhibitor in applications in the industrial context.
2. Experimental
2.1. Materials
The corrosion experiments were realized on a mild steel specimen of the following percentage composition (wt.%): 0.08400% C, 0.01100% P, 0.06030% Cr, 0.00222% Nb, 0.07890% Ni, 0.01100% V, 0.01040% Mo, 0.21700% Cu, 0.01900% S, 0.40900% Mn, 0.01620% Sn, 0.10200% Si, 0.00198% Co and the rest is Fe. The samples were inserted in a cylindrical mold containing polyester and the surface area 0.5024 cm2 of electrodes were exposed to the acidic media. The surfaces of the mild steel electrodes were polished with 150, 600 and 1000 grids of abrasive paper before each measurement. The surfaces of electrodes were cleaned with acetone and distilled water and allowed to dry at room temperature.
2.2. Inhibitor and test solutions
All chemicals utilized in this paper are bought in Merck and Sigma Aldrich Chemical Company and used for analytical purity. The chemical structure of solid DMT in powdered, pearl-like appearance, in which the inhibitor property is investigated, is given in Fig. 1. It was used the 1.0 M HCl solution as an aggressive media. Five different concentrations (1.0×10⁻⁶ M, 5.0×10⁻⁶ M, 1.0×10⁻⁵ M, 5.0×10⁻⁵ M and 1.0×10⁻⁴ M) of DMT inhibitor in 1.0 M HCl were used in the experiments. 1.0×10⁻³ M stock solution of the DMT inhibitor was prepared and all concentrations were diluted from this stock solution.
2.3 Electrochemical experiments
Electrochemical experiments were realized in acidic medium in without and with diverse DMT concentrations. Electrochemical methods used in experiments are EIS, LPR and potentiodynamic polarization methods. All electrochemical measurements were conducted in a computer controlled CHI 660B model electrochemical analyser. In these experiments, three conventional electrode techniques were used. The first of these electrodes is mild steel as the working electrode. The second one, the counter electrode is a platinum plate with a surface area of 1.0 cm2, and the third one is Ag/AgCl as the reference electrode. All potentials granted in this study are given by reference electrode. Before all electrochemical measurements, the working electrodes were immersed in the working solution for one hour in order to stabilize the system for the open circuit potential (Ecorr).
EIS measurements were realized on the Ecorr at a frequency range of 1×10⁵ to 5×10⁻³ Hz with 5 mV amplitude applied to the system. One, 24, 72 and 120 h measurements were taken to examine long-term EIS tests. Surface images were taken 120 h of duration in hydrochloric acid solution with and without DMT azo dye using metal microscope (digital camera integrated OLYMPUS BX-51 model), AFM (Veeco Multimode 8 Nanoscope 3D) and FE-SEM (Zeiss Geminisem 500 with computer controlled) techniques. For AFM measurements, the surface morphology on a 10 μm × 10 μm scan size scale was scanned in a 1.0 M HCl solution containing without and with 1.0×10⁻⁴ M DMT. The zero charge potential (Epzc) of mild steel electrode was measured by using EIS technique. The polarization resistance (Rp) values at stable potential were recorded at ± 0.205 V (Ag/AgCl) potential ranges and the Rp versus potential curve was plotted.
LPR experiments were realized at a scan rate of 0.1 mV s−1 ± 10 mV (Ag/AgCl) from Ecorr and Rp was found from the potential slope against current.
The potentiodynamic polarization measurements were recorded ±0.350 V cathodic/anodic potential from Ecorr, respectively. It is applied at a scan rate of 1.0 mV s−1. The potentiodynamic polarization measurements were carried out between 298–328 K ranges of temperatures.
3. Results and Discussion
3.1 EIS, LPR and potentiodynamic polarization experiments
EIS is a fast and easy technique for investigating the preservative features of organic compounds onto metallic materials [14]. This method ensures results that are more trustworthy especially since it does not disturb the metal/solution interface in long-term tests [15]. In order to evaluate the EIS findings obtained at the end of the one hour waiting period, 1.0 M HCl solutions containing uninhibited and containing 1.0×10⁻⁶ M, 5.0×10⁻⁶ M, 1.0×10⁻⁵ M, 5.0×10⁻⁵ M and 1.0×10⁻⁴ M DMT were used as inhibitors. Measurements of EIS, LPR and potentiodynamic polarization were made at 298 K, and the obtained findings are given below [16].
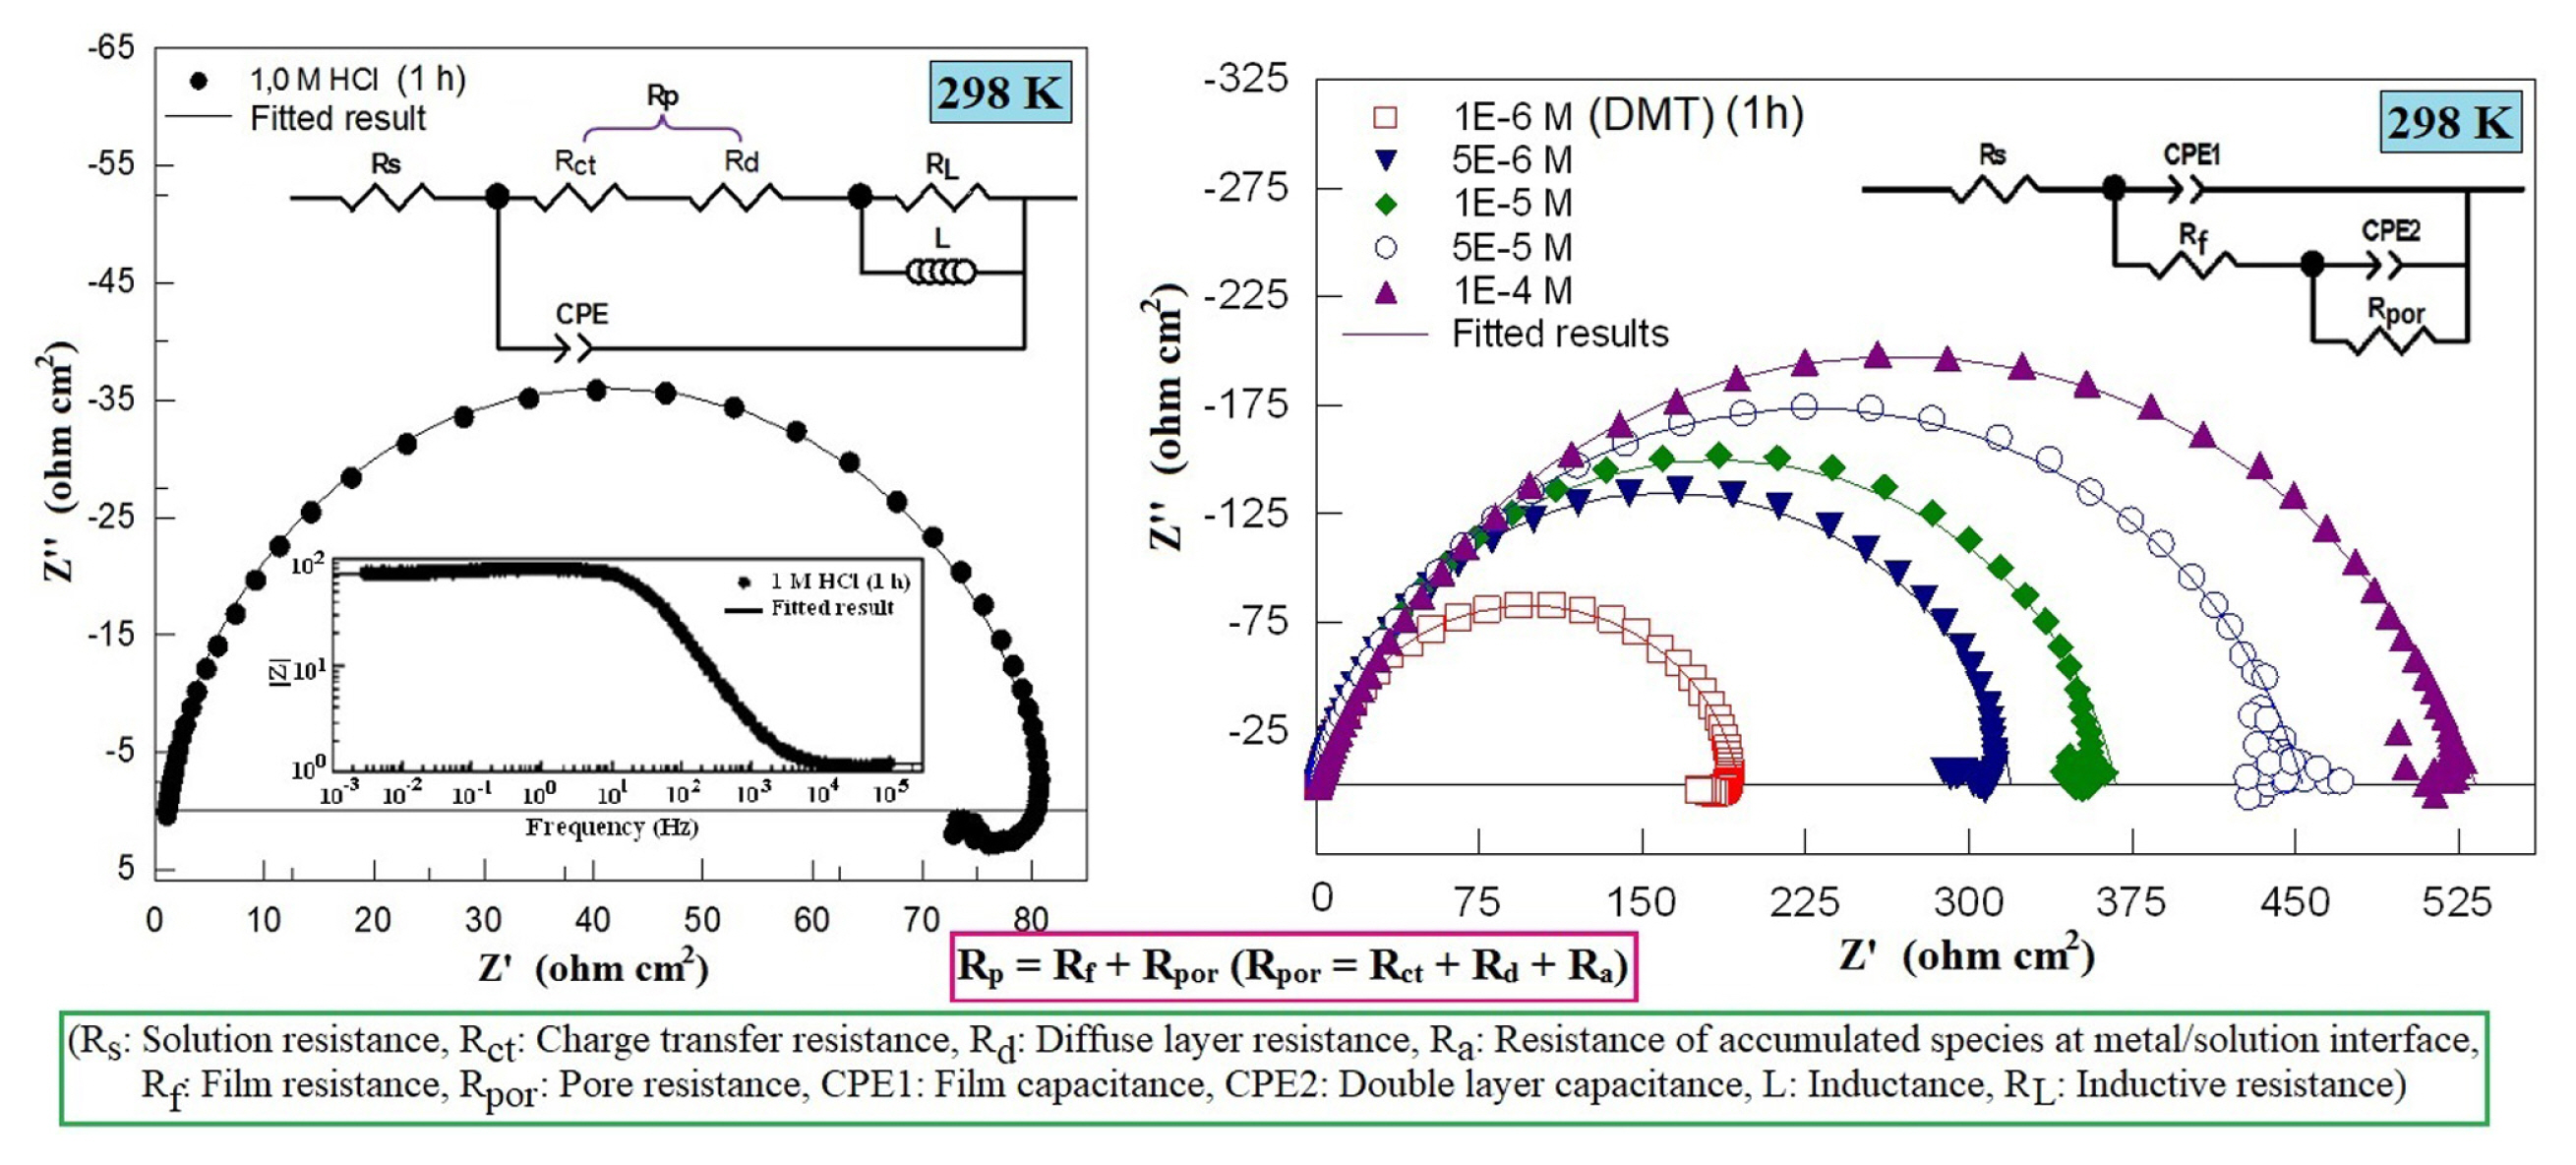
The experimental data of the Nyquist diagrams obtained from the CHI 660B model electrochemical analyser were recorded as “txt” files and the equivalent circuit of the system was created from these data by using Zview2 software. This is done for all Nyquist diagrams. Nyquist diagrams and designed equivalent electrical circuits of the electrodes in hydrochloric acid and whole concentrations of DMT have been demonstrated for 1 h exposure in Fig. 2. Two equivalent circuit models, one for the uninhibited solution and one for all the inhibitor solutions, are proposed and these circuits are embedded in Figure 2 and related parameters are indicated in Table 1.
η% of DMT was determined by the following equation [17]:
where R′p and Rp are in inhibited and uninhibited values, respectively. It is noticed that the addition of DMT inhibitor in 1.0 M HCl solution gives rise to increment of resistance because of the adsorption of DMT molecules on the mild steel surface [18]. This situation is caused by the protective ability of DMT, which points out that the charge transfer process occurring at the interface of the metal/solution was delayed by DMT molecules. The Nyquist diagrams are generally a depressed semicircle for mild steel electrodes and are mostly mentioned to as the frequency dispersion ascribed to roughness and inhomogeneity of surface [19]. Compared with the inhibited solutions, the Nyquist diagram of the blank solution is understood to being highly conducted with charge transfer resistance [20].
According to Table 1 and Fig. 2, it can be expressed that the polarization resistance (Rp) in the process of adsorption to the mild steel surface of the DMT inhibitor in the 1.0 M HCl solution consists essentially of the total of the film (Rf) and pore resistance (Rpor). This pore resistance is also responsible for the charge transfer resistance (Rct), diffuse layer resistance (Rd) and, at the same time, resistance of accumulated species (Ra) such as corrosion products. The impedance diagrams obtained at the end of the onehour immersion period in the uninhibited and inhibited solutions are not semi-circle but semi-elliptical. This result is associated with the frequency dispersion (scattering). While the Rs value in the uninhibited solution was 1.2 W, it did not show a significant change in the inhibited solution, that is, it did not significantly affect the Rs value of the inhibitor concentration. The highest value of Rp was obtained in the 1.0×10⁻⁴ M DMT solution and was 531 W, so that the η% value was 86.4%. As results, Nyquist diagrams in DMT solutions proceed as depressed loops at low and high frequencies. The higher frequency loop forms Rct and Rd, while the lower frequency loop forms Rf and Ra. This finding is harmonious with studies [21–25]. The CPE value was 110 μF/cm2 in uninhibited solution, but this value gradually decreased as DMT was added. The Ecorr value was −0.474 V in the uninhibited solution, but shifted to potentials that are more negative with the rising DMT concentration (Table1).
*Rp and *η% values were also identified by LPR method at the end of 1 h immersion time and are shown in Table 1 with EIS parameters. From Table 1, it can be seen that these values are in good agreement with the EIS values. Considering the results of 1 h immersion time, the high inhibition effect of the DMT inhibitor is thought to originate from heteroatoms such as nitrogen in its structure and from unpaired electron pairs in the structure of this nitrogen atom as well as π-electrons from two aromatic rings in the structure of DMT at the same time. Thus, we can say that the DMT inhibitor achieved a good inhibition by covering a larger area onto surface of the Fe due to the large molecule structure.
Fig. 3 shows the Nyquist diagrams after 24, 72 and 120 h immersion times for diverse concentrations of DMT in 1.0 M HCl for mild steel at 298 K. Referring to Fig. 3, from the impedance (Nyquist and Bode) diagrams, as the duration of immersion increases, the resistance values of both the blank solution and containing the DMT solutions reduces, that is, the diameters of the capacitive loops of Nyquist plots are reduced. Nevertheless, there is good protection in long-term duration for mild steel.
At 24 h of exposure to acidic medium containing DMT inhibitor of mild steel, the electrode surface reached a more stable state than the first hour measurements and a tightly adsorbed protective layer on the electrode surface was formed with DMT molecules. This can be easily understood from the fact that the inhibition efficiency values in Table 2 reach 90.8% to 97.8%. The inhibition efficiency reached 98.2%, the highest value, at the end of the 72 h exposure period with solutions containing 5.0×10⁻⁵ and 1.0×10⁻⁴ M DMT, and after this hour (72 h), the decrease with time was marked in the inhibition values (Table 2).
The time-dependent decrease in the inhibition efficiency is due to the gradual oxidative dissolution of the mild steel in prolonged contact with the corrosive medium and the corrosive effect of chloride ions adsorbable to the inner-Helmholtz layer at the metal-solution interface and the composition of the solution changing near the metallic surface [26–30]. However, at the end of the 120 h exposure period, it is apparently seen that the inhibitor film on the metal/solution interface has begun to be deteriorated and dispersed the frequency, but the protection of the solution containing the DMT inhibitor at the highest concentration is still 93.0%. This result can be interpreted DMT covers the metal surface by composing a strict and preservative layer on the surface.
As shown in Table 2, the addition of the DMT inhibitor to the acidic medium decreased the CPE values for each immersion period and increased the Rp values. However, as expected in the corrosion process, as the duration of immersion increased, the CPE values increased and the Rp values decreased for each concentration. This decrease in CPE values is due to the diminution in the local dielectric constant and/or the rise in the double layer thickness [31,32]. The reason for these events is as follows; it may be due to gradual displacement of previously adsorbed other ions and water molecules because of adsorption of DMT molecules to the mild steel surface. The adsorption of larger inhibitor molecules is also reduced by the upsurge in the double layer thickness. “n” is a type of phase shift and is described as the roughness degree of the surface. In particular, as the concentration increases, the reduction of the value of “n” is another indication that the surface roughness is reduced, that is, adsorbed to the mild steel surface of the organic molecules [33,34].
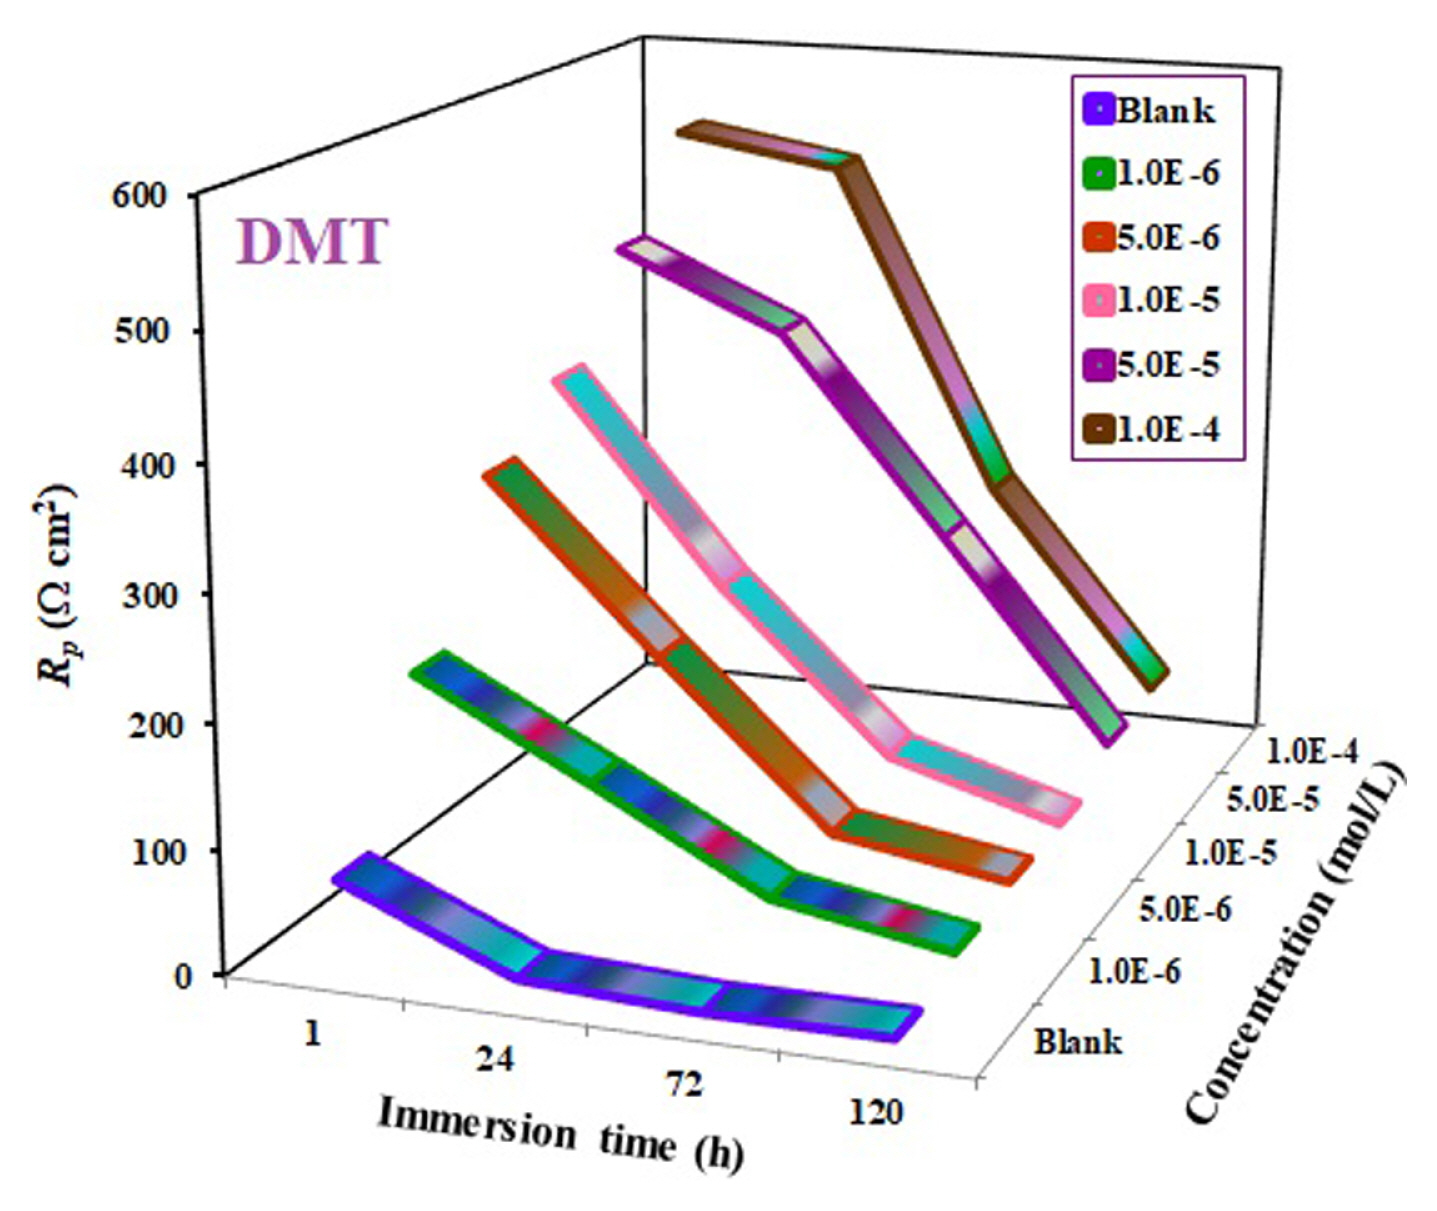
The variation of the Rp values obtained from the Nyquist diagrams depending on the concentration and immersion time is shown in Fig. 4, simplified to a three-dimensional graph.
It appears clearly from Fig. 4 that the Rp values increase with increasing concentration in each immersion period against blank solution. Therefore, the inhibition efficiency values are also increasing. As the immersion time is prolonged, it is clear that the Rp values decrease for each concentration as expected in the corrosion process.
The adsorption of the organic inhbitor to the metal surface can be explained more clearly by the PZC, which is the case where the electric charge density on the surface is zero. The net charge of the metallic surface is calculated by the following formula using EIS measurements [35,36]:
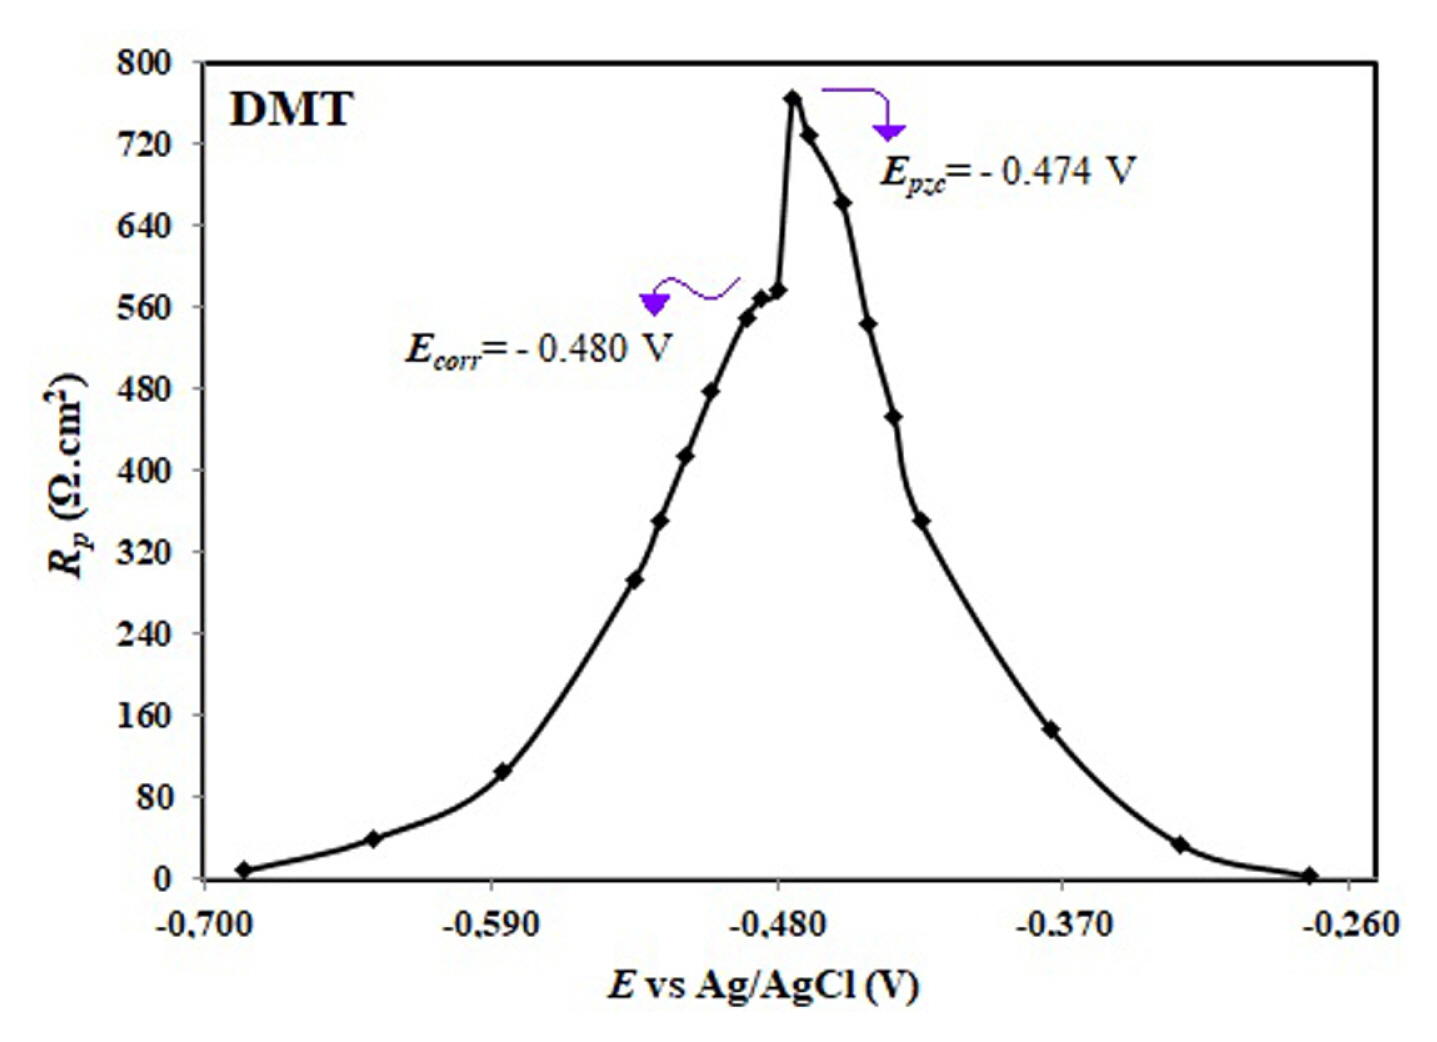
where Epzc is the zero charge potential and the Ecorr is the open circuit potential and y is the surface charge. Metals are usually rounded by positive charged ions when exposed to an aggressive medium, such as hydrochloric acid, owing to the electrical field resulting from the metal/solution interface. The potential of zero charge of the mild steel in hydrochloric acid solution with the addition of 1.0×10⁻⁴ M DMT inhibitor was determined from the EIS measurements after 1 h exposure time. Therefore, the all measured Rp values at stable potential and ± 0.205 V (Ag/AgCl) were recorded and as a result, the Rp against the potential plot was obtained. The plot determined is indicated in Fig. 5. In general, the metal’s surface charge is vital in the corrosion adsorption process in the acidic media. The inhibition mechanism is shaped according to this surface charge. In Fig. 5, the surface charge can be interpreted by comparing the Ecorr to the Epzc position.
The metal surface in the solution can be either positively or negatively charged. If the difference (Ψ) according to Eq. (2) is positive, the net charge of the metal surface is positive. In this case, the adsorption of anions to the surface is preferred, that is, it does not allow adsorption of the protonated inhibitor molecules while allowing the adsorption of chloride (Cl−) ions to the surface. If the difference (Ψ) is negative, the net charge of the metal is negative, and in this case the adsorption of the cations, protonated inhibitor molecules, on the surface is the reason for preference. Thus, the inhibitor molecules constitue a preservative layer onto the metal surface, and this layer contributes to the corrosion resistance by preventing the metal from directly interacting with the chloride medium [37,38]. In Fig. 5, (Ψ) is −0.06 V for 1.0×10⁻⁴ M DMT inhibitor in 1.0 M HCl solution. This indicates that the potential difference is negative, meaning that the surface of the metal is negatively charged. This implies that the protonated cationic DMT molecules interact directly with the metal surface, forming a protective barrier on the mild steel surface [39].
The reason for the high inhibition in time-dependent corrosion measurements can be attributed to the molecular structure of the organic inhibitor. Besides, the large structure of the molecule is very important in the study of corrosion inhibition in terms of the surface area covered. Considering the chemical formula of the molecule, there are two aromatic rings in the DMT molecule, and these two aromatic rings activate the surface area by activating the delocalized π-electrons with the ring. In the structure of DMT there are contributions to hetero atoms other than the effect of aromatic rings. For example, due to the three nitrogen atoms in the triazole ring, the nitrogen atoms in the azo group, especially the unpaired electron pairs over them are highly effective in protecting the metal in the corrosion process.
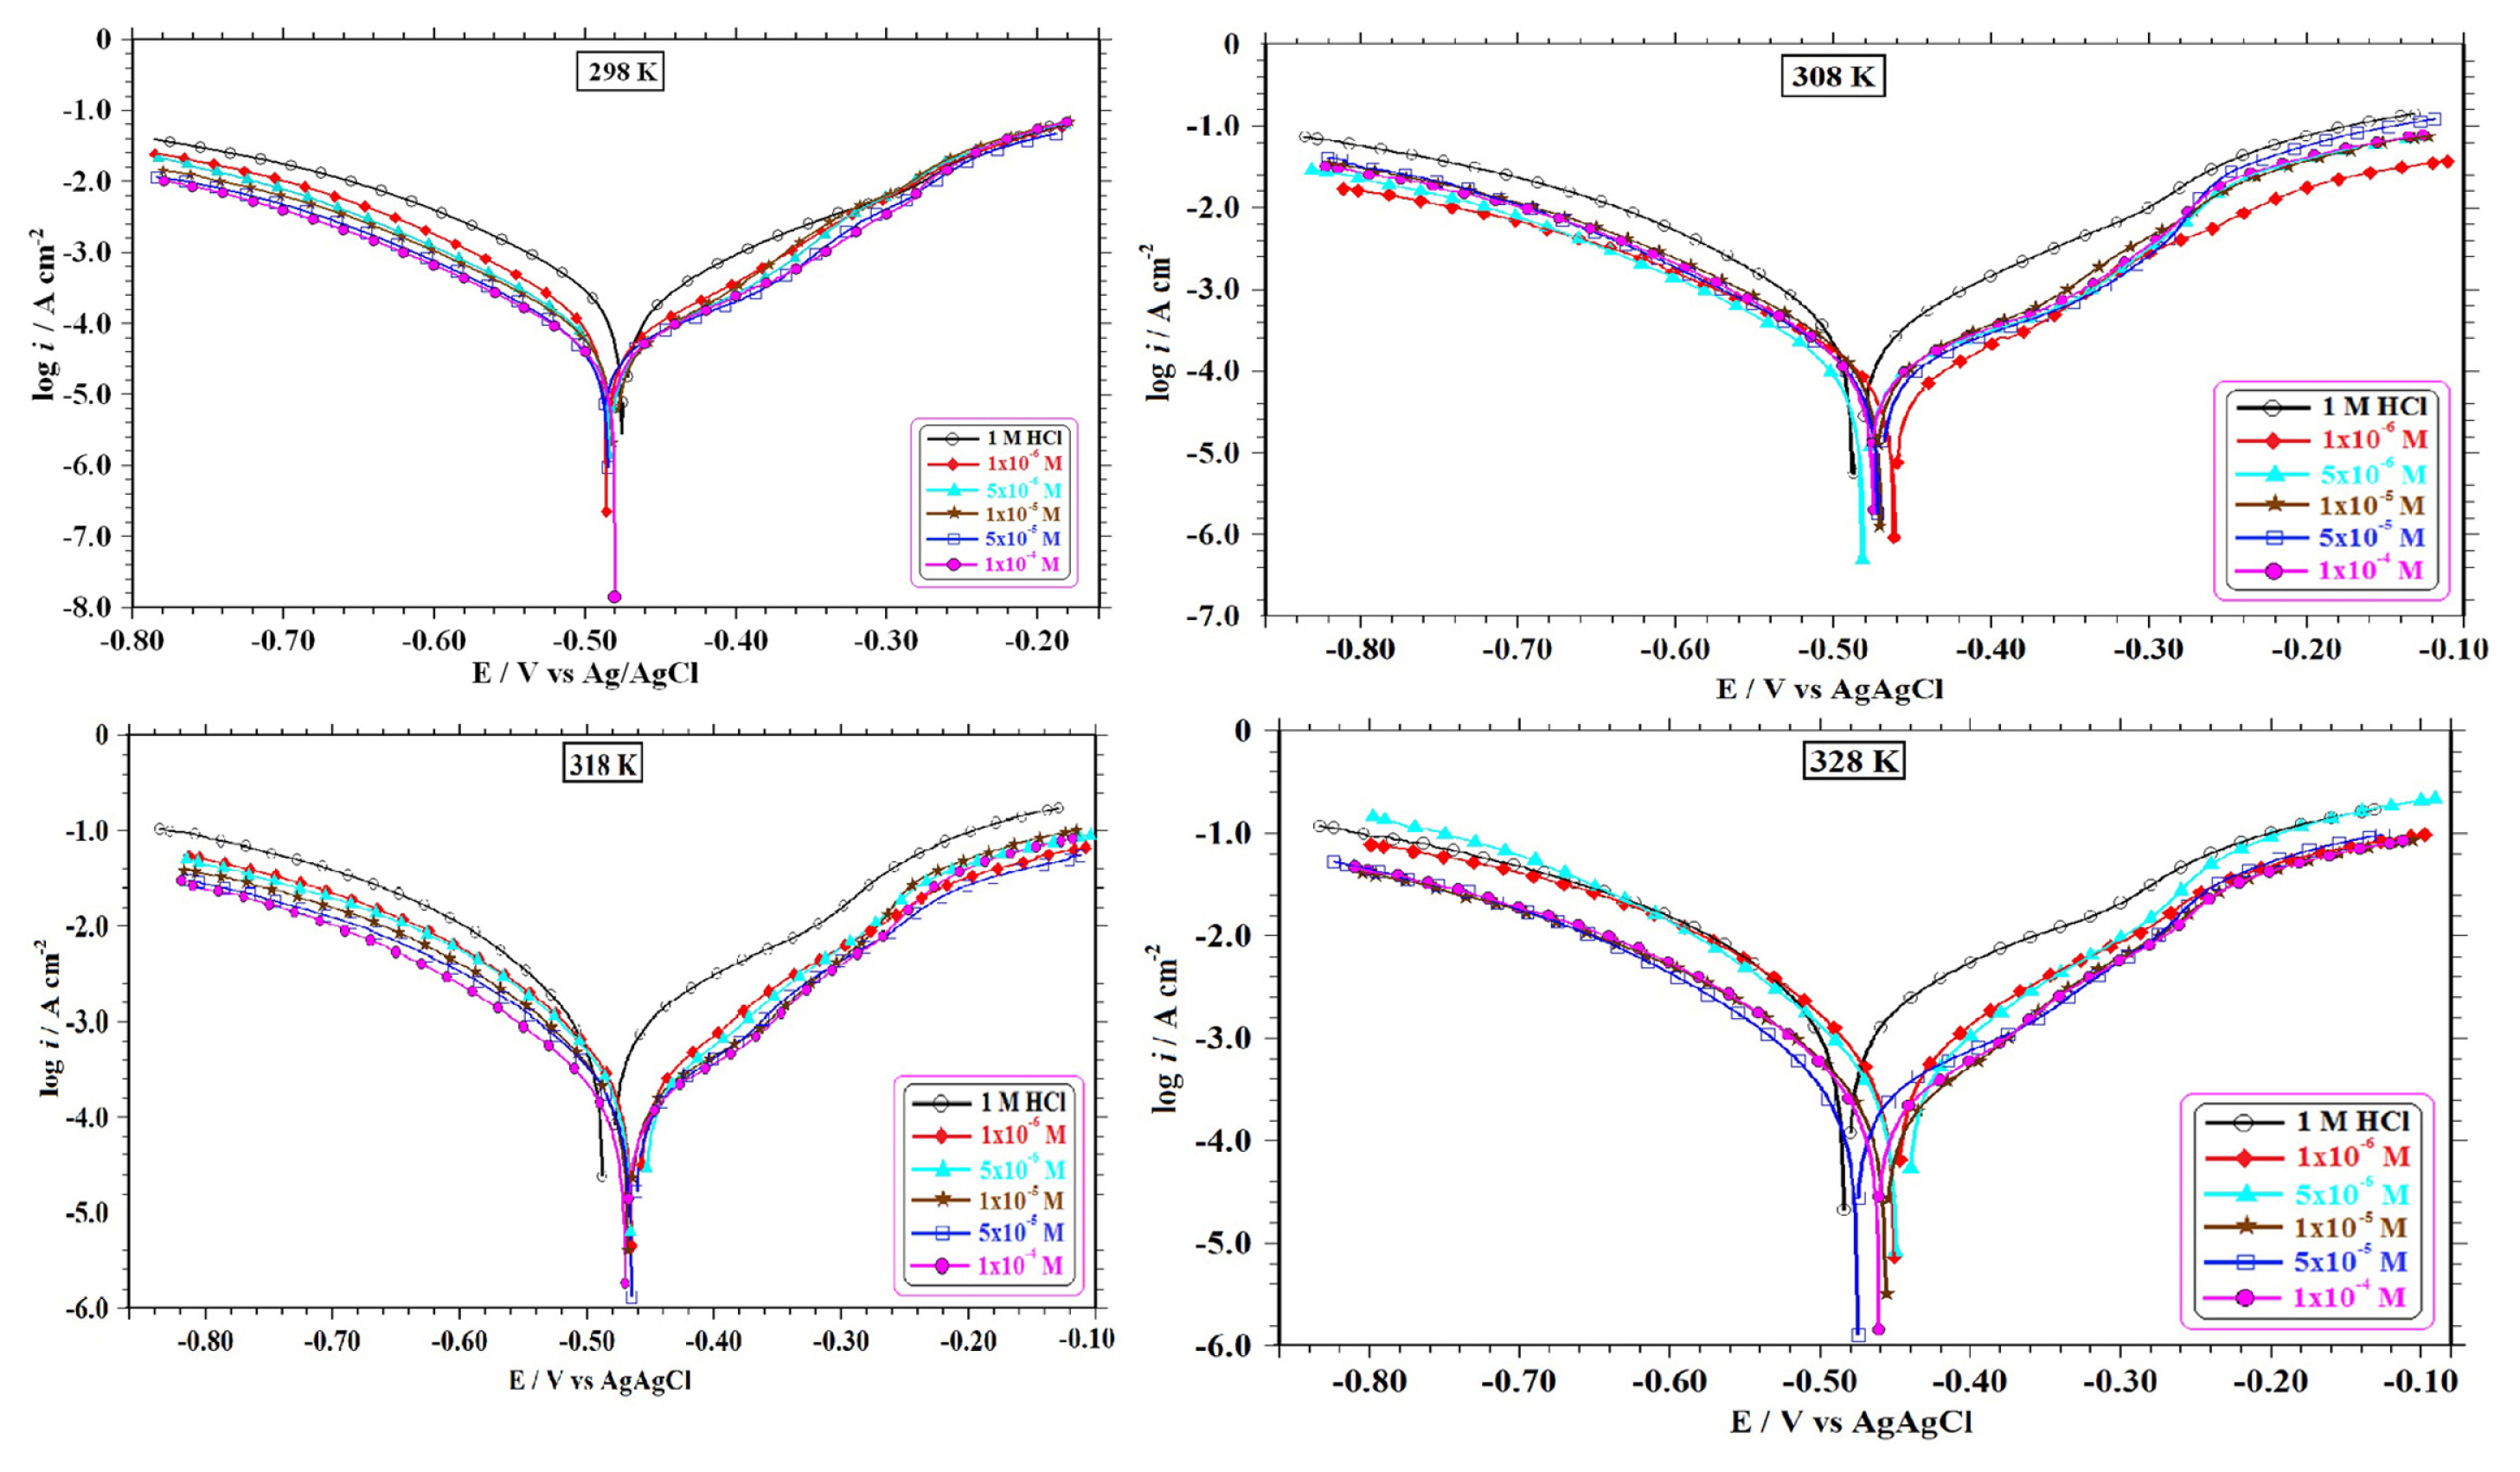
Electrochemical behaviour of the mild steel by another electrochemical method, potentiodynamic polarization method, was also performed by plotting semi-logarithmic current-potential curves at 298–328 K with (1.0×10⁻⁶–1.0×10⁻⁴ M) and without DMT in 1.0 M HCl solutions. The obtained potentiodynamic polarization curves are shown in Fig. 6 and the potentiodynamic polarization parameters obtained from these curves are also given and evaluated in Table 3. The extrapolation method of the linear part of the cathodic potentiodynamic polarization curves to the corrosion potential was applied while calculating the relevant parameters such as the inhibition efficiency (η%), corrosion potential (Ecorr), corrosion current density (icorr) and the cathodic Tafel constant (-βc).
The η% values are calculated by means of the following equation [40]:
where icorr and i′corr are the uninhibited and inhibited corrosion current density values, respectively.
The potentiodynamic polarization measurements of mild steel electrodes have been conducted at open circuit potential after being immersed with and without inhibitor in 1.0 M HCl solutions for 60 minutes. From Fig. 6 and Table 3, it can be clearly seen that all the icorr values accelerate with boosting solution temperature, whereas the icorr values diminish with the addition of DMT inhibitor to HCl solution at each temperature. As also observed, the icorr values at 328 K were higher for all concentrations both inhibited and uninhibited solution.
As the DMT inhibitor concentration enhances according to Table 3, the inhibition efficiency values accelerate slightly and even as the temperature rises, it remains almost stable except for a few values. It is observed that solutions containing higher amounts of DMT provide better inhibition performance. It can be said that this is due to the abundant aromatic ring in the molecular structure of DMT and from the π-electrons of this ring, as well as from the azo group and its non-paired of electron pairs, the triazole ring and the dimethyl amino group. An adsorption layer is formed on the surface of the mild steel by means of unpaired electron pairs in these groups. At 298 K, the Ecorr values in the existence of the inhibitor shifted to slightly more negative (cathodic) potentials than the blank solution, and these values were observed to shift to slightly more positive potentials as the temperature rose. The Ecorr values have shifted to more anodic (positive) potentials than the uninhibited solution with boosting concentration for other temperatures, 308 K, 318 K and 328 K. According to literature studies, if the shift in corrosion potential is below ±85 mV, the inhibitor is generally considered to act as a mixed-type inhibitor [41–43]. In view of these, it can be said that the DMT inhibitor acts as a cathodic controlled mixed type inhibitor because it is prone to slightly more cathodic potential shift at 298 K and also acts as an anodic controlled mixed type inhibitor because it is prone to slightly more anodic potential shift at the other three high temperatures. As a result, there is no ground-breaking alteration in Ecorr values in the existence of DMT inhibitor, so it can be said that the DMT inhibitor generally exhibits a mixed-type inhibitor system in four different temperatures in the 1.0 M HCl medium [44]. In addition, in some studies, it is stated that mixed-type inhibition mechanisms have geometric blocking mechanisms onto the metal surface [45,46].
Usually, the known approach is: As the higher temperatures are reached, the corrosion rate of the metal rises in the inhibited medium, which can be clarified by the desorption of the inhibitor from the surface of the metal with an increment in temperature. This phenomenon also brings about physical adsorption. In other words, it is a situation described by the displacement of adsorbed inhibitor molecules onto the metal surface with water molecules (weak Van der Waals interactions) [47,48]. However, when Table 3 is taken into account, the inhibition efficiency at each concentration slightly accelerates and remains almost constant. In some literature findings, chemical adsorption indicates that the increment in inhibitor efficiency values or not much change [21,49,50]. Inhibition performance is expected to diminish as the temperature boosts, but rather high being can be ascribed to the inhibition of the DMT inhibitor, which is formed on the mild steel surface, together with the corrosion products [51]. Furthermore, since the molecule is large due to its structure, it can be interpreted that the inhibition efficiency is upsurged without the possibility of desorption due to its adsorption by covering the metal surface like a blanket even at high temperatures.
In the Tafel measurements, the ultimate inhibition efficiency value was calculated as 86.4% with 1.0×10⁻⁴ M DMT solution at 328 K, because the icorr values attenuated as the concentration upsurged compared to the non-inhibited system. The hydrogen reduction rate is equal to the dissolution rate of the metal at the corrosion potential. Referring to Table 3 for cathodic Tafel constants, these values displayed no substantial alteration in addition of DMT to the medium compared to the blank solution. This phenomenon also occurs in temperature enhancement for each concentration of DMT. Therefore, this reveals that DMT, whose corrosion inhibitor effect is examined, does not affect cathodic reaction too much. In this case, it can be assessed that the inhibitor does not have a direct impress on the hydrogen evolution kinetics. According to Fig. 6, the parallelism of the Tafel curves is involved to the fact that βc values remain unaltered. In this case, the reaction of hydrogen evolution is activation controlled and the corrosion process is not made an influence by the DMT inhibitor [52]. The adsorption of the DMT to the mild steel surface is such that it covers the surface with a protective barrier film. High levels of inhibition efficiency can also be explained by adsorption of the DMT inhibitor to the metallic surface with the corrosion products composed in the process.
3.2. Adsorption isotherm findings
Adsorption isotherm is a convenient method for predicting the inhibition mechanism of the inhibitor on the metal surface. In particular, it is a method that helps to understand the interaction type of metal with the inhibitor. Therefore, in this study, some adsorption isotherms were tested according to EIS measurement results for 1 h at 298 K and the best regression constant (R2) value was obtained by Langmuir isotherm. After determination of the isotherm model, Langmuir graphs in Fig. 7 were generated by using η% values obtained from potentiodynamic polarization experiments in the range of 298 K-328 K to determine the type of adsorption in temperature alteration.
These isotherm curves were created by the following equation [53].
Where, θ is the surface coverage fraction and is obtained by dividing the inhibition efficiency values by 100 in Table 4, C(inh) and K(ads) values are the DMT concentration and the adsorption equilibrium constant, respectively.
The values adsorption free energy (ΔGoads) and Kads presented in Table 4 are calculated through the following equation.
Where R is molar gase constant (8.314 J mol−1 K−1), 55.5 is molar concentration of water and T is the value of the different temperatures in Kelvin. An organic molecule usually interacts physically or chemically with the metal surface in two ways. There are weak electrostatic interactions between the metal surface and the inhibitor, such as Van der Waals, in physical adsorption and the literature findings support that the ΔGoads values are −20 kJ mol−1 or less. In chemical adsorption, on the contrary, there is a coordinated type of bond formation between the metal surface and the organic inhibitor molecule which supports charge transfer or sharing, and the literature findings support that the ΔGoads values are −40 kJ mol−1 or higher [50,54,55]. In Table 4, the ΔGoads values at all temperatures were even more negative than −40 kJ mol−1. In this case, it can be said that the DMT inhibitor interacts strongly with the mild steel surface by sharing the charge. Unshared electron pairs of nitrogen atoms in the structure of the DMT molecule are strong adsorption centres. These electrons interact with the d-orbitals of Fe to compose a film that is chemically adsorbed onto the metal surface, thereby providing inhibition. In order to understand the interaction of DMT molecule with the mild steel surface, a possible adsorption model is proposed below.
3.3. Activation energy findings by Arrhenius equation
Activation energy is the minimum energy value that must be exceeded before a chemical reaction can take place. In other words, it is the amount of energy that causes all molecules in a mole substrate to pass through [56]. Each chemical reaction has its own activation energy and can be calculated by the following Arrhenius equation [57].
Where Ea symbolizes the corrosion activation energy, T the experimental temperature, icorr the corrosion rate, A the pre-exponential factor and R the universal gas constant. In this calculation, icorr values acquired from potentiodynamic polarization experiments for various concentrations at different temperatures were utilized. A graph of ln (icorr) against 1/ T without and with the DMT inhibitor in 1.0 M HCl solution grants linear lines and the slope of this graph is - Ea/R as indicated in Fig. 9.
The Ea values calculated from Arrhenius lines for each concentration of the DMT inhibitor are as presented in Table 5.
As can be seen from Table 5, the Ea values at all concentrations of DMT were less than those of the blank solution. According to the literature reviews, this is characteristic of classical chemisorption mechanism [58,59]. The diminution in Ea values with an upsurge in the DMT concentration in the 1.0 M HCl solution can be attributed to the accelerated adsorption of DMT onto the mild steel surface with the enhancement in electrolyte temperature. A diminishing Ea value for the inhibited solutions merged with the upsurged inhibition efficiency values with the rise in temperature is indicative of an explicit interaction between the mild steel surface and DMT molecules accompanying with the constitution of the DMT-Fe2+ complex. Consequently, the inhibitor molecules must be at a certain distance from the metal surface, with the number of particles exceeding the threshold energy (the minimum energy required) correspondingly increasing. That is, the collision frequencies should be able to fabricate the energy needed up to this threshold. This temperature kinetics suggested that the DMT molecule, which has a very large molecular structure, slowed down the corrosion process by covering the mild steel surface as a shroud and filling the gaps on the metal surface. It has been achieved in particular by the coordination bond between the unshared electron pairs of nitrogen atoms abundantly present in the molecular structure and the free d-orbitals of Fe metal. This coordination bond caused the molecule to be chemically and strongly adsorbed to the metal surface.
3.4. Structural surface morphology findings
In order to understand the structural analysis of the metal surface, morphological images were taken by three different methods. Metal microscopy (Figure 10) [60], FE-SEM at 200 times magnification (Figure 11) [61] and AFM images (Figure 12 and Figure 13) [62] were evaluated. All morphologies were realized in 1.0 M HCl solutions with and without 1.0×10⁻⁴ M DMT at a temperature of 298 K and an immersion time of 120 hours.
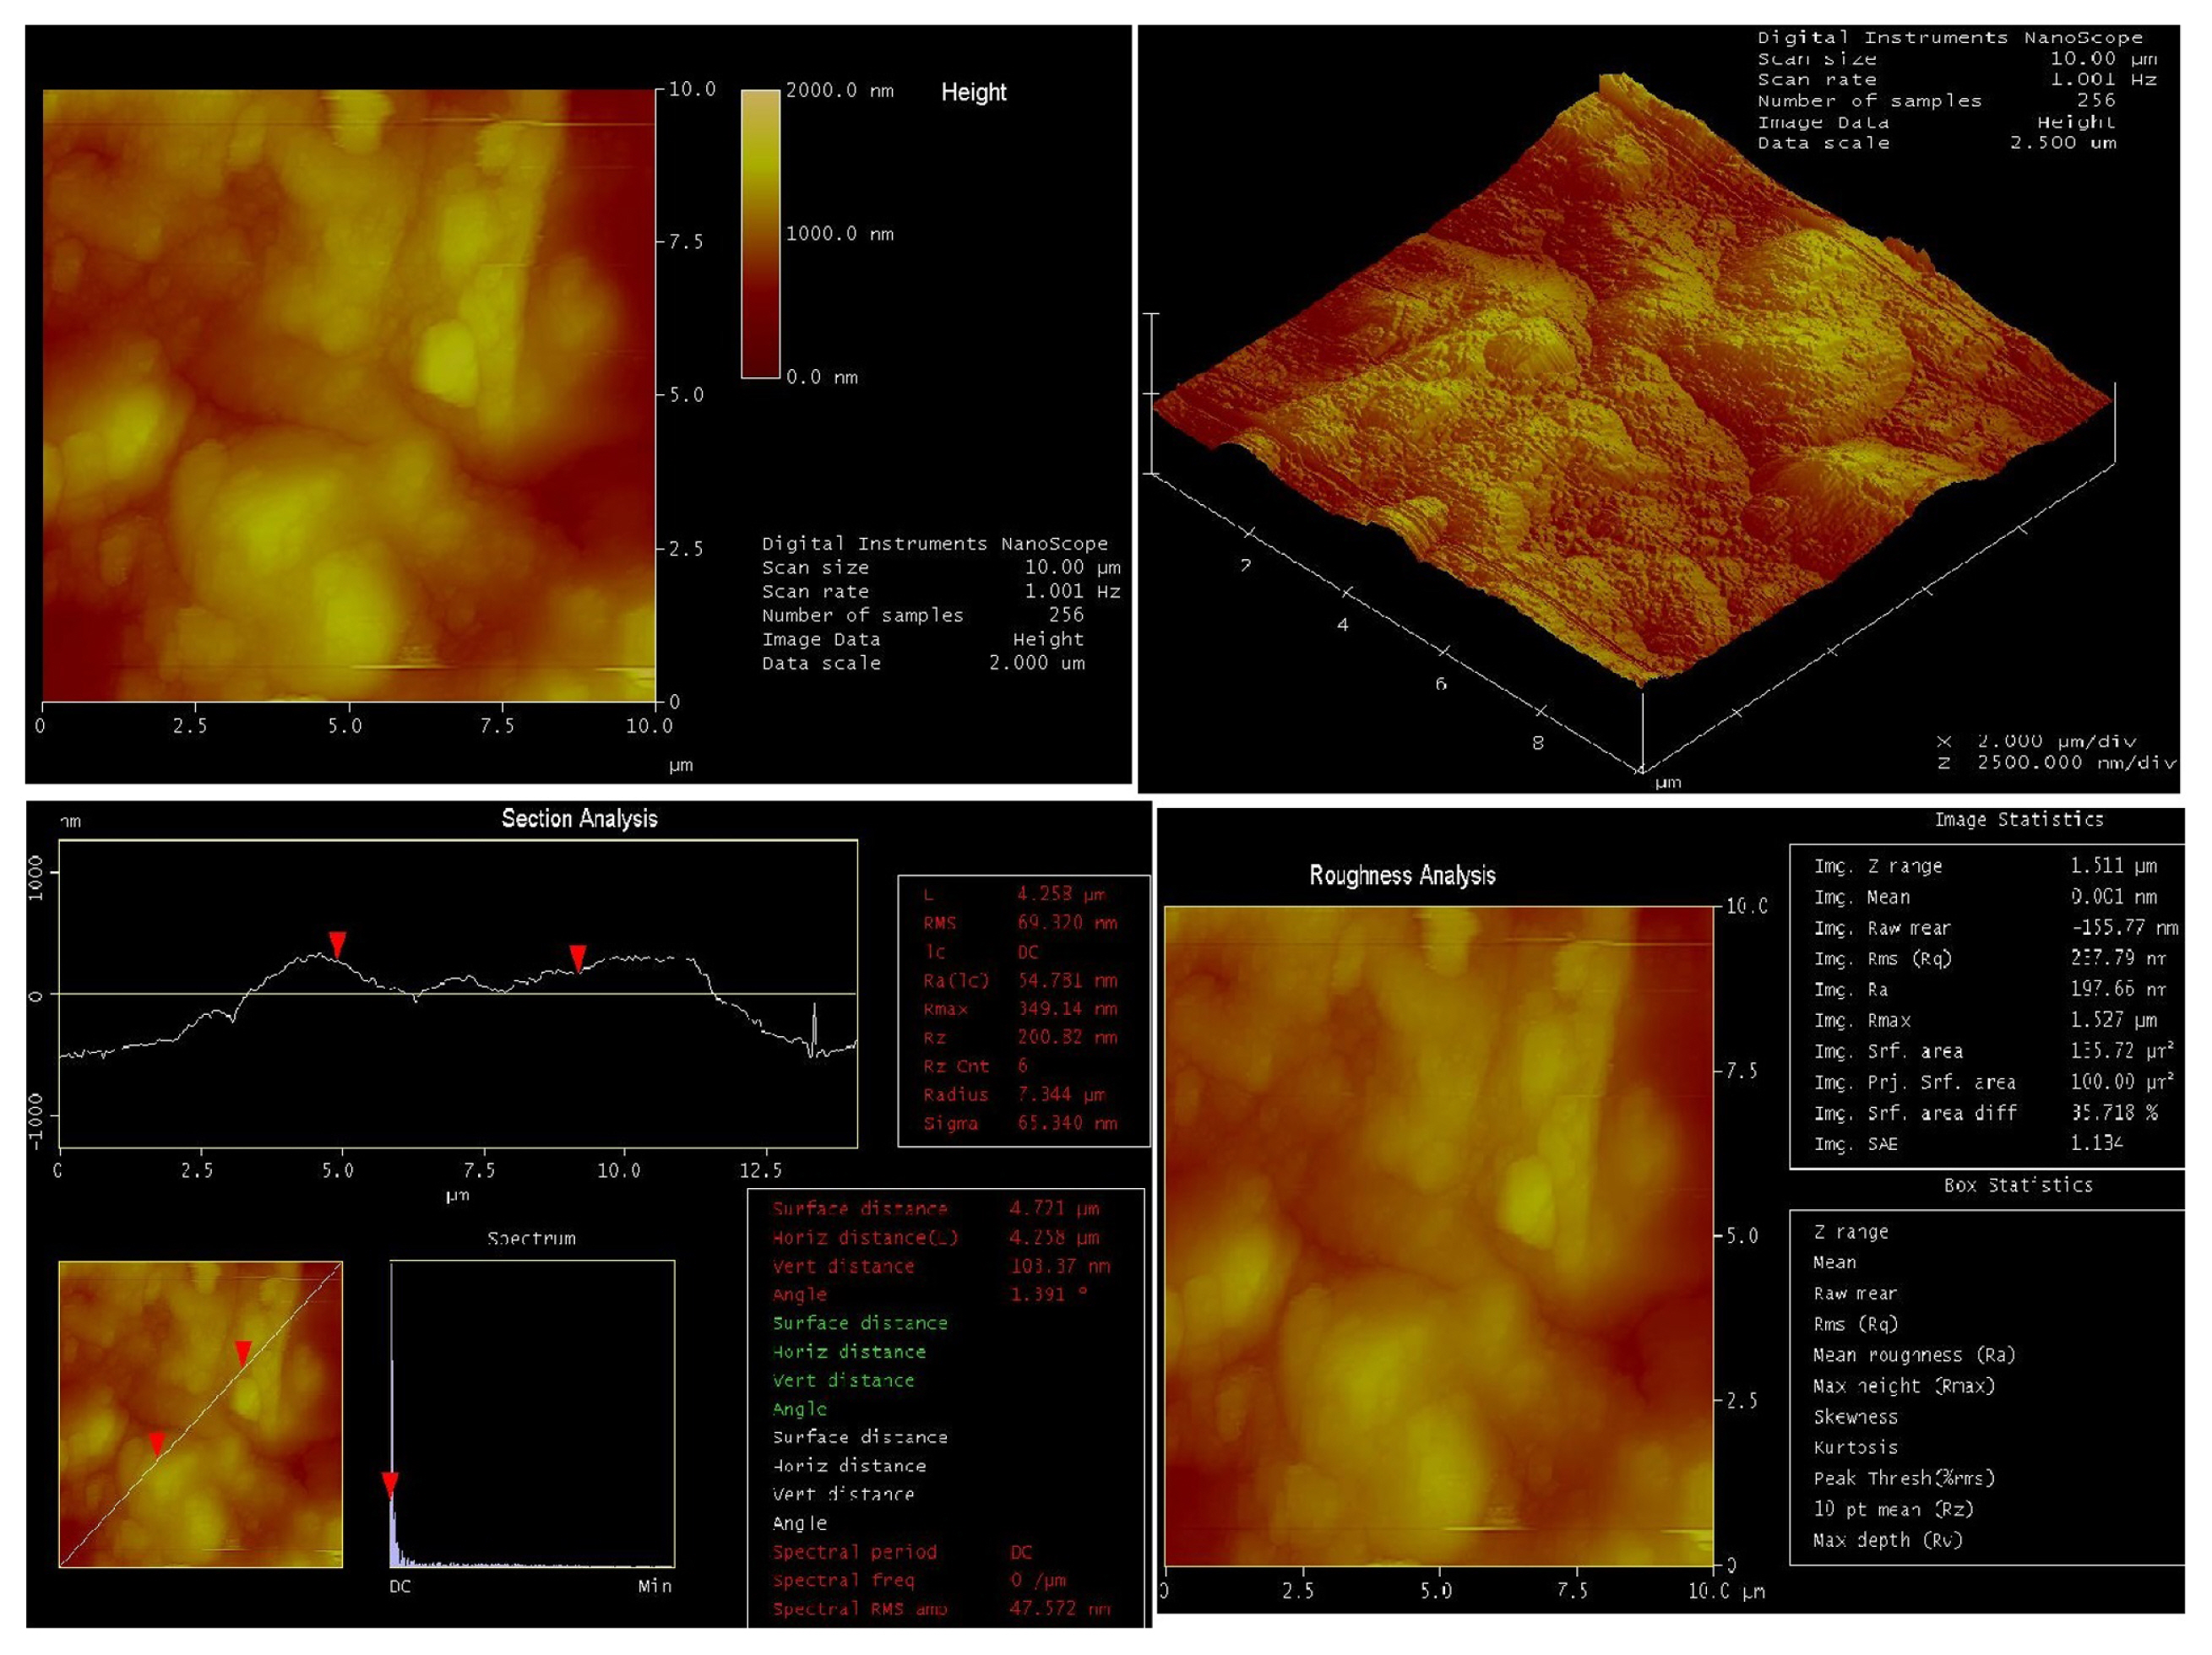
When the surface morphology obtained by all three surface techniques were evaluated, it was found that the electrodes immersed in the blank solution for 120 h were highly affected by the hydrochloric acid solution. The deep cavities, i.e. the pits, are shown in Fig. 10a and Fig. 11a. In addition, Fig. 10b and Fig. 11b, the surface morphology of the mild steel in the inhibited solution is extremely smooth and more uniform. In particular, the considerable reduction in the number of pits and cavities that are too prominent in the blank solution suggests that the result is that the surface is better covered with the inhibitor [63,64]. Figs. 12 and 13 show the two-dimensional (2D) and the three-dimensional (3D) AFM images of 1.0 M HCl solutions without inhibitor and containing 1.0×10⁻⁴ M DMT inhibitor. These images grant information about the surface roughness and flexibility of the electrodes. AFM technique gives the researchers the opportunity to compare the solutions with and without inhibitors, giving the average surface roughness values (Ra) of the electrodes, which are surface imaged especially in corrosion inhibitor studies. According to the image statistics, the Ra value of the mild steel in the blank solution that was kept for 120 h was 197.66 nm (Fig. 12), whereas the Ra value of the electrode immersed in DMT solution was measured as 38.934 nm (Fig. 13). The diminution of Ra in the blank solution when DMT was added to the medium was supportive of the findings throughout the study. That is, this is a separate indicator that the inhibitor protects the mild steel surface by covering it very well. In addition, the obtained surface structure findings were highly compatible with all electrochemical measurements [65–67].
4. Conclusions
The DMT azo dye applied as a new type of inhibitor for mild steel in acidic medium is exhibited good inhibition. The functionality of this cationic azo dye, which is used in dyeing of carpet, yarn and fibre in textile industry, was investigated in a different industrial area with this study. In the EIS measurements of different electrochemical methods tested, DMT molecule was very well adsorbed to the mild steel surface with the decreasing CPE values in response to increasing Rp values and provided a good inhibition. LPR measurements supported this finding. Furthermore, as the exposure of this azo dye to the acidic solution increased, the metal protection effect was still above 90% for optimum concentration. From the EIS measurements, the surface charge of the mild steel was found to be negative. As a result of this information, it was decided that protonated DMT molecules were adsorbed directly to mild steel. There is no noteworthy deviation in the Ecorr values of the DMT azo dye from the potentiodynamic polarization measurements, so it can be said that the DMT inhibitor exhibits a mixed-type inhibitor effect at four temperatures in 1.0 M HCl solution. DMT azo dye was adsorbed to the mild steel surface according to Langmuir isotherm. The ΔGoads values calculated at each temperature are more negative than −40 kJ mol−1 and the lower Ea values in the inhibited solutions than in the uninhibited one has been suggested as strong evidence that adsorption is chemisorption. Finally, metal microscopy, FE-SEM and AFM micrographs expressly designate that the corrosion process of mild steel in hydrochloric acid conceive the composing deep cavity and pits and incorporation of DMT azo dye to 1.0 M HCl intemperately attenuate the corrosion and the surface gets more glazed.