Improving the Stability of Series-Connected Solid Oxide Fuel Cells by Modifying the Electrolyte Composition
Article information
Abstract
YSZ based anode supported solid oxide fuel cells (SOFCs) were prepared, and two cells with different electrolyte thicknesses were connected in series for the simulation of a cell-imbalanced fuel cell stack. Pure YSZ cells in a series connection exhibited a rapid degradation when a thick electrolyte cell was operated under a negative voltage. On the other hand, ceria added-YSZ cells in a series connection were stable under similar operating conditions, and the power density and impedance were about the same as those before tests. The improved stability was due to the reduction of internal partial pressure in the electrolyte by locally increasing the electronic conduction. Thus, we propose a new protection method, i.e., the local addition of ceria in the YSZ electrolyte, to extend the lifetime of a cell-imbalanced SOFC stack.
1. Introduction
Cell to cell performance variation (cell imbalance) is one of the critical issues in series-connected electrochemical cells [1,2]. When this variation between normal cells and an inferior cell is substantial in a fuel cell stack, the bad cell can be operated under abnormal operating conditions. In series-connected fuel cells, a bad cell can be subjected to a negative cell voltage, as shown in Fig. 1. In the case of solid oxide fuel cells (SOFCs), a negative voltage operation may set off electrode/electrolyte delamination, and this phenomenon has been observed in many cases [3–6]. The electrode/electrolyte delamination is due to abnormally high oxygen partial pressure developing in the oxygen ionic conducting electrolyte [7,8].
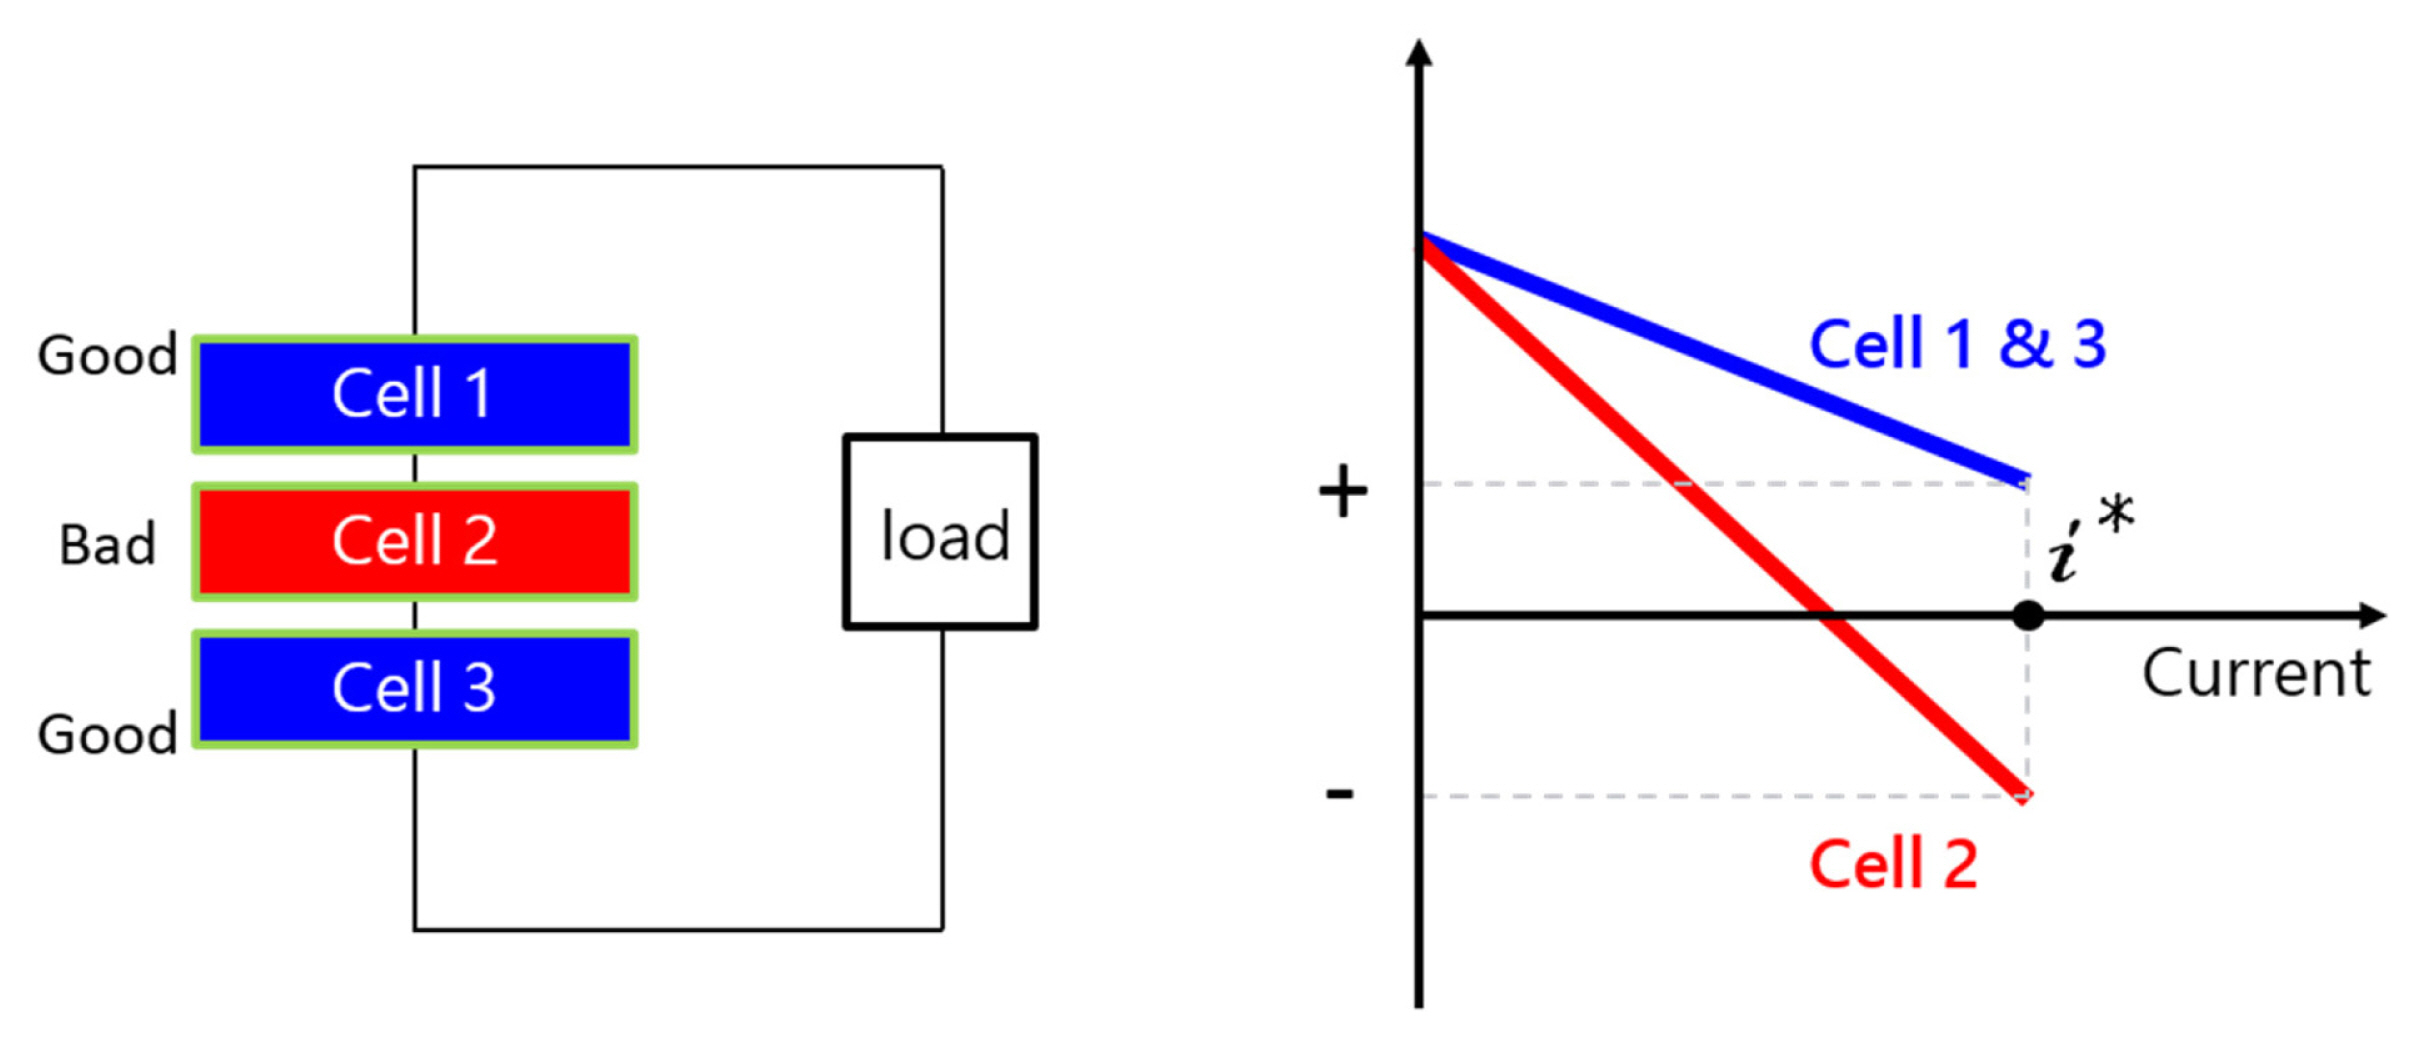
Schematic of a cell-imbalanced series connection of fuel cells.
On the basis of local equilibrium, the internal oxygen partial pressure is a function of electronic conduction in the solid electrolyte or vice versa. Electronic conduction is a minor charge carrier in the electrolyte, but it plays an important role in terms of determining electrolyte stability, i.e., determining the magnitude of the internal partial pressure [9–11]. Since internal oxygen molecules are locally equilibrated with electrons and oxygen ions in an oxygen ion conducting electrolyte, we can write this relationship in terms of the chemical and electrochemical potential [2,12];
where μO2 is the chemical potential of oxygen; μ̃O2− is the electrochemical potential of oxygen ions and μ̃e is the electrochemical potential of electrons. Equation (1) can be further developed to Equation (2), suggesting that the higher the electronic resistance the higher the internal partial pressure.
where
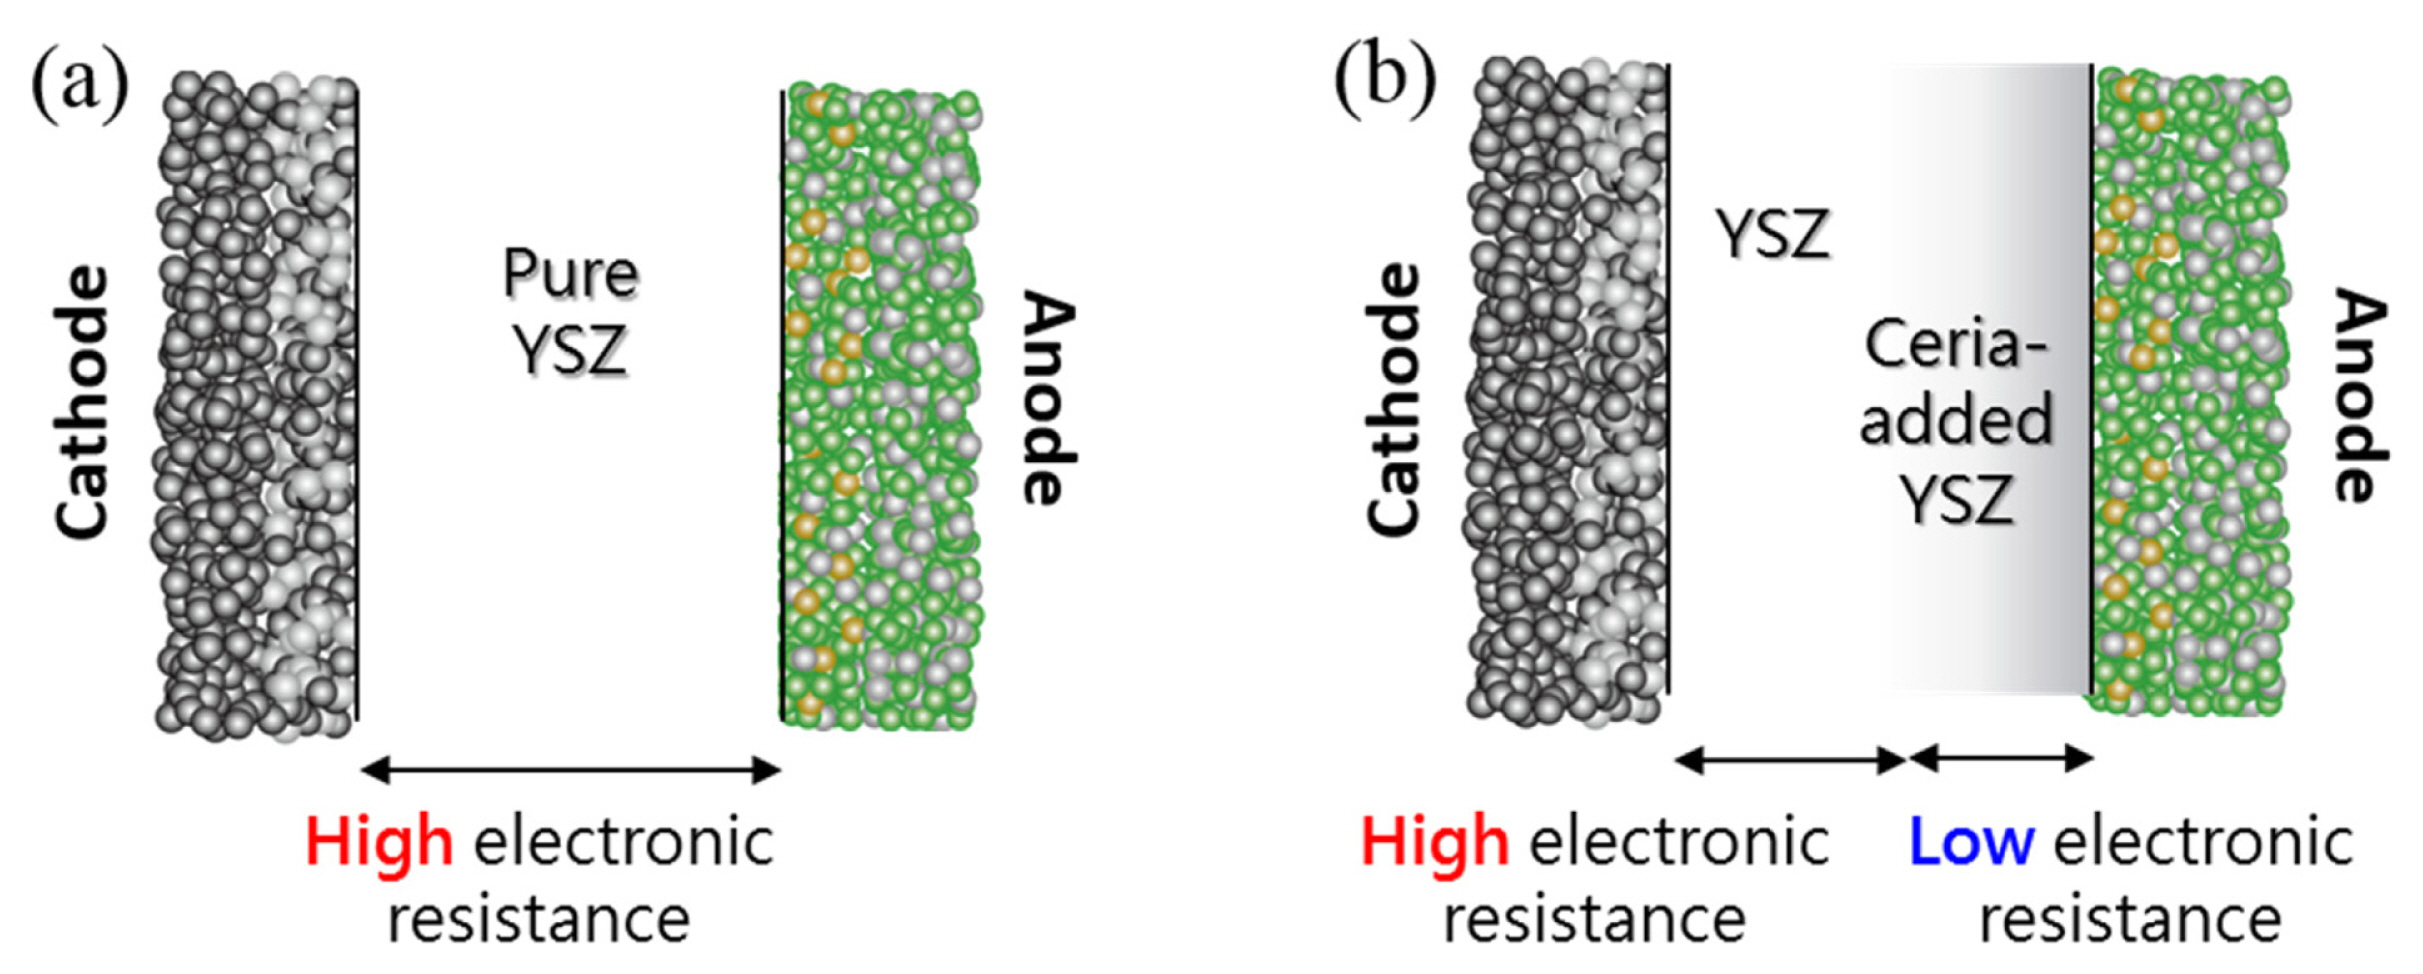
Comparison of electronic transport properties in pure YSZ and ceria-added YSZ electrolytes in SOFCs.
In this study, we fabricated two kinds of anode supported SOFCs consisting of a pure YSZ electrolyte and a ceria-added YSZ electrolyte. For both types, a thin electrolyte (higher performance) and a thick electrolyte (lower performance) were prepared, and thin and thick cells were connected in series to simulate cell imbalance. These two series-connected cells were tested under a constant current condition where the thick electrolyte cell was operated at a negative cell voltage while the thin electrolyte cell was operated at a positive cell voltage. In this experiment setup, the performance degradation of YSZ cells connected in series and ceria-added YSZ cells in connected in series were compared.
2. Experimental
The fabrication procedure of conventional anode-supported cells with a pure YSZ (8 mol% yttria doped zirconia) electrolyte can be found elsewhere [16]. For the ceria-added YSZ electrolyte, the anode functional layer (AFL) was modified. The AFL for pure YSZ cells consists of YSZ + NiO in 40: 60 in wt.% while that for ceria-added YSZ cells consists of CeO2 + YSZ + NiO in 20: 20: 60 wt.%. The anode support and the AFL were co-sintered at 1460°C for 6 h for both types. In the ceria-containing AFL, ceria may diffuse into the YSZ electrolyte during the high temperature sintering process so a ceria-YSZ solid solution can be locally formed in the electrolyte near the anode side. The details of the fabrication procedure for the ceria-added YSZ cells can be found in [4]. The composite of 50 wt.% La0.8Sr0.2MnO3-x (LSM) + 50 wt.% YSZ was used for a cathode functional layer, and LSM only was used for a cathode current collecting layer.
The electrolyte thickness was controlled by the amount of electrolyte slurry deposition. Thin and thick electrolytes were prepared to simulate cell-imbalance for both pure YSZ and ceria-added YSZ. Thin and thick cells were connected in series, and constant current tests were conducted on the series-connected cells for both pure YSZ and ceria-added YSZ at 800°C, as shown in Fig. 3. Electrochemical tests were carried out using a Bio-Logic SP 240 potentiostat/galvanostat. H2 (~ 300 mL·min−1) and air (~ 400 mL·min−1) were used as anode and cathode gases, respectively. The voltage of the thin and thick cells in a series connection were separately measured, and their degradation rates were compared with respect to ‘pure YSZ’ and ‘ceria-added YSZ’.

Schematic of thin (good) and thick (bad) cells in a series connection for the simulation of a cell-imbalanced fuel cell stack.
3. Results and Discussion
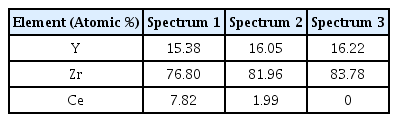
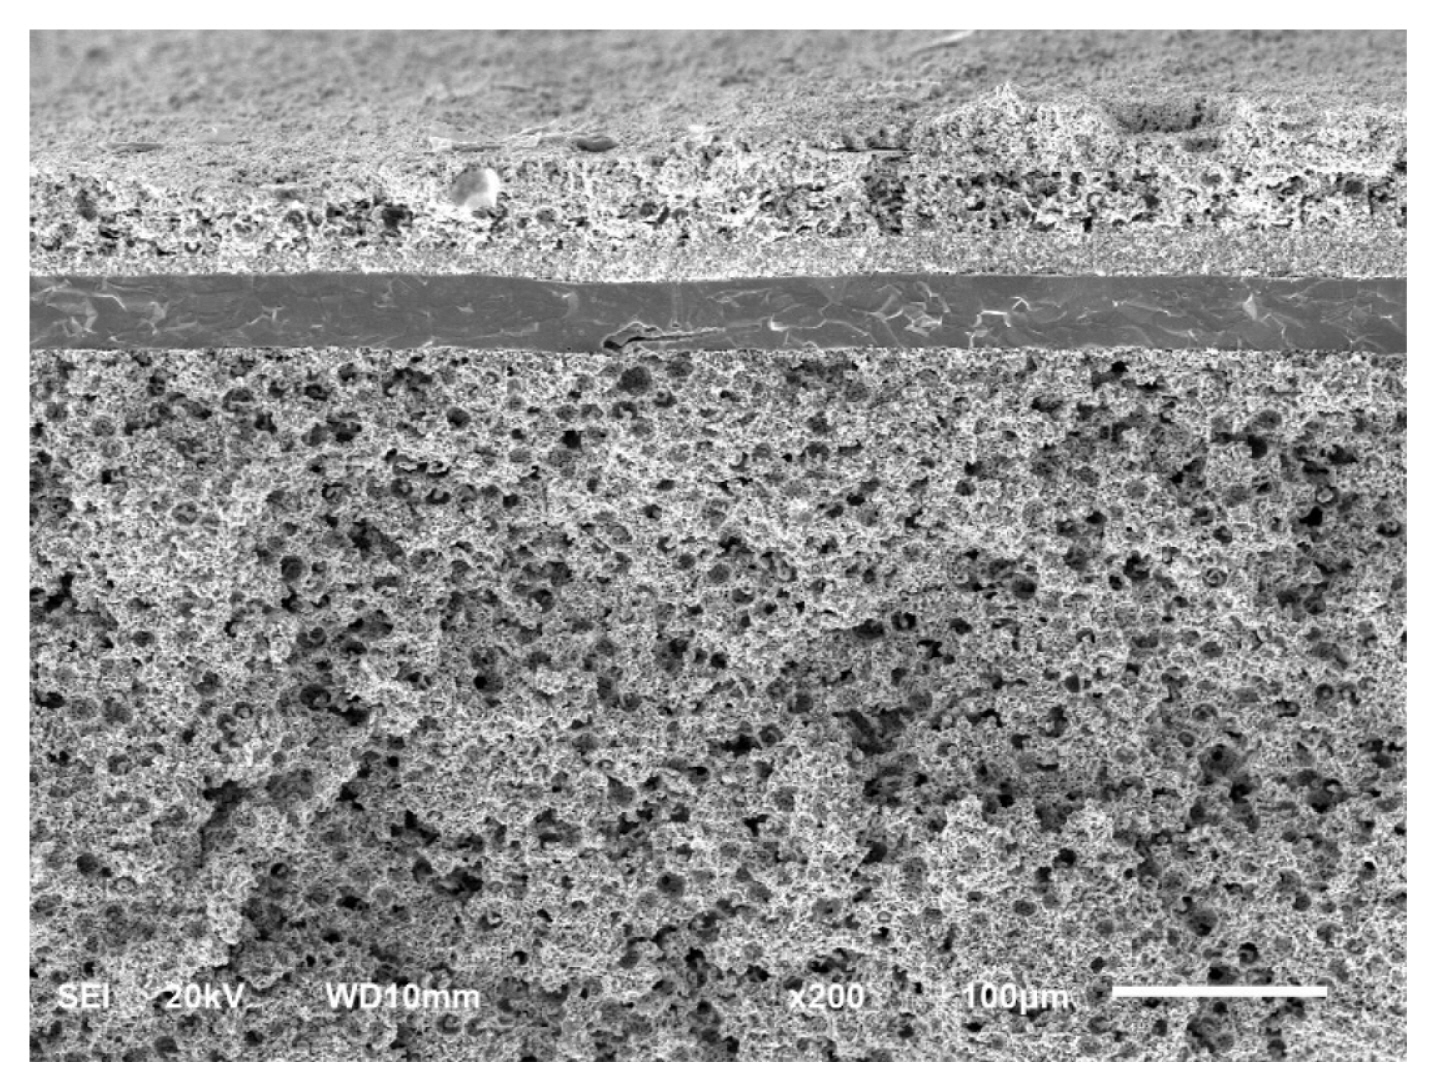
Figs. 4(a) and (b) show cross-section images of the thin and thick electrolytes (for ceria-added YSZ) using SEM. The thin and thick electrolyte thicknesses were ~ 15 and ~ 34 μm, respectively. Fig. 4(c) and Table 1 show the result of energy dispersive spectrometer (EDS) with respect to cerium in three different positions in the ceria-added YSZ electrolyte. It can be seen that the cerium concentration was significant (~ 7.82 atomic %) close to the anode side, and it decreased from the anode to the cathode side, i.e., ceria was partially diffused into the electrolyte region and the solid solution was locally formed at the anode side [17,18]. From this result, we can expect a higher electronic concentration in the ceria-added YSZ electrolyte (close to the anode side), corresponding to ~ 100 times higher electronic conductivity than that of the pure YSZ electrolyte [19–21].

SEM images of the cross-sectioned thin (a) and thick (b) electrolyte (for ceria-added YSZ) after the sintering process; the result of EDS with respect to cerium in three different positions in the ceria-added YSZ electrolyte (c).
The pure YSZ cells were tested under constant current conditions, as shown in Fig. 5(a). When the series connection was subjected to ~ 1.75 Acm−2, the initial voltages of the thin and thick YSZ cells were ~ +0.18 V and ~ −0.17 V, respectively. The performance difference occurred because of the electrolyte thickness, i.e., the ohmic resistance difference. During the test, the thin YSZ cells in a positive voltage range were stable (its voltage slightly increased) while the thick YSZ in a negative voltage range continuously decreased. Note that the voltage increase of the thin cell was caused by the effect of the current treatment on the LSM cathode under normal operating conditions [22]. The voltage drop rate of the entire cell connection (corresponding to ‘total’) was ~ −0.026 Vh−1, which was solely due to the degradation of the thick YSZ cell. As mentioned in the introduction, a high electronic resistive (pure YSZ) electrolyte cell can be rapidly degraded under negative voltage conditions because of the development of high oxygen partial pressure, which produces anode/electrolyte delamination [8,9,23].

(a) Cell voltage vs. time of the pure YSZ cells in a series connection (thin, thick and total) at 1.75 Acm−2; (b) Cell voltage vs. time of the ceria-added YSZ cells in a series connection (thin, thick and total) at 1.46 Acm−2.
A similar test was conducted on the ceria-added YSZ cells in a series connection, as shown in Fig. 5(b). As observed in the pure YSZ cells, the thick cell was operated at a lower cell voltage (negative voltage) due to the higher ohmic resistance; ~ +0.40 V for the thin cell and ~ −0.09 V for the thick cell at ~ 1.46 Acm−2. On the other hand, as opposed to the pure YSZ cell, the ceria-added YSZ cell with a thick electrolyte as well as with a thin electrolyte operated stably. Note that the voltage change rate of the entire cell connection (corresponding to ‘total’) was ~ +0.003 Vh−1. Consequently, the two-cell series connection became much more stable by modifying the YSZ electrolyte composition.
Figs. 6 compares the results of I-V curves measured before and after the test on the ceria-added YSZ cells; (a) and (b) for the thin and thick electrolytes, respectively. Note that the open circuit voltages of the thin and thick cells were > 1.0 V, indicating that there was no leakage current through the cells. The high open circuit voltage was achieved by means of local electronic conduction. The thin cell exhibited a higher power density in comparison with the thick cell due to the lower ohmic resistance. The performance of the thin cell was not degraded since it was operated under positive voltages. Furthermore, the power density of the thick cell that underwent negative voltage operation was also about the same as that of the ‘before tests’, as observed in the constant current test. Fig. 6(c) compares the impedance spectra measured before and after the tests on the ceria-added YSZ cells with a thick electrolyte. The high frequency intercept on the real axis (corresponding to ohmic resistance) and the high frequency arc (dominated by charge transfer resistance) were about the same before and after the tests, indicating neither delamination nor three phase boundary changes occurred under the negative voltage conditions. Note that the low frequency arc (related to gas transport and gas composition) was somewhat reduced after the test, which might have been due to a different H2/H2O established during the test.

(a) I-V curves of the thin ceria-added YSZ cell before and after the negative voltage test; (b) I-V curves of the thick ceria-added YSZ cell before and after the negative voltage test; (c) Impedance spectra of the thick ceria-added YSZ cell before and after the negative voltage test.
Fig. 7 shows a micrograph of the cross-sectioned ceria-added YSZ electrolyte after the test using scanning electron microscopy (SEM). No damage or microstructural changes, such as anode/electrolyte delamination, were observed on the tested cell. Thus, we can say that the local electronic conduction developed by the ceria addition to the SOFC electrolyte should be effective to protect a cell-imbalanced fuel cell stack from rapid degradation, by means of depressing the internal oxygen partial pressure in the electrolyte.
SEM image of the cross section of the thick ceria-added YSZ cell after the negative voltage operation.
4. Conclusions
We prepared a two-cell series connection with different electrolyte thicknesses to simulate cell imbalance. When the thick cell was operated at negative voltages due to higher ohmic resistance, the series connection consisting of YSZ-based cells showed rapid degradation while that consisting of the modified YSZ cells were durable. Thus, we propose a new protection method, i.e., local addition of ceria to a YSZ electrolyte, to extend the lifetime of a cell-imbalanced SOFC stack.
Acknowledgment
This research was supported by Changwon National University in 2019–2020.