Determination of Ascorbic Acid, Acetaminophen, and Caffeine in Urine, Blood Serum by Electrochemical Sensor Based on ZnO-Zn2SnO4-SnO2 Nanocomposite and Graphene
Article information
Abstract
In the present research, a simple electrochemical sensor based on a carbon paste electrode (CPE) modified with ZnO-Zn2SnO4-SnO2 and graphene (ZnO-Zn2SnO4-SnO2/Gr/CPE) was developed for the direct, simultaneous and individual electrochemical measurement of Acetaminophen (AC), Caffeine (Caf) and Ascorbic acid (AA). The synthesized nanomaterials were investigated using scanning electron microscopy, X-ray Diffraction, Fourier-transform infrared spectroscopy, and electrochemical impedance spectroscopy techniques. Cyclic voltammetry and differential pulse voltammetry were applied for electrochemical investigation ZnO-Zn2SnO4-SnO2/Gr/CPE, and the impact of scan rate and the concentration of H+ on the electrode’s responses were investigated. The voltammograms showed a linear relationship between the response of the electrode for individual oxidation of AA, AC and, Caf in the range of 0.021–120, 0.018–85.3, and 0.02–97.51 μM with the detection limit of 8.94, 6.66 and 7.09 nM (S/N = 3), respectively. Also, the amperometric technique was applied for the measuring of the target molecules in the range of 0.013–16, 0.008–12 and, 0.01–14 μM for AA, AC and, Caf with the detection limit of 6.28, 3.64 and 3.85 nM, respectively. Besides, the ZnO-Zn2SnO4-SnO2/Gr/CPE shows an excellent selectivity, stability, repeatability, and reproducibility for the determination of AA, AC and, Caf. Finally, the proposed sensor was successfully used to show the amount of AA, AC and, Caf in urine, blood serum samples with recoveries ranging between 95.8% and 104.06%.
1. Introduction
Acetaminophen (AC) or paracetamol is known as a safe analgesic and antipyretic drug since 1953 to treat fever, cold, cough and, pain. However, the impressment mechanism of AC is still debated. It has been assumed that AC activates descending serotonergic pathways which leads to inhibition of prostaglandin synthesis [1]. Although AC is considered as a safe painkiller, with minimal side effects, severe poisonings such as liver failure and kidney damage have been reported due to excessive consumption of prescribed doses [2]. So it is crucial that the level of AC must determine in biological human body fluid.
Caffeine (Caf) as a naturally occurring alkaloid, which is the most widely devoured psychoactive substance, can be founded in some plant-based products and beverages. Depending on some factors such as the taken dosage, the bodyweight, and individual response, Caf has several impacts on the consumer [3]. For example, it can increase the ability for mental activity and muscular work [4]. Also, it has antioxidant activity [5]. Other effects of Caf are stimulating the central nervous system, gastric acid secretion, increasing blood pressure, nausea, seizures, anxiety, diuresis, trembling and, nervousness. Some research has been reported that the adverse effect of Caf on DNA [6] and also a high dosage of this molecule on the human body can increase the probability of cardiovascular diseases. Caf is used for the treatment of some diseases, for example asthma, headache, and nasal congestion [7].
One of the essential vitamins for the synthesis of neurotransmitters, muscle carnitine and also collagen is and, Ascorbic acid (AA). AA is a water-soluble vitamin, which the human body is not capable of synthesizing it. However, due to the numerous advantages of this substance, AA must be in our diet [8]. This vitamin act as an antioxidant and has a considerable role in normal neuronal physiology and neuromodulator in the brain. Some illnesses can be prevented or treated by AA such as cold, AIDS, infertility and, even cancers or mental illnesses. Despite the mentioned advantages, a high dosage of AA can lead to gastrointestinal disturbances or diarrhea [9].
However, AC, Caf and, AA often occur together in certain drug formulations; a small amount of research has been carried out on the simultaneous detection of these biomolecules. Drugs consisting of AC and Caf combinations are frequently used as pain relief, central nervous system stimulant and, an analgesic agent. On the other hand, one obstacle in the simultaneous electrochemical monitoring of AA and AC is overlapping their oxidation peaks at the surface of traditional electrodes. Also, in some spectrophotometric and titrimetric methods, the interference of AA is serious for the determination of AC. To overcome these problems, design of a simple, rapid, sensitive, selective and inexpensive electrochemical method based on a modified electrode is necessary which could be used for the simultaneous measurement of AC, Caf and, AA [4,10,11].
Several analytical techniques based on titrimetry, spectrophotometry, and chromatography have been reported for the determination of AC, Caf and, AA [12–20]. Although these methods are relatively sensitive and accurate, they are typically time-consuming, relatively expensive, and require complex preparation steps. These disadvantage of the methods limit their applications for the determination of analytes [21,22].
The electrochemical methods, due to their cost-effectiveness, good sensitivity, selectivity and, rapid response have been used for the determination of many compounds [23–31]. Since some of the electroactive species have the same oxidation potential and also because of the pronounced electrode fouling, simultaneous determination of some analytes at the surface of unmodified electrodes such as carbon paste electrode (CPE), glassy carbon electrode (GCE) and screen-printed electrode (SPE) is difficult, so new electrochemical sensors have been developed for simultaneous determination of the analytes which are modified by different materials; also the results showed that the selectivity, sensitivity and, reproducibility was improved [32–34].
One of the best strategies to improve the electrochemical sensor performance is employing nanomaterials for the procurement of the sensing layer. Nanocomposites, in addition to the properties of the individual components, also show new features due to the synergetic effect. Especially, metal-oxide nanoparticles are reported to provide some unique functions, such as electrocatalytic activity and improvement of conductivity [35–39].
In recent year, some nanomaterials were used for designing of a modified electrochemical sensor to determination of AC, Caf or, AA. For example, Quang Khieu et al. used cobalt ferrite (CoFe2O4) nanoparticles for modification of GCE and determined the AC, Caf or AA simultaneously in the range of 0.2–4.4 μM [40]. Murugan et al. used SnS/TiO2@GO composite coated GCE for measurements of AC and Caf 0.0098–280 and 0.0166–333 μM, respectively [41]. Qiao et al. used Graphene (Gr) supported Pt electrochemical sensor for the determination of Caf in Tea samples [42]. In other research, Mulyasuryani et al. applied Cassava Starch-Fe3O4 Nanoparticles to modify the GCE surface, for the detection of AC and Caf by voltammetric methods in headache medicines [43].
Among new nanocomposites, ternary semiconductor oxides have received more attention as a result of their optical and electronic properties. In this regard, SnO2 and ZnO are two oxide semiconductors with wide bandgap which have attracted attention in electrochemical sensors [44–46]. Thus, in this work ZnO-Zn2SnO4-SnO2 with better electrical properties in comparison to ZnO or SnO2 nanoparticles was synthesized and applied for modification of the working electrode [47].
On the other hand, other nanomaterials used in electrochemical sensors are carbon-based nanomaterials such as Graphene (Gr). Gr, a multitalented two-dimensional allotrope of carbon, is a 2D monolayer of carbon atoms that are bonded altogether in a honeycomb crystal lattice. Gr offers peculiar features like flexibility, excellent electrical conductivity [33], very high surface area (2630 m2/g), which makes it a desirable candidate for designing of electrical devices and specially electrochemical sensors [48–50].
In the present research, we use ZnO-Zn2SnO4-SnO2 nanocomposite and Gr with excellent electrocatalytic activity as a sensing layer to construct an electrochemical sensor for the simultaneous measurement of AC, Caf and, AA. The differential pulse voltammetry (DPV), cyclic voltammetry (CV) techniques were used to optimize the determination factors. Interferences study shows that the proposed method has high selectivity for the monitoring of the target analytes. Also, the constructed electrode illustrated high sensitivity, stability, and electrocatalytic activity for the oxidation of AC, Caf and, AA. The ZnO-Zn2SnO4-SnO2/Gr/CPE was efficaciously used to monitoring AC, Caf and AA in different real samples.
2. Experimental
2.1. Chemicals and apparatus
All reagents and materials in this research were of analytical grade and were used without any further purification. The raw materials for the synthesis of ZnO-Zn2SnO4-SnO2 composite, include zinc chloride (ZnCl2) and tin(II) chloride (SnCl2), glyoxylic acid monohydrate (C2H2O3.H2O), Ammonium hydroxide (NH4OH), ethanol, the target analytes (AC, Caf and, AA), and Gr were all bought from Merck Company and applied without further refinement. Aqueous solutions were prepared with deionized water. Britton-Robinson universal buffer solution (B-R buffer solution) was prepared by mixing 0.04 M boric acid, 0.04 M acetic acid and 0.04 M phosphoric acid, and used as supporting electrolytes and pH adjustment agent. Laboratory glasswares were kept overnight in the 10% v/v HNO3 solution and before using were washed with deionized water.
All electrochemical experiments were done in the ambient temperature using an Autolab electrochemical system (302 N, Utrecht, Netherlands) with a conventional three-electrode system consisting of an Ag/AgCl/KCl (3 M) electrode as a reference electrode, modified and unmodified CPE as the working electrode and a Pt wire as the counter electrode. The pH of solutions was measured by a Metrohm pH meter (model 713-Switzerland). SEM images were taken using SEM-EDX, XL30, Philips Netherland. FTIR spectra were obtained by a Perkin-Elmer spectrophotometer (Spectrum GX), and XRD patterns were determined by a 38066 Riva, d/G.Via M. Misone, 11/D (TN) Italy at ambient temperature.
2.2. Synthesis of ZnO, SnO2 and ZnO-Zn2SnO4-SnO2 nanocomposite as modifiers
ZnO-Zn2SnO4-SnO2 nanocomposite synthesis: In the first step, a mixture of 0.1 M ZnCl2 (0.409 g) and 0.1 M SnCl2 (0.569 g) with C2H2O3.H2O (Glyoxylic acid monohydrate) were prepared in 30 mL deionized water and stirred for 30 min, then NH4OH was added dropwise to the solution and kept under stirring at ambient temperature until pH adjusted to 9 at ambient temperature. The obtained gel was transferred to a 50-mL Teflon lined stainless steel autoclave and kept at 170°C for 3 h. In the next step, the prepared aerogel was accumulated and washed with deionized water and absolute ethanol three times and then air-dried. Finally, it was calcined at 650°C for 3 h. ZnO, SnO2 nanoparticle synthesis: For the synthesis of ZnO and SnO2 nanoparticles, the same procedures were applied without the addition of SnCl2 and ZnCl2, respectively [47].
2.3 Preparation of modified CPEs
For fabrication of CPEs, briefly, the graphite powder and paraffin oil (75:25 w/w %) were mixed in a mortar using a pestle. To prepare Gr/CPE, 15% w/w of the Gr were well mixed with the graphite powder. The mixture was blended with paraffin oil to obtain a homogeneous paste where the percentage of components in the modified paste was 15:60:25 w/w% for the modifier, graphite powder, and paraffin, respectively. The SnO2/Gr/CPE, ZnO/Gr/CPE and, ZnO-Zn2SnO4-SnO2/Gr/CPE were constructed in the same way by 10% SnO2, ZnO or ZnO-Zn2SnO4-SnO2, 5% Gr, 60% graphite powder and 25% paraffin oil.
Finally, for the fabrication of modified CPEs, each prepared paste was carefully packed into the piston-driven carbon paste electrode holder in such a way that all air bubbles between layers come out. The new surface of modified or bare CPE was mechanically renewed by scraping out the old surface with a soft paper.
2.4. Spiked and Real samples preparation
The applicability of the ZnO-Zn2SnO4-SnO2/Gr/CPE for determination of AC, Caf and, AA in different real samples was examined using the standard addition technique.
For the preparation of a urine sample, a 20 mL of the collected sample was centrifuged for 40 min at 2000 rpm; then, the supernatant was filtered using a 0.45 mm filter. The obtained sample was diluted 5-times with the supporting electrolyte of pH 7.2. The prepared urine sample was stored in a refrigerator before using [51].
In order to remove redundant proteins in the plasma samples, 1.0 mL of the blood samples was mixed with 150 μL perchloric acid and stirred for 1 min. In the next step, the mixture was centrifuged at 2000 rpm for 40 min. The obtained supernatant was added to a 10 mL B-R buffer solution of pH=7.2 and transferred to the electrochemical cell without any further pretreatment [52].
3. Results and Discussion
3.1. Surface characterization of the differently prepared nanocomposites
The crystalline structure of SnO2, ZnO and, ZnO-Zn2SnO4-SnO2 nanocomposite was characterized by using XRD, and the results are depicted in Fig. 1a. The XRD pattern of SnO2 nanoparticles shows the main characteristic peaks (110), (101), and (211) at 2θ=26.16°, 34.73°, and 52.34°, respectively. The observed peaks were attributed to the formation of the monoclinic phase of SnO2 (JCPDS No. 41–1445) [53].
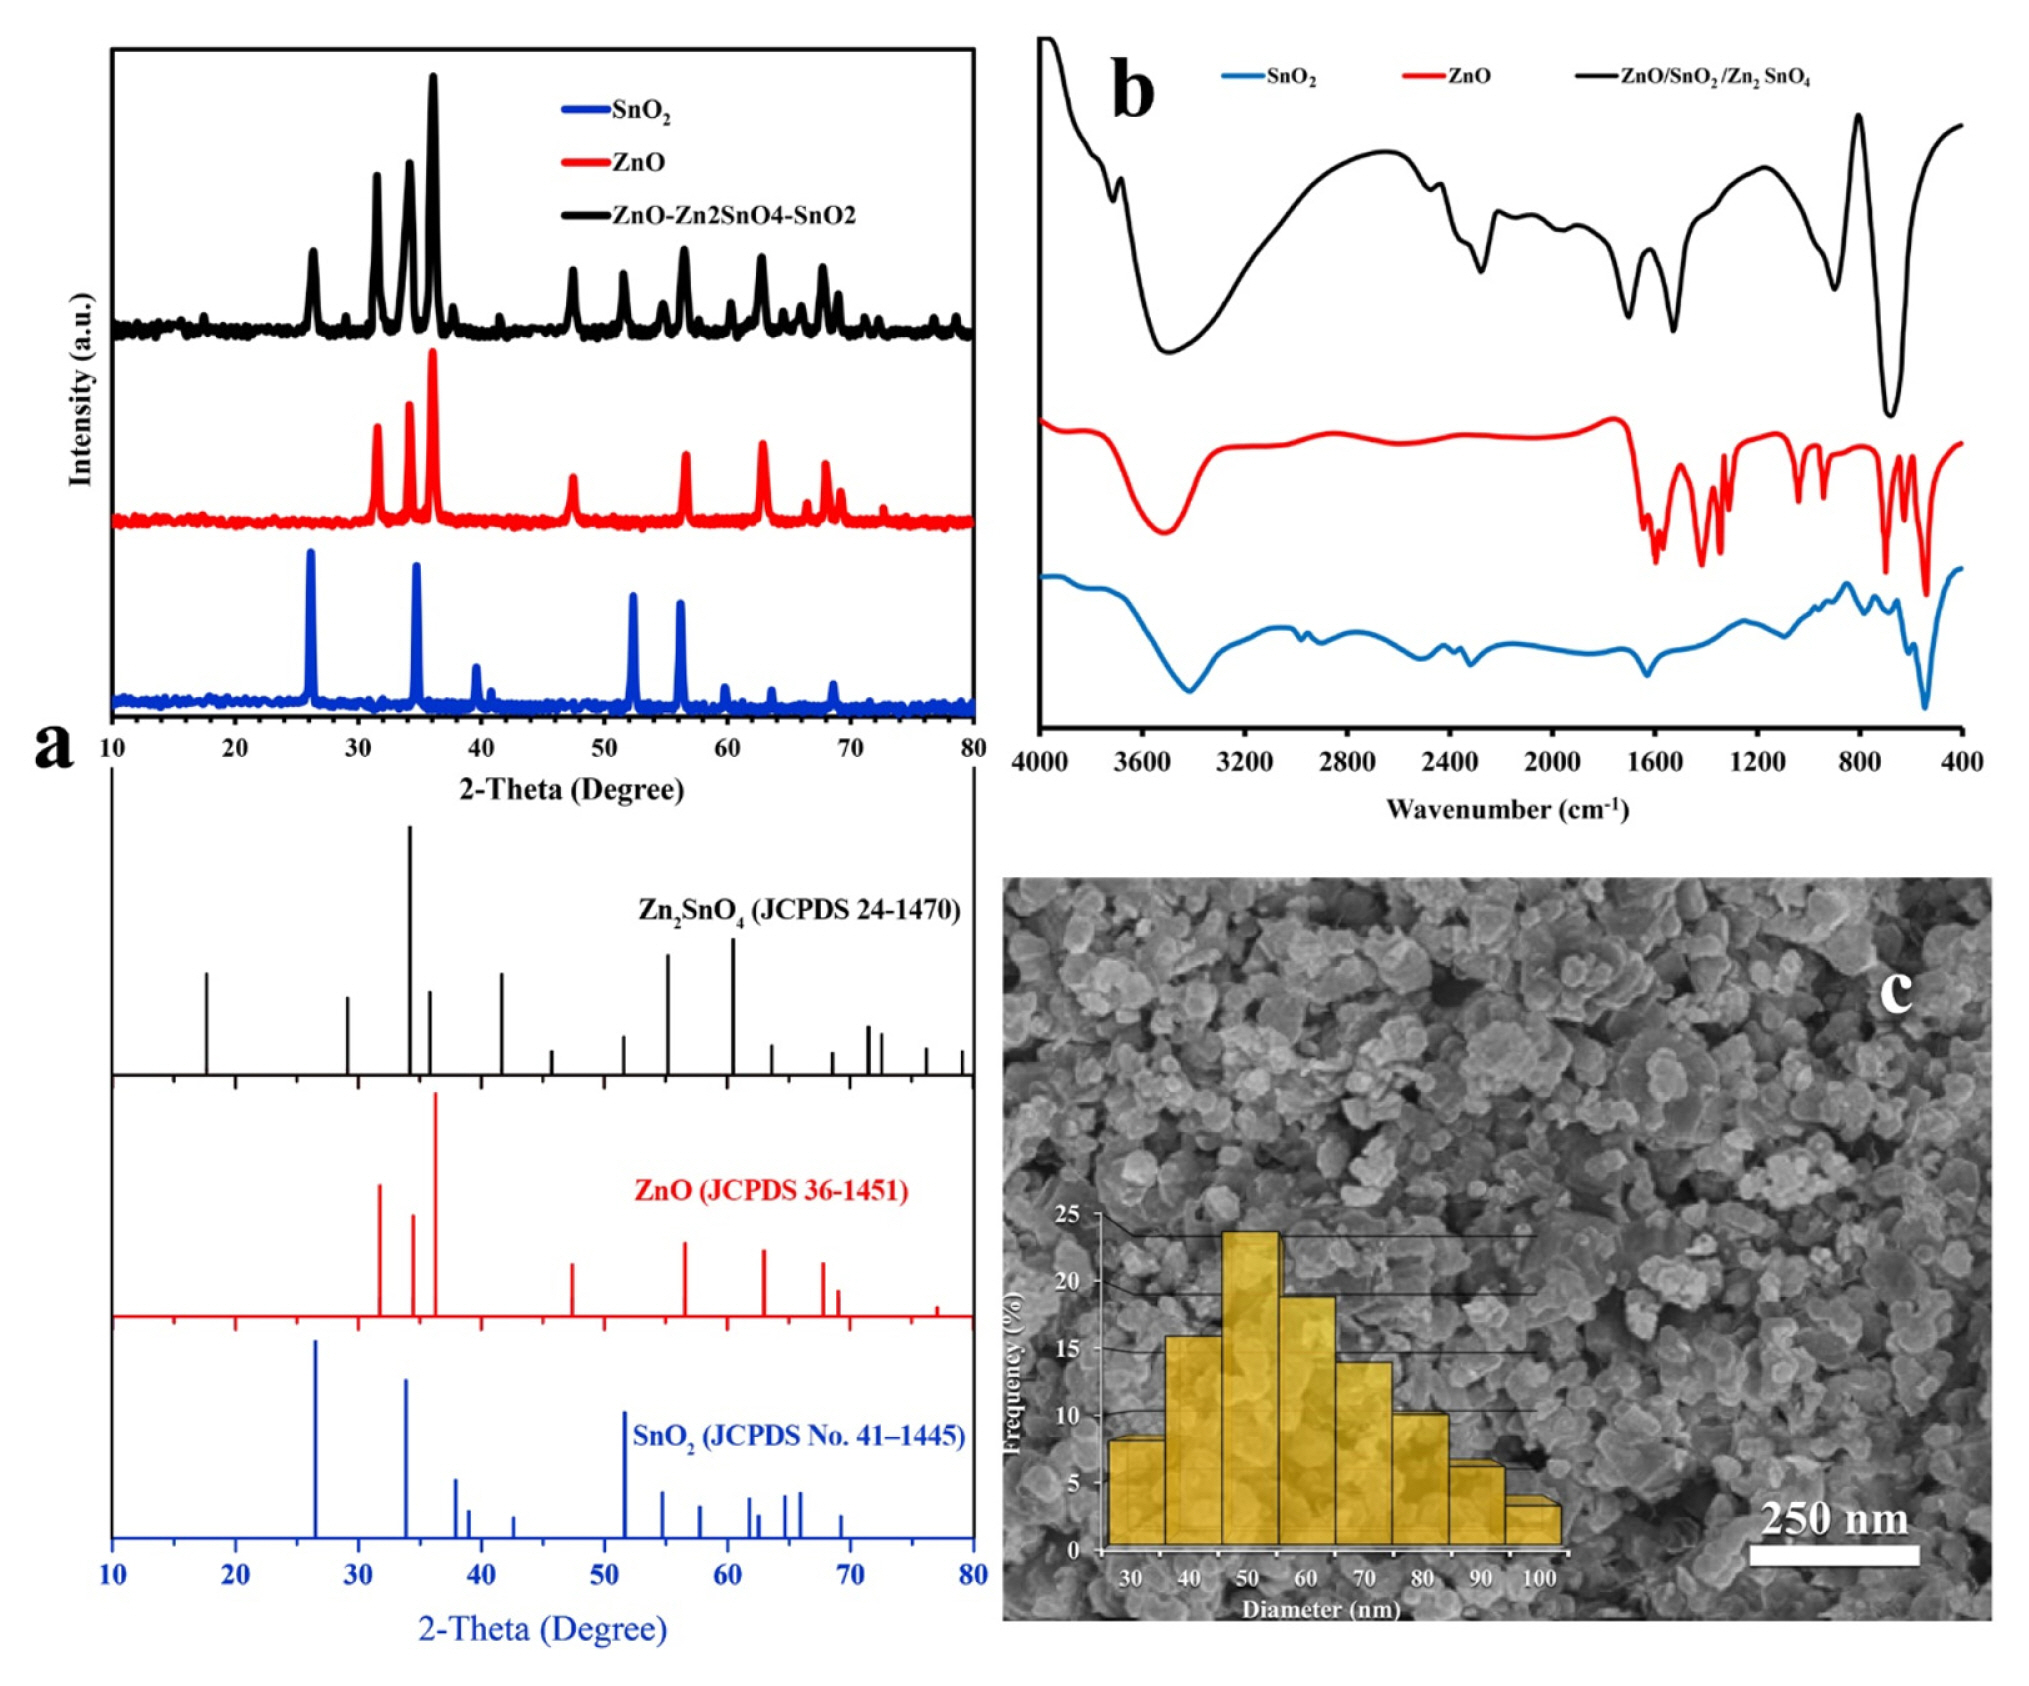
(a) The XRD patterns, the XRD standard pattern (b) the FTIR spectra of the synthesized SnO2, ZnO and ZnO-Zn2SnO4-SnO2; (c) SEM image of ZnO-Zn2SnO4-SnO2 (Inset: The plot of particle size).
The XRD pattern of ZnO nanoparticles illustrates 10 peaks at 2θ=31.56° (100), 34.16° (002), 36.04° (101), 47.47° (102), 56.64° (110), 62.87° (103), 66.46° (200), 67.97° (112), 69.19° (201), and 72.65° (004), which are well agree with JCPDS 36–1451 [54].
The XRD pattern of ZnO-Zn2SnO4-SnO2 nanocomposite represents distinct peaks at 2θ=26.36°, 37.69°, 41.46°, 51.54°, 56.48°, 60.27°, and 62.76° (these peaks are related to SnO2), 31.52°, 36.08°, 56.48°, 65.99°, 67.73°, 69.02° and 72.28° (these peaks are related to ZnO) and 17.46°, 28.99°, 34.18°, 47.45°, 51.54° and 62.76° (these peaks are related to Zn2SnO4, which well agrees with JCPDS 24–1470), which are well-matched with tetragonal structured SnO2 nanoparticles and the hexagonal wurtzite structured ZnO nanoparticles [55].
The FTIR technique was used for investigation of the functional group of the synthesized SnO2, ZnO and, ZnO-Zn2SnO4-SnO2 nanocomposite, and the FTIR spectra are shown in Fig. 1b.
The FTIR spectrum of SnO2 shows several bands at 3417, 2979, 1626 cm−1 (vibration of hydroxyl group), 787, 906 and 958 cm−1 (vibration of Sn=O and Sn–O), 546 cm−1 (Sn–O antisymmetric vibrations), 685 cm−1 (Sn–O–Sn vibrations) [56]. For the ZnO nanoparticles sample, the FTIR spectrum represents the peaks at 3507 cm−1 (O-H stretching), 1643 cm−1 (Zn-O stretching), 627 cm−1 (Zn-O deformation vibration) and 539 cm−1 is attributed to Zn-O [57]. For ZnO-Zn2SnO4-SnO2 nanocomposite, the FTIR spectrum shows two strong absorbance band at 3515 and 1529 cm−1 which are attributed to the stretching vibration of H-O-H and bending vibrations of O-H, respectively. Also, the peaks around 673, 896, and 1701 cm−1 correspond to the vibration of metal-oxygen or metal-oxygen-metal in SnO2, Zn2SnO4 and ZnO [58]. An intense and broad band in the range of 3500 to 3200 cm−1 in the synthesized SnO2, ZnO nanoparticles and ZnO-Zn2SnO4-SnO2 nanocomposite is assigned to O-H stretching of water molecule absorbed on the surface of nanomaterials [59–61].
In order to investigate the size, morphology and, uniformity of synthesized the nanocomposites, SEM analysis was conducted. The SEM image in Fig. 1c shows the morphology of the prepared ZnO-Zn2SnO4-SnO2 nanocomposite with an average size of approximately 50 nm, and the inset shows the range of nanocomposite size.
The provided results by FTIR, XRD and, SEM analysis confirmed the successful formation of the ZnO-Zn2SnO4-SnO2 nanocomposite.
3.2. Investigation electrochemical reactivity of the constructed electrodes
The electrochemical characteristic of the constructed modified and unmodified sensor was investigated in the presence of 5.0 mM [Fe(CN)6]3−/4− and 1.0 M KCl by the cyclic voltammetry technique (CV).
The voltammograms of CPE, Gr/CPE, SnO2/Gr/CPE, ZnO/Gr/CPE and, ZnO-Zn2SnO4-SnO2/Gr/CPE are shown in Fig. 2a. The probe illustrates a weak redox peak with high electrochemical peak separation (ΔEp) by using the bare CPE as the working electrode. By modification of CPE with Gr, the electrochemical responses have increased, and the ΔEp = Epa - Epc has reduced to 304 mV. Besides, well-defined cathodic and anodic peaks were observed at the SnO2/Gr/CPE and ZnO/Gr/CPE, with ΔEp = 234 and 184 mV, respectively. Also, for these two electrodes, the electrochemical currents were 1.74 and 2.26-fold in comparison to Gr/CPE.
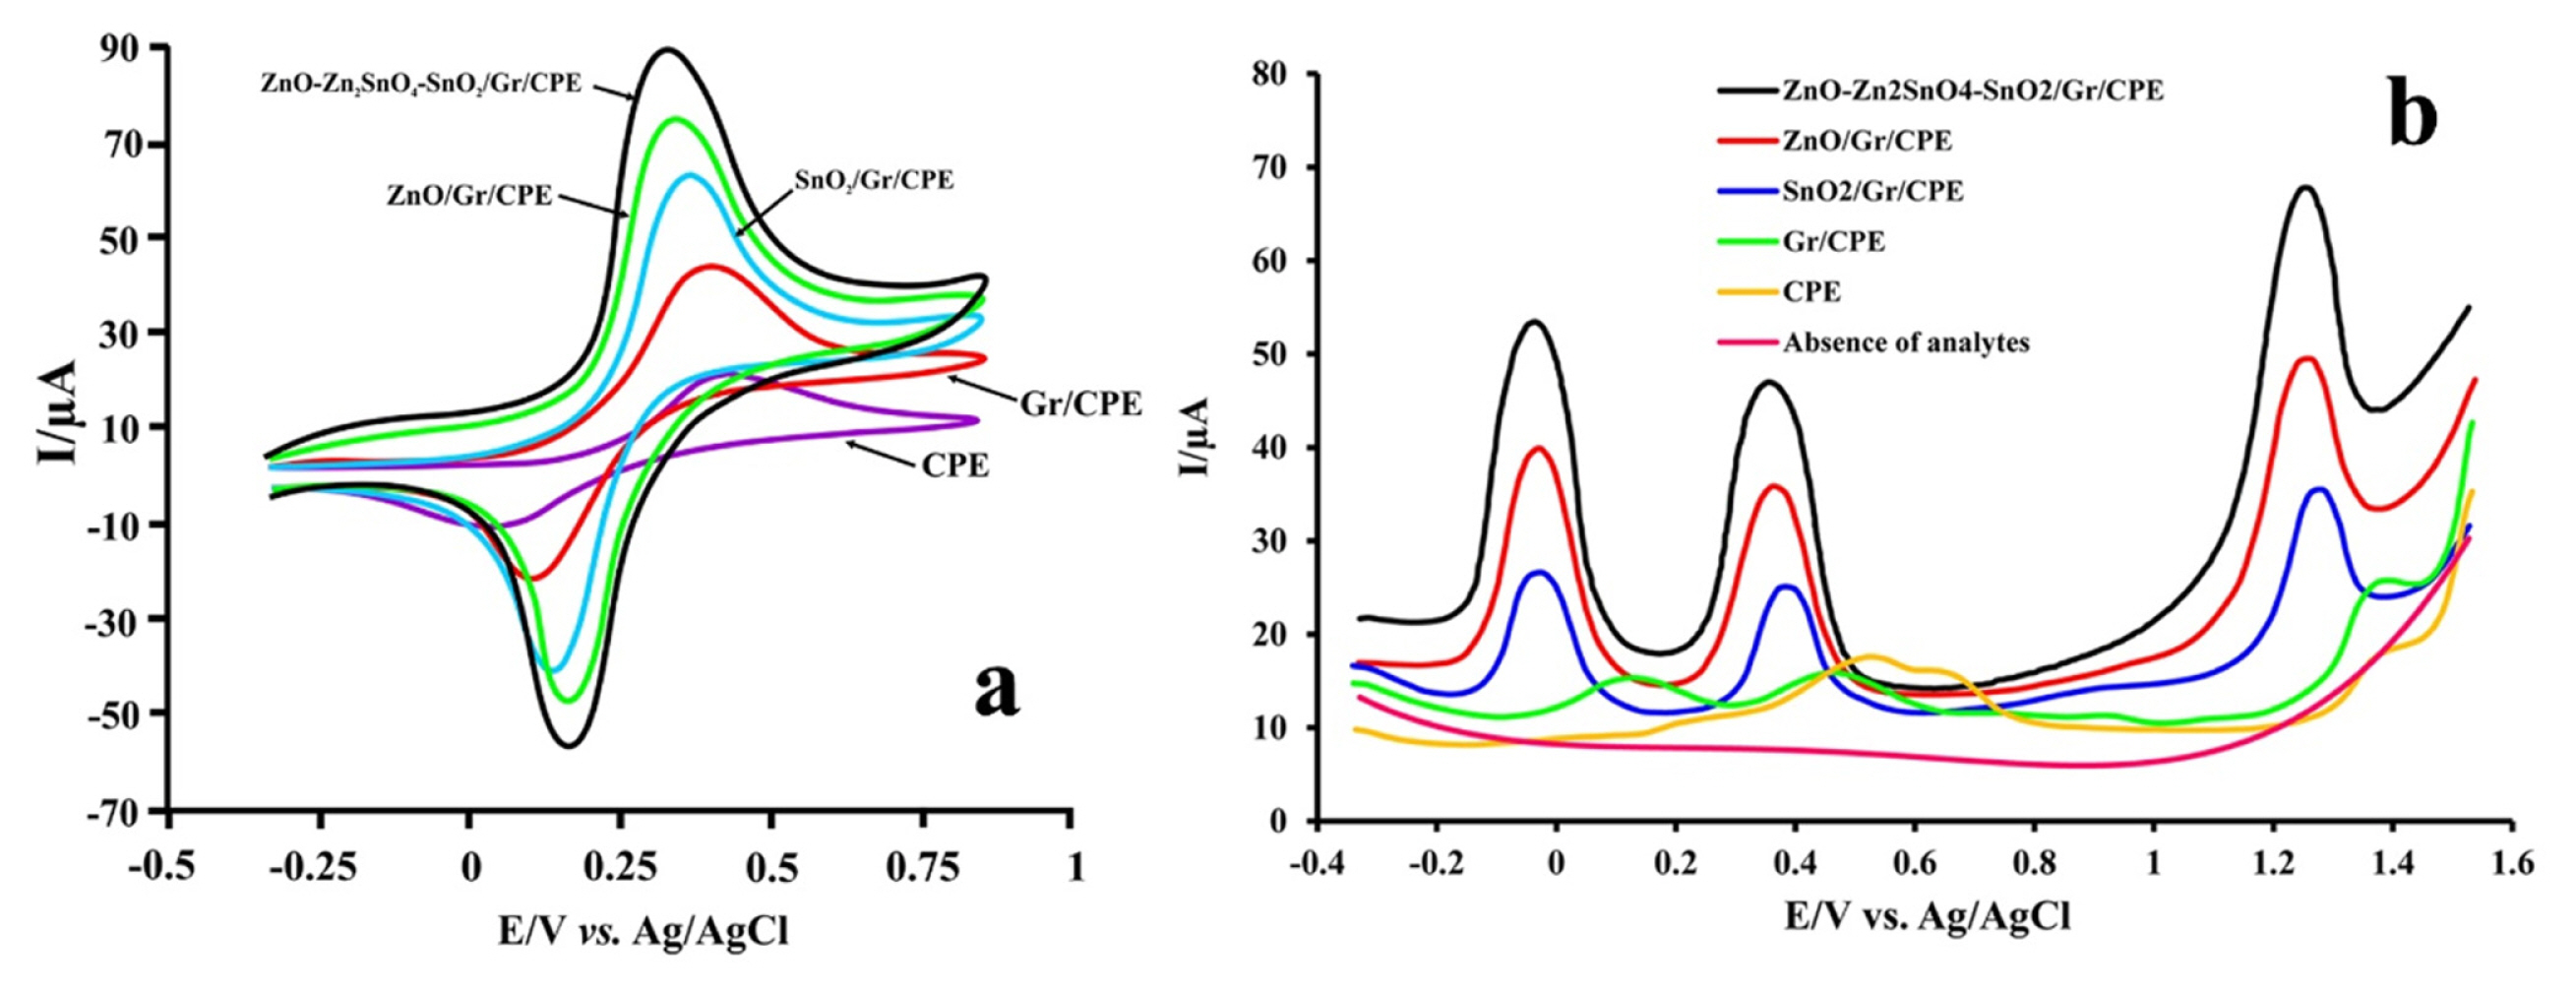
(a) CVs of the bare CPE, Gr/CPE, SnO2/Gr/CPE, ZnO/Gr/CPE and ZnO-Zn2SnO4-SnO2/Gr/CPE in 5.0 mM [Fe(CN)6]3−/4− and 1.0 M KCl (Scan Rate=100 mV/s); (b) DPV of the bare CPE, Gr/CPE, SnO2/Gr/CPE, ZnO/Gr/CPE and ZnO-Zn2SnO4-SnO2/Gr/CPE in the presence of 7.0 μM AA, 5.0 μM AC and 6.0 μM Caf and ZnO-Zn2SnO4-SnO2/Gr/CPE in the absence of the analytes.
Furthermore, by the addition of ZnO-Zn2SnO4-SnO2 and Gr into the matrix of paste, the redox currents increase significantly while the ΔEp is reduced to 170 mV. The redox current is about 2.61, 1.5 and 1.15 time than those of Gr/CPE, SnO2/Gr/CPE, and ZnO/Gr/CPE, and the ΔEp was minimum among all other investigated electrodes (about 0.5, 0.73 and 0.92 -old compared with Gr/CPE, SnO2/Gr/CPE, and ZnO/Gr/CPE, respectively).
A hybrid nanomaterial comprised of ZnO and SnO2 nanoparticles like ZnO-Zn2SnO4-SnO2 nanocomposite act as a multi-component system in which two or more of its combinations result in the enhancement of functional properties. Both ZnO and SnO2 are well-known wide direct band-gap (Eg= 3.37 eV and 3.6 eV at 300 K respectively) semiconductors, and both serve as an excellent candidate in the field of electrochemistry and physics, especially using in the electrochemical sensor as a modifier with electrocatalytic properties. Recent investigations also state that the addition of a secondary component oxide in the form of the composite inhibits the grain growth of the host material and these coupled oxides with different bandgap widths are the effective approaches to enhance the electrocatalytic effect in comparison to ZnO and SnO2 nanoparticles [62–64].
3.3. DPV behavior of the modified electrodes
The electrochemical behavior of 7 μM AA, 5 μM AC, and 6 μM Caf at pH=7.2 on the CPE, Gr/CPE, SnO2/Gr/CPE, ZnO/Gr/CPE and, ZnO-Zn2SnO4-SnO2/Gr/CPE was studied by DPV, and the obtained voltammograms are shown in Fig. 2b.
As can be seen in this figure, the bare CPE shows two broad and weak peaks at 0.524 and 1.4 V and a shoulder at 0.623 mV related to AA, Caf and, AC, respectively. It should be noted that, since the oxidation peak potential (Epa) separation for AA and AC on the surface of bare CPE is not large enough (ΔEpa (AA-AC)=99 mV), the simultaneous determination of the analytes by using this electrode was not possible. Modification of CPE with Gr leads to the separation of oxidation peaks of AA and AC (ΔEpa (AA-AC)= 332 mV) while the oxidation currents (Ipa) of AA and AC remain about 5 μA. However, the oxidation current for Caf has been relatively increased. Compared to the Gr/CPE, at the surface of SnO2/Gr/CPE and ZnO/Gr/CPE three well-defined peaks with the shifts of about −23, 398 and, −1280 mV for AA, AC and Caf, respectively. Base on the results ΔEpa (AA-AC) = 421 mV and ΔEpa (AC-Caf) = 0.882 mV, so the simultaneous measurement of the mention molecules became possible. Besides, the SnO2/Gr/CPE and ZnO/Gr/CPE improved the oxidation peaks current of AA and AC, Caf significantly.
The best voltammograms were recorded at ZnO-Zn2SnO4-SnO2/Gr/CPE. The Ipa for AA and AC, Caf at this electrode were increased by almost 6.77, 7.60 and, 4.81-fold compared to Gr/CPE, which is due to the synergetic effect of ZnO-Zn2SnO4-SnO2 nanocomposite and Gr as electrocatalytic modifiers and the larger surface area of the nanocomposite film. In the absence of target analytes ions, the ZnO-Zn2SnO4-SnO2/Gr/CPE did not show any oxidation peaks in the potential window between −0.4 and 1.5 V.
The electrocatalytic ability of ZnO-Zn2SnO4-SnO2/Gr/CPE which results in the increased Ipa and peak separation makes it the best choice among the other electrodes for the simultaneous determination of AA and AC, Caf; therefore it was used as working electrode in following experiments.
3.4. The impact of solution pH on the oxidation of AA and AC, Caf at the ZnO-Zn2SnO4-SnO2/Gr/CPE
The CV and DPV techniques were used for investigating the impact of pH value on the oxidation peak potentials and peak currents of the 3 μM analytes at the ZnO-Zn2SnO4-SnO2/Gr/CPE in a pH range of 5–10 (Fig. 3a and 3d–f). It is clear from DPVs that by increasing the value the peak currents of AA, AC, and Caf have been initially increased and have reached the maximum value at pH=7.2, then they show a downtrend with increasing the pH values between 7.5 and 10 (Fig. 3b).
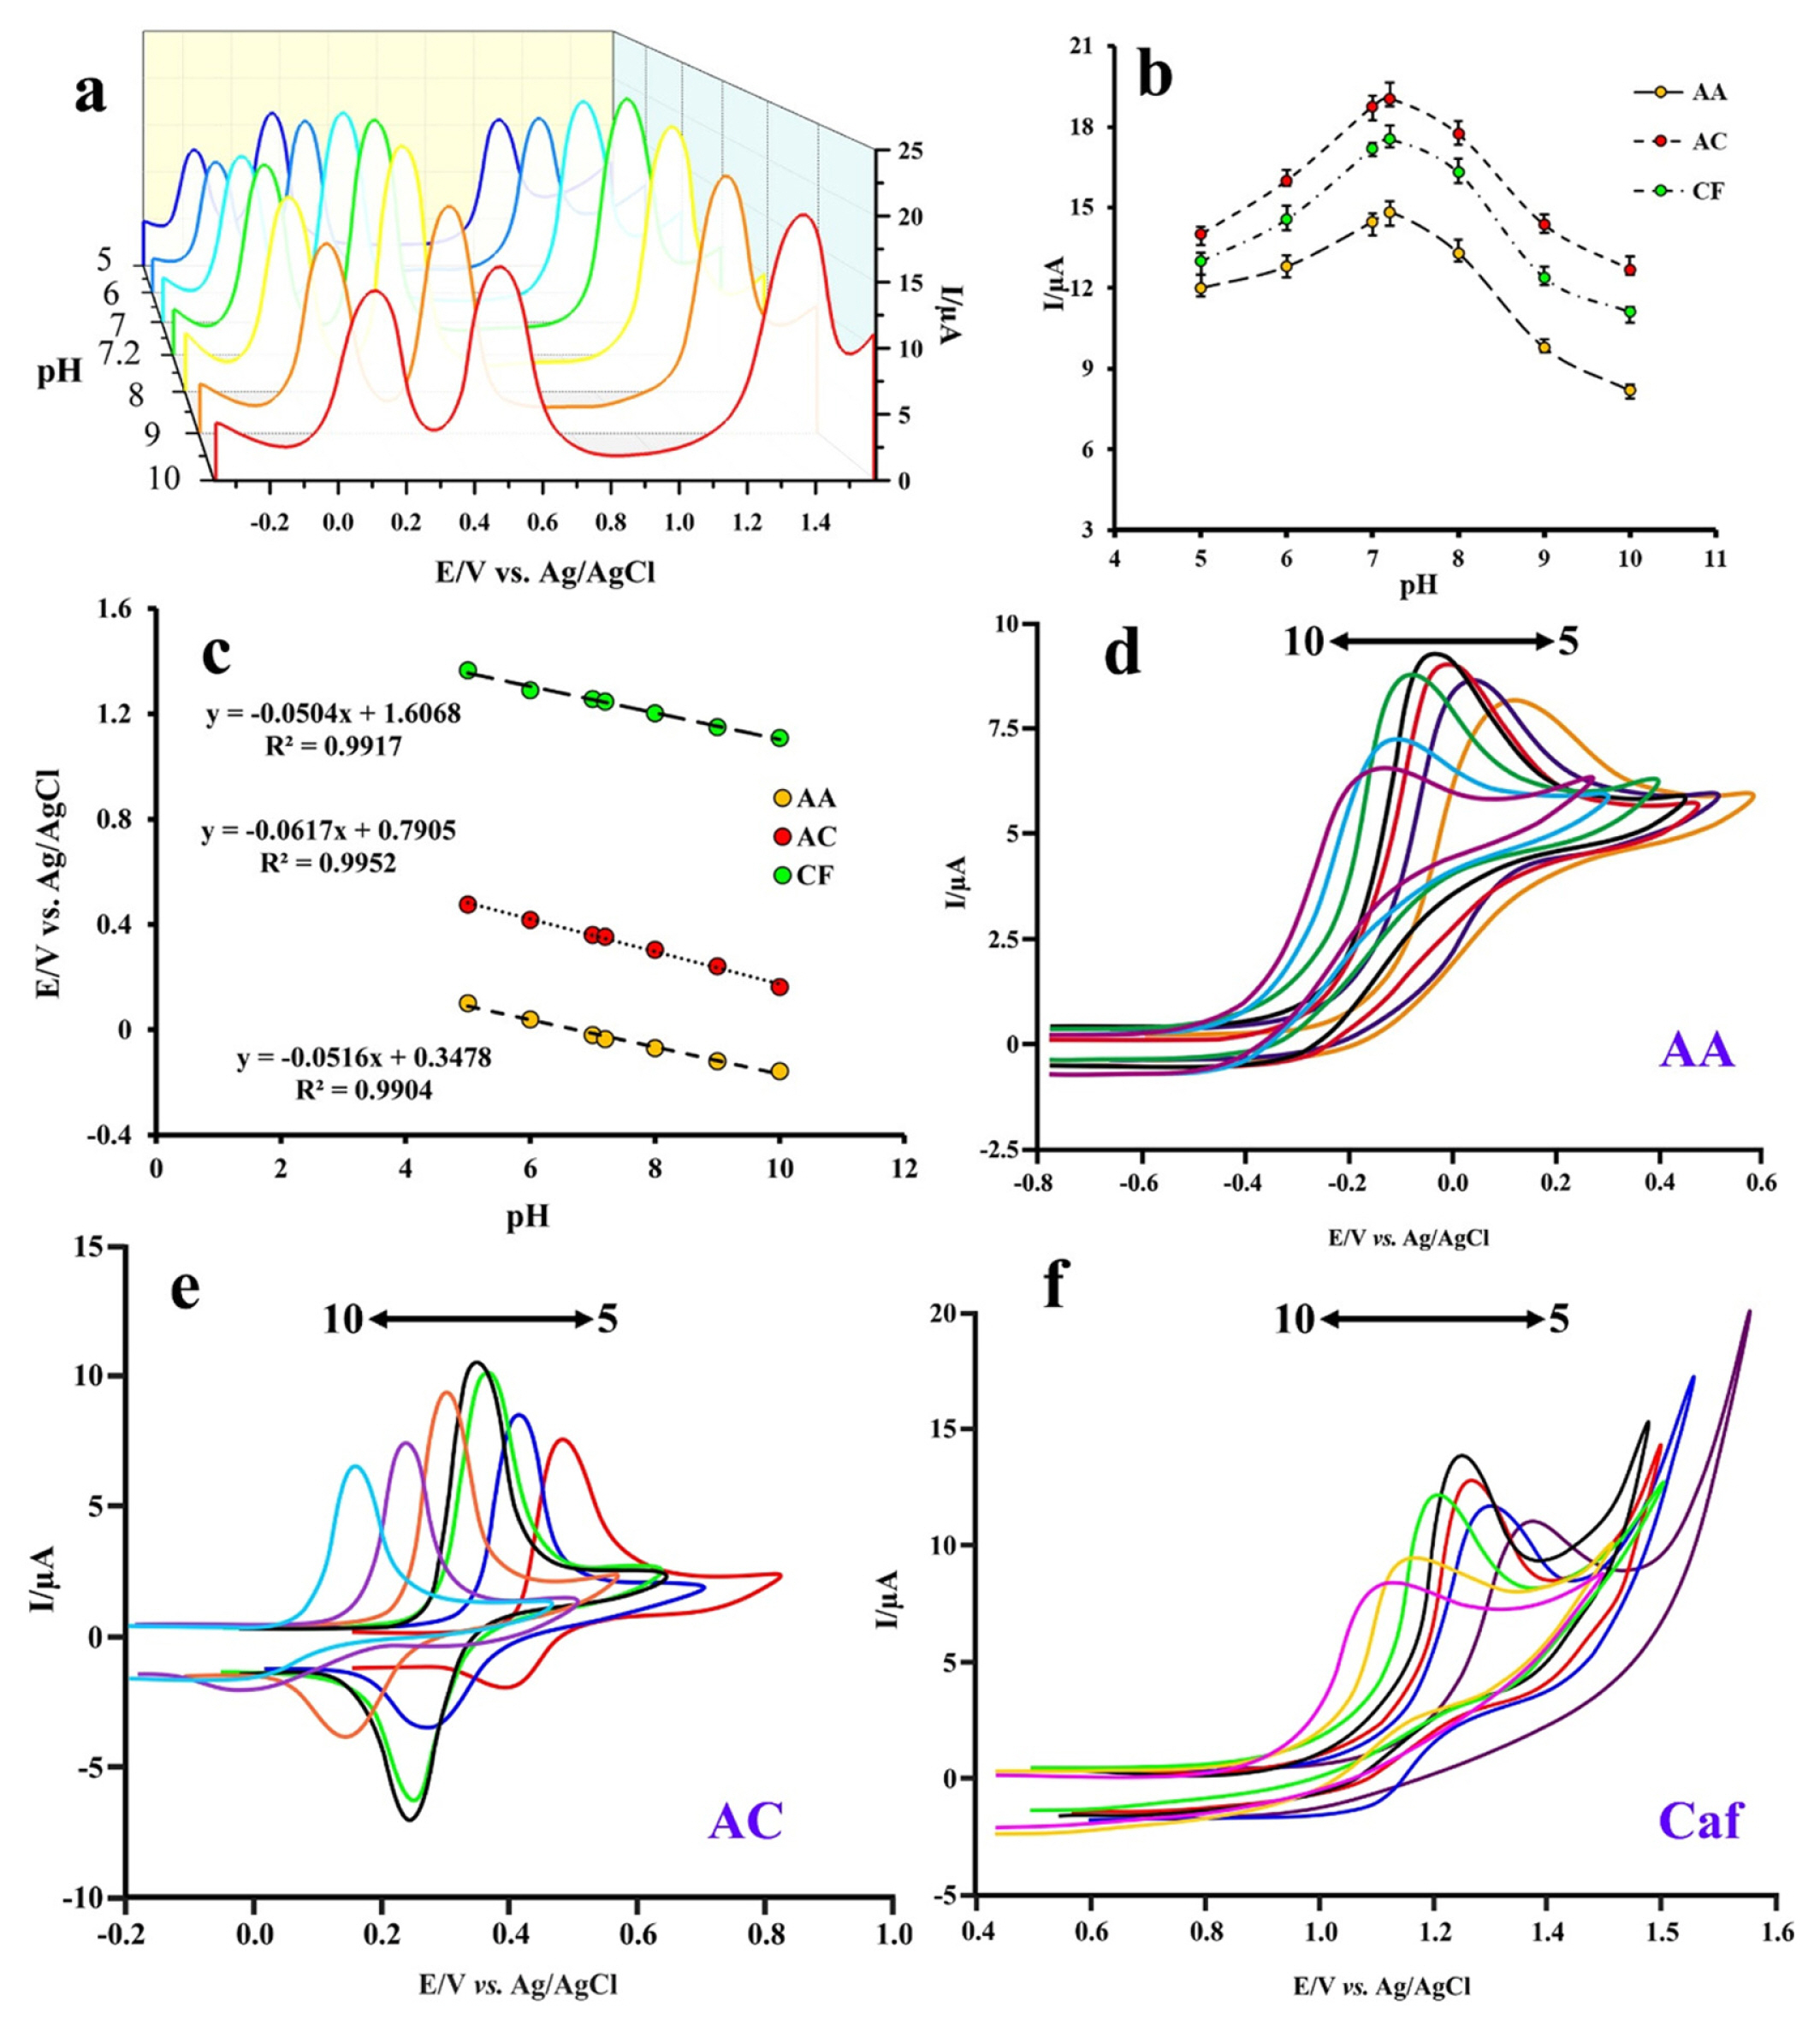
(a) The DPV of 3μM AA, AC and Caf at ZnO-Zn2SnO4-SnO2/Gr/CPE at different pH include 5,6,7,7.2,8,9, and 10; The influence of pH on (b) current and (c) potential of the peak of the analytes; The CV of 3μM (d) AA, (e) AC and (f) Caf at ZnO-Zn2SnO4-SnO2/Gr/CPE at different pH between 5 and 10. The number of replicates (n)=5.
Besides it can be seen that by increasing the pH values, the oxidation peak potentials of the target molecules have shifted to the negative direction and the relationship between peak potential (Fig. 3c) and pH is linear as following equations:
The obtained slope values (dEpa/dpH) for AA, AC, and Caf were very close to the theoretical value of 59 mV/pH at 25°C expected from the Nernst equation, which indicates that same number of protons and electrons have participated in the electro-oxidation of the analytes at the surface of ZnO-Zn2SnO4-SnO2/Gr/CPE. Based on these results and also concerning the previous studies, it was proposed that for the oxidation of AA and AC two electrons an two protons are involved, while for the oxidation of Caf four electrons and four protons are participating (see Scheme 1) [10,65].

Electrochemical suggested oxidation mechanism for AA, AC and Caf.
Further studies on the impact of pH on the electro-oxidation of 3 μM analytes at the ZnO-Zn2SnO4-SnO2/Gr/CPE carried out using CV technique, and the obtained voltammograms are depicted in Fig. 3d–f. AA and Caf show an irreversible peak with the maximum current at pH=7.2. Also, the peak potential was affected by changes in pH and have shifted negatively by increasing pH value.
3.5. Effect of scan rate on AA and AC, Caf oxidation at ZnO-Zn2SnO4-SnO2/Gr/CPE
CVs obtained for 5 μM AA and AC, Caf at ZnO-Zn2SnO4-SnO2/Gr/CPE in 0.1 M B-R buffer solution pH=7.2 at scan rates ranging from 10 to 400 mV/s are shown in Fig. 4aI, 4bI and, cI. As can be seen, the response of the electrode for oxidation of three analytes increases while the rate of scanning the potentials increasing between 10 and 400 mV/s, the relationship between the current signals and square root of scan rates is linear with the equations: AA: Ipa = 1.2321ν1/2 – 1.2448 (R2 = 0.9953), AC: Ipa = 1.4314ν1/2 + 0.0735 (R2 = 0.9953) and Caf: Ipa = 1.5588ν1/2 – 1.8498 (R2 = 0.9955), which indicates that the electrochemical oxidation reactions of AA, AC and Caf at ZnO-Zn2SnO4-SnO2/Gr/CPE are diffusion-controlled processes (Fig. 4aII, 4bII and, cII).

CVs at ZnO-Zn2SnO4-SnO2/Gr/CPE in B-R buffer solution with pH 7.2 containing 5 μM (aI) AA, (bI) AC and (cI) Caf with scan rates ranging from 10 to 400 mV s−1; The linear relationship between the peak current vs. square root of the scan rate (υ1/2) for aII: AA, bII: AC and cII: Caf; The linear relationship between the Log peak current vs. Log scan rate for aIII: AA, bIII: AC and cIII: Caf, n=5.
According to previous reports, when the slope of the logarithm of the oxidation peak currents versus the logarithm of scan rates is 0.5, the electrochemical reaction is a diffusion-controlled process. In contrast, the slope of 1, the electrochemical reaction occurs via an adsorption-controlled process [66]. Therefore, based on the obtained results, i.e., Equations. 4–6, and Fig. 4aIII, 4bIII, and cIII diffusion-controlled processes for the oxidation of AA, AC, and Caf on the ZnO-Zn2SnO4-SnO2/Gr/CPE are expected.
3.6. Calibration curve and analytical parameters for AA, AC and Caf determination
Method validation such as linear range of determination, correlation coefficients of the calibration curve, and detection limits (DLs) were investigated using DPV and amperometric techniques at pH=7.2 (Fig. 5).
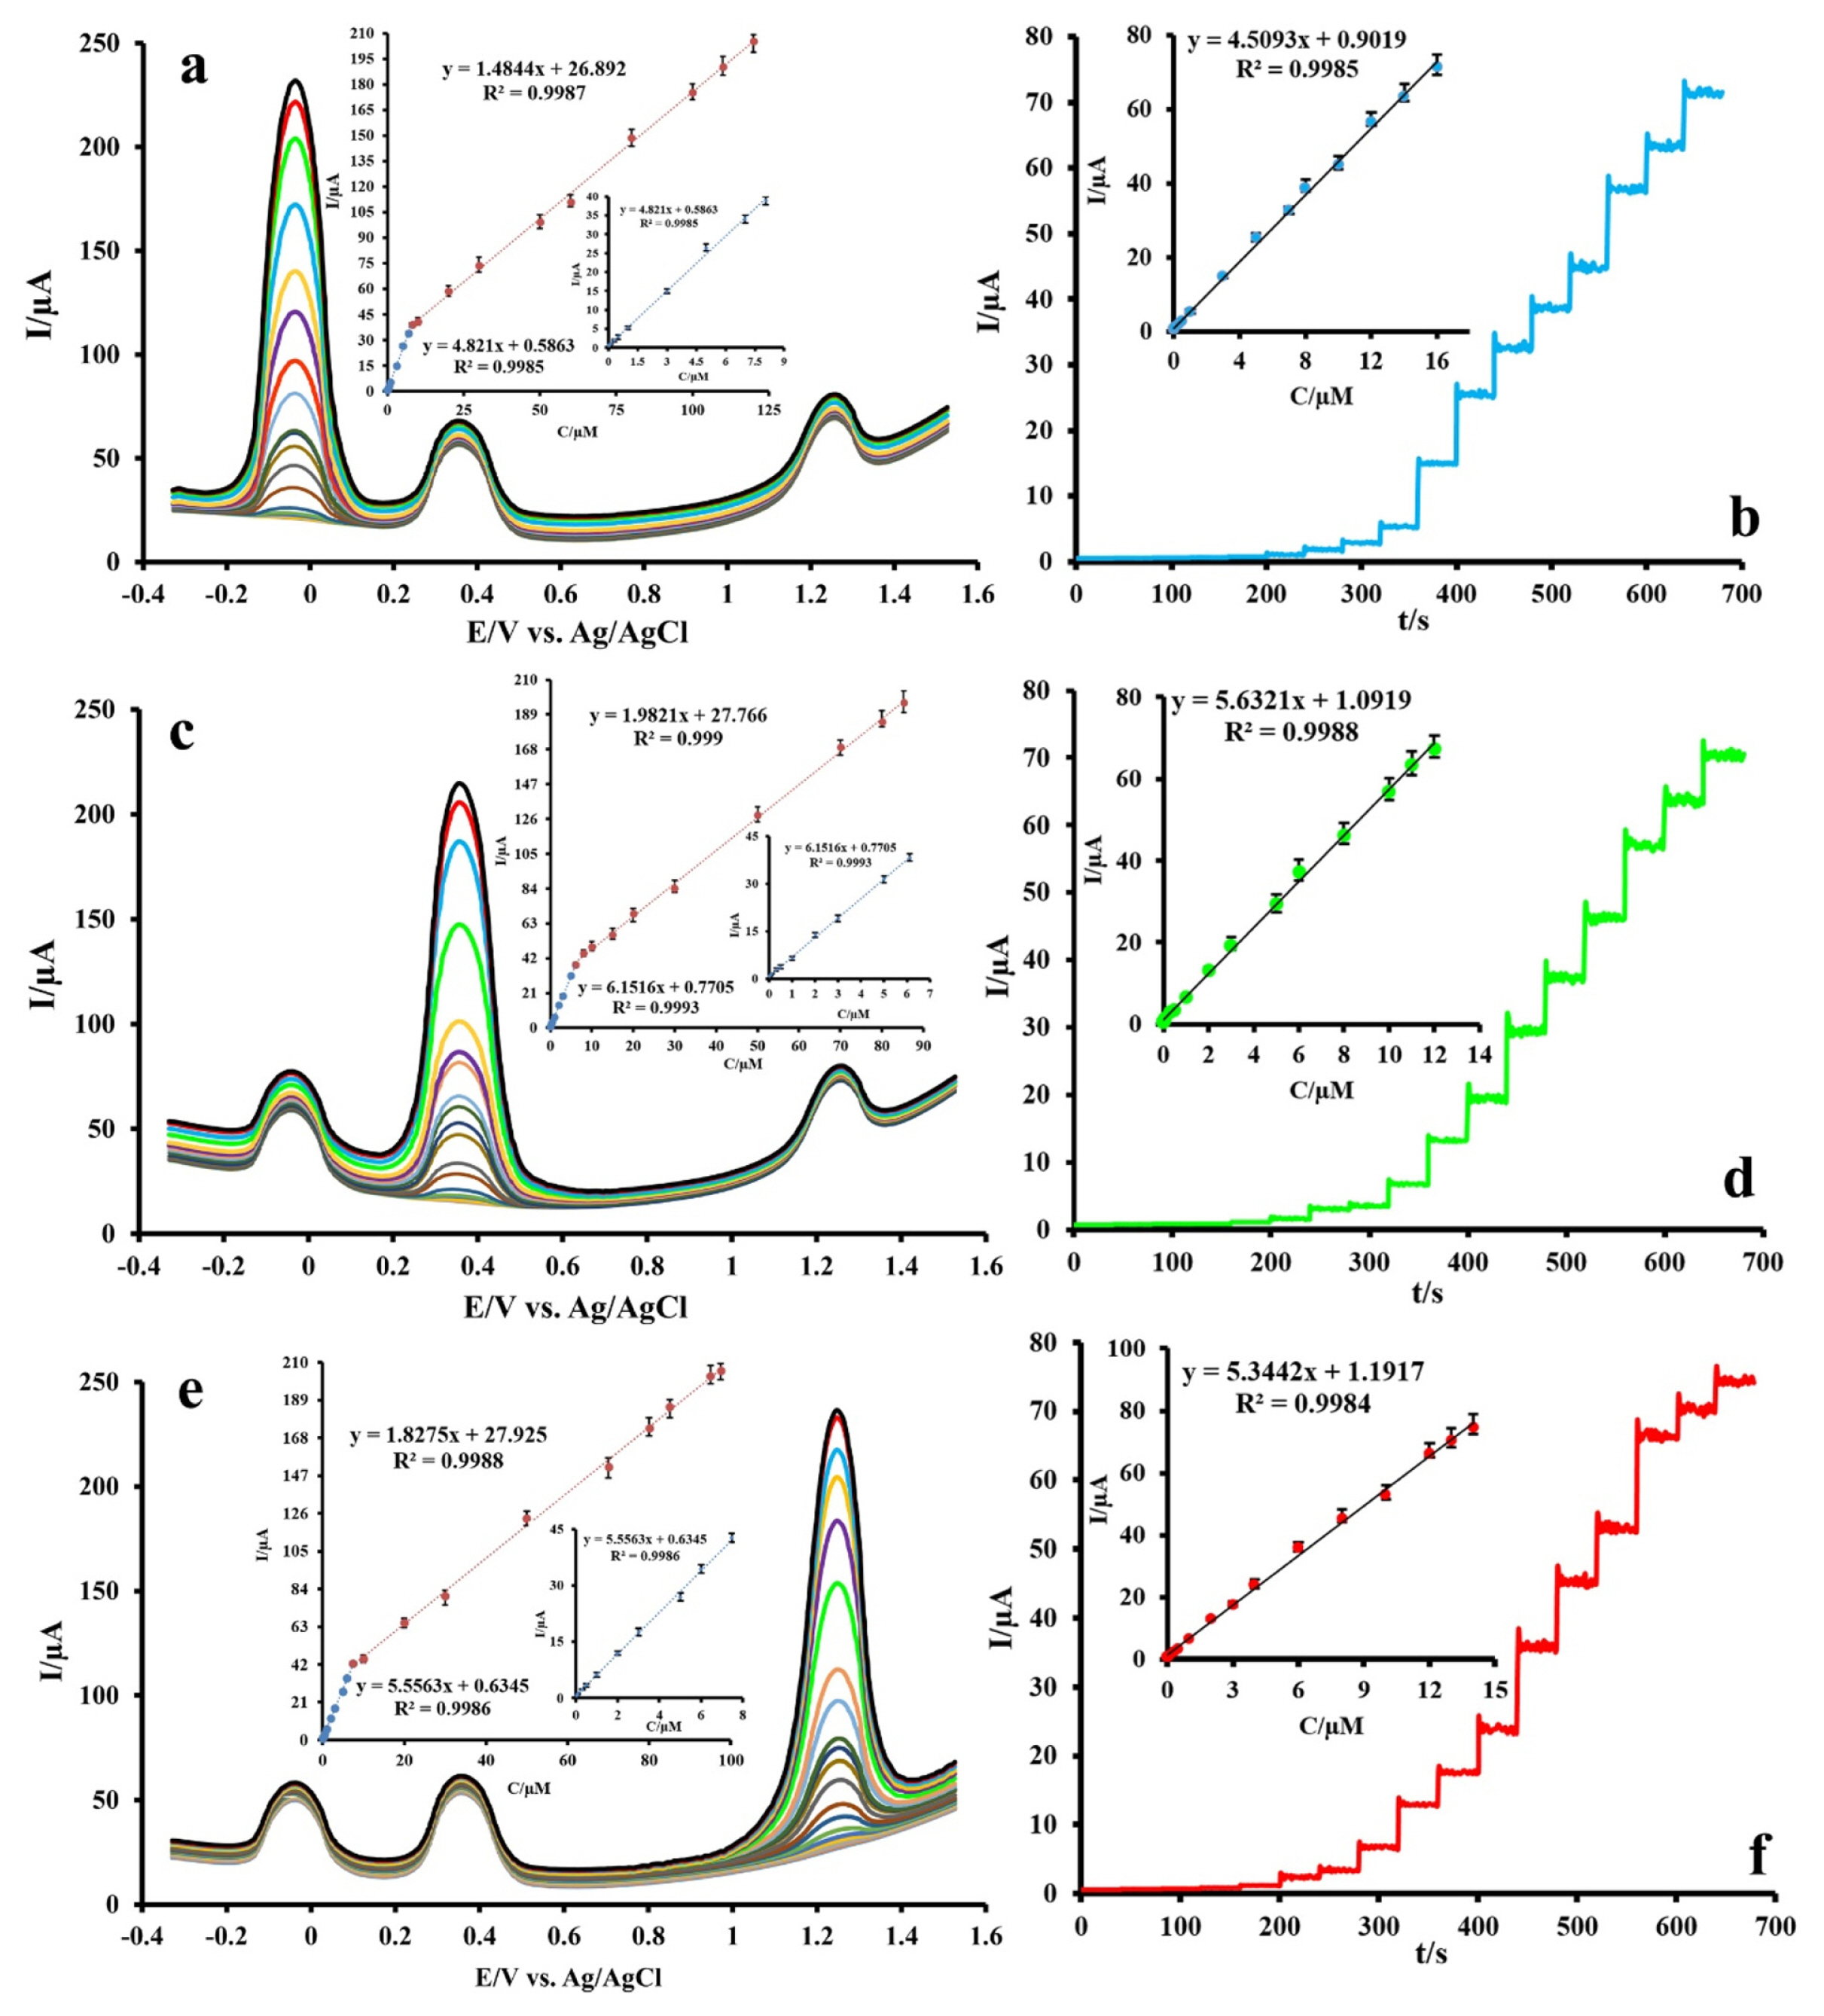
DPVs at ZnO-Zn2SnO4-SnO2/Gr/CPE in B-R buffer solution pH = 7.2 for (a) AA: 0.021–8.06 and 8.06–120 μM in the presence of 8.0 μM AC and 6.0 μM Caf, (c) AC: 0.018–6.12 and 6.12–85.3 μM in the presence of 7.0 μM AA and 6.0 μM Caf, (e) Caf: 0.02–7.46 and 7.46–97.51 μM in the presence of 8.0 μM AC and 7.0 μM AA, n=5. Amperometric responses of the ZnO-Zn2SnO4-SnO2/Gr/CPE for determination of (b) AA, (d) AC and (f) Caf in the applied potential of −0.023, 0.398 and 1.28 V for AA, AC and Caf, respectively; in B-R buffer solution pH=7.2 and the constant stirring rate of 100 rpm.
As can be seen in Fig. 5 a, c and e, under the optimized conditions, the voltammetric anodic peak currents of each analyte in the presence of a fixed amount of the two other analytes were proportional to the concentration with the regression equation in the linear range of AA: 0.021–8.06 (Ipa = 4.821C + 0.5863; R2 = 0.9985) and 8.06–120 μM (Ipa = 1.4844C + 26.892: R2 = 0.9987), AC: 0.018–6.12 (Ipa = 6.1516C + 0.7705; R2 = 0.9993) and 6.12–85.3 μM (Ipa = 1.9821C + 27.766; R2 = 0.999), Caf: 0.02–7.46 (Ipa = 5.5563C + 0.6345; R2 = 0.9986) and 7.46–97.51 μM (Ipa = 1.8275C + 27.925; R2 = 0.9988).
Also, the amperometric technique was used for the monitoring of the analytes by stirring the B-R buffer solution with pH=7.2 at a constant rate of 100 rpm, and the obtained currents were collected at a fixed potential of −0.023, 0.398 and 1.28 V for AA, AC and Caf, respectively.
Fig. 5b, d and f show the amperometric currents vs. time of the ZnO-Zn2SnO4-SnO2/Gr/CPE for the determination of AA, AC and Caf, respectively. The ZnO-Zn2SnO4-SnO2/Gr/CPE demonstrates a linear response to AA, AC and Caf in the concentration range of 0.013–16, 0.008–12 and 0.01–14 μM with equations of Ipa = 4.5093C + 0.9019 (R2 = 0.9985), Ipa = 5.6321C + 1.0919 (R2 = 0.9988) and Ipa = 5.3442C + 1.1917 (R2 = 0.9984), respectively. Based on S/N = 3, the DLs were determined to be 6.28, 3.64 and 3.85 nM for AA, AC and Caf, respectively.
In another experiment, the simultaneous determination of AA, AC and, Caf was examined at the optimal condition. Good linearity of the oxidation peak current versus the concentrations of individual analytes was observed according to the following equations:
The DLs for AA, AC and, Caf in the simultaneous detection were calculated to be 8.94, 6.66 and, 7.09 nM, respectively. Also, a comparison between the slope of the equations in individual and, simultaneous determination for each species shows that the slopes are approximately equal, showing that the three analytes do not have any interference in the determination of each other.
The two linear regions in calibration curves and the higher slope of the first linear range than that of the second region may be ascribed to two reasons. First: the saturation of the surface of the modified electrode with the target molecules. This behavior decrement the sensitivity of the electrochemical sensor (slope of calibration curve) in the second linear region of the calibration curve maybe owning to the formation of an analyte sub-monolayer in the first range of the calibration curve and formation of a monolayer in the second range. Second: This discrepancy in slopes was due to the different activities of the electrode surface with low and high concentrations of the analytes. Due to the high number of active sites (compared to the total number of the analyte molecules) in the electrode surface in the lower concentration of the analytes, the slope of the first linear region of the calibration curve was high. While in the higher concentration of the analytes, due to decreasing active sites, the slope of the second linear region of the calibration curve decreased [67–70].
3.7. Interference and stability studies
The effect of some potentially interfering species on the detection of 1 μM AA, AC and Caf at ZnO-Zn2SnO4-SnO2/Gr/CPE was examined in detail at pH=7.2. The tolerance limits were taken as the maximum amount of the foreign ions and molecules, which lead to an about ±5% relative error in the current of measurements. The obtained data indicated that even 1000-fold of ions such as Li+, Na+, K+, Cl−, Ca2+, SO42−, CO32−, ClO4− and HCO32− has almost no effect on the response of the electrode. Also, 350-fold of fructose, lactose, glucose, 280-fold L-cysteine, tryptophan, tyrosine, urea, thiourea and 80-fold of dopamine and 4-fold of uric acid did not change the response of the electrode for determination of AA, AC and Caf more than 5%. Moreover, in the presence of the interfering species, no significant shift in the peak potentials was observed. The Fig. 7 represents the effect of some mentioned interfering species. Therefore, the ZnO-Zn2SnO4-SnO2/Gr/CPE can be considered as a well-modified sensor for the determination of AA, AC and, Caf in aqueous media.

DPVs at ZnO-Zn2SnO4-SnO2/Gr/CPE in B-R buffer solution pH = 7.2 for 1.0 μM AA, AC and Caf in the present of various concentration of (a) dopamine, (b) tryptophan, (c) tyrosine, (d) L-cysteine, (e) uric acid.
The anodic peak currents of 1 μM AA, AC and Caf at ZnO-Zn2SnO4-SnO2/Gr/CPE were almost unchanged (less than 5% reduction) when the electrode was stored in ambient temperature for 12 days.
3.8. Real samples analysis
The presented method was validated to determine the AA, AC and, Caf amount in different urine and serum samples in optimized condition by DPV technique, and the obtained results are represented in Table 1. The recoveries of the spiked samples calculated to be in the range of 95.8% to 104.06%. The results confirm that the ZnO-Zn2SnO4-SnO2/Gr/CPE is very reliable, selective and sensitive to determine of AA, AC and, Caf levels in biological samples.

Determination of AA, AC and Caf in Urine and serum samples (n = 5).
4. Conclusions
To sum up, a ZnO-Zn2SnO4-SnO2/Gr nanocomposite was synthesisied for the individual and simultaneous electrochemical monitoring of AA, AC and Caf in two real samples with different matrices. The electrochemical investigations showed that ZnO-Zn2SnO4-SnO2/Gr nanocomposite has high electrical conductivity; thus, it can be considered as a good candidate for using in the electrochemical application. The electro-oxidation of the three analytes is dependent on solution pH, and it was found that two electrons and two protons are involved in the oxidation of AA and, AC, and four electrons and four protons take part in the reaction of Caf at the surface of ZnO-Zn2SnO4-SnO2/Gr/CPE. The ZnO-Zn2SnO4-SnO2/Gr/CPE represents a desirable electrochemical response for determination of AA, AC and Caf with the wide linear range of AA: 0.021–8.06 and 8.06–120 μM, AC: 0.018–6.12 and 6.12–85.3 μM, Caf: 0.02–7.46 and 7.46–97.51 μM, and the DLs were calculated to be 8.94, 6.66 and 7.09 nM, respectively. The comparison of the presented method with some previous literature methods for the determination of AA, AC and Caf was listed in Table 2. These data show that the linear ranges and DLs of ZnO-Zn2SnO4-SnO2/Gr/CPE for determination of AA, AC and, Caf were comparable with those of other electrochemical sensors and the DLs obtained for AC and AA were the lowest by the proposed method, as shown in Table 2. Moreover, ZnO-Zn2SnO4-SnO2/Gr/CPE operates well in the determine of AA, AC and, Caf in urine and, serum samples with excellent accuracy and precision.
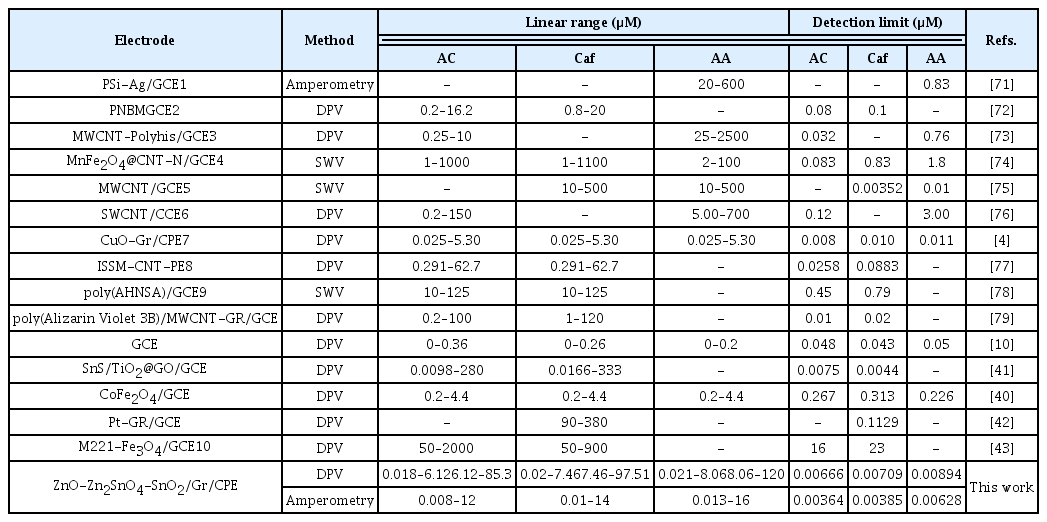
Comparison of the detection limits and linear ranges of the presented method with other electrochemical methods for the determination of AA, AC and Caf.
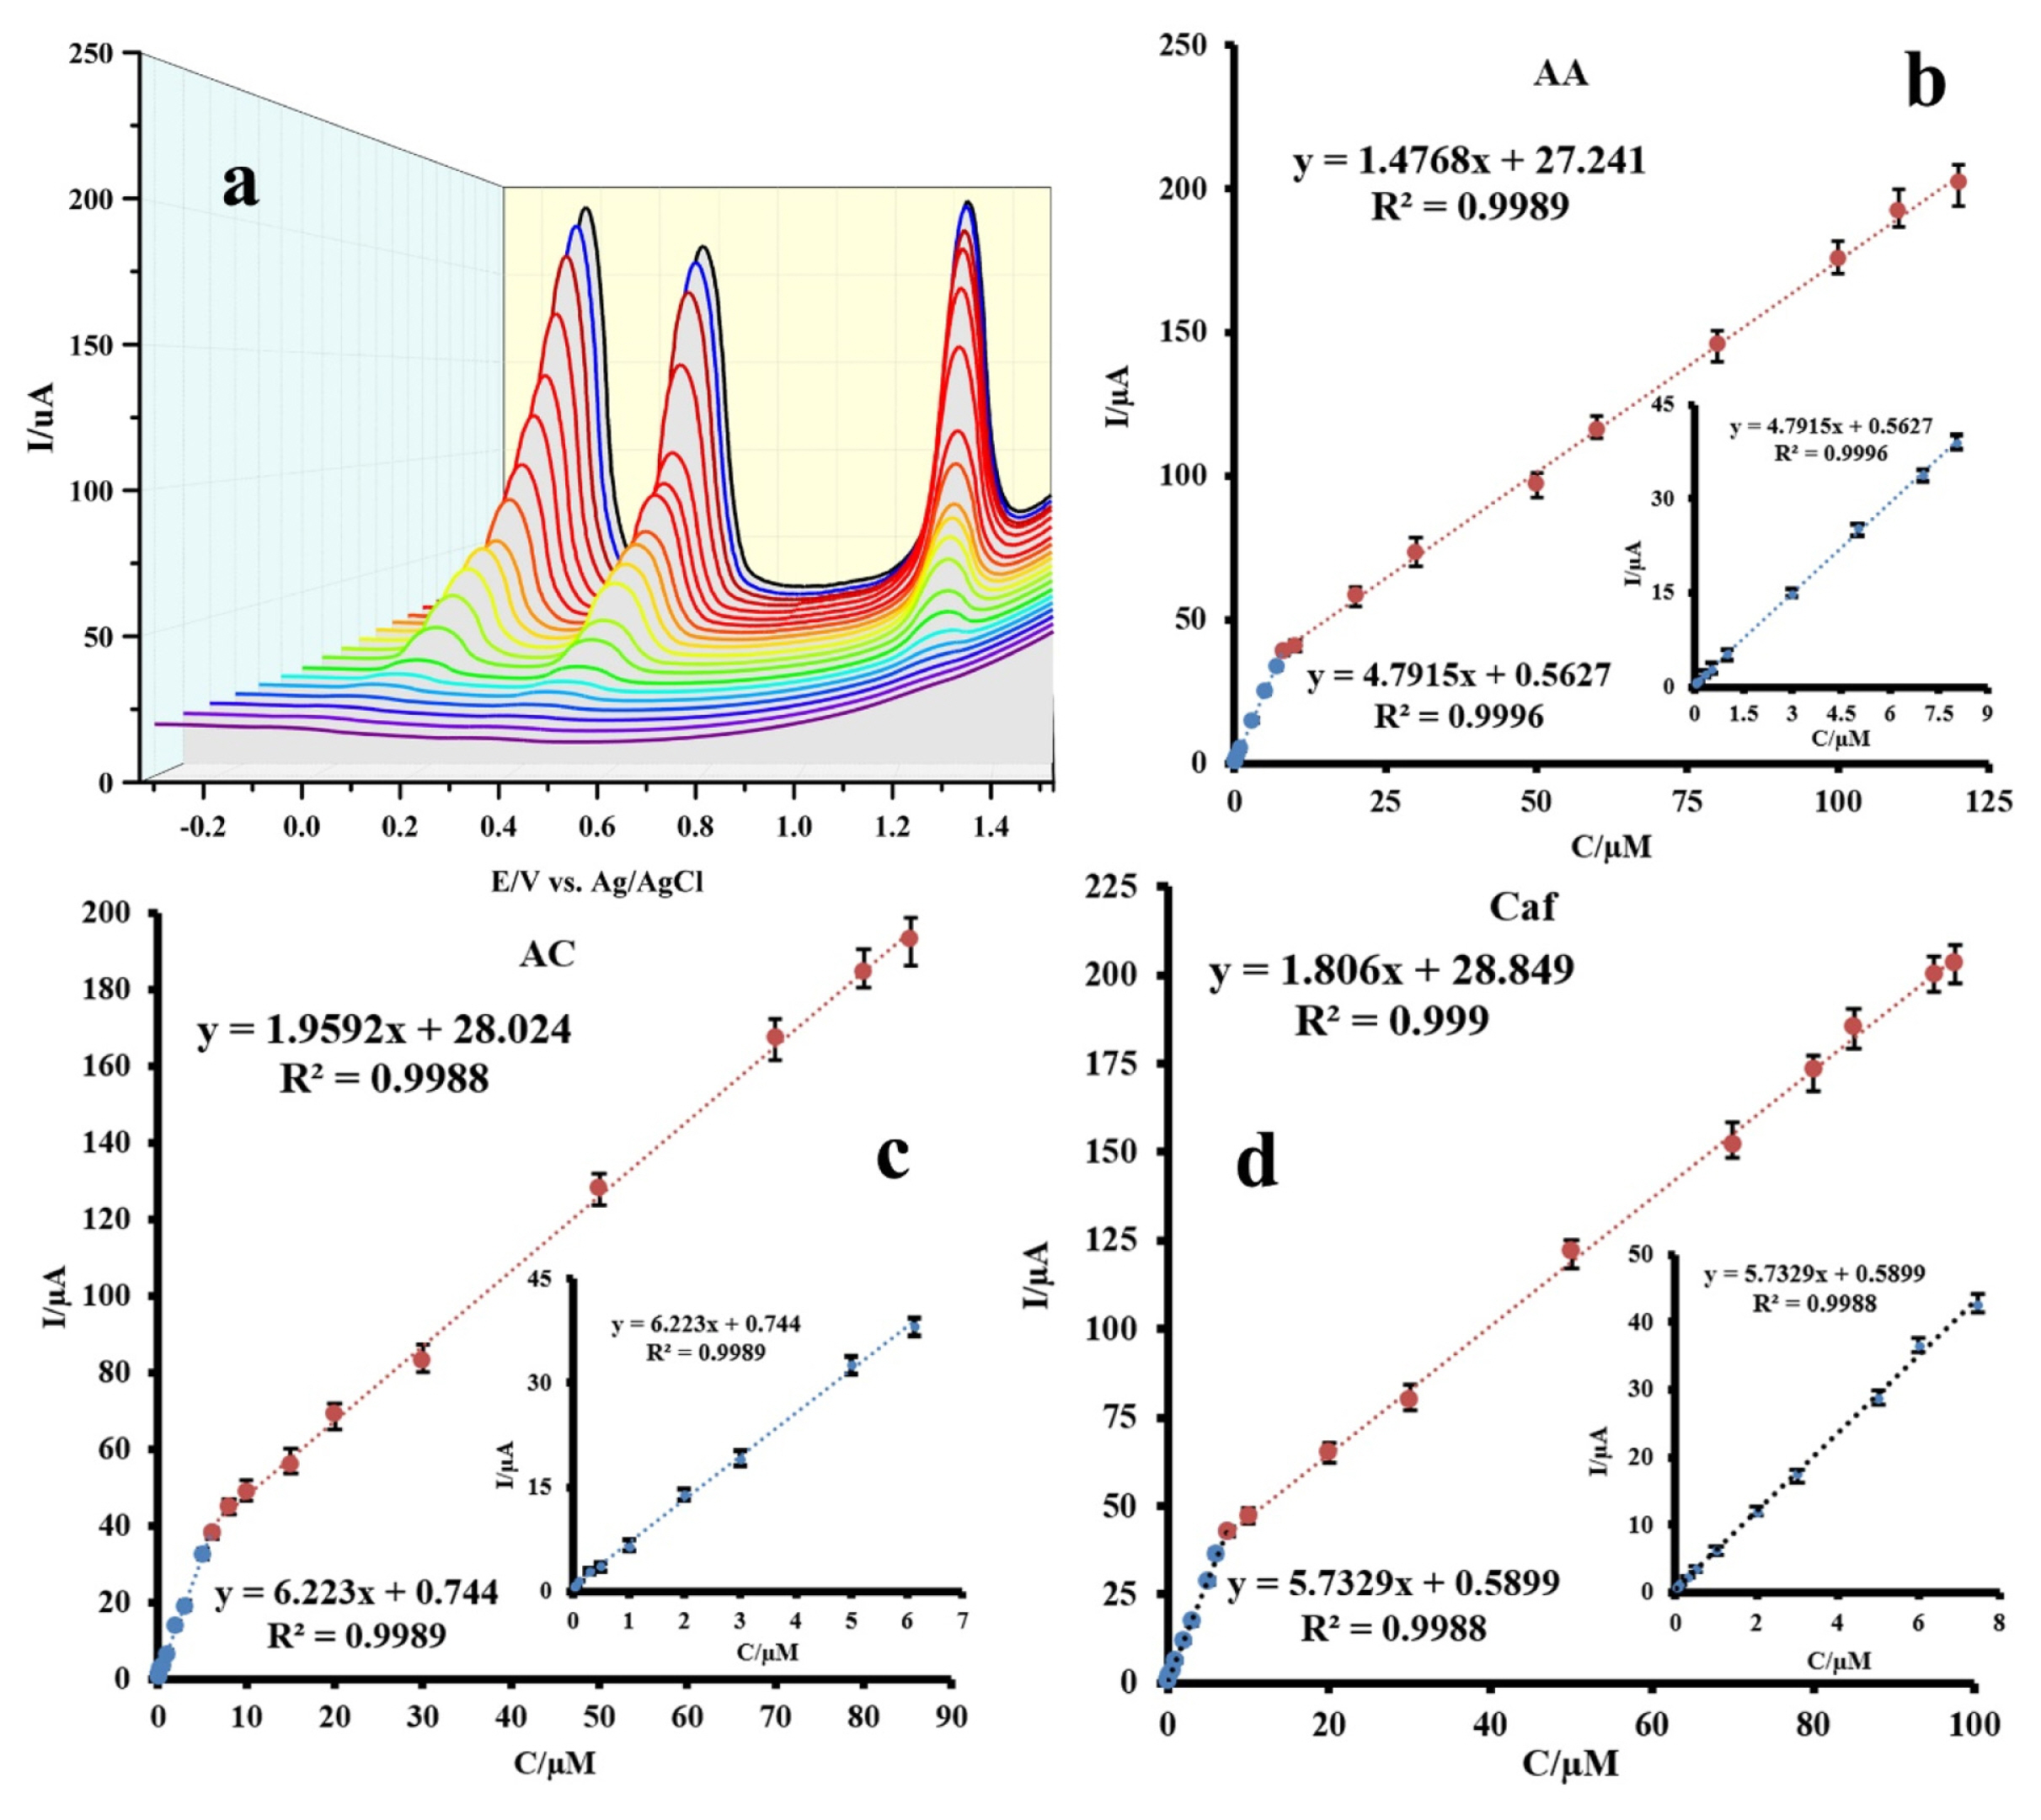
(a) 3D DPVs at ZnO-Zn2SnO4-SnO2/Gr/CPE in B-R buffer solution pH = 7.2 for simultaneous determination of AA, AC and Caf; Calibration plots for (b) AA, (c) AC and (d) Caf, n=5.