1. Introduction
Being highlighted label-free surface plasmon resonance (SPR) optical sensor uses modulation of the light output spectrum caused by locally modulated refractive index (localized surface plasmon resonance (LSPR)) [1ŌĆō3]. For example, there is wavelength, angular distribution, intensity, phase, or polarization of the light output. Using a nanostructured grating coupler instead of using a large and complex prism-based platform (e.g., Kretschmann or Otto configurations) has the advantage of being simple and capable of scaling up. Nanostructured grating coupler is also being able to successively compensate the different wave-number between surface plasmon polaritons (SPPs) and external light. SPP is generated at an interface between metal and dielectric [4,5]. As a result, nanostructure-based grating couplers can successfully expand the practicality of plasmon sensors in a wide range of biosensors, photocatalytic, and heterogeneous catalytic researches [6ŌĆō8].
In recent years, efforts have been made to develop nanostructure-based SPR platforms with high sensitivity (ΔλSPR/Δn, nm/RIU) and figure of merits (FOM, (ΔλSPR/Δn)/Δλ, 1/RIU) in particular, in terms of easy scalability, feasible implementation, and low cost [4]. Due to the narrow bandwidth of the wavelength consumed by the excitation of the surface plasmons, a high FOM with a narrow full width half maximum (FWHM, nm) in the optical spectrum allows the resonance to be observed more clearly through an effective and accurate sensing process. For SPR to expand its application to various environmental conditions, the physical and chemical resistance of each component of the SPR platform as well as the SPR detection parameters with high SPR sensing sensitivity is important. Various bottom-up and top-down approaches have been taken for this strategy, and our research group has previously reported a highly sensitive SPR detection platform based on the track pitch structure of commercial optical discs such as CD, DVD and Blu-ray [6,9]. By applying a commercial optical disc as an SPR platform, it is possible to easily produce a large, scalable area with a simple and economically beneficial preparation method.
The sum of the binding energies of the surface atoms is defined as the surface energy. Therefore, the hexagonal close-packed structure of (111) facet with the highest packing density has the lowest surface energy [10]. There are three major ways to lower the surface energy. The first is the relaxation where the position of the atom changes but the unit cell remains unchanged. The second is reconstruction in which the periodicity of the unit cell and the surface changes, and the third is the formation of a surface oxide layer by ad-atoms or ad-molecules. In particular, surface relaxation or reconstruction is usually observed through thermal heat-treatment (or annealing, firing) or electrochemical treatment [11]. Finally, it causes accumulative energy density at a surface by smoothing effect and redistribution by missing neighbor. Severe heat treatment can lead to structural deformation, so we led Au reconstruction through electrochemical potential cycling, not heat treatment. Anyway, Au reconstruction by potential cycling in sulfuric acid electrolyte solution is a well-known phenomenon through many reports [10,12ŌĆō14]. In short, the sequential and repetitive adsorption and desorption of sulfate anion and oxygen species on the Au electrode surface results in the rearrangement of Au atoms. In this report, we state that how this could affect the properties of surface plasmon as the optical sensors.
2. Experimental
Reconstruction of Au Gratings. A detailed fabrication method of Au-covered epoxy gratings was stated previously. Cyclic voltammetry (CV) was applied to a typical three-electrode cell in an aqueous sulfuric acid electrolyte solution (50 mmol/liter H2SO4). Using a potentiostat/galvanostat instrument (263A, Princeton Applied Research), the electrode of 0.05 V to 1.60 V (vs. normal hydrogen electrode, NHE) was applied at a rate of 100 mV/s. 1.0 M KCl of Ag/AgCl (CH instruments) and Pt mesh (Sigma-Aldrich) were equipped as a reference and counter electrode, respectively.
2.1 Physical Characteriaztions
Scanning electron microscopy (SEM) images were taken on JEOL SEM-6400 (Major Analytical & Particle Analysis Instrumentation Center (MAIC), University of Florida).
2.2 Normal-incidence Specular Optical Reflection Spectra and FDTD Simulation
Incident normal reflection was measured by UV-Vis Spectrometer (HR4000, Ocean Optics) with halogen light source (DH-2000, Mikropack). SPR sensing tests were performed as a reference medium for standard refractive index in a home-made sandwich cell using de-ionized water (R.I., 1.332) and aqueous glycerol (Sigma Aldrich) solution (R.I., 1.343, 1.352, 1.363, 1.372).
3. Results and Discussion
We have also previously observed a feasible manufacturing process for Au-covered epoxy gratings with inverse track-pitch (DVD-R) structure and those high SPR sensing sensitivity (~875 nm/RIU) and FOM (~110) [6,15]. Au-covered epoxy grating was prepared by mixing epoxy resin (5 Minute EpoxyŌäó, Devcon, bisphenol A diglycidyl ether (BADGE or DBEBA)) with a hardener (10ŌĆō30%, 2,4,6-tris[(dimethylamino) methyl]phenol) at room temperature firstly and well-mixed epoxy resin was poured into a Au layer (80 nm of thickness) surface which was sputtered onto the original polycarbonate (PC) substrate of DVD-R disc (MemorexŌäó, 16X4.7GB, 120 min). There is no adhesive thin metal layer (e.g., Cr or Ti) between Au layer and the PC board. Before injecting the mixed epoxy resin, removing a protective PC cover of DVD-R disc, washing organic dye with isopropyl alcohol (Sigma-Aldrich) and dissolving Al recording layer out in nitric acid (98%, Sigma-Aldrich) was done. After pouring the epoxy resin onto the sputtered Au layer of the PC board, it was placed in a dry oven at 100┬░C for 30 minutes. Next, it was peeled off the cured epoxy PC board. Cured epoxy was then peeled off from PC substrate. Through this simple cloning process of curing the epoxy resin, the sputtered Au layer of the PC board was continuously transferred to the epoxy board. Fig. 1, a scanning electron microscopy (SEM) image shows a very smooth Au surface on an epoxy substrate. In these easily prepared gratings, the inverse track-pitch structure of the DVD-R is successively formed with periodic narrow gorge geometry. Feasible delaminating cured epoxy from a PC substrate is enabled by strong adhesion between epoxy resin (surface tension, 43ŌĆō47 dynes/cm) and the Au layer while here is a relatively weaker adhesion between Au layer and original PC substrate. During a tape test, no significant drop-out of Au layer was observed in the prepared Au-covered epoxy gratings and the Au layer of the PC substrate which is before Au layer transfer onto epoxy resin is easily delaminated. Compared to the Au layer of the original PC board, stronger physical properties can be obtained with a solid Au layer that is firmly attached and fixed to the epoxy substrate. Additionally, the FOM of SPR detection is dramatically improved from 52 to 110 by transferring the Au layer from PC to the epoxy substrate.
In addition, we try to induce electrochemically potential-induced Au reconstruction by applying potential cycling to an Au-covered epoxy gratings [16,17]. The applied electrochemical potential (V) can act as a driving force for metal nucleation as well as further possible decomposition mechanisms. The so-called ŌĆ£potential-induced reconstructionŌĆØ for single crystal Au electrodes with low Miller index (e.g., (100), (110) and (111)) is well known for the increase and stabilization of the electron density among surface Au atoms. In this process, the (100) and (110) facets as well as the already dense (111) facets can be reconstructed by sequential adsorption of SO3ŌłÆ and hydroxyl radical, OHŌłÆ like other oxygen species in an aqueous sulfuric acid solution [10,11]. It is already well known that continuous Au reconstruction is owned by thermal or flame annealing process. These annealing processes for Au reconstruction are typically operated at 450 to 550┬░C and Unfortunately, these temperature ranges can cause severe structural modifications to widely be used substrates for nanostructured lattice couplers, such as glass, silica, polystyrene (PS), and polymers. It has also been reported that metal layers annealed with a high temperature (~300┬░C) thermal annealing process showed dramatically grown Au islands and collapsed SPR signals (e.g., low intensity and wide SPR dips) [18ŌĆō20]. In the case of electrochemical Au reconstruction, a reconstructed structure of the Au surface could be obtained without a dramatic change in the Au crystal structure even without introducing a thermal annealing process at high temperature.
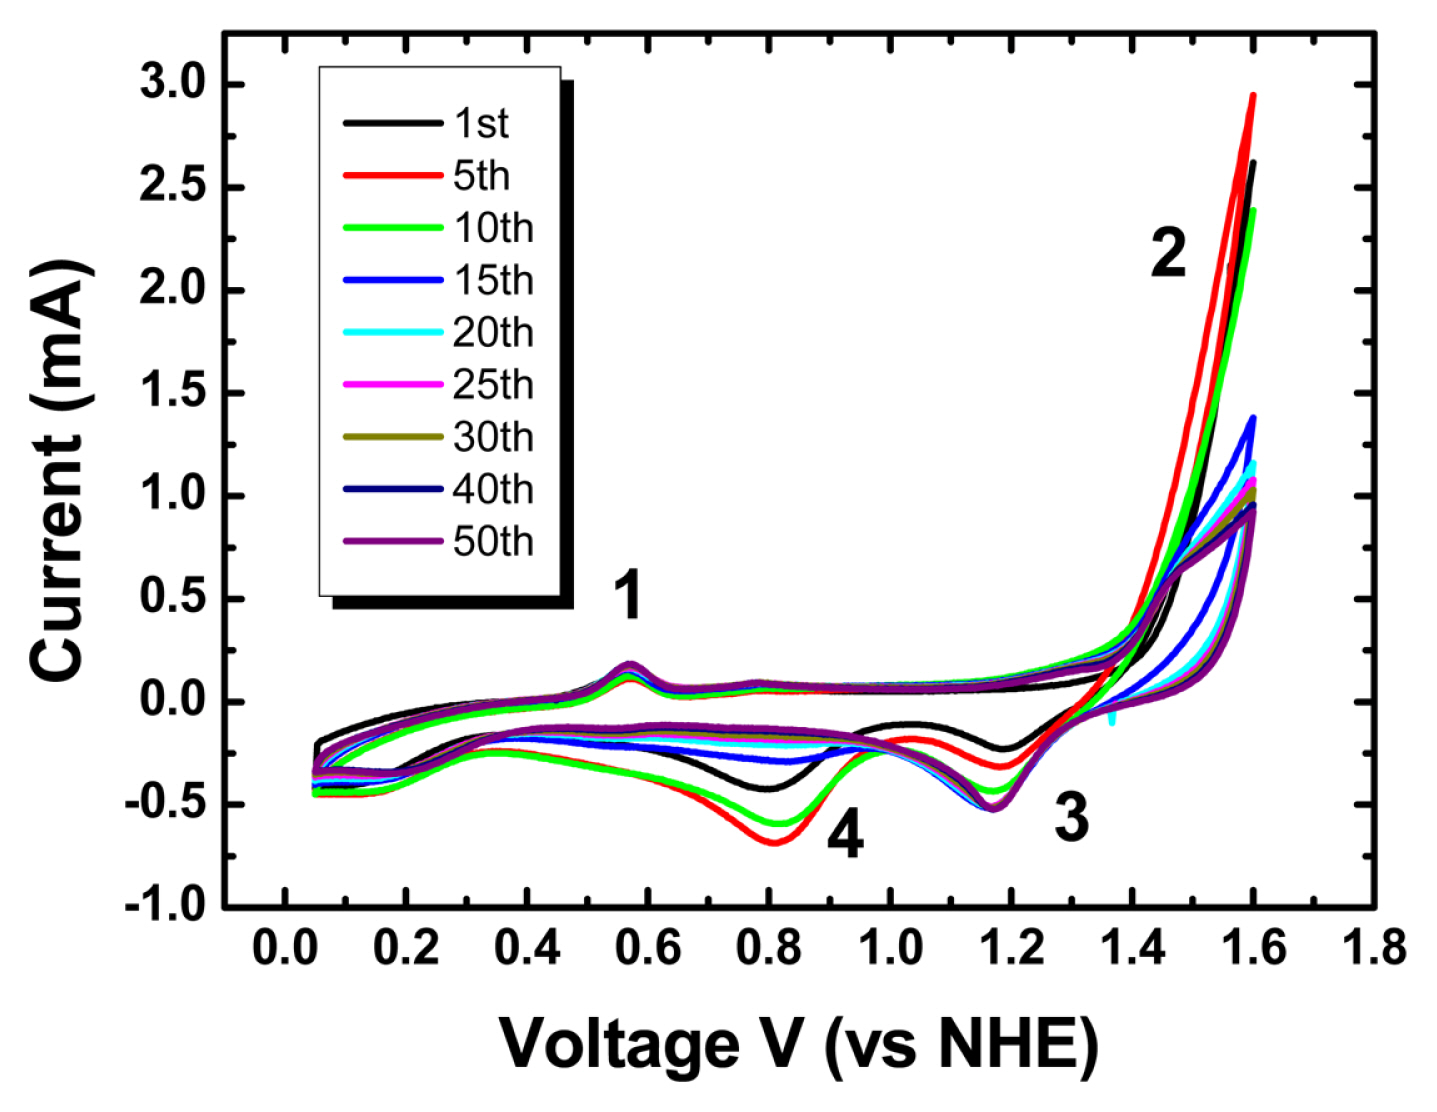
CV was applied in an aqueous sulfuric acid electrolyte solution (50 mmol/liter). Prior to using a Aucovered epoxy gratings as a working electrode directly, plastic-coated Cu wire was connected to the Au surface and additional insulation was done with epoxy resin to avoid possible contaminations. Before applying the potential cycling, inert nitrogen gas (UHP300, Airgas) was purged for more than 30 minutes to remove residual oxygen species in a liquid electrolyte solution. In Fig. 2, a distinct oxidation peak was observed during potential cycling at about 0.55 V. This oxidation peak is well known for the adsorption of sulfuric acid groups (SO3ŌłÆ) on the Au electrode surface. Additional potential sweeps in the positive direction led to Au oxidation upon adsorption of oxygen species (OHŌłÆ, OŌłÆ, O2ŌłÆ). In the negative direction, the reduction of the adsorbed oxygen species to water molecules (H2O) was observed at two distinct peak positions. The SO3ŌłÆ and OHŌłÆ functional groups sequentially adsorbed on the Au surface restore and lift the Au monolayer from the electrode surface. Interestingly, as the number of applied potential cycles increases, the intensity of the oxygen reduction peak located at about 0.8 V gradually decreases and for 1.18 V it gradually increases. Similar results appear in the oxygen reduction reaction according to the physical properties of Pt nanoparticle electro-catalysts for the application of polymer electrolyte membrane fuel cells [21ŌĆō23]. In particular, in the results of Brian E. Hayden et al, as the thickness of the Pt electrode prepared by physical vapor deposition increases, the peak potential of oxygen reduction in the cyclic voltammogram shifts to a high potential [23]. Also, in the carbon monoxide, CO stripping voltammogram, the thinner the Pt electrode, the higher the peak potential of CO stripping is. These results show that there is an early dramatic change in Au reconstruction by CV in sulfuric acid. These changes in the adsorption properties of nanoparticles are according to physical characteristics such as particle size. Instantly, the excess pressure acting on the internal bulk atoms of a particle from surface atoms present in a single particle is inversely proportional to the particleŌĆÖs radius.
Fig. 3 shows the changes in lattice spacing and crystal size according to XRD measurement of Aucovered epoxy gratings after potential cycling. It is clearly shown that the peak of Au (111) in XRD shifted to the higher high 2╬Ė position, and the particle size calculated by the Debye-Scherrer equation also increased significantly from about 62.4 to 69.2 nm at the beginning of CV. The clear changes in lattice spacing and crystal size in XRD measurements predicted changes in coherent delocalized electron oscillations between Au and dielectric interface due to an increase in packing density of gold atoms present in the grain boundary by electrochemical Au reconstruction by potential cycling.
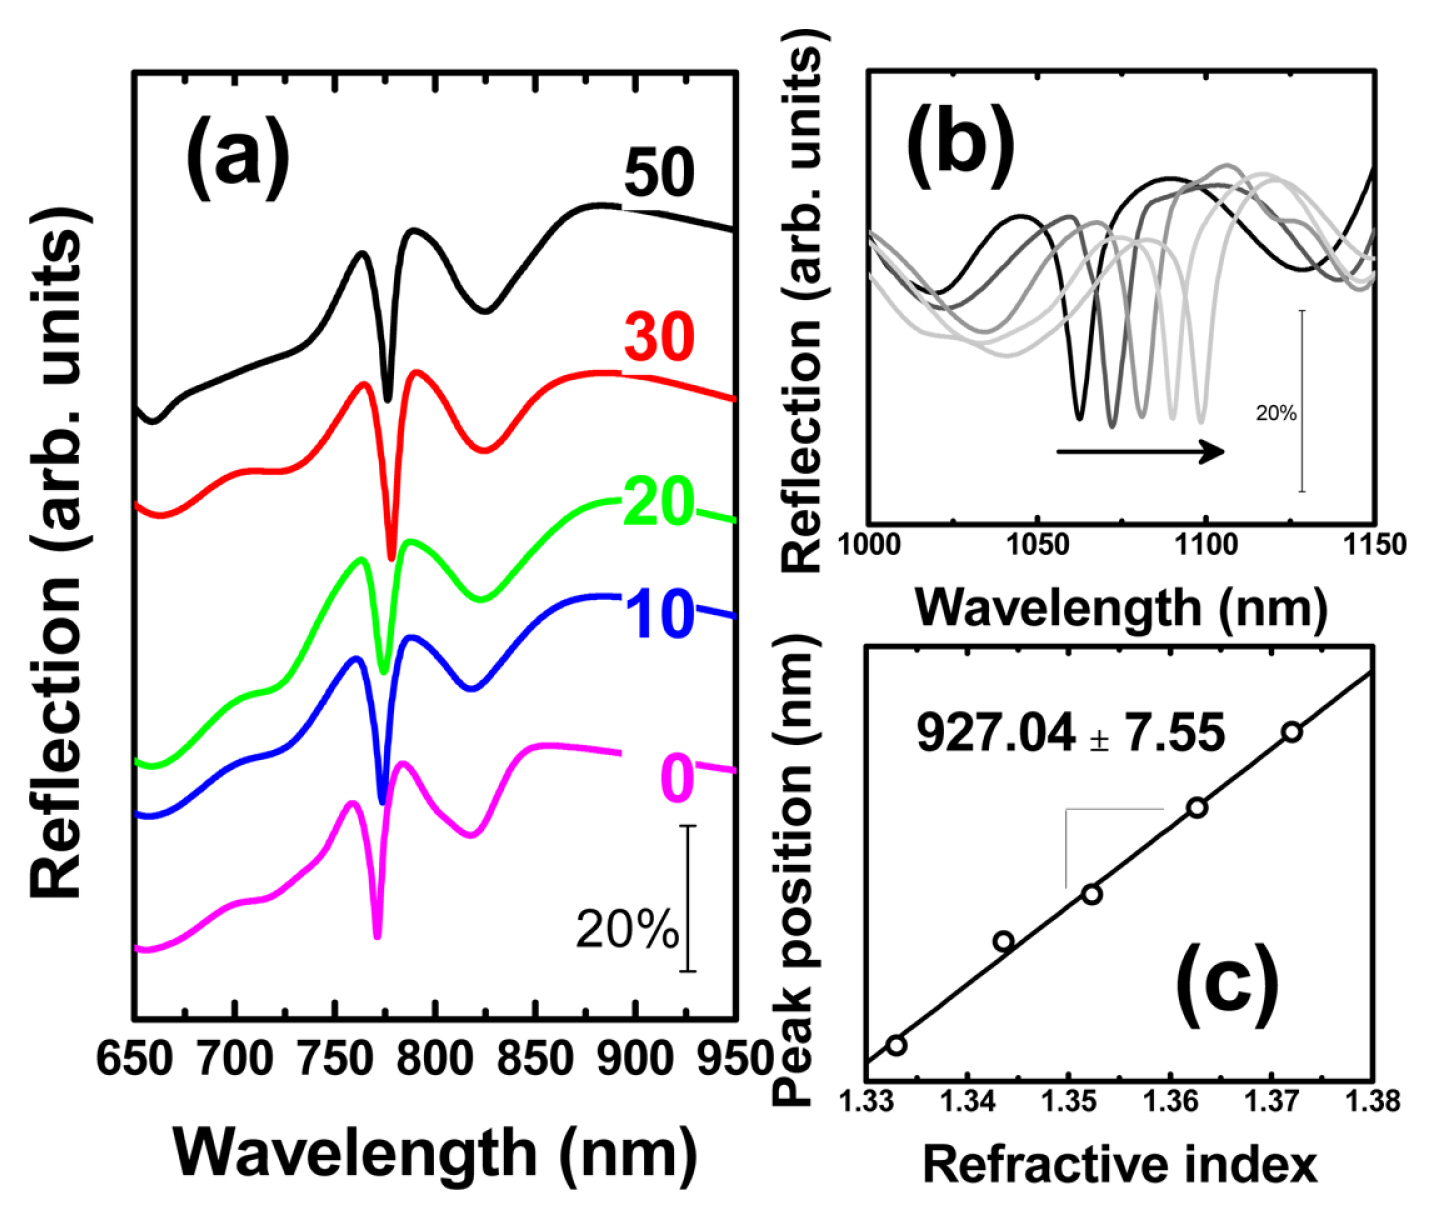
The SPR detection sensitivity was monitored by measuring the normal incident specula optical reflection spectrum with a UV-Vis spectrometer (HR4000, Ocean Optics) and a halogen light source (DH-2000, Mikropack). During the detection test, the assembled home-made sandwich cell was equipped with optical fibers (Ocean Optics) and aqueous glycerol solutions (0, 9, 16, 24 and 31% by weight) to reference the refractive index. As we have already reported, a narrow SPR dip was observed in the air and aqueous glycerol solution medium of an epoxy gratings covered with Au in Fig. 4(a, b). The SPR sensitivity obtained from the slope of the trend line between the refractive index in Fig. 4(c) and the SPR dip location (nm) was summarized in Fig. 5 as the number of sequentially increased potential cycles. At least 3 samples were prepared for each potential cycle. Conditions and normal incidence specula optical spectra were measured at several locations on the surface of an epoxy grating covered with Au to obtain average SPR sensitivity and standard deviation. Prior to applying potential cycling to the Au-covered epoxy gratings, it exhibited an SPR detection sensitivity of 876.15 ┬▒ 11.07 nm/RIU. After applying potential cycling, the SPR sensitivity gradually increases to 901.48 ┬▒ 3.25 (after 10 potential cycles), 914.56 ┬▒ 6.96 (20 cycles), 921.99 ┬▒ 2.95 (30 cycles), and finally 927.04 ┬▒ 7.55 (50 cycles) in Fig. 5.
The representative sensing performance indicators of the surface plasmon sensor are sensitivity and figure of merit (FOM). The sensitivity, which is the sensitivity to the refractive index unit (RIU), represents the change in the position of the SPR dip per refractive index change [24ŌĆō27]. FOM is a value obtained by dividing the sensitivity value by the FWHM of SPR dip, which is an index to evaluate the effectiveness and accuracy of the surface plasmon sensor [26,28ŌĆō30]. The sensitivity of the plasmon sensor increases when the particle size constituting the metal or dielectric component of the plasmon sensor is large [9]. If the periodic pattern of the platform of surface plasmon decreases the aspect ratio through structural deformation, the sensitivity of the plasmon sensor does not decrease. Instead, the intensity of SPR dip decreases and FWHM increases, resulting in a decrease in FOM. This means that the accuracy of the plasmon sensor may be poor. However, in this result, it is not possible to see the change in SPR dip intensity or FWHM before and after potential cycling. If any impurities are present on the metal surface because of the cleanness issues, it is expected that the intensity or FWHM of the SPR dip will change because it affects the scattering or reflection of light on the surface of the plasmon substrate. However, this was also not confirmed in this result, and when the above results were combined, it can be concluded that the sensitivity of the plasmon sensor was improved without structural deformation when electrochemical Au reconstruction was selected instead of high temperature heat treatment.
4. Conclusions
The increased SPR sensing sensitivity in the Au-covered epoxy grating with reverse track-pitch structure is observed when applying potential cycling in aqueous sulfuric acid solution. The as-prepared grating shows 876.15 ┬▒ 11.07 nm/RIU of sensing sensitivity, and finally increased to 927.04 ┬▒ 7.55 after 50 potential cycling. Observation of the XRD lattice spacing parameters reveal crystallographic modifications by electrochemically potential-induced Au reconstruction process. This is a way to improve sensitivity without affecting the accuracy of the plasmon sensor because structural deformation, which is a side effect of heat treatment at high temperatures, can be avoided.