1. Introduction
The world is witnessing a concentrated interest and focus in the development of electric vehicles (EVs) and energy-storage systems (ESSs) in the context of addressing global environmental issues. Accordingly, research interest is shifting from small batteries used in laptops and cell phones to medium and large batteries for use in EVs and ESSs [1ŌĆō4]. In this regard, lithium-ion batteries (LIBs) afford clear advantages in terms of high energy and power densities and long lifespans when compared with other existing batteries such as Ni/MH batteries. Despite these advantages, accidents related to battery safety continue to occur in EVs as well as in small devices such as cell phones and laptops. The cause of such accidents has been attributed to the ignition of the organic solvent used as the electrolyte in lithium-ion secondary batteries [5,6]. Ignition can be caused by external shock, short circuit, pressure, and unexpectedly high temperatures. Among these factors, short circuits are caused by the metal present in the battery, and this metal plays a significant part in safety-related issues.
We note here that LIBs contain several metals [7,8]. Among the cell components, aluminum and copper are used as current collectors, and various other metals are also used as exterior materials. In addition to the metal components of the battery, metals are also included in the form of impurities in the manufacturing process. These metals participate in electrochemical reactions during the charging and discharging of the battery. Accordingly, the corrosion, elution, and precipitation reactions of the metal can be induced, thereby resulting in the loss of its original function or the short circuit of the battery [9,10]. As this situation can affect the battery safety, it becomes necessary to understand the electrochemical mechanism of the metals in the battery.
The corrosion potential of a metal in a secondary battery must be investigated both thermodynamically and kinetically. All metals have a defined thermodynamic oxidation and reduction voltage [11]. However, in the case of the metals in a secondary battery, the tendency of the formation of a surface solid electrolyte interphase (SEI) changes because of the catalytic effect of the lithium salt, organic solvent, and metal itself, and the electrochemical reaction occurs at a voltage different from the thermodynamic voltage of the metal [12]. In general, there have been few experimental studies on the electrochemical reactions of metals in secondary batteries in the context of realizing the additional electrochemical stability of Al and Cu metals used as current collectors [2,3]. Similarly, the electrochemical behavior of Fe also requires to be more deeply researched. Fe offers the advantages of relative environmental friendliness, abundant availability, and low cost, and thus, there have been continued efforts to use Fe in batteries, for e.g., in Ni/Fe batteries, Fe redox flow batteries, and LiFePO4 cathode materials [4,5].
Meanwhile, as regards LIBs, coin and cylindrical cells in particular are coated by an outer layer of stainless steel for safety reasons. The peeling off of this outer film causes the additional corrosion of Fe. In addition, Fe is included as an impurity in the manufacturing process of active battery materials and participates in electrochemical reactions, and thus, it becomes necessary to study the electrochemical behavior of Fe in secondary batteries.
However, the electrochemical behavior of Fe with LIB electrolytes has not been investigated despite its practical necessity. Therefore, in this study, we examine the corrosion behavior of Fe foil induced by a voltage applied to the commonly used 1 M LiPF6 lithium salt and ethylene carbonate/diethyl carbonate (EC/DEC) organic solvent. We analyze the SEI composition according to the voltage range, and we discuss the corrosion behavior of Fe.
2 Experimental
2.1 Electrode and cell fabrication
In this study, Fe foil was used as an electrode to investigate its electrochemical behavior in a battery. We used a Fe foil with a thickness of 50 ╬╝m and purity of 99.9% (R&D Korea). First, to control the area of the Fe foil, a hole with a diameter of 14 mm was punched in the foil, and subsequently, the size of the exposed Fe foil was controlled to a diameter of 12 mm by affixing an imide tape with a 12 mm-diameter hole. The prepared Fe foil assembly was dried for 10 h under vacuum at 120┬░C to remove moisture.
Experimental cells were manufactured in a glove box under an argon atmosphere, wherein oxygen and moisture were controlled [12]. Fe foil was used as the working electrode, and a Li metal disc with a diameter of 14 mm was used as the reference and counter electrodes. Polypropylene (PP) was used as the separator. The electrolyte was prepared with a solution in which 1 M lithium hexafluorophosphate (LiPF6) salt was mixed in a 1:1 volume ratio of ethylene carbonate (EC) and ethyl methyl carbonate (EMC), after which the cell was finally constructed. Subsequently, 2032-type half cells were prepared.
2.2 Electrochemical evaluation
The electrochemical performance of the coin cell was evaluated using a WBCS3000 system (WonAtech, Korea). Charging and discharging were performed in a chamber at 25┬░C. For each coin cell, the electrode was subjected to a 10 min rest. In the case of cyclic voltammetry (CV) experiments, the starting voltage was set to 3.0 V, and the upper-limit voltage was varied as 3.5, 3.7, 4.0, and 4.2 V (vs. Li/Li+) in that order. The cell was charged and discharged at a constant rate of 10 mV/s to reach each voltage. Moreover, in the constant-voltage experiments, the starting voltage was set to 3.0 V, and the upper-limit voltage was varied as 3.3, 3.5, 3,7, 3.8, 4.0, and 4.2 V (vs. Li/ Li+) in that order. Charging was carried out at a rate of 10 mV/s, similar to the CV experiments, and the constant-voltage retention time was set as 24 h after reaching each voltage.
The electrodes used for scanning electron microscopy (SEM), optical microscopy, and X-ray photoelectron spectroscopy (XPS) measurements were obtained by disassembling the battery after the constant-voltage tests. After these tests, the Fe-foil surface was observed using the JSM-7001F field-emission SEM. The DSX1000 (Olympus) optical microscope was used to acquire 3D views of the corroded region. After the constant-voltage test, SEI analysis of the electrode surface was performed using a scanning photoelectron spectroscopic analyzer (XPS, PHI 5000 Versa Probe II).
Linear-sweep thermammetry (LSTA) evaluations were performed using the WonATech WBCS3000 charger and discharger. The upper-limit voltage was set to 3.3 and 3.5 V, and each cell was examined after raising the voltage from the starting voltage of 3.0 V to each upper-limit voltage at a rate of 10 mV/s, as in the constant-voltage experiment. The temperature was set to vary from 25┬░C at room temperature to 120┬░C at the upper limit and raised at a rate of 0.1┬░C/ min.
3. Results and Discussion
First, to understand the corrosion behavior, we examine the CV results of the lithium/iron foil half-cell shown in Fig. 1. For the evaluation of the influence of iron under various voltage conditions for the positive electrode of the rechargeable batteries, the upper-limit voltage was varied as 3.5, 3.7, 4.0, and 4.2 V vs. Li/Li+ in that order. As shown in Fig. 1a, the current slightly increases as the voltage increases from the initial open-circuit voltage at 3.5 V. However, the low current reflecting the corrosion of Fe is not significant, that is, there is no corrosion. In particular, the peak current for the 1st and 10th cycles is <4 ╬╝A. The nearly constant peak current indicates that the electrochemical corrosion current is negligible. At 3.7 V, the observed peak current values of 5.47 and 5.97 ╬╝A for the 1st and 10th cycles, respectively, can similarly be considered to be stabilized currents without the occurrence of corrosion. At 4.0 V (Fig. 1c), the current behavior is significantly different from those shown in Figs. 1a and b. During the 1st cycle, the current rapidly increases after 4.0 V, and the subsequent current during the reverse (negative) scan is higher than that for the initial positive scan. This current further increases instead of decreasing as the number of cycles increases, the observed peak current values of 89.7 and 350 ╬╝A for the 1st and 10th cycle respectively. This increasing current behavior can also observed in Fig. 1d for the cut-off potential of 4.2 V. Again, the current during the initial scan exhibits a higher value than during the reverse negative scan. The peak current also increases as cycling proceeds, exhibiting values of 96.0 and 349.4 ╬╝A for the 1st and 10th cycle, respectively. Here, we note that surface passivation by the SEI from the electrolyte leads to a decrease in current as cycling proceeds. Thus, this abnormal current behavior, that is, the high current during the reverse scan and the subsequent cycles, represents the corrosion behavior of the Fe foil. The initial native surface layers, which are oxides or possibly passivation layers, are initially highly resistive to iron corrosion, even at potentials higher than the equilibrium potential of Fe/Fe2+. At potentials higher than 4.0 V, the passivation layer is no longer effective in hindering the corrosion, and iron dissolution is thought to have begun. This corrosive layer accumulates on the fresh surface of the metal, which does not have native surface passivation. This fresh metal further accelerates the generation of additional corrosion current, as shown in Figs. 1c and d [4]. We note that the corrosion of Fe foil begins at 4.0 V or higher in 1 M LiPF6.
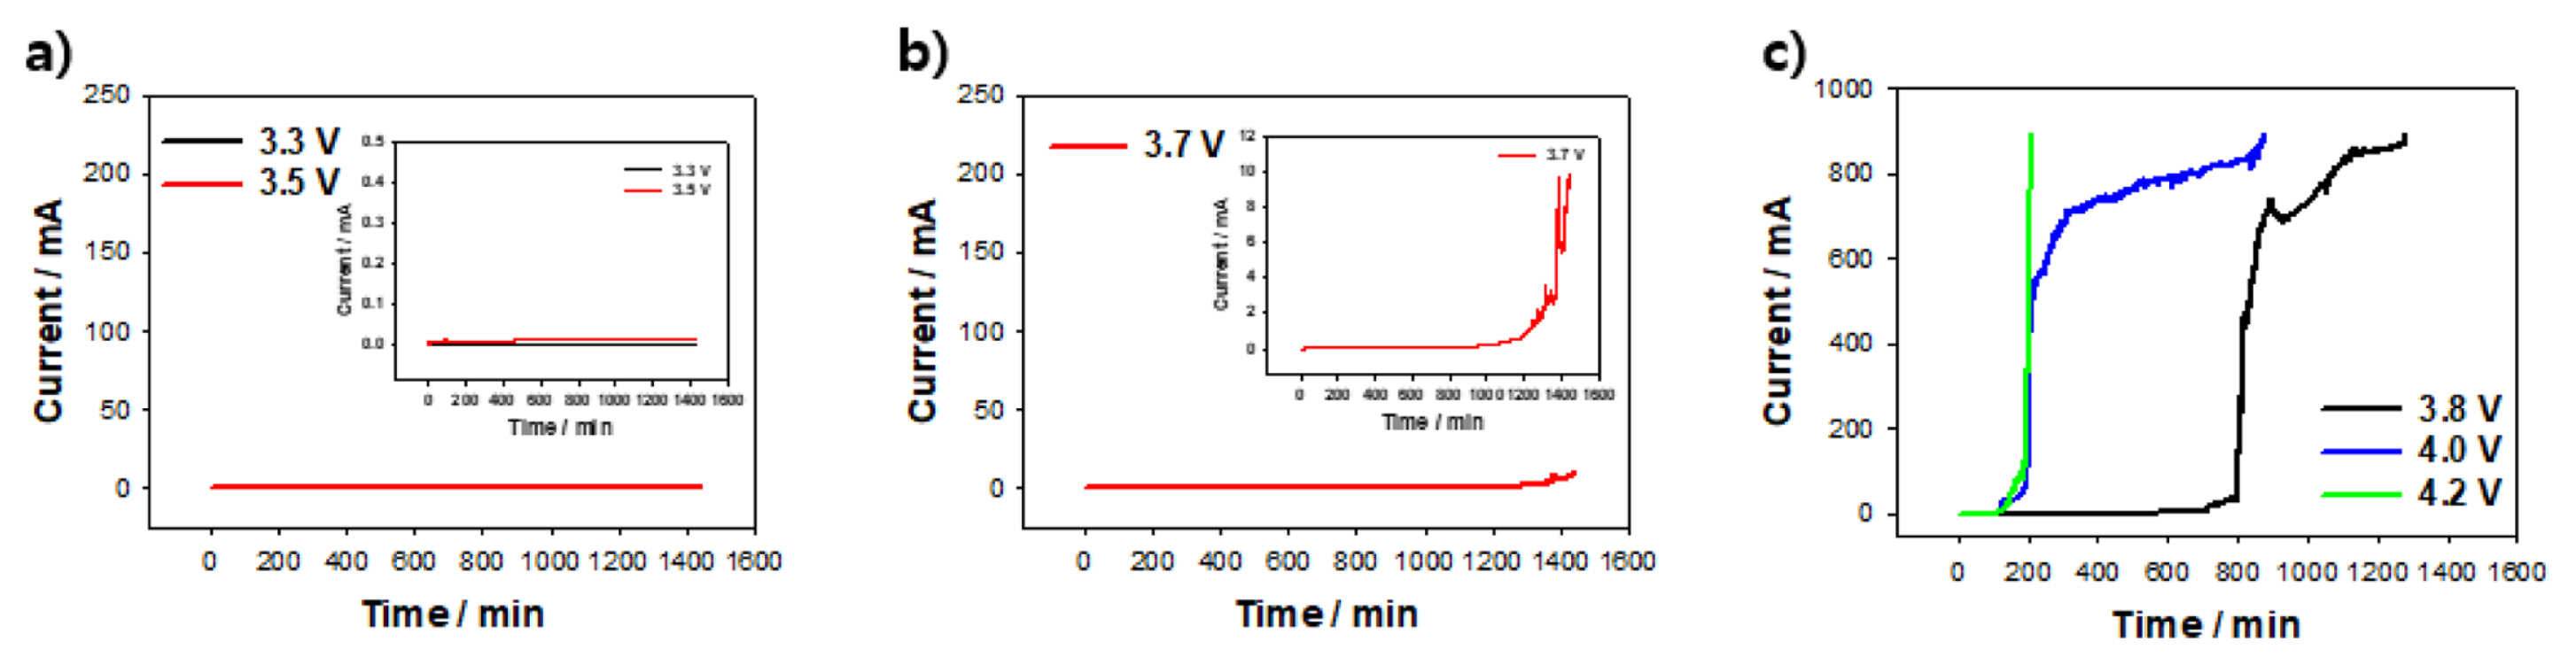
To understand the electrochemical behavior under practical LIB-operation conditions, we performed galvanostatic potentiometry for 24 h keeping mind that the CV conditions slightly differ from the actual LIB conditions (wherein there is no sweep-potential application). From Fig. 2a, we note that the current is highly stabilized under at 0.055 and 14.4 ╬╝A under the application of 3.3 and 3.5 V, respectively. However, the current under the application of 3.7 V (Fig. 2b) exhibits an increasing trend after 1000 min. This result indicates that the Fe corrosion is initially blocked, and corrosion begins after 1000 min. This electrochemical behavior is different from that corresponding to the CV curves shown in Fig. 1b. This difference indicates that the constant-potential method is more appropriate for determining the corrosion behavior and estimating the electrochemical corrosion current after long storage times, similar to actual LIB conditions. In the galvanostatic amperometry measurements under potentials of 3.8, 4.0, and 4.2 V (Fig. 2c), the corrosion current significantly increases. The time at which Fe corrosion occurs also decreases as the potential increases. At the current of 200 mA, the half-cells exhibit operation times of 807 and 200 min for 3.8 and 4.2 V, respectively. This result means that a certain amount of Fe will corrode faster at 4.0 and 4.2 V than at 3.8 V. In this manner, we confirmed that the corrosion of the Fe foil is smooth at >3.8 V, and that the elution accelerates as the voltage increases.
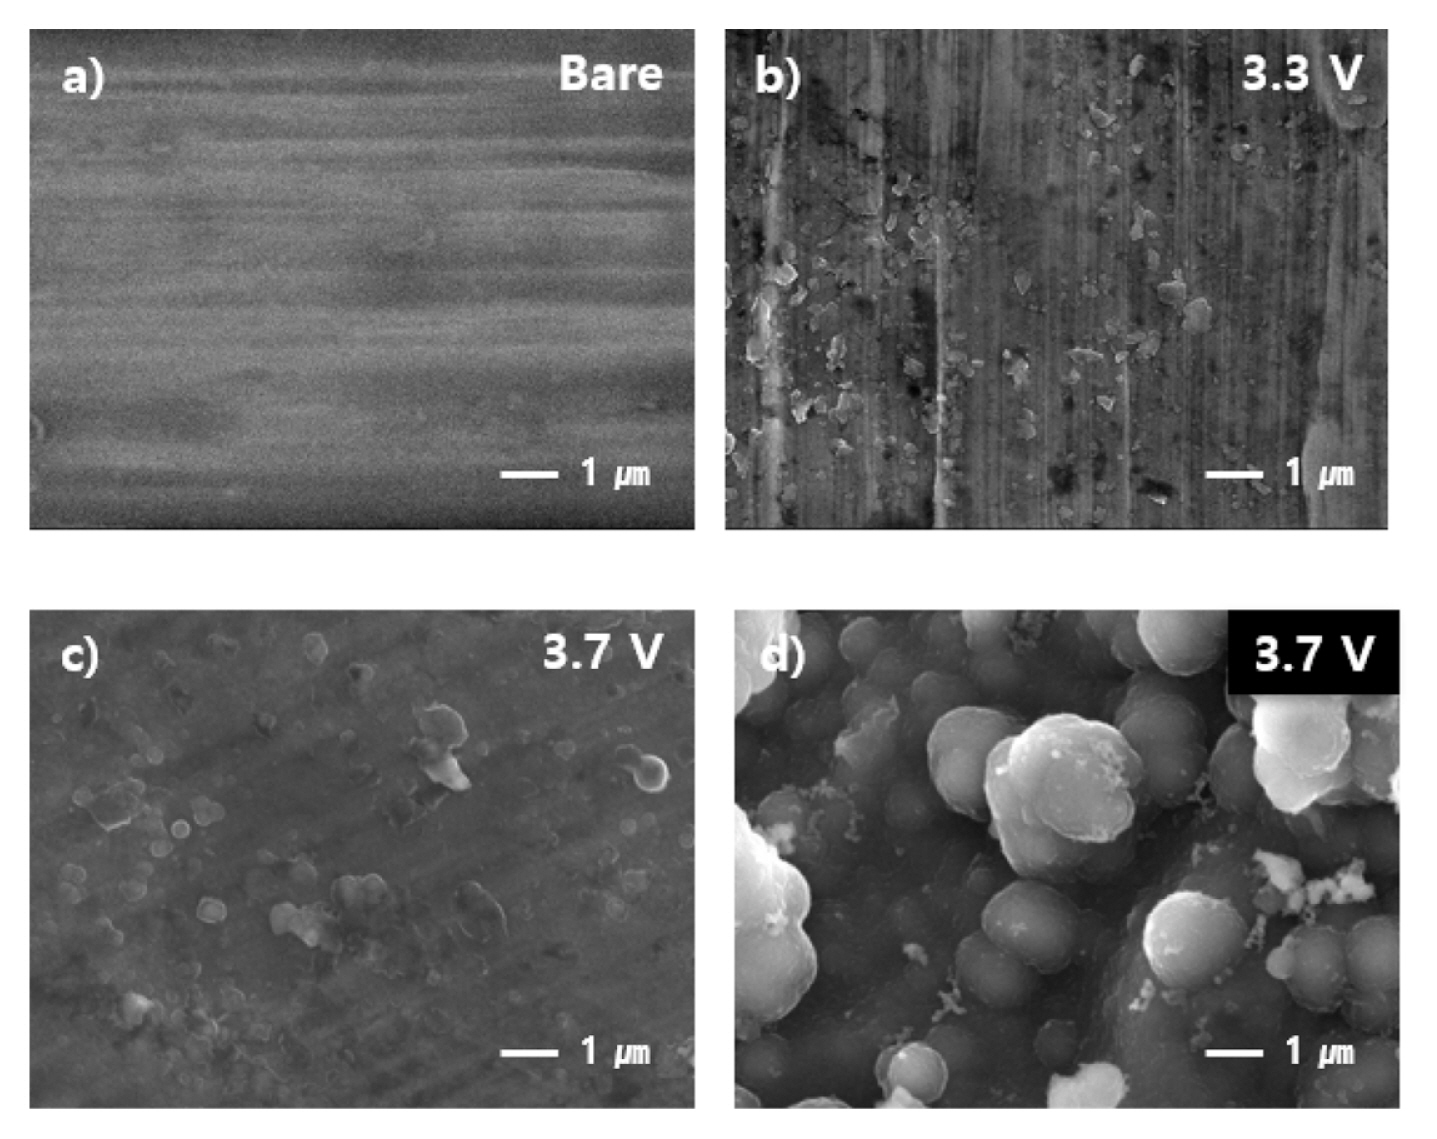
To visually examine the correlation between the current and corrosion for each voltage, we examined the surface of the Fe foil electrode using SEM (Fig. 3). For the SEM analyses, we used an Fe foil obtained by disassembling a cell subjected to constant-voltage testing for 24 h. In the case of the bare Fe foil (Fig. 3a), we find that the foil surface is smooth without any signs of corrosion. At 3.5 V (Fig. 3b), when compared with bare Fe foil, weak but insignificant scratches can be observed. At 3.7 V (Fig. 3c), we find that the Fe foil is subjected to pitting corrosion. However, we also note that corrosion does not occur across the entire surface. This behavior is consistent with the increasing current trend in the constant-voltage experiments. In the range of 3.8 to 4.2 V (Figs. 3dŌĆōf), we observe that corrosion occurs across almost the entire surface, which is also consistent with the flow of a large corrosion current, unlike at Ōēż3.7 V in the constant-voltage tests. Corrosion can be observed to occur from 3.7 V onward and accelerate with further potential increase.
Fig. 4 shows the high-magnification SEM images acquired to determine the tendency of surface SEI formation at each voltage. First, we note that the cycled Fe exhibits an irregular structure across the entire surface region when compared with the bare Fe foil (Fig. 4a) because of the formation of a low-conductivity SEI surface composed of organic and inorganic materials. Additionally, at 3.3 V (Fig. 4b), we note that an uneven film is formed on the surface when compared with the bare Fe foil. This result indicates the possibility that the SEI film deposited from the electrolyte hinders the electrochemical corrosion of iron even at potentials higher than the equilibrium potential. Consequently, we note that in the case of Fe, the SEI is formed at values below 3.3 V in the general electrolyte. In addition, from Fig. 4c, we note that the SEI is formed on the surface of the electrode at the point where corrosion started to occur, although no corrosion is observed at 3.3 V in this portion of the foil. From Fig. 4d, we observe that the SEI is still present in the part where the corrosion occurred at 3.7 V. These results indicate that despite SEI presence, Fe corrosion is initiated in a specific voltage range greater than that corresponding to the SEI resistance, that is, 3.7 V.
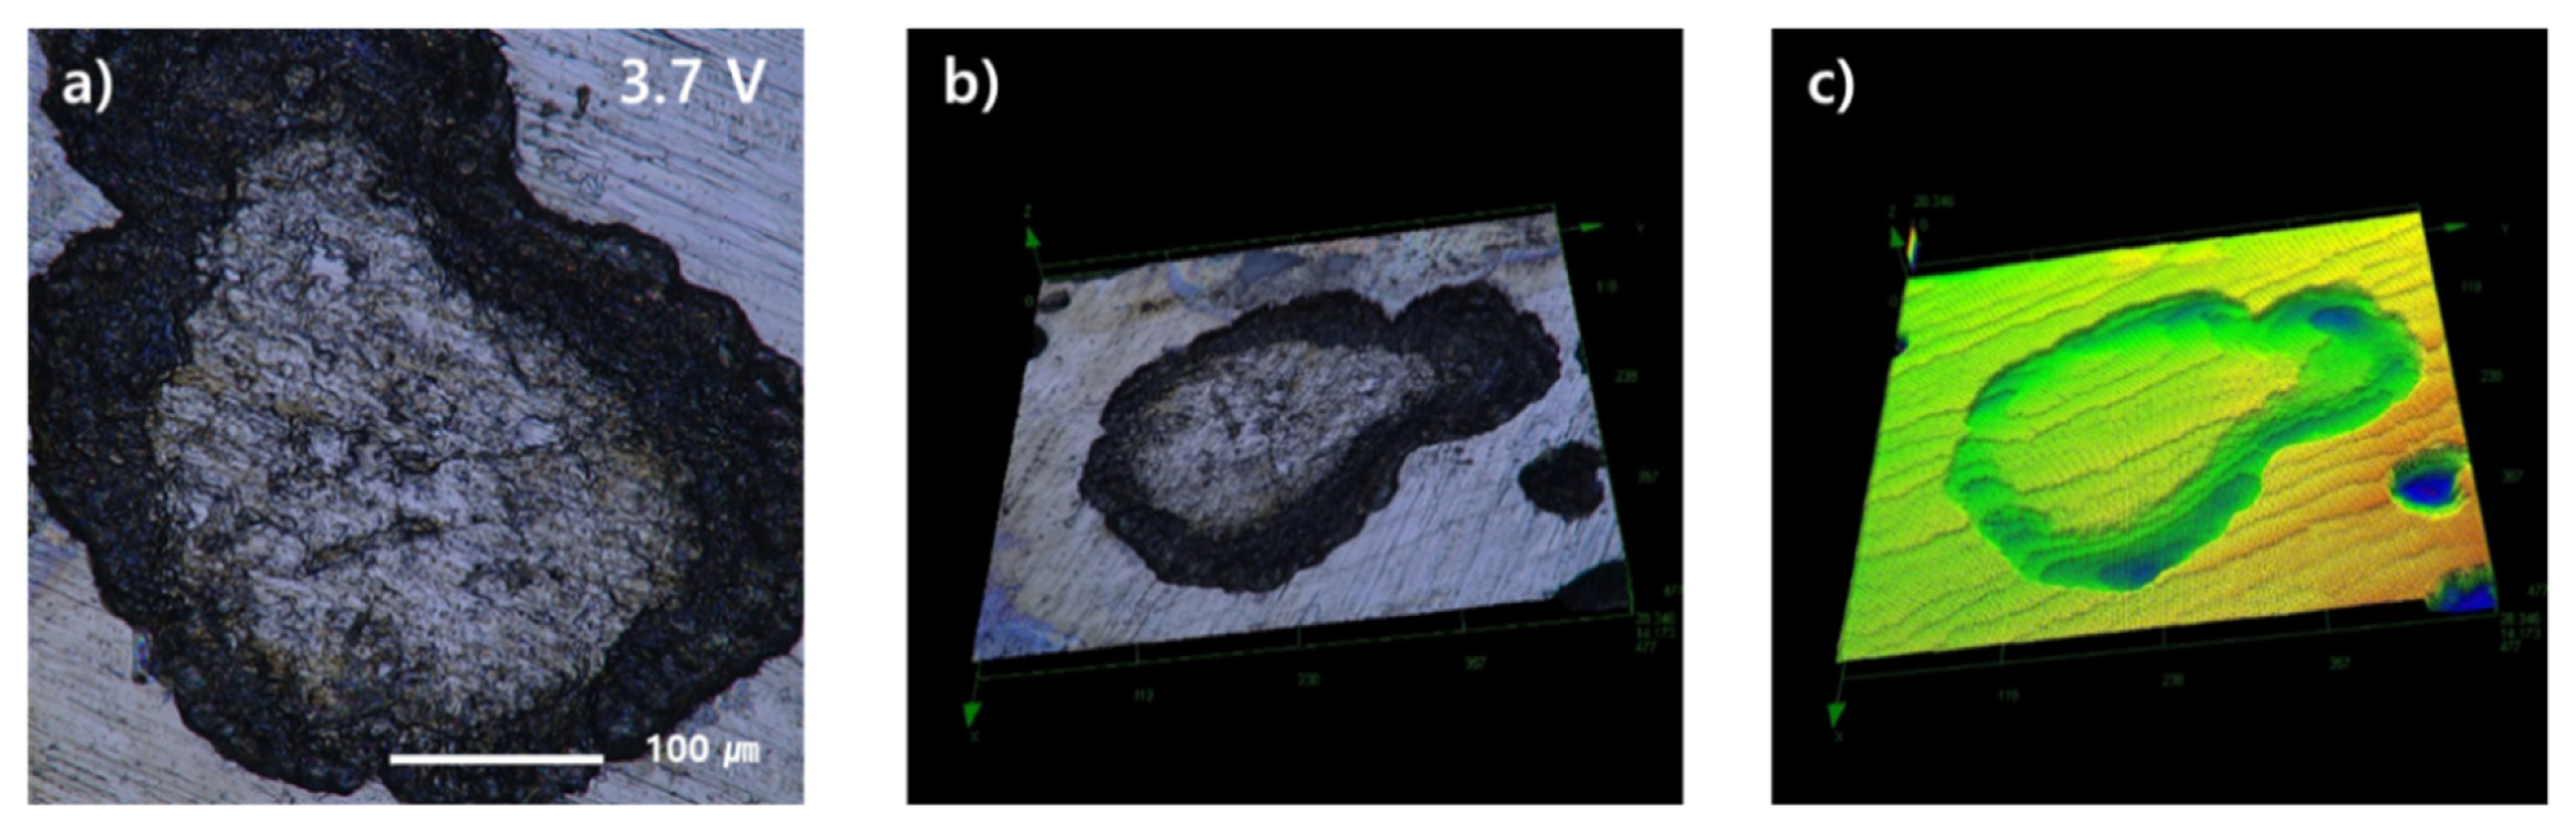
To examine the corrosion pattern of the Fe foil, we acquired optical microscopy and 3D-mapped images; these results are shown in Fig. 5. In this case, we used an electrode obtained after a 24 h constant-voltage test during which Fe corrosion was initiated. From the 2D image shown in Fig. 5a, we note that the corrosion in terms of shape and size is similar to that observed in the SEM images. From the converted 3D images (Figs. 5b and c), we note that the corrosion is significant around the central region, thus resulting in a pitted shape. This result indicates that the observed corrosion does not generate a thin or uniform pattern; the corrosion is deep at the center and begins to spreads outward, and the underlying mechanism is similar to that of pitting corrosion. In the case of the Fe foil, an SEI is formed in the low-voltage regime (3.3 V), and therefore, corrosion does not occur even in the thermodynamic voltage range.
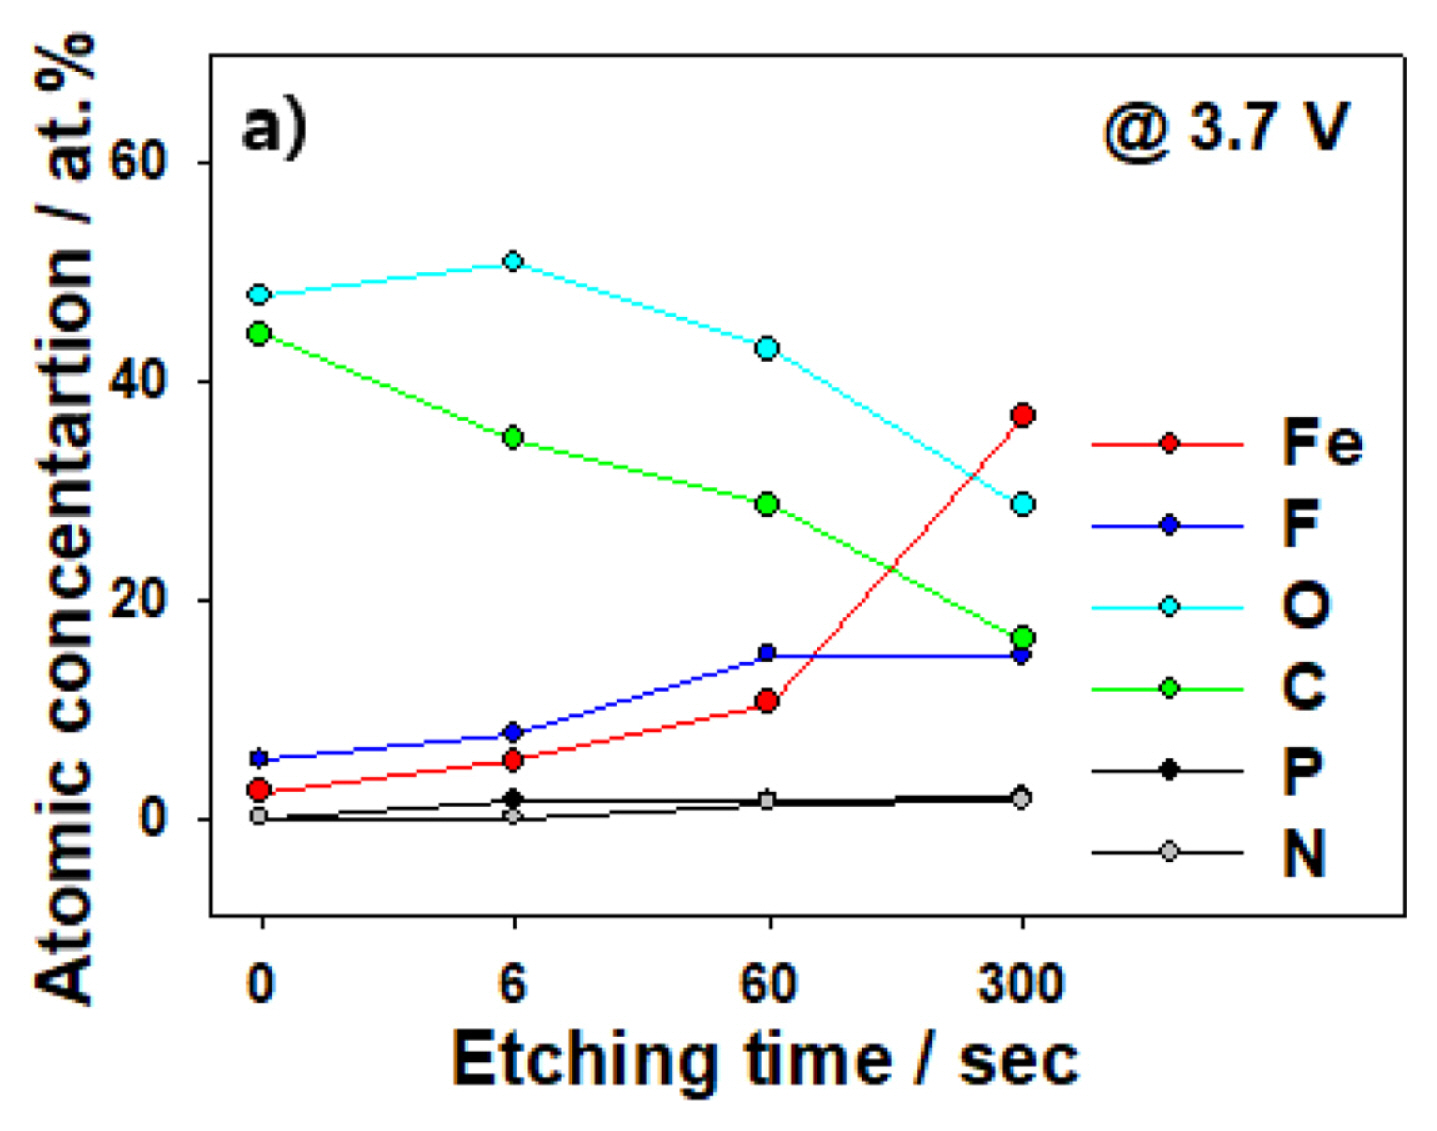
After performing constant-voltage experiments at 3.7 V, we conducted XPS analysis to determine the composition of the Fe-foil SEI obtained after disassembling the coin cell. From previous experiments, we confirmed that the corrosion-related current behavior of the Fe foil before and after the application of 3.7 V at room temperature was different; these results are shown in Fig. 6. First, we note from the XPS results that the SEI as observed by SEM still exists at 3.7 V. At etching time = 0 s, the atomic concentrations of O and C on the surface are 44.3% and 47.9%, respectively, which confirms the formation of an organic SEI. Next, we increased the etching time to 300 s and subsequently analyzed the composition of each SEI layer. After 300 s of etching, the C and O concentrations decrease to 16.3% and 28.6%, respectively, whereas Fe and F increase from 2.4% and 5.3% to 36.8% and 14.9%, respectively. This result confirms that a fluoride-based film is formed on the lower side of the SEI, different from the top-surface composition. These results again confirm that the SEI exists even at 3.7 V when corrosion starts and further that the corrosion is a result of applying a voltage higher than the SEI resistance, and not SEI decomposition.
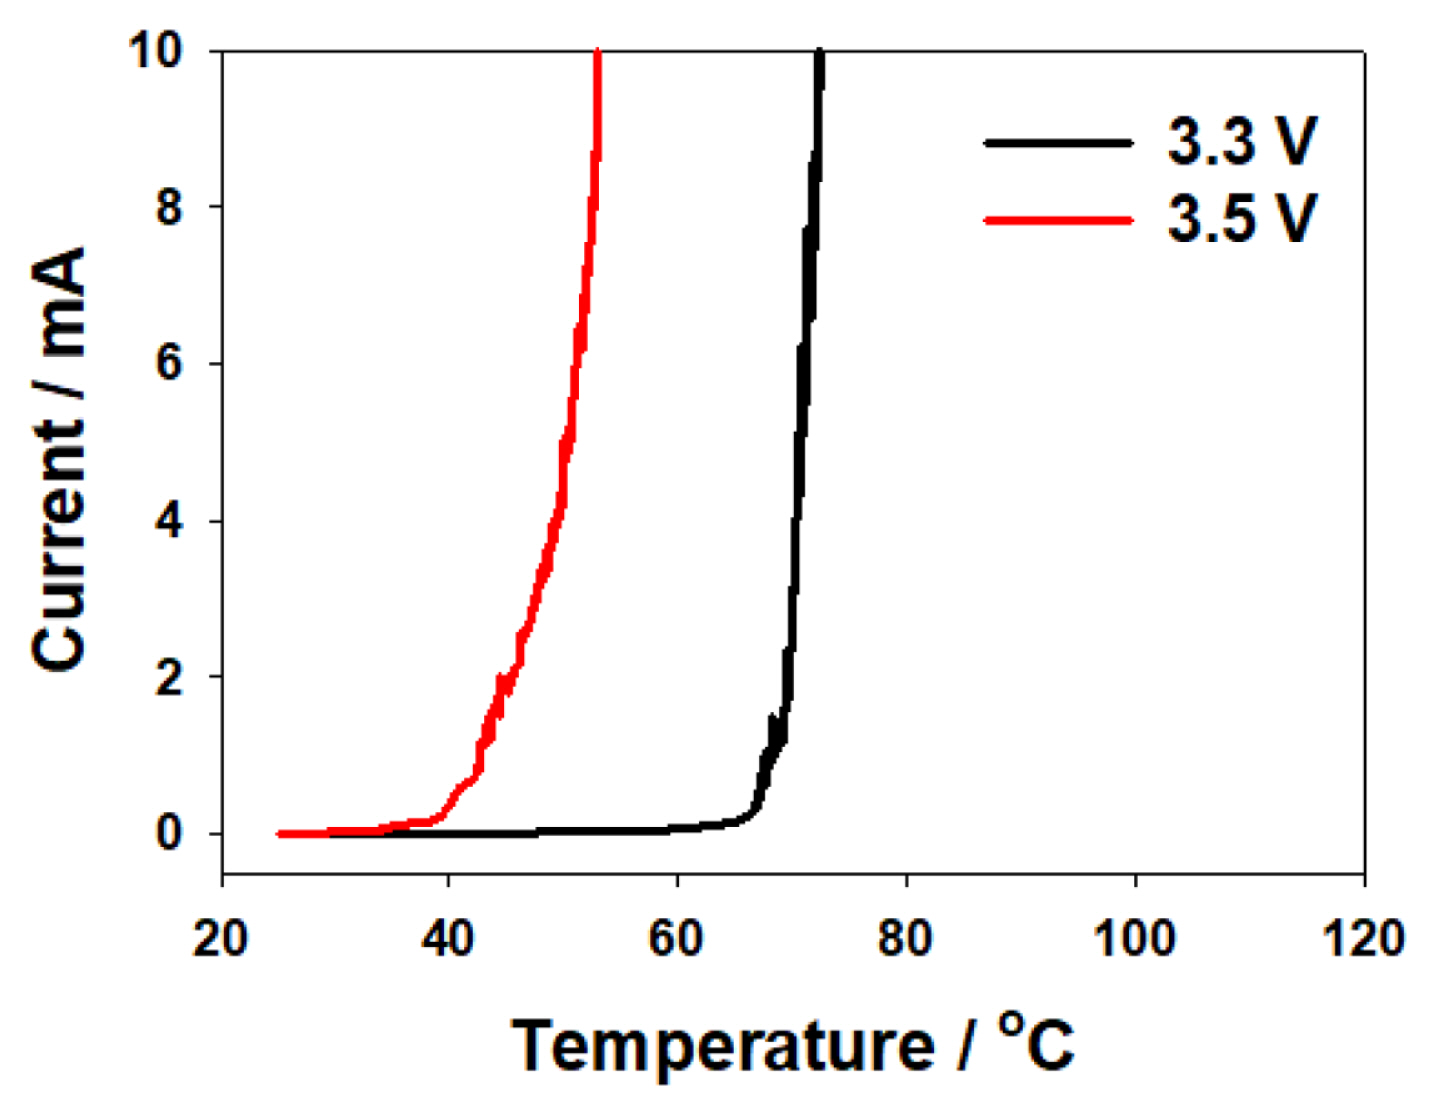
To determine whether corrosion occurs if the kinematic criteria are satisfied in the low-voltage regime, we increased the temperature at 3.3 and 3.5 V (at which values no corrosion occurred in our constant-voltage tests) and studied the flow of corrosion-related current. We conducted an LSTA experiment, whose results are shown in Fig. 7. As the temperature increases, at 3.3 and 3.5 V, the current increases dramatically above a certain temperature in each case. When the current value at which corrosion starts is taken as the standard of 10 mA (the maximum current value corresponding to the constant voltage of 3.7 V), the temperatures corresponding to 10 mA are measured at 3.3 and 3.5 V to be 72.9┬░C and 53.3┬░C, respectively. We find that corrosion is initiated at a higher temperature at lower voltages: corrosion is observed to occur at 3.3 and 3.5 V unlike in the previous experiments, which confirms that corrosion occurs when the thermodynamic conditions are satisfied, that is, when the temperature increases.
4. Conclusion
In this study, we investigated the corrosion behavior of Fe metal in an LIB electrolyte composed of 1.0 M LiPF6 in EC:EMC solvent (1:1 volume ratio). First, cyclic voltammetry and constant-voltage experiments were conducted to determine the onset voltage at which corrosion began. In the CV experiments, the corrosion-related current of Fe foil was not significantly observed below 3.7 V vs. Li/Li+; however, in the constant-voltage experiments that are similar to the actual battery operation conditions, a corrosion current was observed even at 3.7 V. We used to SEM and optical microscope observations to confirm that corrosion was initiated at 3.7 V, and we determined that the corrosion was of the pitting type based on 3D mapping images. We also determined that an SEI was maintained even after corrosion. Our findings indicate that corrosion occurs owing to high polarization, which enables electron transfer without SEI decomposition. In addition, we observed that corrosion occurred at lower potentials as the temperature was increased in the voltage range in which room-temperature corrosion did not occur. Thus, we conclude that the thermodynamic factors underlying metal corrosion in lithium secondary batteries must also be considered for practical application.