


1. Introduction
Here, we demonstrate that bipolar electrochemistry can be implemented on paper substrates and read out by optical signal transduction. Specifically, we show that simple and inexpensive screen-printed carbon electrodes can be used as bipolar electrodes (BPEs) for microfluidic paper-based analytical devices (μPADs). In fact, using just a pair of driving electrodes and a simple power supply, electrogenerated chemiluminescence (ECL) can be simultaneously activated at a μPAD containing an array of 18 BPEs. This result is important because it enables highly multiplexed electrochemical measurements on μPADs.
Following the introduction of μPADs by the Whitesides group, there has been considerable interest in the use of such devices for point-of-care (POC) diagnostics. 1-5 μPADs are typically prepared by patterning hydrophobic walls (using materials like photoresist and wax) on or within materials such as cellulose paper,2 thereby forming hydrophilic channels that direct the flow of a liquid sample to specific reaction zones. These zones are loaded with reagents that in the presence of an analyte induce either an optical6-7 or electrochemical8-10 output. In the case of electrochemical detection, electrodes can be directly integrated in the μPAD by inkjet, stencil- or screen-printing.8,11-12 Due to their ease of fabrication, screen-printed electrodes (SPEs) are commonly used to perform amperometric and potentiometric measurements on μPADs.13- 16 SPEs have also been used to produce optical signals via ECL.17
The time required to fabricate a single SPE is no different than the time necessary to fabricate an array; therefore, multiple SPEs can be easily integrated on a single μPAD platform to perform multiplexed assays. However, traditional three-electrode electrochemical approaches require a direct electrical connection to each SPE for read-out, and this can be difficult to implement on a simple POC sensor. This problem can be solved using bipolar electrochemistry, because faradaic processes are driven on the SPE without a direct electrical connection to a power supply.18 Consequently, an array of BPEs can be operated using a single pair of driving electrodes and a simple power supply. For example, our group has shown that a dense array of 1000 BPEs can be actuated simultaneously using only two driving electrodes.19-20
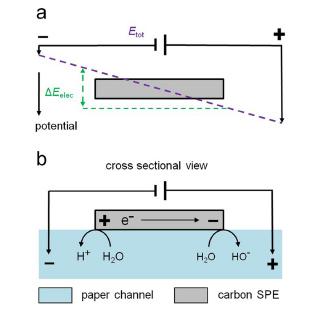
The principles of bipolar electrochemistry and BPEbased sensing are discussed in several recent reviews.18,21 As shown in Scheme 1a, an externally applied potential bias (Etot) of sufficient magnitude can result in enough potential dropped over a BPE (ΔEelec) to drive oxidation and reduction reactions simultaneously at opposite ends of the BPE. For example, Scheme 1b shows the case in which a carbon SPE, exposed to an aqueous electrolyte solution, produces hydroxide ions at the BPE cathode and protons at the BPE anode as a result of water reduction and oxidation, respectively. A very early application of bipolar electrochemistry to paper substrates was described by Bradley et al. in 1999.22 Specifically, they used graphite microbeads trapped within the pores of a paper substrate as individual BPEs to reduce a palladium molecular precursor and thereby obtain a metal catalyst network uniformly dispersed onto the paper structure. Several examples of sensors using BPEs microfabricated on glass substrates have also been reported in the literature.23-26 For example, our group used ECL produced by the co-oxidation of tris(bipyridine) ruthenium(II), Ru(bpy)3 2+, and tri-n-propylamine at the BPE anode to indirectly report sensing events at the cathodic poles of BPEs.27-28
In the present article, we demonstrate that carbon SPEs are suitable for performing bipolar electrochemistry on μPADs and, therefore, such a platform can host a dense array of many carbon SPEs. Moreover, we show that 18 carbon SPEs can be used as BPEs and simultaneously generate ECL. The ECL signal is stable and reproducible and can be used as an optical readout. We believe that these results open new possibilities for the creation of highly multiplexed sensing systems on μPADs.
2. Experimental Section
2.1 Chemicals.
NaH2PO4, Na2HPO4, and 2-(dibutylamino)ethanol (DBAE) were purchased from Sigma-Aldrich (St Louis, MO). The pH indicator solution was purchased from Acros (Cat # 61231-5000, Morris Plains, NJ). Ru(bpy)3Cl2·6 H2O was purchased from Strem Chemicals (Newburyport, MA). NaCl and Whatman grade 1 chromatography paper were purchased from Fisher Scientific (Waltham, MA). Carbon ink (CI-2042) was purchased from Engineered Conductive Materials (Delaware, OH). All the chemicals were used without further purification. Deionized (DI) water having a resistivity >18 MΩ·cm was used for all experiments (Milli-Q gradient system, Millipore, Bedford, MA).
2.2 Device fabrication.
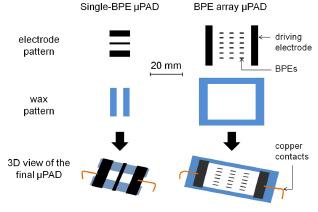
The patterns for the single-BPE and BPE array μPADs are provided in Fig. 1. The devices were fabricated as follows. First, the paper channels were printed on Whatman grade 1 chromatography paper (20 × 20 cm sheet) using a Xerox 8570DN inkjet wax printer, and then the wax/paper assembly was heated in an oven at 120℃ for 90 s to form the hydrophobic wax barriers.29,30 Second, the patterns of the electrodes were photolithographically defined onto 305 thread/ in2 mesh (Ryonet W2024305) using a screen printing kit (Ryonet, SKSTARTERKIT). Third, carbon electrodes were manually screen-printed onto the wax patterned paper using the patterned mesh as a mask. Fourth, the electrodes were dried for 15 min at 23℃ and then for 30 additional minutes at 65℃ to stabilize the electronic properties of the ink. In the present article, all the electrodes were fabricated by screen-printing and are therefore referred to as SPEs. It is important to note that these SPEs are also referred to as BPEs and driving electrodes according to their function in the device. Finally, the driving electrodes, which are only used to power the device, were connected to an external power supply using copper tape (Fig. 1). Note that the BPEs were always located between the two driving electrodes but were not connected to any external power source. During the ECL measurements, the μPADs were sandwiched between two glass slides.
Fig. 1.
Electrode and wax patterns used to fabricate a single-BPE μPAD and a BPE array μPAD. The 3D views in the bottom row show the devices after screen printing the electrodes on the wax patterned paper. The black, blue, and white colors represent the carbon screen-printed electrodes, the wax, and the paper, respectively. The orange lines represent the copper tape used to connect the driving electrodes to a power supply.
2.3 Colorimetric measurements.
The paper channel was soaked in a solution containing 10.0 mM phosphate buffer (pH 7.6) and dried at 65℃ for 1 min. Then 8.0 μL of a colorimetric pH indicator solution mixed with DI water (30% v/v) and NaCl (10.0 mM) was placed on the channel. The color of the channel instantly turned yellow-green indicating a pH of about 7-8. A DC power supply (TDKLAMBDA LLS9120, Tokyo, Japan) was used to power the device at 25.0 V for 90 s.
2.4 ECL measurements.
The ECL intensity was recorded using a Nikon AZ100 microscope (0.5X Nikon AZ Plan Apo objective, no filter) equipped with a black and white Quantem 5125C camera. V++ Precision Digital Imaging software (Digital Optics, Auckland, New Zealand) was used to acquire the micrographs. An exposure time of 1 s was used for all micrographs. The light intensity emitted at the anodic poles of the BPEs was averaged over the surface of the BPE poles and background subtracted using ImageJ (NIH, Bethesda, MD). For the experiments shown in Fig. 5a, the time between measurements was 1 min to allow the rehomogenization of the ECL reagents in the diffusion layer. A DC power supply was used to power the paper device.
3. Results and Discussion
3.1 Bipolar electrochemistry on a μPAD
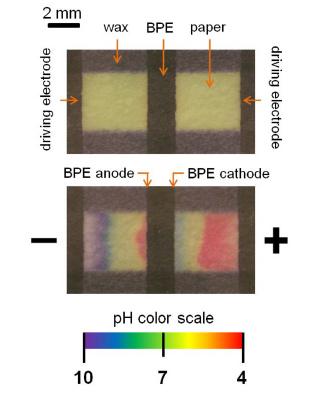
The device shown in Fig. 2 was used for a proof-ofconcept experiment to demonstrate that bipolar electrochemistry can be carried out on a μPAD using carbon SPEs. The figure shows two carbon driving electrodes screen-printed at the two opposing edges of a wax-patterned paper channel (12.0 mm long by 4.5 mm wide). A 2.0 mm long carbon SPE is defined at the center of the paper channel and between the driving electrodes. To demonstrate that faradaic processes occur simultaneously at the poles of the BPE, an elegant colorimetric experiment, initially reported by Manz and co-workers, was carried out.18 The principles of this experiment are summarized in Scheme 1b. In the presence of a sufficiently large value of Etot, water is oxidized and reduced at the anodic and cathodic poles of a BPE generating protons and hydroxide ions, respectively. A colorimetric pH indicator solution is used to show the resulting changes in the local pH of the electrolyte solution. The initial green coloration in the paper channel (Fig. 2, top) arises from the colorimetric pH indicator solution filling the channel. However, when a potential bias of Etot = 25.0 V is applied between the two driving electrodes for 90 s (Fig. 2, bottom), the color of the dye changes near the edge of each electrode. At the positive driving electrode the color changes from green to red, indicating that the pH decreases (generation of H+), and near the negative driving electrode the color changes from green to purple, indicating an increase of the pH (generation of OH−). Most importantly, however, the solution-saturated paper near the cathodic and anodic poles of the central BPE turned from green to purple and green to red, corresponding to the evolution of OH− and H+, respectively, even in the absence of a direct electrical connection. This result correlates to the case depicted in Scheme 1b and clearly demonstrates that bipolar electrochemistry can be performed on a μPAD.
Fig. 2.
Photographs of a single-BPE μPAD. The top and bottom photographs were taken before and after application of 25.0 V for 90 s, respectively. The channel was filled with a colorimetric pH indicator solution, which gives the yellowgreen coloration to the paper. The red and blue colors in the bottom photograph correspond to pH changes resulting from electrochemical reactions at the driving electrodes and the BPE.
3.2 ECL detection on a BPE array μPAD
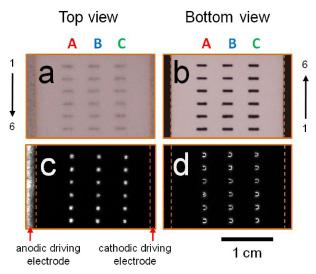
As mentioned earlier, bipolar electrochemistry is well suited for multiplexed analyses, a functionality often desired in POC applications, and ECL provides a convenient and sensitive readout for large arrays of BPEs.19,31 To test the feasibility of using ECL-based readout for an array of paper-supported BPEs, a μPAD composed of 18 individual BPEs was fabricated. The BPE array μPAD was filled with 40.0 μL of 0.10 M phosphate buffer solution (pH 6.9) containing 5.0 mM Ru(bpy)3 2+ and 25.0 mM DBAE.32 Optical micrographs of the device are shown in Figs. 3a and 3b. Figs. 3c and 3d show top and bottom luminescence micrographs, respectively, of the device after applying Etot = 35.0 V to the driving electrodes. A strong ECL signal is apparent at the anodic pole of each of the 18 BPEs, as well as at the anodic driving electrode (only shown in Fig. 3c). Because wetted paper is semitransparent, and ECL is produced at the interface between the paper matrix and the electrodes, the strongest ECL signal is collected from the top of the device (that is, on the side of the paper opposite to the electrodes). However, lower intensity ECL can also be observed from the bottom of the μPAD (Fig. 3d).
Fig. 3.
(a, b) Optical and (c, d) luminescence micrographs of a BPE array μPAD. The luminescence micrographs were obtained using Etot = 35.0 V. The positions of the driving electrodes are indicated by the orange dashed line. [Ru(bpy)3 2+] = 5.0 mM and [DBAE] = 25.0 mM in 0.10M phosphate buffer (pH 6.9).
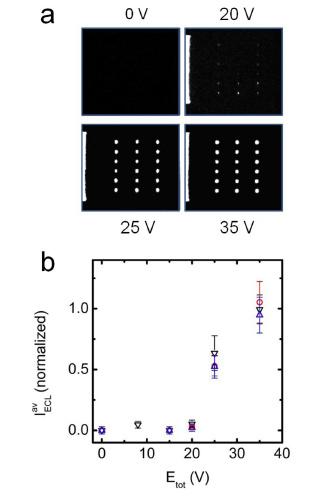
Luminescence micrographs of a BPE array μPAD powered at different values of Etot are shown in Fig. 4a. The ECL intensity above the anodic driving electrode (left edge of the micrographs in Fig. 4a) does not vary significantly for values of Etot ranging from 20.0 to 35.0 V. However, the ECL intensity observed at the BPEs increases dramatically as Etot increases. The average, normalized ECL intensity produced at the BPEs in the array,  , is plotted in Fig. 4b as a function of Etot. These results show that a minimum Etot of ~25.0 V is required to produce ECL. That is, at values of Etot > 25.0 V, ΔEelec, which is approximately linearly related to Etot,21 is sufficient to simultaneously drive the oxidation of DBAE and Ru(bpy)3 2+ (as well as the reduction of oxygen at the cathodic pole of the BPE) and hence ECL is observed. As shown in Fig. 4b, higher values of ΔEelec lead to increased ECL intensity due to increased kinetics of the relevant faradaic reactions. 33
, is plotted in Fig. 4b as a function of Etot. These results show that a minimum Etot of ~25.0 V is required to produce ECL. That is, at values of Etot > 25.0 V, ΔEelec, which is approximately linearly related to Etot,21 is sufficient to simultaneously drive the oxidation of DBAE and Ru(bpy)3 2+ (as well as the reduction of oxygen at the cathodic pole of the BPE) and hence ECL is observed. As shown in Fig. 4b, higher values of ΔEelec lead to increased ECL intensity due to increased kinetics of the relevant faradaic reactions. 33
Fig. 4.
(a) Luminescence micrographs of a BPE array μPAD operating at the indicated values of Etot. Note that a strong ECL signal is produced at the anodic driving electrode (on the left side of 3 of the micrographs), indicating that the device is operating correctly. The brightness and contrast of the micrographs have been adjusted to distinguish the ECL signal from the background. (b) Normalized ECL intensity averaged over the 18 BPEs present in a single device as a function of Etot. The different colors correspond to measurements for three independently prepared devices. The error bars correspond to the SD of the ECL intensity between BPEs on the same array.
In our experiments, Etot = 35.0 V led to intense and reproducible ECL signals, and therefore this value was used for a quantitative study of ECL generated by the BPE array μPADs. Figure 5a shows the ECL intensity, IECL, obtained from 6 consecutive measurements of 6 of the 18 BPEs present on a single device. The coefficient of variation (CV, defined as the ratio of the standard deviation, SD, divided by the average intensity) of IECL for the six consecutive measurements is 4%. This small variation in IECL means that a single device can be read out several times without loss of accuracy or reproducibility.
Fig. 5.
(a) Six successive measurements of the ECL intensity (normalized) of 6 of the 18 BPEs present on a single BPE array μPAD. An equilibration time of 1 min was allowed between each measurement. (b) Normalized ECL intensity at each BPE of a single BPE array μPAD as a function of the position of the BPE in the array. The number and color coding of the BPEs is the same as in Fig. 3. The error bars represent the SD for three successive measurements. (c) Average ECL intensities obtained using five independently prepared BPE array μPADs. The error bars represent the SD of .
.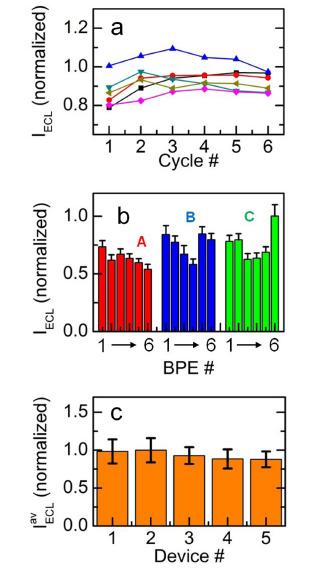
The variation of IECL for BPEs on the same array (intra-array variability) can be estimated from Fig. 5b. Here, the value of IECL is plotted as a function of the position of the BPE in the array. The numbering of the BPEs follows the color and letter code shown in Fig. 3. The CV (defined in this case as the ratio of the SD of three successive measurements divided by ) of the intra-array ECL intensity is 16%. This value is adequate for manually-produced SPEs but would likely be improved by more reproducible fabrication processes.
) of the intra-array ECL intensity is 16%. This value is adequate for manually-produced SPEs but would likely be improved by more reproducible fabrication processes.To compare reproducibility between devices (interarray variability), the average intensity per array was measured using 5 different BPE array μPADs (Fig. 5c). The CV was calculated to be 6%. This low CV value indicates good reproducibility between μPADs, a crucial point for sensing applications. Note that although the inter-array CV is lower than the intraarray CV, this is likely a mathematical artifact caused by averaging over a larger number of samples (18 BPEs/device) for the inter-array CV.
4. Conclusion
To summarize, we have shown that carbon electrodes screen-printed directly onto cellulose paper can be used as BPEs. By using an array consisting of 18 individual BPEs, we also showed that ECL can be generated simultaneously at each BPE. Importantly, an Etot of 35.0 V was sufficient to reproducibly drive the ECL reaction. The reproducibility between individual BPEs and between devices is relatively good and demonstrates that ECL can be used as an optical reporting method on paper substrates. More importantly, because each BPE in the array does not require a direct electrical connection, a single power supply connected to a single pair of driving electrodes is sufficient to power a BPE array of arbitrary size. Accordingly, arrays such as these, fabricated on paper, could be used to simultaneously detect a large number of analytes, thereby opening the way to densely multiplexed μPADs.


