Copper Recovery from Printed Circuit Boards Waste Sludge: Multi-step Current Electrolysis and Modeling
Article information
Abstract
Heavy metals recovery from Printed Circuit Boards industrial wastewater is crucial because of its cost effectiveness and environmental friendliness. In this study, a copper recovery route combining the sequential processes of acid leaching and LIX 984N extracting with an electrowinning technique from Printed Circuit Boards production’s sludge was performed. The used residual sludge was originated from Hanoi Urban Environment One Member Limited Company (URENCO). The extracted solution from the printed circuit boards waste sludge containing a high copper concentration of 19.2 g/L and a small amount of iron (0.575 ppm) was used as electrolyte for the subsequent electrolysis process. By using a simulation model for multi-step current electrolysis, the reasonable current densities for an electrolysis time interval of 30 minutes were determined, to optimize the specific consumption energy for the copper recovery. The mathematical simulation model was built to calculate the important parameters of this process.
1. Introduction
Metal finishing operations in the electronics industry produce high levels of waste whose disposal can pose a significant environmental challenge. According to the previously reported literature [1], counted to 2019, there were approximately 53.5 million metric tons of electronic wastes per year discarded on the world. Among them, only 17.4% was formally collected and recycled while the remaining amount was normally disposed in landfill, burned, treated in a sub-standard way, or illegally traded. In general, the landfilling and burning methods are regarded as environmentally unfriendly approaches [2,3]. A typical example of such electronic waste is printed circuit boards (PCBs) waste sludge which arises from the precipitation of rinse water, spent electrolytes, and spent etching solutions in the electroplating and electronics plants producing PCBs. Normally, the PCBs waste sludge contains different metal sources. Among them, copper (Cu) is predominant with a relatively large amount from 3.14 to 4.85 wt.% (wet content) [4] or higher 13 wt.% (dry content). Thus, copper recovery from the sludge of the PCBs production is crucial because this not only solves the environmental issues but also creates a new copper supply source for the global copper market.
Currently, to recover metals from the sludge, some methods, for example, a pyrometallurgical method [5,6], a hydrometallurgical method [4,7–9], or a combined hydro-pyrometallurgical method, [10] have been used. Among them, the hydrometallurgical method is regarded as an efficient method. Typically, this involves leaching processes, which use acidic solutions [6,11–13], basic solutions [13], or bioleaching agents [9,14]. After leaching, metal ions can be recovered by various techniques such as cementation, solvent extraction and precipitation, or electrolysis [3,10,14–18]. Compared with the others, the electrolysis technique, namely electrowinning, which is performed in a simple parallel-plate flow cell system, exhibits outstanding advantages including environmental friendliness and production of high purity copper. Remarkably, during an electrolysis process the copper concentration gradually decreases, followed by a low current efficiency and a high specific energy consumption. Numerous efforts have been dedicated to improving the current efficiency as well as lowering the specific energy consumption. F. Veglio et al. [16] and Ma-ud N et al. [19] recovered copper from the sludge using a constant potential electrolysis mode. In their work, the solution obtained after the leaching process in H2SO4 acid with pH 2 contained 10 g/L Cu2+ ions. The electrolysis was performed at a potential value of −0.4 V vs. SCE (corresponding to the cell voltage of 2.4 V). Copper was recovered after 2 h with a current efficiency of about 95% and a specific energy consumption of 2.13 kWh/kg [16]. Similarly, copper with the high purity of 98.93% was recovered at the constant cell voltage of 2.2 V and the highest current efficiency of 99.45% [19]. However, the electrolysis manner at a constant potential or at a constant cell voltage is normally suitable on lab-scale rather industrial scale operations because production and operation costs are relatively expensive. Besides, another electrolysis technique, viz. cyclone electrowinning with an optimum circulation flow which enabled minimizing polarization effects, was also used to increase the current efficiency up to 97% [20] for the copper recovery from a leached solution containing 45.7 g/L Cu2+ ions in the presence of Zn2+, Cd2+ and Fe2+ impurities. Sudipta Roy’s group [21] investigated the copper recovery in a parallel-plate cell using a multi-step current electrolysis technique. Based on the calculation on the diminution in the concentration of copper ions, the research group established a list of current densities after each 1 h of electrolysis, which are approximately limiting current densities. However, this technique was only effective in initial 10 h, and about 67% of copper in the sludge was recovered. The achieved current efficiency of the electrolysis process was 82.1% corresponding to the initial concentration of 0.3 M Cu2+. Also, in the research of Sudipta Roy and co-worker, the cathodic mass transfer coefficient was determined from the initial electrolyte and regarded as a constant value during the electrolysis process. Accordingly, the practical limiting current density and the theoretical limiting current density were quite different, resulting in the decrease in the current efficiency of the electrolysis process. Hence, in the present work, we consider the change in the mass transfer coefficient against the change in the Cu2+ concentration. Accordingly, the electrolysis parameters of the step current electrolysis process would be determined more exactly. This is beneficial for increasing the current efficiency and decreasing the specific consumption energy.
In addition to experiments, the modelling of the metal recovery process has attracted considerable scientists [22–26] to determine recovery efficiency and current efficiency, cell voltage as well as specific energy consumption parameters. Normally, in the modelling process four equation systems are established. They include (i) mass balance equations, (ii) energy balance equations, (iii) electrochemical equations, and (iv) correlation between conductivity and concentration. These equations were calculated by using the Matlab software, for example, for the zinc electrowinning processes [22,23] or for copper electrowinning processes [24–26]. These proposed models enabled predicting relatively accurately electrolysis data such as the mass of electrodeposited copper, the cell voltage and the specific energy consumption. Besides, the modeling helps calculate the other parameters such as recovery efficiency (Hr), current efficiency (Hc) when the copper concentration and the design parameters of an electrowinning bath such as anode and cathode diameters, anodecathode distance and bath volume are changed. In addition, by using the multi-step current electrolysis, in the simulation process the electrolysis time interval can be changed easily to optimize the technology procedure. Simultaneously, the simulation model also enables exact prediction of the required electrolysis duration. This greatly reduces experimental effort as well as experimental expenditure. In addition, this method is also used to simulate the large size bath on an industrial scale [27,28]. Accordingly, manufacturers can determine electrowinning technology parameters to promote enhanced metal recovery efficiency and reduced energy consumption. This is also simulation software integrated-calculation base (Computational Fluid Dynamic - CFD) for the intensive investigations of the other industrial processes.
In the present work, we report copper recovery from the PCBs waste sludge of the Hanoi Urban Environment One Member Limited Company (Vietnam) by a multi-step current electrolysis technique on a lab scale. The electrolysis parameters including recovery efficiency, current efficiency, cell voltage and specific energy consumption for the copper recovery from the leached solution after leaching the PCBs waste sludge were calculated and determined from the experimental data and the simulation model throughout using Microsoft Excel software as well. The reliability of the proposed simulation was evaluated.
2. Experimental
2.1. Electrolyte preparation for electrolytic recovery of copper
Normally, the PCBs production process generates a massive amount of wastewater and depleted plating solution, which are treated with alkaline, mainly calcium hydroxide, accompanied by coagulation and sedimentation to create metal-containing sludge. The waste sludge from the PCBs production process used in the present work was collected from the Hanoi Urban Environment One Member Limited Company (URENCO), Vietnam. After receiving, the sludge sample was dried at 110°C for 4 h, ground, and sieved to obtain particles with the size smaller than 100 μm. After that, to determine the composition of the obtained sludge, the sample was dissolved thoroughly in concentrated nitric acid, followed by a dilution process prior to Inductively Coupled Plasma Mass spectroscopy (ICP-MS) analysis. The analysis result is shown in Table S1.
To recover copper, selective copper leaching from the PCB waste sludge was preceded using a three-stage sequential leaching technique. In detail, 11.4 g of the dried sludge was dispersed into 100 mL of a 1.08 M H2SO4 solution under magnetically stirring at 600 rpm for 75 min. After filtration, the obtained pregnant leach solution was added into a 20 vol.% solution of LIX 984N in purified kerosene as an organic extractant. Their volumetric ratio was controlled to 1:1. After subjected to stirring for 30 min, the mixture was statically stored in 30 min to separate into two liquor layers by gravity. The obtained raffinate after separation was re-mixed with the fresh organic extractant. The extraction process was repeated three times. Meanwhile, the remaining copper-loaded organic extractants were collected and mixed with a 0.4 M H2SO4 solution for stripping copper. After stirring for 30 min and aging for 30 min, the mixture was gravitationally separated to attain a copper-stripped organic extractant and a copper-enriched aqueous electrolyte. The stripped organic extractant was returned to renewed contact with the acidic solution. This copper stripping process was repeated three times. Remarkably, for the copper stripping, the volumetric ratio of the copper-loaded organic extractant to acidic solution was fixed to 3:1. Finally, the copper-enriched aqueous solution was collected and analyzed the concentration using the ICP-MS method. From the ICP-MS result, the leaching solution was determined to contain 0.3 M CuSO4, 0.4 M H2SO4 and 0.575 ppm iron.
2.2. Electrolytic recovery of copper
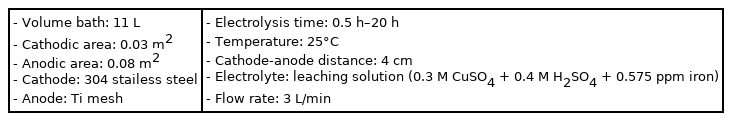
After the selective copper leaching step, the obtained leaching solution was utilized as an electrolyte for the copper recovery electrolysis, which was conducted in a pilot parallel-plate flow cell system as shown in Fig. 1. In this study, the electrolysis process was conducted via a step current electrolysis mode. This electrolysis process was designed to occur at limiting current densities of copper electrodeposition. The current values applied in the pilot cell were changed after every 30 min of electrolysis according to a data set which was calculated from the simulation model. After a given period of electrolysis, the cathode was weighed with a digital balance. The change in the cathode weight and cell voltage after electrolysis were recorded. In addition, the electrolyte after each electrolysis process was collected and analyzed the UV-Vis for determination of the remaining copper concentration in the electrolyte. All the obtained real data would be used to calculate the real current efficiency, copper recovery efficiency, specific energy consumption. The detailed specification of the pilot cell system and operation conditions are showed in Fig. 1 and Table 1.
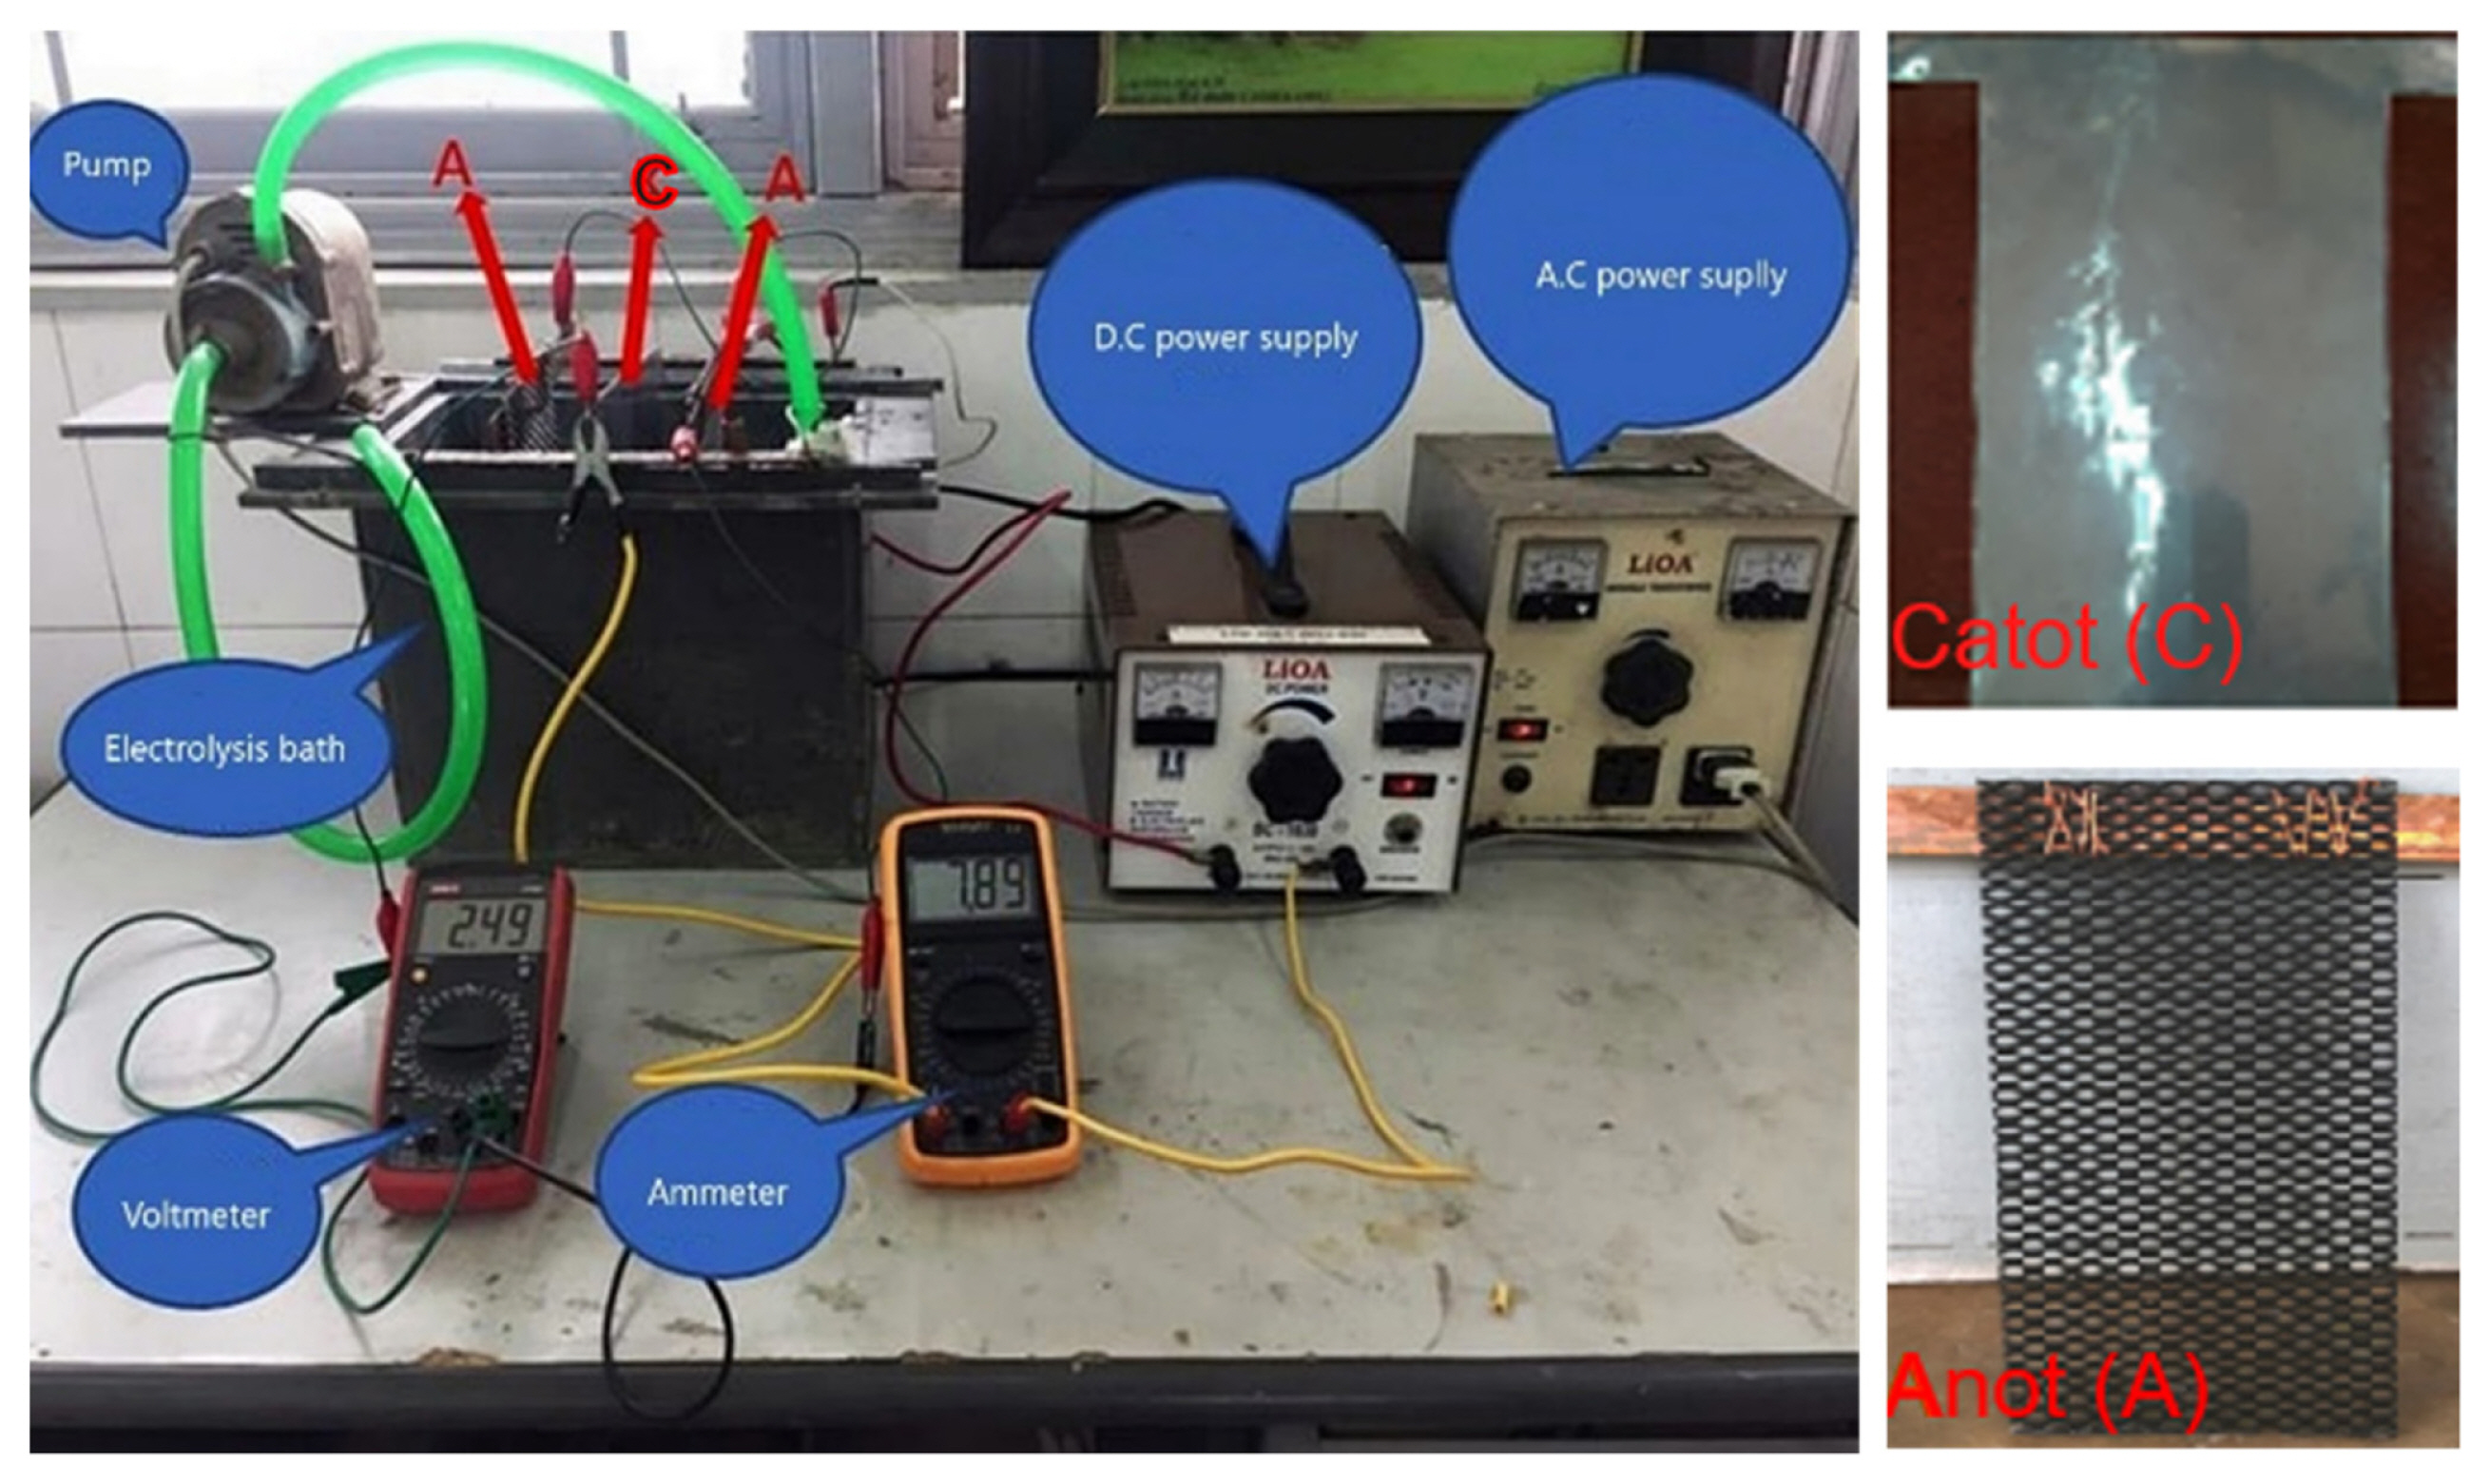
A pilot-electrolysis cell used for simulation of the copper recovery process from the PCB waste sludge of URENCO
Specifications of the pilot electrolysis cell used for simulation of the copper recovery process from the PCB waste sludge.
The theory calculation model of copper recovery process via an electrolysis route was implemented. The relationships of the electrolytic input and output parameters built up in the present work are shown in Fig. 2. In specific, the desired electrodeposition parameters including equilibrium anode and cathode potentials (

Flow chart of the simulation model set-up of the electrolysis process for copper recovery
2.3. Model development of copper electrowinning
Before developing the mathematical model for copper electrowinning from the leaching solution of URENCO, the input parameters of copper electrolysis had to be identified. Two most important species in the leaching solution as the electrolyte are copper and hydrogen ions. Both are involved in reactions occurring at the cathode during electrolysis:
The E0 values given above are the standard equilibrium potentials for the two half reactions. Normally, if copper electrolysis is conducted at the current density smaller than or equal a limiting current density, the 100% of the cathodic current is used for copper production. In the present work, the copper electrolysis was designed to operate at limiting current densities by using the step current mode. It was supposed that only the reduction reaction of Cu2+ to produce metal copper occurred at the cathode. Therefore, the reduction reaction (2) was also assumed not to occur.
The two other species modelled are the sulfate ion and water. Among them, only water participates in an anodic reaction:
The set-up of the equations of the mathematical model of the copper electrowinning cell can be divided into three main sections, including (i) thermodynamic and kinetic relations, (ii) electrolyte resistance and concentration correlation, and (iii) electrochemical equations. Each section will be examined respectively as follows.
a) Thermodynamic and kinetic relations
The basis of all thermodynamic calculations for electrochemical processes involving cathodic and anodic reactions is the Nernst equation [23,29]. For the copper electrowinning process in the present work, the Nernst equation was employed to calculate the equilibrium potentials for the two cathodic and the anodic half reactions (Reaction (1) and reaction (3)):
Where,
For j solute species, for example, Cu2+ and H+ ions, the activity, aj (mol/L), is a product of a concentration (Cj) and an activity coefficient (γj):
Where, γj is calculated by the extended Debye-Huckel equation [24]:
Where, Iγ is the ionic strength of the aqueous solution (mol/kg) and Iγ = 0.5
In fact, for the occurrence of the copper electrode-position process, an electrical current must run into the electrolysis cell. At that time, the electrode potential will deviate the equilibrium potential value. The magnitude of this deviation is known as overpotential (η) and is defined as the difference between the working electrode potential (E) and the equilibrium potential (Ee). For the cathode and anode, their overpotentials will be written:
Where, Ec and Ea are the cathodic and anodic working potentials, respectively.
Regarding reaction kinetics, the cathodic and anodic current densities are related to their overpotentials. In specific, for the cathodic reaction of the copper electrodeposition process, the cathodic current density (ic), which is proposed to be controlled by both charge transfer rate and mass-transfer rate, will be calculated by [24]:
Where, i0, c is the cathodic exchange current density (A/m2), iL,c is the limiting cathode current density (A/m2), αc is the cathodic charge transfer coefficient, ηc is the cathode overpotential (V), T is the absolute temperature (K), F is the Faraday constant, R is the universal gas constant.
On the other hand, a limiting cathode current density of the copper electrolysis process could be identified by,
Where, C is the concentration of Cu2+ in electrolyte (mol/m3), km is the cathodic mass transfer coefficient (m/s), n is the number of exchanged electron (n = 2).
From Eqs. (10) and (11), the cathode overpotential is determined as follows:
For the anode reaction, because the anodic reaction rate is established to be controlled by the charge transfer rate within the potential range under investigation, the anode current density is calculated according to the Tafel equation:
Where, i0,a is the anodic exchange current density (A/m2), αa is the anodic charge transfer coefficient, ηa is the anode overpotential (V).
After transformed from Eq. (13), the anode overpotential is given by,
b) Electrolyte resistance and concentration correlation
The resistance of the electrolyte solution has a significant effect on the cell voltage. The electrolyte resistance (Rs) is calculated by,
Where, σ is the specific conductance (Ω−1m−1), d is the cathode-anode distance (m), A is the cross section area (m2).
Meanwhile, based on the literature [30], the σ parameter could be calculated:
Where, CCu2+ and CH2SO4 are the concentration of Cu2+ and H2SO4 present in the electrolyte (kg/m3), T is the electrolyte temperature (°C).
c) Electrochemical equations
In the electrolysis cell, to operate successfully, the cell always maintains electroneutrality condition. It means that, the total cathodic current (Ic) must equal the total anodic current (Ia) and equal the applied current (Iapp):
On the other hand, the anodic and cathodic currents can be written as,
Where, iCu and iO2 are the current densities related to Reactions (1) and (3). Ac and Aa are the cathode and anode areas, respectively.
The cell voltage for the copper recovery process is calculated as follows:
The current efficiency, Hc, of the copper electrolysis is defined by,
Where, mt is the mass of copper collected from the cathode after electrolysis (g), Iapp is the applied current (A), t is electrolysis time (h), ɛCu is the electrochemical equivalent of copper (g/Ah), ɛCu = 1.186 g/Ah.
Copper recovery efficiency, Hr, at a given time (t) is calculated according to the below equation:
Where, m0 is the mass of copper in the electrolyte before recovery (g), mt is the mass of remaining copper in the electrolyte after the electrolysis time t (g).
Specific energy consumption, which is defined as an amount of electrical energy used for the copper electrolysis process per a weight unit of copper produced, is calculated:
All calculations according to the equations from (4) to (23) were conducted on Microsoft Excel software. The algorithm to calculate the copper recovery efficiency, Hr, and the cell voltage Vcell was to solve mathematical equations that used loops for calculation of consecutive electrolysis times.
3. Results and Discussion
3.1. Estimation of the input parameters in the model
Before the mathematical model was used for simulation as well as applied to the pilot copper electrolysis cell system which used the copper-containing leaching solution from URENCO as the electrolyte, some input values of the technical parameters needed determining early. The estimation process of these parameters is described as below:
a) Determination of exchange current density and transfer coefficient
To estimate the exchange current density and transfer coefficient for the cathode and anode of the copper electrolysis process, the Tafel plots of the copper electrodeposition and oxygen evolution reactions were recorded in a solution containing 0.3 M CuSO4 and 0.4 M H2SO4, using a three-electrode cell configuration. In fact, the three-electrode cell was composed of a 11 L-volume bath, which is the same to the pilot cell, a stainless steel as a working electrode, and a titanium electrode as a counter electrode and vice versa. The area of the stainless steel and titanium electrodes were fixed to be 0.44 cm2. Meanwhile, the Ag/AgCl electrode served as a reference electrode. The solution was agitated using a circulation pump at a flow rate of 3 mL/min. From the obtained results in Fig. 3, by extrapolation of the two Tafel lines of the two anodic and cathode branches, the exchange current density of the cathode and anode, i0,c and i0,a, were determined to be 12.6 and 0.1 A/m2, respectively. Similarly, the transfer coefficients, αc and αa were 0.55 and 0.198.
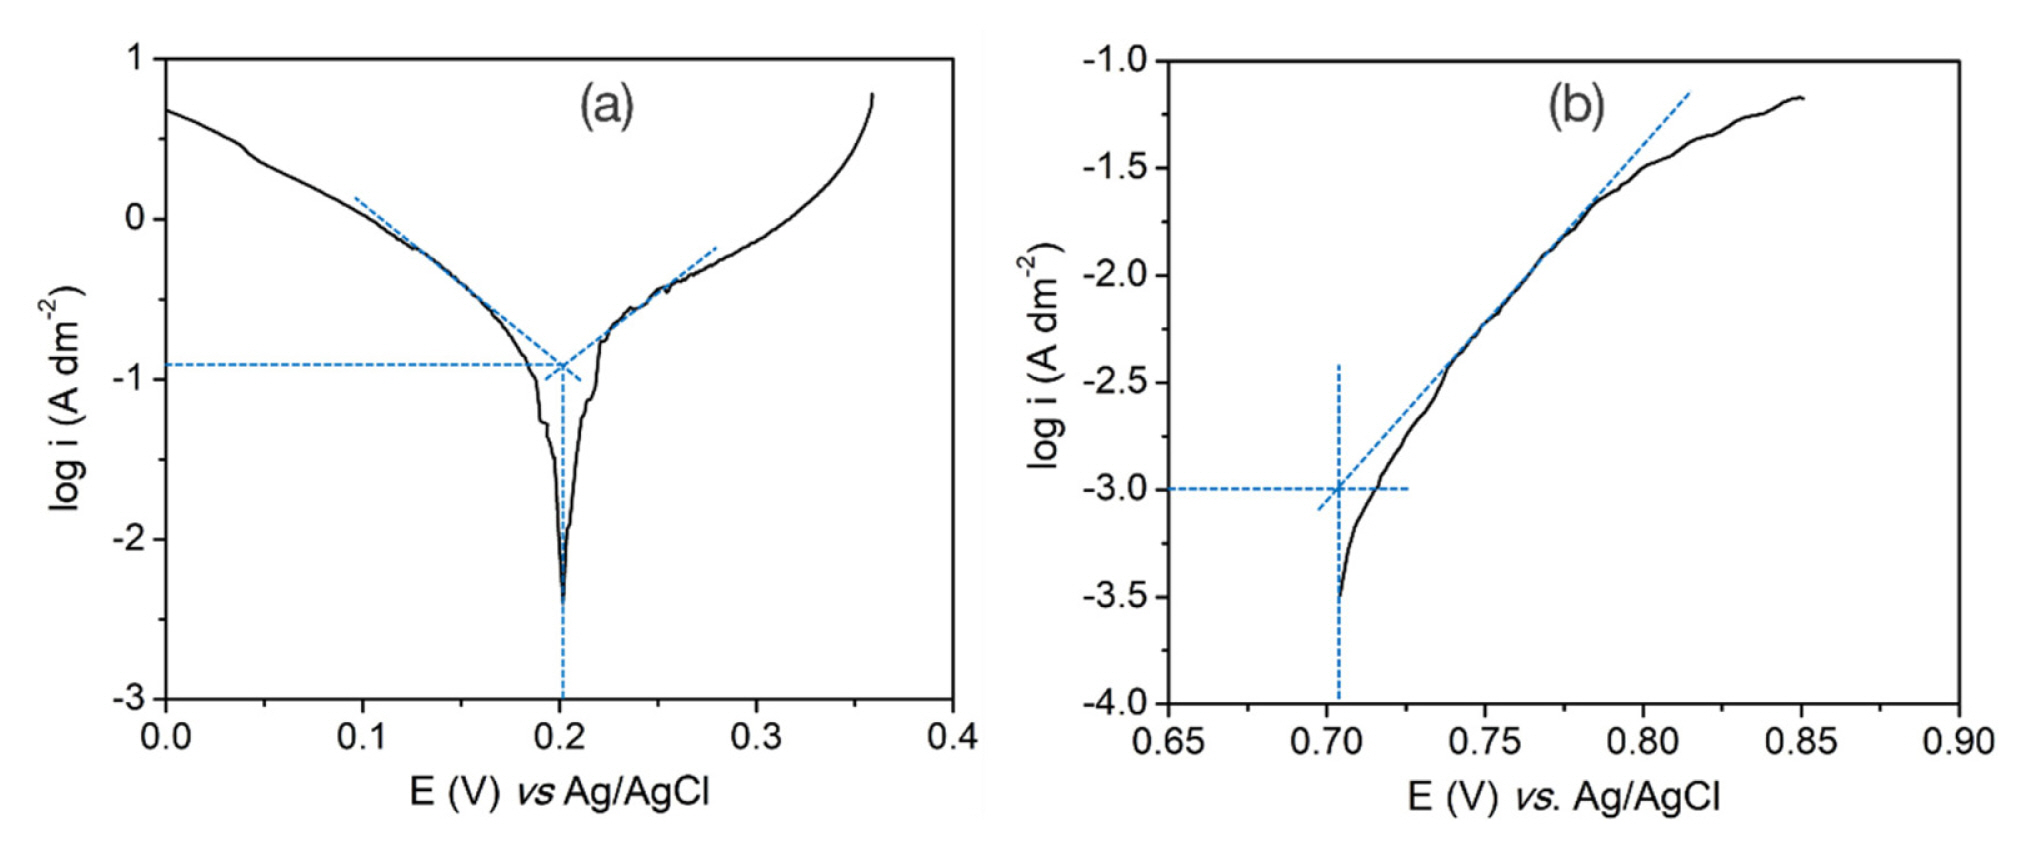
Tafel plots of (a) 304 stainless steel and (b) titanium electrodes in a solution of 0.3 M CuSO4 and 0.4 M H2SO4
b) Determination of mass transfer coefficient
Because the aim of the present work is to treat the environment and recover copper, the copper electrolysis process is only finished as the Cu2+ concentration in the electrolyte after electrolysis reaches approximately 0 g/L. Noticeably, during the electrolysis the Cu2+ concentration decreases gradually. Accordingly, the limiting current density of the copper electrolysis decreases as well. Therefore, for the copper recovery, use of the electrolysis technique at a constant current mode during a long period of time firmly leads to high energy consumption, followed with high copper recovery cost. Such an electrolysis technique is likely ineffective. If so, applying the step electrolysis current mode with gradually decreasing values during the electrolysis process will enable high current efficiency and copper recovery efficiency.
As proposed in Eq. (11), the cathodic current density of the copper electrolysis is dependent on the concentration of the oxidation reagent, in specific, the concentration of Cu2+. To find the mass transfer coefficient in Eq. (11), the polarization curves of the copper electrodeposition in the electrolytes of 0.4 M H2SO4 with the different concentrations of CuSO4, where the concentration accounted for Cu2+ ranged from 5 to 25 g/L, were recorded by the linear voltammetry polarization technique. The measurements were conducted on Autolab PGSTAT302N using the three-electrode cell configuration as described above. The obtained results are displayed in Fig. 4.
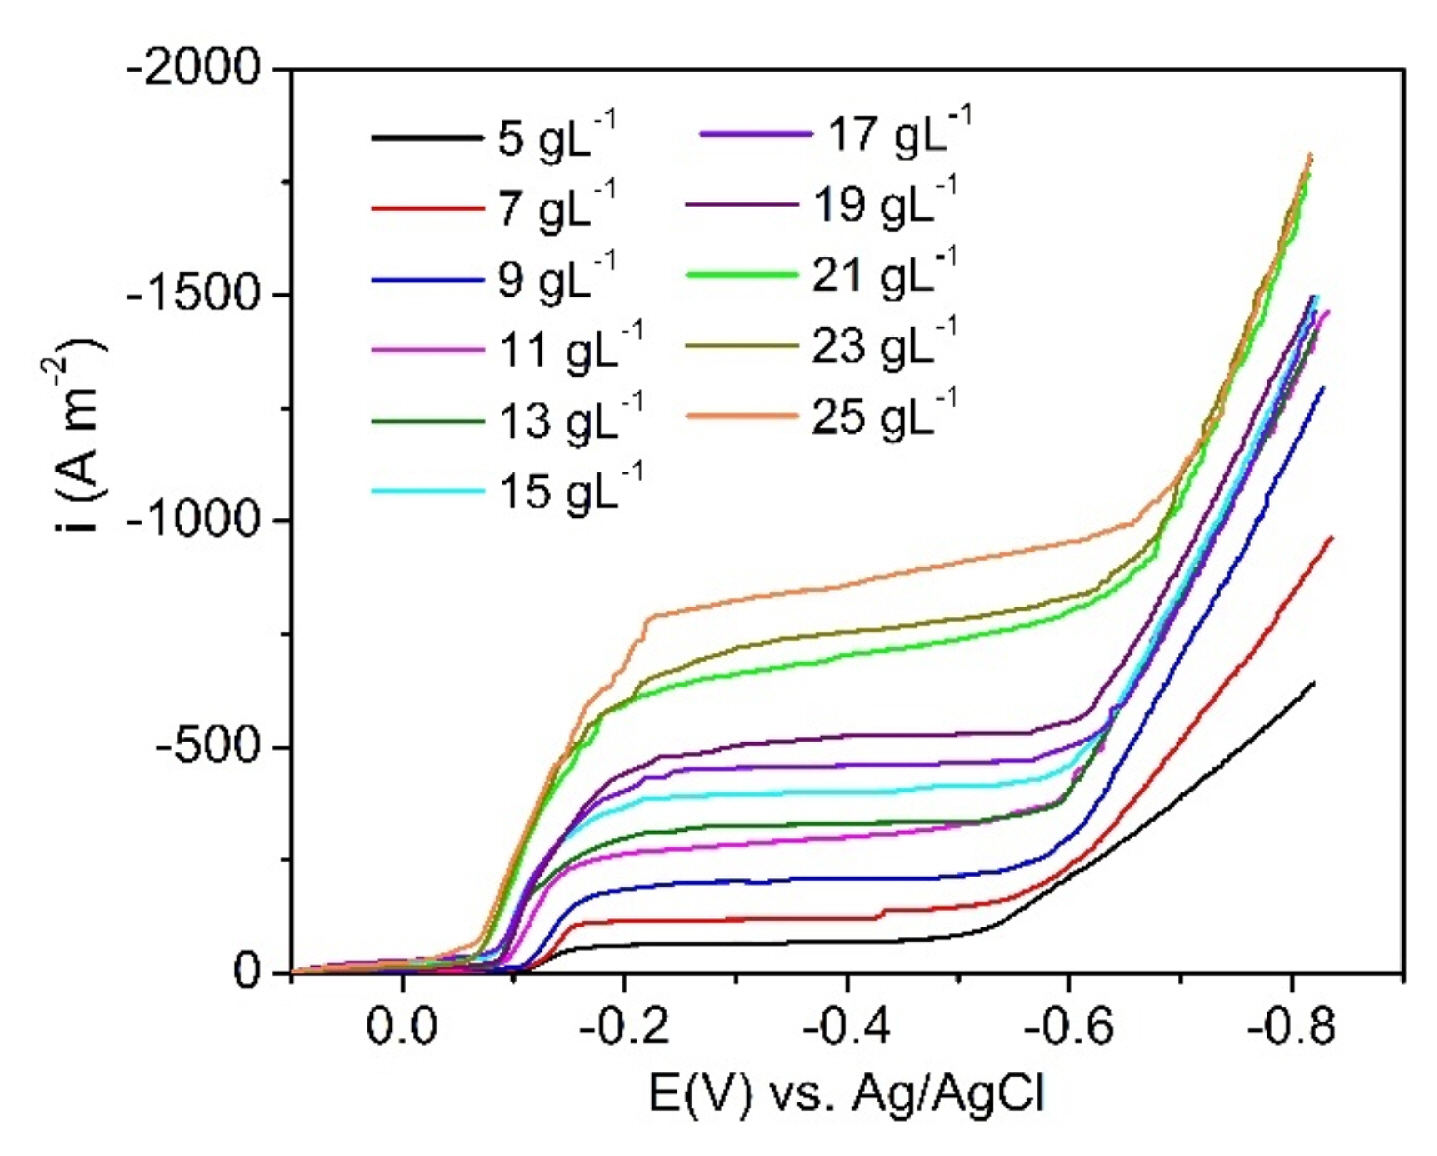
LSV curves of the stainless steel electrode in the bath containing 0.4 M H2SO4 and the different concentrations of Cu2+ at a scan rate of 1 mV/s.
From Fig. 4, the limiting current densities (ic,L) for the copper electrodeposition in the potential range of 0.2–0.5 V vs. Ag/AgCl corresponding to the given concentrations of Cu2+ were determined. After that, based on Eq. (11), the mass transfer coefficient of the Cu2+ containing-solutions (km) was calculated and presented in Fig. 5 and Table S2.
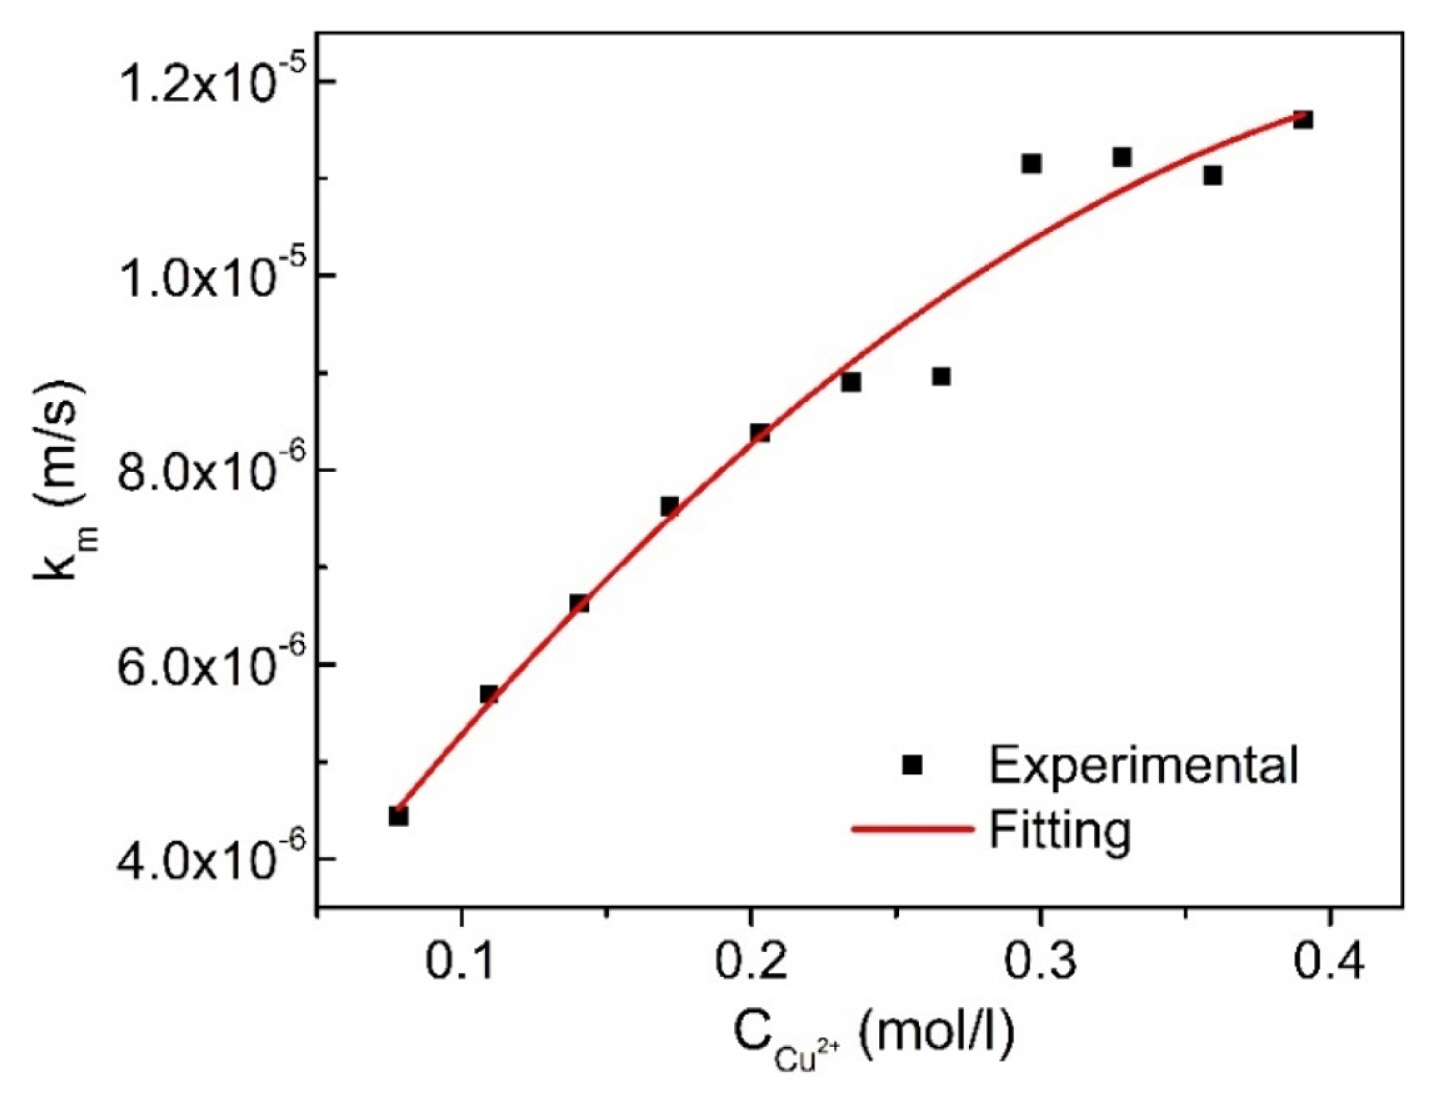
Dependence of the mass transfer coefficient (km) on the concentration of Cu2+(CCu2+)
From Fig. 5, it is observed that, the obtained empirical values of km are not an unchanged number, but km is regarded as a function of the concentration of Cu2+. After fitting with a regression model, km can be expressed as,
Because the limiting current density of the copper electrolysis process usually reduces with the decrease in copper concentration in the leaching solution. To find the relationship between solution concentration and electrolysis time, the material balance model of Barton and Scott [12] as below was used:
Where, V is the electrolysis cell volume (dm3), yj is the concentration of species j in the electrolyte (M), Qf is the volumetric flowrate of the feed (dm3/s), xj is the concentration of species j in the feed (M); rgen,j is the generation rate of species j (mol/s), Qd is the volumetric flow leaving the bath (dm3/s), revap,j is the evaporation rate of species j (mol/s), and rcon,j is the consumption rate of species j (mol/L).
Because the copper electrolysis cell was designed for intermittent operation, effect of the feeding and leaving flows was removed from calculation. In addition, in fact, mass loss caused by evaporation is relatively small. It is accounted for 2–3% of the water entering the electrolysis cell at 35°C [24]. Effect of the evaporation-caused mass loss was excluded.
According to the Faraday’s law, the copper weight electrodeposited on the cathode per a time unit is given,
From Eqs. (25) and (26), the mass balance equation is written for Cu2+ as,
If, the applied electrolysis current is a limiting current density,
with km = 2.10−5 · (Ccu2+)0.6 as shown in Eq. (24)
After replacing Eq. (28) into Eq. (27), we have,
After solving the differential Eq. (29), the concentration equation of Cu2+ against electrolysis time is given:
Based on the electrolysis time-dependence of the concentration of Cu2+ as Eq. (30), the concentration of Cu2+ present in the electrolyte after each 30 min as well as the limiting electrolysis current was determined. After that, the practical electrolysis current could be designed properly. The total of the electrolysis time for the copper recovery was 20 h. About 5 mL of the electrolyte was drained after each 30 min of electrolysis for determination of the copper concentration via the UV-Vis method. The calculation results from Eq. (30) are listed in Table S3.
c) Determination of activity coefficients
In the solution of 0.3 M CuSO4 and 0.4 M H2SO4, the dissociation of the compounds could be written as:
Where, Kf is the dissociation constant, [H+], [
From Eqs. (31)–(34), the concentration of the H+,
During the electrolysis process, the concentrations of the ions change. Thus, after each 30 min of electrolysis, their activity coefficient and activity would be calculated according to Eqs. (6) and (7). Accordingly, the equilibrium potentials of the cathode and anode would be identified.
3.2. Validation of the real solution model
By using the proposed model with the initial parameter values as calculated above, the model prediction values were achieved through Microsoft Excel software. At the same time, their relevant experimental data from the pilot cell were collected for comparison and validation of the designed model. Table S3 shows the change in the concentration of Cu2+ after each 30 min during 20 h of electrolysis observed from model predictions and experimental data. From Table S3, it is observable that the difference between the concentrations calculated via the simulation model and the experimental concentration is negligible, smaller than 3% for the initial 14.5 h of electrolysis. After that, this deviation increases, but still maintains at values smaller than 8% at the electrolysis time of 20 h. This verified the high accuracy of the simulation equation showing the electrolysis timedependence of the copper concentration.
In addition, the difference between the simulated data and experimental data involving the cell voltage, current efficiency, copper recovery efficiency and specific energy consumption are also displayed in Fig. 6 and Table S4. In general, the plots showing the dependence behavior of the cell voltage (Fig. 6a) and recovery efficiency (Fig. 6b) on the electrolysis time of the pilot cell system using the step current electrolysis mode are observed to be totally similar. Their simulated and experimental data are almost coincident during 20 h of electrolysis. Nevertheless, as for the current efficiency and specific energy consumption parameters, the high coincidence between the simulated and experimental data is only recognized for the period of the electrolysis time of 0–14.5 h (Fig. 6c, d). After 14.5 h of electrolysis onwards the obtained experimental data differed significantly from the simulated data, suggesting the invalidation of the proposed simulation model in this electrolysis duration. As an initial assumption of the simulation model, the simulated current efficiency is constant and equals 100%. In fact, when applying the various electrolyte currents on the pilot electrolysis cell system using the leached solution from URENCO as the electrolyte, the obtained values of the experimental current efficiency slightly fluctuated between 92.95% to 100% for the initial 14.5 h of electrolysis. Unfortunately, for the subsequent 5.5 h of electrolysis, the experimental current efficiency dropped rapidly. At the time of 20 h, the experimental current efficiency only achieved 62.48%. This can be explained that, after 14.5 h of electrolysis the copper concentration decreased dramatically. In contrast, the protons (H+ ions) which were generated at the anode (Reaction (3)) were accumulated sufficiently in the electrolyte. This promoted the discharge competition of H+ ions against Cu+2 ions at the cathode surface. As a result, the initial hypothesis that the current efficiency equals 100% and only Cu+2 ions participate the reduction reaction (Reaction (1)) at the cathode is no longer suitable.

Change of the simulated and experimental electrolysis parameters against electrolysis time: (a) cell voltage, (b) recovery efficiency, (c) current efficiency and (d) specific energy consumption.
Similarly, from both simulated and experimental data in Fig. 6d, it is recognized that the obtained specific energy consumption diminished with increasing the electrolysis time. Remarkably, as for the experimental data, the specific energy consumption showed an increasing tendency after reaching a minimum value after 14.5 h of electrolysis. This firmly resulted from the decrease in the experimental current efficiency of the copper electrolysis process, which caused energy waste to produce the undesired byproduct, viz. hydrogen gas. Hence, from the obtained results in Fig. 6, it can be concluded that the designed simulation model only exhibits high fitness to the practical pilot cell system in the initial period of electrolysis time of 14.5 h.
To evaluate the high fitness level of the output parameters calculated by the simulation model versus those retrieved from the experiments, all the relevant data are present in Fig. 7. Regarding the cell voltage and recovery efficiency parameters, the high coincidence of their simulated and experimental data is observable easily in Figs. 7a, b. Based on the least squares fitting method, the correlations between simulated and experimental data were fitted within an electrolysis duration of 14.5 h. In specific, the correlation function of the simulated cell voltage against the experimental one was found to be y = 1.00053x with a high correlation coefficient R2 = 0.99989. Meanwhile, concerning the copper recovery efficiency and specific energy consumption parameters these functions are y = 1.01635x with R2 = 0.99996 and y = 0.9845x with R2 = 0.99942. So, from the linear regression equations obtained in Fig. 7, the correlation efficient between the simulated and experimental data for the output parameters of the copper recovery efficiency, cell voltage, and specific energy consumption are 98.39%, 99.95% and 98.45%, respectively. These values are extremely high, over 98.3%, indicating the high precision of the designed simulation program. The below 1.7% deviation between the simulated and real data likely originated from ignoring the resistances of electrical connection and the conducting wires as well as excluding the parasitic reaction of H+ ions discharging at the cathode. In addition, another reason, the errors induced in the measurements of the input parameters of the pilot cell system, should be accounted as well.
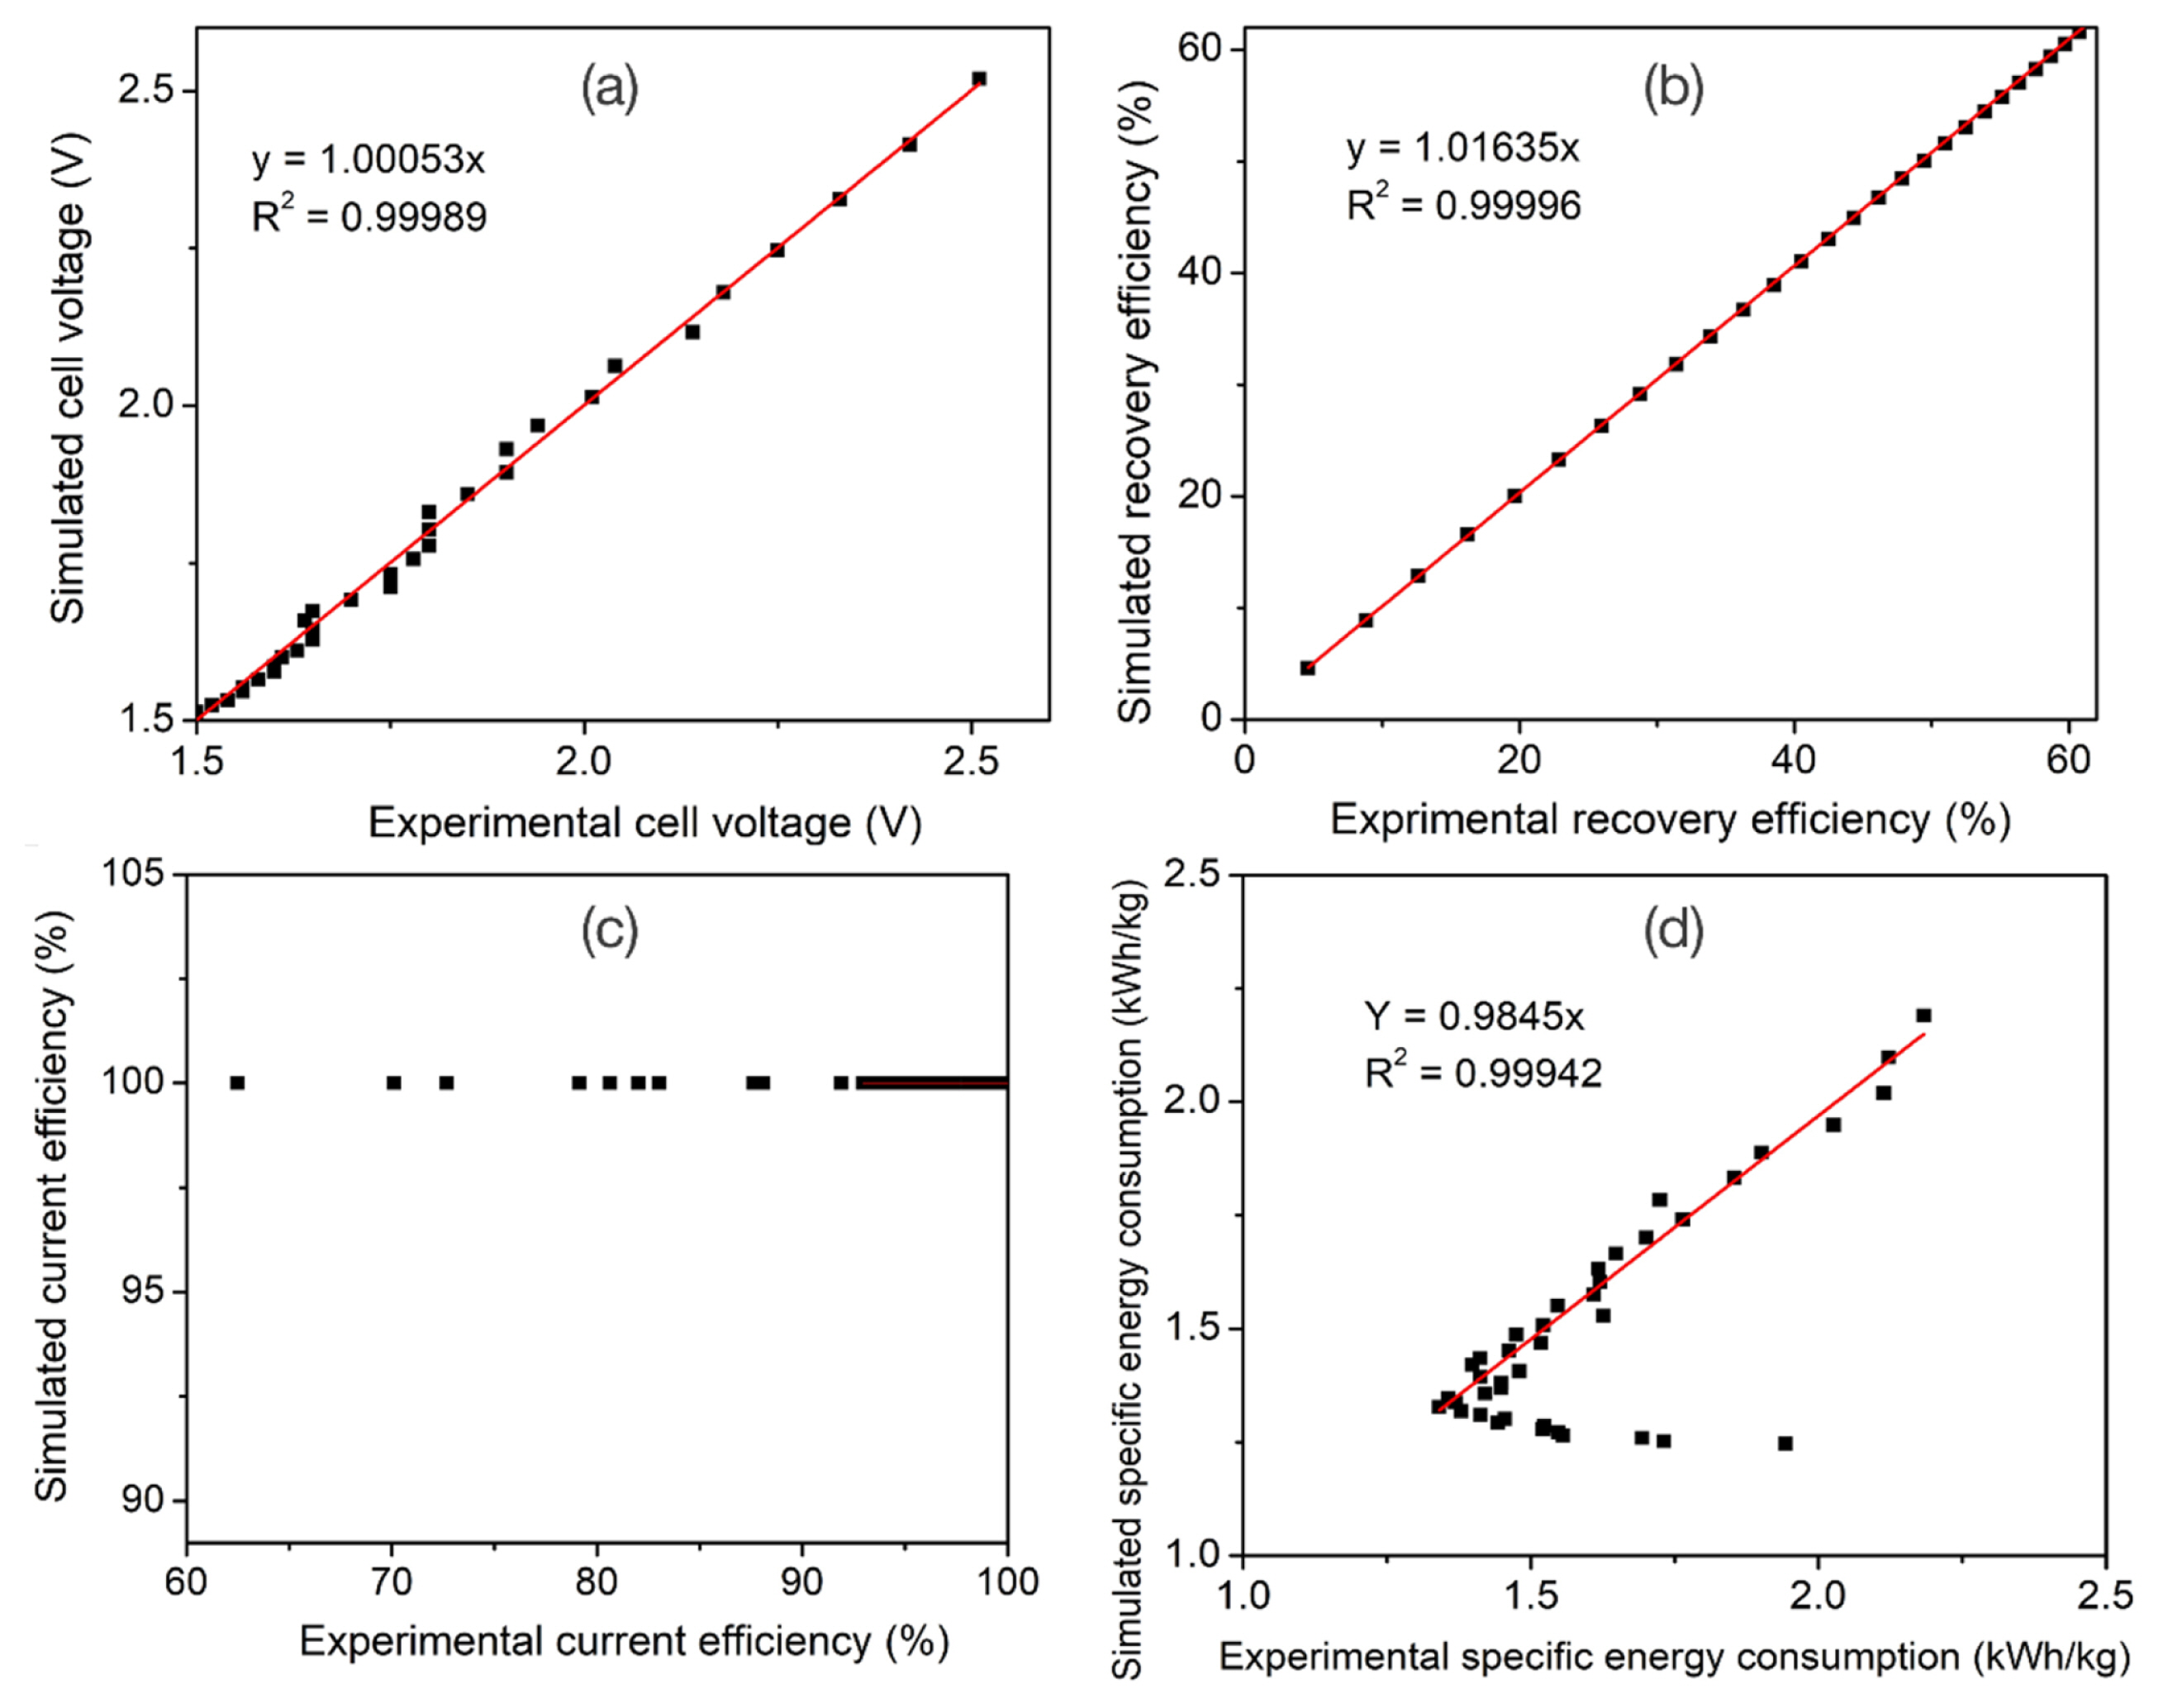
Correlation of the relevant simulated and experimental data: (a) cell voltage, (b) recovery efficiency, (c) current efficiency and (d) specific energy consumption.
In addition, to evaluate the sensitivity of the designed model to the estimated inputs as variables, a series of simulations was proceeded when the relative errors of the input parameters were fixed to be ±10%. The effects on the simulated cell voltage and simulated specific energy consumption are shown in Table 2. From Table 2, it is observable that the anodic exchange coefficient (αa) for the oxygen evolution reaction has a large influence on the model predictions. In detail, the predicted values of both simulated cell voltage and specific energy consumption fluctuated within a deviation range of around ±5% when the αa variable was determined with an error range of ±10%. Meanwhile, the deviation in determination of other variables involving the cathodic exchange coefficient and cathodic/anodic exchange current densities, only has negligible effect on either the cell voltage or the specific energy consumption. The ±10% changes in the cathodic exchange coefficient and cathodic/anodic exchange current densities merely caused a narrow error range of below ±1% for the cell voltage or the specific energy consumption.
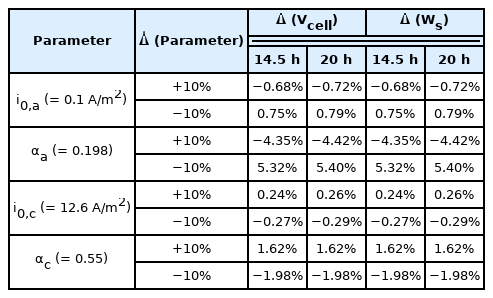
Sensitivity of the model via the estimated input parameters
4. Conclusions
A mathematical simulation program has been designed for the copper electrolysis cell with the pilot-plant size of 11 L. The designed model consists of a set of 28 equations involving the thermodynamic and kinetic equations, concentration variation equations, electrochemical and mass transfer equations and correlations for the electrolyte resistance and the concentration. The designed model assumes that the pilot cell always operates at the limiting current densities during the copper electrolysis process. In fact, the pilot electrolysis cell used the extracted solution from the PCBs waste sludge of URENCO as the electrolyte. With the input copper concentration of 19.2 g/L, the cell was subjected to operate at the multi-step current electrolysis mode for 20 h of electrolysis with the time interval of 30 min. During electrolysis, the applied current of the cell was controlled variously from 16.90 to 2.28 A based on the calculated data from the model. The obtained experimental data demonstrated the high reliability of the designed model for the initial 14.5 h of electrolyte. The deviation between the simulated and experimental parameters regarding the cell voltage, recovery efficiency and specific energy consumption, was significantly small, below 2%. By the experimental measurements, the lowest specific energy consumption for the copper recovery was determined to be 1.341 kWh/kg, which is in high agreement with the simulated value (1.3269 kWh/kg). So, this simulation model enables precisely predicting the outputs of the copper electrolysis process when the inputs of the electrolysis cell system changes. Following the simulation model, by supplying suitable available input data, this model could be completely modified to apply for similar electrowinning processes.
Supplementary Information
Supporting Information is available at https://doi.org/10.33961/jecst.2021.00815
Acknowledgements
This research was funded by the Hanoi University of Science and Technology (HUST) under project number T2020-TT-008.