Electrochemical Impedance Spectroscopy (EIS) Performance Analysis and Challenges in Fuel Cell Applications
Article information
Abstract
Electrochemical impedance spectroscopy (EIS) is a unique non-destructive technique employed to analyze various devices in different energy storage applications. It characterizes materials and interfaces for their properties in heterogeneous systems employing equivalent circuits as models. So far, it has been used to analyze the performance of various photovoltaic cells, fuel cells, batteries, and other energy storage devices, through equivalent circuit designing. This review highlights the diverse applications of EIS in fuel cells and specific parameters affecting its performance. A particular emphasis has been laid on the challenges faced by this technique and their possible solutions.
1. Introduction
The current research on developing efficient energy resources has drawn much interest because of diminishing conventional energy resources (coal and petroleum) and their adverse effects on the environment. Due to environmental degradation and energy problems, a global drive to produce sustainable energy harvesting and storage materials has started. In order to develop clean, environment-friendly, highly efficient, self-sustaining, recyclable, and long service life devices, researchers all around the globe have put dedicated efforts [1]. The most effective methodology for evaluating the performance of energy materials is electrochemical characterization [2]. An electrochemical analyzer is a device that enables electrochemical characterization procedures such as electrochemical impedance spectroscopy (EIS), galvanostatic charge-discharge (GCD), and cyclic voltammetry (CV) [3,4]. To acquire the electrical response of an electrolytic solution, an electrochemical cell is employed to host the chemical process and is electrically coupled to the electrochemical spectrometer. Computer programs particularly tailored for EIS testing are used to operate EIS systems. As a result, all system components must be obtained before starting an EIS experiment. A known voltage is transmitted from the working electrode to the counter electrode through an electrolytic solution using a three-electrode setup consisting of working, reference, and counter electrodes. The EIS generates quantitative data that allow for the analysis of small-scale chemical processes at the electrode interface and inside the electrolytic solution. As a result, EIS may be used to determine various dielectric and electrical characteristics of components in fuel cells [5].
Electrochemical Impedance Spectroscopy (EIS) is an electrochemical method for measuring a system’s impedance concerning the frequency of an alternating current (ac) potential [6]. EIS is used for identifying the electrochemical cell’s impedance [7]. Impedance may be determined by applying a small amplitude sinusoidal (ac) voltage to the electrode arrangement, generating a current wherein amplitude and phase angle are evaluated for the provided sinusoidal voltage. After that, the impedance is calculated employing Ohm’s law. The latter serves as the basis for the EIS experiment. Studying the various frequency ranges is necessary to create an impedance spectrum as impedance depends on frequency [8].
One of the most challenging approaches in electrochemistry is EIS. Over the past decade, EIS has received much interest. It is widely popular for a range of factors. One is that it allows you to separate the effect of various components, such as electron transfer resistance, double layer capacity, and so on. Another advantage of EIS is that it is highly surface sensitive, allowing it to detect numerous changes that other methods overlook, such as variations in polymer layers because of swelling, surface changes owing to protein adsorption, or corrosion protective layer penetration. As a result, EIS is useful in analytical electrochemistry since it allows molecules to be recognized without using a redox-active marker. In a direct current (dc) system, resistance is the ratio of voltage to current, whereas, in an ac system, impedance is the ratio of voltage to current. Because of the wave nature, the impedance must be defined using two components. The total impedance Z is one, while the phase shift Φ is the other [6]. EIS is an often-used technique for characterizing the electrodes in energy storage applications. EIS’s efficacy originates from its capacity to discriminate between numerous interfaces (electrolyte/solid, solid/solid) inside materials depending on their response to a controlled potential and the consequent decoupling of capacitive and resistive circuit elements [9].
Systems featuring Equivalent Electrical Circuit (EEC) elements, in which spectra are expressed as combinations of circuit components like resistors, capacitors, and inductors, have historically been used to interpret EIS data. These components then determine the system’s physical processes, for instance, charge transfer resistance (Rct), double layer capacitance (Cdl), so on [10]. Although this strategy may be suitable for basic circuits, it is not suitable for complex systems like reaction mechanisms. Other components, not analogous to electrical circuits, have been utilized to depict EIS behavior not represented by the three. These other components are Warburg Impedance and constant phase element [8].
Diffusion creates an impedance called a Warburg impedance. The impedance depends on the frequency of the potential perturbation. The Warburg impedance is small at high frequencies since diffusing reactants don’t have to move very far. The reactants have to diffuse farther at low frequencies, increasing the Warburg-impedance. The equation for the “infinite” Warburg impedance is depicted in Table 1. This form of the Warburg impedance is only valid if the diffusion layer has an infinite thickness. Quite often, however, this is not the case. If the diffusion layer is bounded (as in thin-layer cell or coated samples), the impedance at lower frequencies is no longer infinite [11]. Diffusion seems semi-infinite in “traditional” electrochemical setups because the timeframe of the experiment is not long enough for the system to establish a steady-state. Diffusion is, however, naturally or by design restricted in many existing systems and several classic experiments. Instead, we get a general equation known as “finite” Warburg. There are two important equivalent circuit elements for finite diffusion. They are the finite length Warburg (FLW) and the finite space Warburg (FSW), sometimes called the “short” and “open” Warburg elements, respectively.

The impedance, admittance, and phase angle values for different elements of EIS used in energy applications.
The impedance of the FLW tends to the value of Z0 at low frequency. The response is almost exactly that of the Warburg impedance (FLW) at high frequencies. It can be thought of as a Warburg being “shorted” by a resistor, although a parallel W-R circuit will not give the same response. It can be thought of as a Warburg being “shorted” by a resistor - although a parallel W-R circuit will not give the same response. Whereas at low frequencies, the response tends towards capacitive-like behavior. This response is typically associated with diffusion where one of the boundaries is blocking, such as in a porous electrode. This response is also associated with the diffusion of ions within a storage electrode, such as in lithium-ion batteries [12]. Hence, there are five essential elements used for describing the behavior of impedance in EIS: ohmic resistance (R), capacitance (C), inductance (L), constant phase element (Q), and Warburg impedance (W). These elements, along with their symbols and their impedance value (Z), admittance value (Y = Z−1), and phase angle (ϕ), used in various energy applications, are summarised in Table 1.
In this Table 1, R is resistance in ohms (Ω), C is capacitance in Farads (F), and L is inductance in Henry (H). Note that j = √−1, contrary to the IUPAC convention, is not to be confused with the current. Yo (= 1/Warburg coefficient (σ)√2) is a parameter related to the admittance (Y = Z−1), ω is the angular frequency in hertz (Hz), τ reflect the properties of the system or the process giving rise to the finite Warburg impedance behavior, and α is a coefficient between 0 and 1.
Different redox reactions are studied using EIS. It enables the monitoring of redox reactions on the electrode surface in response to the applied voltage. The information regarding the charge transfer scheme, charge diffusion methods, the doubly-charged layer, and the bulk layer can be obtained using EIS [15]. EIS is a non-destructive approach for characterizing materials and interfaces that assess the electrical characteristics of heterogeneous devices with equivalent circuit designs [16].
This review highlights the versatile nature of EIS used in fuel cell applications. The factors affecting the performance of EIS have been emphasized, apart from highlighting the associated challenges and their possible solutions.
2. EIS for Fuel Cell Applications
A fuel cell is a high-efficiency energy conversion device that transforms chemical energy to electrical energy directly. Many parameters influence the power output of a fuel cell, including electrical load, internal resistance, operating temperature, fuel flow rate, and reaction kinetics [17,18]. For testing and diagnosing fuel cells, a variety of procedures have been developed, each with its own set of benefits and drawbacks. These include current interruption, chronopotentiometry, chronoamperometry, polarization curve, electrochemical impedance spectroscopy and cyclic voltammetry. Using a suitable equivalent circuit model, EIS offers information on all resistive, capacitive, and inductive contributors in a short amount of time [19]. The other approaches, on the other hand, are unable to distinguish between the distinct components of total internal resistance, and measurement is influenced to varying degrees by non-faradaic components (double layer charging of the electrode/electrolyte interface).
Mass transfer resistance, double layer capacitance, charge transfer resistance, electrolyte resistance, electrode resistance, and other ohmic losses all contribute to the overall internal resistance of a fuel cell [20]. Identification and mitigation of these distinct components are required to improve the operation of fuel cells and draw maximum power [21]. There is no one approach that can be used to reduce these sources of total internal resistance. Individual contributor separation aids in boosting fuel cell efficiency by aiding in the optimization of cell fabrication procedures, membrane thickness, and catalyst loading [22].
A low alternating current (AC) is used to test the impedance of a circuit element, and the related potential is monitored as a function of frequency. The capacitance of optimally polarizable electrodes and alternating current polarography were determined using the initial impedance measurement [23,24]. The following equations represent the current and its related potential:
EIS can be carried out with two- or three-electrode systems, with the three-electrode system assessing electrochemical reactions at one electrode, with one electrode (anode/cathode) acting as the working electrode and the other as the counter electrode, and measurements being made against the reference electrode. For the evaluation of the performance of a fuel cell, a two-electrode setup is employed, with one electrode acting as the working electrode and the other as the counter electrode. In an electrochemical reaction, the current flowing at an electrified contact has both faradic and non-faradaic components. The electron transfer process produces faradic current, while double layer capacitance produces non-faradaic current. The key Faradaic components are polarization resistance, mass transfer resistance, charge transfer resistance and solution resistance.
The original model of a fuel cell was proposed by Larminie and Dicks [25] as shown in Fig. 1.
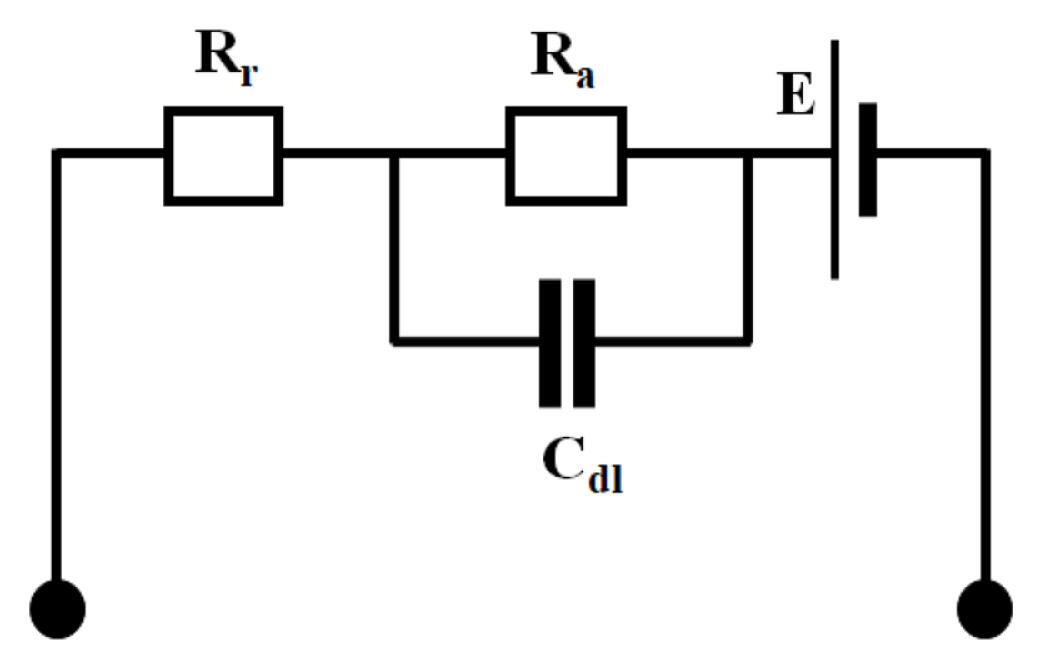
This electron circuit model (ECM) consists of a charge double layer represented by an electrical capacitor, the capacitance of which is provided by the formula Cdl = ɛ (A/d), where ɛ is the electrical permittivity, A is the surface area, and d is the plate spacing. In this scenario, A is the electrode’s true surface area and it is several thousands of times larger than its length and width product. In addition, d, the separation, is very infinitesimal, generally a few nanometres. As a result, the capacitance in certain fuel cells will be of the order of a few Farads, which is high in terms of capacitance values.
The link between this capacitance, the charge stored in it and the ensuing activation overvoltage results in the equivalent circuit seen in Fig. 1. The ohmic losses are represented by the resistor Rr. When the current changes, the voltage drop across this resistor changes immediately. The resistor Ra simulates activation overvoltage, while the capacitor smoothes any voltage-drop across this resistance. A concentration overvoltage would also be included into this resistor. In general, the impact of the charge double layer capacitance offers the fuel cell an excellent dynamic behaviour in that the voltage goes gradually and continuously to a new value in response to variations in current demand. It also enables a feasible and reliable method of distinguishing between the various forms of voltage drop and, as a result, analyzing the operation of a fuel cell. This model is simple and devoid of sophisticated circuit parts. These characteristics of the model make this ECM the most successful and extensively utilized research approaches.
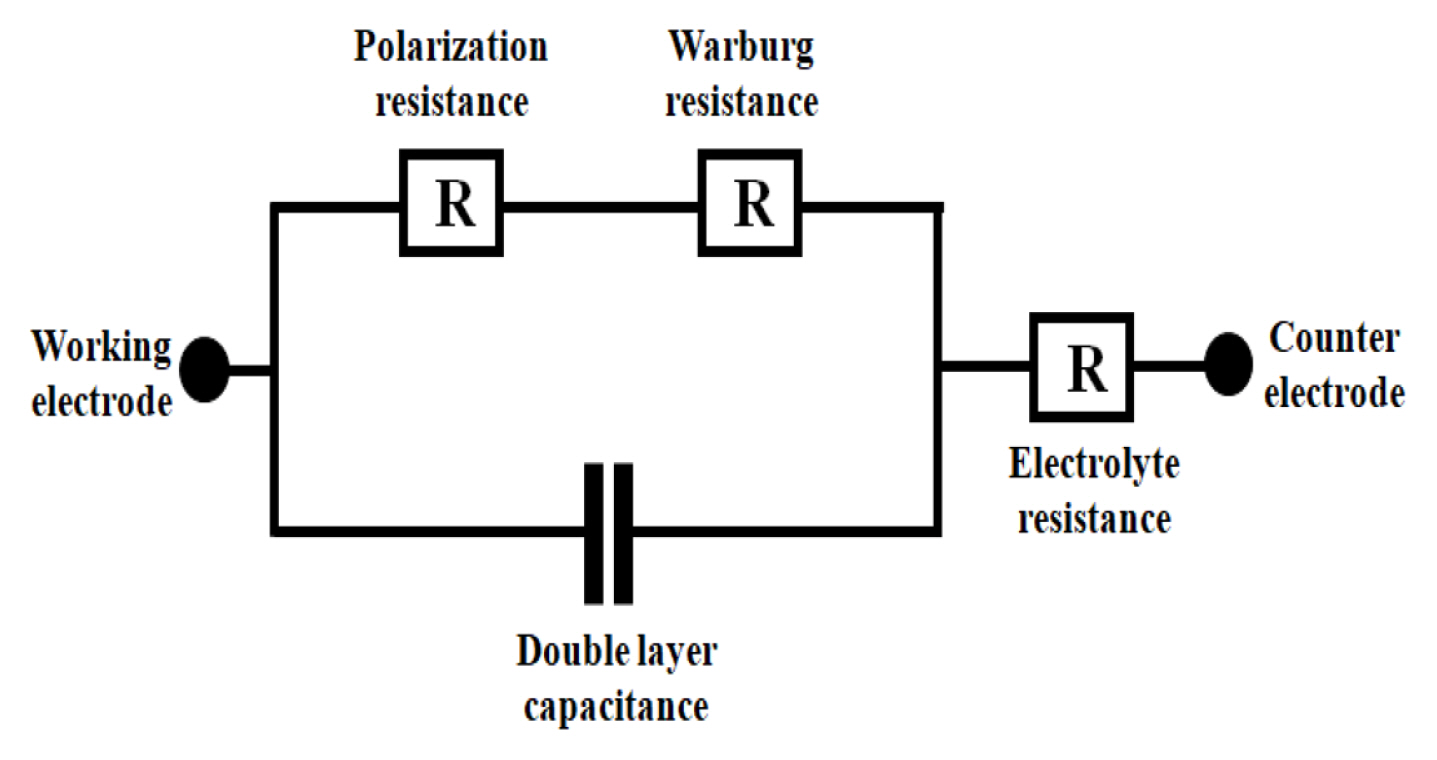
Fig. 2 depicts the Randles equivalent circuit model [26] of an electrode/electrolyte interface in a fuel cell.
Equation (4) represents the resistance of Randles circuit mathematically.
Here, ω = 2πf, f is frequency and j is
When-Z″ (ω) is plotted against Z′ (ω), the above equation depicts a semicircle with diameter equal to polarization resistance i.e., Rp. The ohmic resistance, Rs is determined by the high frequency intercept of the semicircle while the sum of ohmic and polarization resistance (Rs + Rp) signifies the low frequency intercept on the Z′ (ω) axis. The resistance of Randles circuit is graphically shown in Fig. 3.

Illustration of impedance spectra.
Equation (6) relates the Warburg impedance to σ.
Impedance spectra have been represented using several approaches such as fast Fourier transform, frequency response analyser, phase sensitive detection, and Lissajous curves [27–31]. Out of these techniques, the frequency response analyser is the most often used approach for determining a system’s impedance. In this method, a low sine wave (5–15 mV) of a certain frequency is superimposed over a specified direct current to the working electrode, and the resultant current is monitored as a function of frequency. However, this approach is only suitable to stable and linear systems, and scanning the entire spectrum takes a long time. A novel approach known as ‘first generation Fourier transform EIS’ was developed in order to shorten measuring time. This approach involves mixing of AC signals of varying frequency, and the impedance was determined by applying Fourier transform to the output signal. This approach was later improved to investigate diverse electrochemical processes, such as metal corrosion, and was renamed second generation Fourier transform EIS [32–35]. Here, the resultant chronoamperometry current is recorded using a tiny step signal, integral form of Dirac delta function, formed by combining AC voltage of different frequencies delivered at a specified direct current (DC) voltage. The output voltage and current signal is deconvolved into the frequency domain, and impedance is calculated by dividing voltage by current at all frequencies. Additionally, by merging first-generation Fourier transform EIS (seven frequencies ranging from 60 to 997 Hz) with CV, the dynamic EIS was established [36,37]. Potentio-dynamic EIS (PDEIS) is a method that was further created to explore the quasi-reversible redox system and capacitance calculations of TiO2 films [38,39].
For fuel cells, the EIS technique helps in several purposes, including investigating internal processes, aiding in mechanism studies, and diagnosing faults via spectrum variations [40]. The internal polarization process can be very well clarified by EIS compared to other techniques [41]. For large-scale PEM fuel cells, EIS successfully investigated inconsistent particulars and mechanisms between normal and faulty PEM fuel cells [42]. In addition to single cells, EIS has helped in the analysis of the performance of fuel cell stacks [43] and for investigating the fault characterization in commercial stacks [44]. EIS upon combination with Long Short-Term Memory (LSTM) neural networks helps in prediction of the degradation of fuel cells [45]. Apart from this, information regarding the additional sensitivity of fuel cells for differentiating catalyst layer degradation has also been provided by EIS [46]. EIS provides a better understanding of charge transfer resistance and mass transfer between electrodes in biofuel cells [47,48].
3. Factors Affecting EIS
3.1 Effect of electrode material
The electrode is polarized; when potential applied to the electrode differs from equilibrium potential, the magnitude of this value is termed over potential. The polarization resistance of the electrode can be lowered by utilizing a highly conductive electrode. Traditional carbon-based electrodes such as graphite felts, graphite rods, and carbon cloth outperform metals in performance, delivering more power. Ahmed et al. [49] investigated the effect of electrode geometry on EIS. They discovered that as the active area of the electrode increased in the electrolyte, the impedance, as well as resistance (real part) and capacitive reactance (imaginary part), dropped. The high-frequency region is autonomous to the surface area. In the intermediate region, the phase angle reduces with the increasing area, but in the low-frequency region, the phase angle increases. The minimum phase angle gets reduced for copper and brass as the area increases. Ariyoshi et al. [50] employed EIS to investigate the influence of particle size of Li[Li0.1Mn1.9]O4 (LMO) on the charge transfer resistance (Rct). They discovered that tiny particles exhibit low Rct.
The anode polarization resistance has major contribution in the internal resistance of the microbial fuel cell. Development of biofilm on the anode surface considerably reduces the anode charge transfer resistance signifying their catalytic role in the transfer of electron to the anode. Manohar et al. [51] employed EIS technique for evaluating the electrochemical performance of the microbial fuel cell harboring S. oneidensis MR-I where the anode polarization resistance shows a reduction from 7790 kω to 10.2 kω as a result of the formation of bacterial biofilm on the anode in comparison to the control microbial fuel cell without the bacteria.
Further, the type of cathode material highly influenced the stability, cost as well as electrochemical feasibility for scaling up of the microbial fuel cell especially in the case of air cathode microbial fuel cell. The different cathode material imparts different activation resistances for the oxygen reduction reaction that can be quantitatively recorded via their EIS response. Martin et al. [52] compared various cathode materials including Pt, Fe2O3, Mn2O3 and carbon to scrutinize better oxygen reduction reaction in the air-cathode microbial fuel cell. The EIS results revealed that the charge transfer resistance of the cathode for the materials tested are 4.4 ω, 3.6 ω, 4.1 ω and 18.1 ω, respectively.
3.2 Effect of electrolyte pH value and binding agent
Usually, Bode plots demonstrate a steady rise in the absolute value of impedance at low to medium frequencies as pH increases. The pH of the electrolyte used in the microbial fuel cell greatly influences the power output of the system. The electrolyte pH affects the bacterial growth on the anode compartment and most of the bacteria grow well at neutral pH of 7. By employing EIS, He et al. [53] scrutinized the influence of electrolyte pH (5 to 10) on the anodic and cathodic reaction rates in microbial fuel cell. They discovered that the anode polarization resistance reduced as pH rose from 5 to 7. For pH 8 to 10, an increase in anode polarisation resistance was observed. Increased pH enhanced the cathodic process while decreasing polarisation resistance over the whole pH range. According to Djoko et al. [54], stainless steel SS 304 in nanofluid shows a larger impedance at a large pH.
The performance of a fuel cell is highly effected by the method of assembling the membrane and the electrode. Nafion solution, perfluorinated ion-exchange solution is usually employed as a binding agent for connecting the Pt particle, membrane and the carbon electrode [55,56]. EIS was used by Huang et al. [57] for investigating the properties of microbial fuel cell with and without Nafion as cathode binding agent and observed that the power output of the microbial fuel cell without Nafion was higher in comparison to that with Nafion. This was also observed in the EIS results of the both the devices. The Bode plot demonstrates that the impedance of cathode with Nafion (NC) was higher than that of without Nafion (WC) for both the investigated exposure times. It was also concluded that the impedance of cathode for both NC and WC get reduced with exposure time owing to enhanced porosity of the surface layers covering the cathode materials.
3.3 Effect of mediators
By including mediators into electrolytes, Rct is decreased, and the electron transport kinetics from the substrate to the anode are accelerated. EIS has been successfully exploited to analyze the response of such mediators on charge transfer resistance. Bio-electrochemical and charge transfer reactions result in high impedance and are usually obtained from mid to high-frequency regions in Nyquist plot [58].
Ramasamy et al. [59] detected a response in the EIS’s mid-frequency region due to the Rct of endogenously prepared mediators. The obtained Rct was low due to their poor concentration in anolyte. They found a reduction in the magnitude of the low-frequency region after adding 5 μM riboflavin to the anolyte. Moreover, it was observed that the addition of riboflavin lowered Rct for substrate oxidation. Li et al. [60] activated bulk lithium sulphide using lithium thiophosphate (LPS) as an electrochemically “switched-on” functional redox mediator-generator. At first, interfacial resistance is more significant in cells containing LPS. Following initial activation, the LPS-carrying electrode’s interfacial resistance decreases dramatically than the pure 60% Li2S electrode. Additionally, Rct is initially larger for electrodes containing LPS but is overtaken by pure Li2S electrodes near the termination of the charging period.
3.4 Effect of separator
The separators are usually employed to avoid the electrodes from coming in contact with each other, short-circuiting, and electrolytes getting mixed up. The anion or cation exchange membranes serve as separators to avoid the diffusion of oxygen into the anode chamber and boost the movement of only protons across it to the cathode. Separators decrease the power density by enhancing the internal resistance and generating pH gradients between the positive and negative electrodes. Wei et al. [61] employed impedance spectroscopy to scrutinize the influence of the separator on the performance of air-cathode microbial fuel cells. It has been observed that at a cathode potential of 0.3 V, the average total resistance gets improved by 36% for 5 mM phosphate buffer solution by using a single separator and the total resistance was also 3–5 times greater for the system with four separators in comparison to without separator. The diffusion resistance is the main contributing factor for the variation in internal resistances with only small changes in the solution resistance and the charge transfer resistance, suggesting that the utilization of separators hindered ion transport from the bulk to the cathode resulting in mass transport limitations.
3.5 Effect of experimental conditions
In addition to the above mentioned factors, there are also some other parameters that shows contribution in EIS analysis. EIS also depends on the ion concentration in the electrolyte, separation between electrodes, the rotation of the electrodes, and the magnetic field. The solution resistance is an important contributor to total resistance that determines the power output in fuel cells. The more ions in an electrolyte, the lesser is the electrolyte resistance. Manohar et al. [51] reported that the solution and membrane resistance is the dominant factor that constitutes 95% of total internal resistance. The electrolyte resistance also depends on the separation between electrodes; a shorter distance between electrodes provides smaller ion diffusion length and lower electrolyte resistance [62].
The rotating electrodes enhance ion transport and dissolved oxygen content, resulting in a reduced ohmic resistance. According to Cheng et al. [63], when the magnetic field is increased, the ohmic resistance decreases due to higher mobility of ions in the electrolyte, which increases conductivity and accelerates the charge transfer.
4. Challenges in EIS and their possible solutions
EIS is an effective electrochemical technique for investigating electrochemical systems, including fuel cells. However, practically, it only is applied to simple electrochemical systems. If a model becomes complex enough, it may fit every impedance, or multiple complex models can fit an impedance spectrum well. Therefore, equivalent-circuit simulation alone may lead to inaccurate conclusions. On the other hand, almost all the electrodes used in energy systems are porous, the relaxation time is rather long, and the impedance should only be done when the system is at its stable or even equilibrium state; otherwise, the obtained spectrum could be misleading. Some of the challenges associated with EIS analysis are shown in Fig. 4.
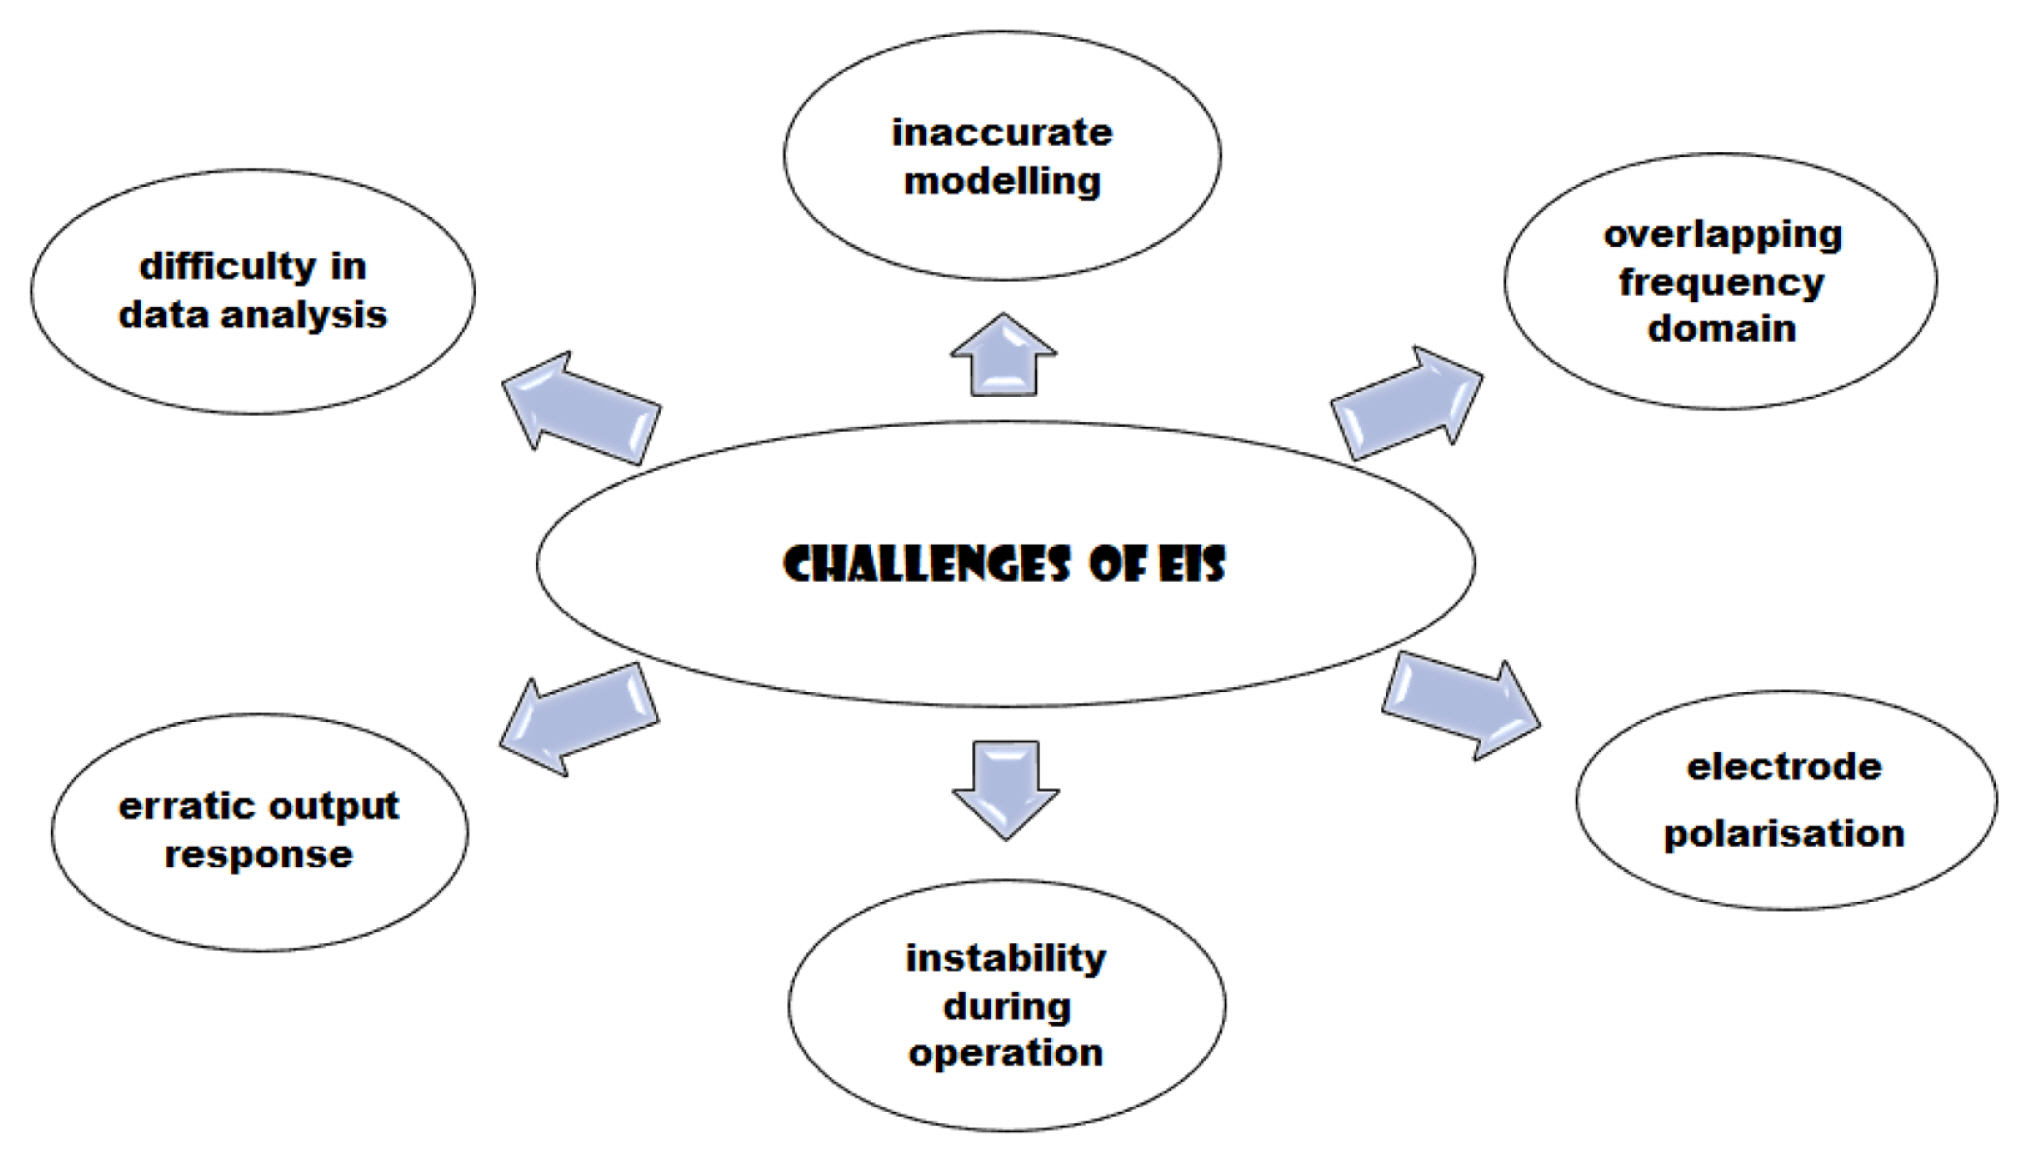
Challenges associated with EIS.
The interpretation of the EIS data grew progressively complicated due to overlapping frequencies and noise caused by the heterogeneous sample. Typical EIS analysis methods may produce extremely erratic output responses when used in a non-steady state system. Due to the longer period required to measure an EIS spectrum, it is challenging to maintain a steady state throughout its operation. The cell can vary due to the adsorption of solution contaminants, the development of an oxide layer, the accumulation of reactants in solution, the deterioration of the coating, or temperature variations leading to instability during operation [11].
The primary limitations of EIS are the technical issues of the apparatus data processing through accurate and straightforward modeling. The analysis of large amounts of EIS data is a tedious task. An apt ECM for the data must be used, such that its parameters fit in each spectrum. Fitting is difficult. It requires optimization for which the characteristic optimization algorithms depend on the initial point and are likely to show divergence [64,65]. Electrode polarization is yet another issue in EIS. The mobile ions in conductive systems move near the electrode interface under the applied electric field, resulting in ionic double layers. These layers of ions generate capacitive impedance, leading to voltage drops. This phenomenon is known as electrode polarization. The resultant spectra of electrode polarisation overlap the relaxation procedure, affecting the data interpretation. Different models describing electrochemical double layer utilizing equivalent circuits and configuration compensations of the measuring device are considered to deal with the electrode polarization. Nevertheless, electrode polarization is dependent on the structure and materials of the electrode, the measuring temperature, the sample impedance, and the roughness of the electrode surface [66].
There are some approaches to improve the accuracy and applicability of EIS in fuel cell applications. The measurement, interpretation, and simulation of an impedance spectrum are based on the assumption that the target system is linear and stationary. Specifically, the reliable analysis of an impedance spectrum requires four conditions: causality, linearity, stability, and finiteness. The non-compliance with the conditions could lead to misguided results, and even a small measurement noise can lead to the inaccurate assignment of electrochemical processes, misinter-pretations in modeling, and wrongful parameters. A Kramers–Kronig (K–K) relationship was used to vindicate the validity of the impedance data to make sure that non-linear, time-dependent phenomena do not influence the impedance spectrum. Direct integration of the K–K equations allows calculation of the real part of the impedance from the imaginary part and vice versa. The K–K relations require integration over the frequency range from zero to infinity, so extrapolation to zero and infinite frequency needs to be performed since practically the data points can only cover a finite frequency range [67].
Another approach to overcoming the complexity of EIS modeling is deconvoluting the electrochemical impedance to corresponding electrochemical processes and building a relatively simpler equivalent circuit for each process according to the nature of the process, e.g., charge transfer or mass diffusion. The idea of deconvolution of an electrochemical impedance is based on the fact that the impedance of an electrochemical system can be interpreted as a fundamental “generalized” impedance model, which consists of a continuous distribution of RC elements in the space of relaxation times. The distribution of relaxation times (DRT) method was first used in solid oxide fuel cells to understand the polarization losses through the deconvolution of the impedance data in the space of DRT [68]. Then it was used in Li-ion and other electrochemical systems [69,70]. The DRT method offers high resolution in the frequency domain; therefore, the respective polarization loss processes with different time constants can be separated according to the attributed DRT.
5. Conclusions and Future outlook
To conclude, EIS is an excellent procedure that finds applications in fuel cell. It helps in characterizing materials for their potential in this field. Specific parameters control its charge transfer impedance and output power, such as electrode material, experimental conditions, pH of electrolyte, and mediators. The technical accuracy of the instrument, stability, operating processes, and data interpretation utilizing a simplified fitting model are the primary challenges of EIS.
In summary, the significance of EIS must be appreciated in order to fully use its potential functions. And, when utilised correctly, EIS may be a powerful tool for gaining a deeper understanding of fuel cell electrochemical energy storage systems. In terms of EIS diagnostics geared toward cost-competitive and suitably durable fuel cells, accomplishments and obstacles coexist, and more development is required.


