Electrochemical Desalination of a 50% w/w Sodium Hydroxide Solution, a Pharmaceutical Sterilization Agent
Article information
Abstract
Sodium hydroxide solutions are often employed as sterilization agents in the pharmaceutical industry. Here, the chloride content is considered as a critical impurity. In this study, an electrochemical method was developed to remove chloride ions (Cl−) through the oxidative deposition of AgCl on a Ag anode. The Cl− content in the commercially available 50% w/w NaOH solution employed was approximately 100 mg Cl−/kg NaOH. As the OH− content is approximately 18,000 times higher than the Cl− content, the formation of AgCl may be expected to be thermodynamically less favorable than the formation of Ag2O. However, activation energies for AgCl and Ag2O formation have been reported to be approximately 3.8 and 31.2 kJ/mol, respectively, and indicate that AgCl formation is favored. AgCl can be selectively produced by controlling the anode potential. Here, the Cl− concentration was reduced to less than 50 mg Cl−/kg NaOH when an anode potential of 0.18 or 0.19 V vs. Hg/HgO (reference electrode) was applied for one hour at 50°C. XRD analysis and visual monitoring of the Ag anode confirmed the oxidative deposition of AgCl on the anode surface as well as the electrochemical desalination of the concentrated NaOH solution.
1. Introduction
Sodium hydroxide (NaOH) is often employed as a sterilization agent in the pharmaceutical industry, particularly for processes in which steam sterilization is not possible [1]. Considering that chloride (Cl−) may contribute to corrosion in drug production facilities, it is considered as a critical impurity in NaOH [2,3]. As NaOH solutions are typically produced from sodium chloride (NaCl) solutions through a chloro-alkali process [4], the development of a process to selectively remove Cl− from the NaOH solutions is critical. Thus far, adsorption [5], precipitation [6], and electrodialysis [7] processes have been employed for this purpose. Commercially available 50% w/w NaOH solutions contain approximately 100 ppm Cl− (i.e., 100 mg Cl−/kg NaOH). This significantly low abundance of Cl− compared to that of OH− prohibits the preferential adsorption, precipitation, and electrodialysis of Cl− without a corresponding significant loss of OH−. Here, the highly viscous 50% w/w NaOH solution contributes to reduced adsorption efficiency [8,9] and hinders the removal of precipitates by slowing down the filtration process. Furthermore, anion-exchange resins required for the adsorptive removal of Cl− are expensive and need to be regenerated; thus, selectively removing Cl− from the 50% w/w NaOH solutions is challenging. Finally, with the precipitation approach, the addition of a precipitating agent increases the risk of introducing additional impurities to the NaOH solutions.
The purpose of this study was therefore to develop an electrochemical method to selectively remove Cl− from 50% w/w NaOH solutions through the oxidative deposition of Cl− on the surface of an anode. Here, candidate anodes would be a metal that is stable in NaOH solutions but can be oxidized to form insoluble chloride compounds when an external electric current is applied. Both Al and Zn are easily oxidized in NaOH solutions, resulting in the formation of hydroxo complexes (i.e., complexes containing a hydroxide ion as a ligand) [10,11]. Furthermore, copper and iron are oxidized during the application of an electric current, resulting in the formation of soluble chloride compounds (i.e., CuCl, CuCl2, FeCl2, and FeCl3) [12,13]. Ag was, however, found to be stable, with no evidence of corrosion when submerged in 50% w/w NaOH solution at 50°C for a period of 60 days. In addition, the silver chloride (AgCl) that is deposited on the Ag anode when an external electric current is applied is not converted to silver hydroxide (AgOH) and silver oxide (Ag2O). This can be attributed to the fact that the release of Cl− from AgCl is inhibited due to its electrostatic interaction with the positively charged anode [14]. Hence, Ag was selected as the candidate anode. The electrolytic cell used in this study is shown in Fig. 1. The following oxidation reaction is expected to occur at the Ag anode [15].
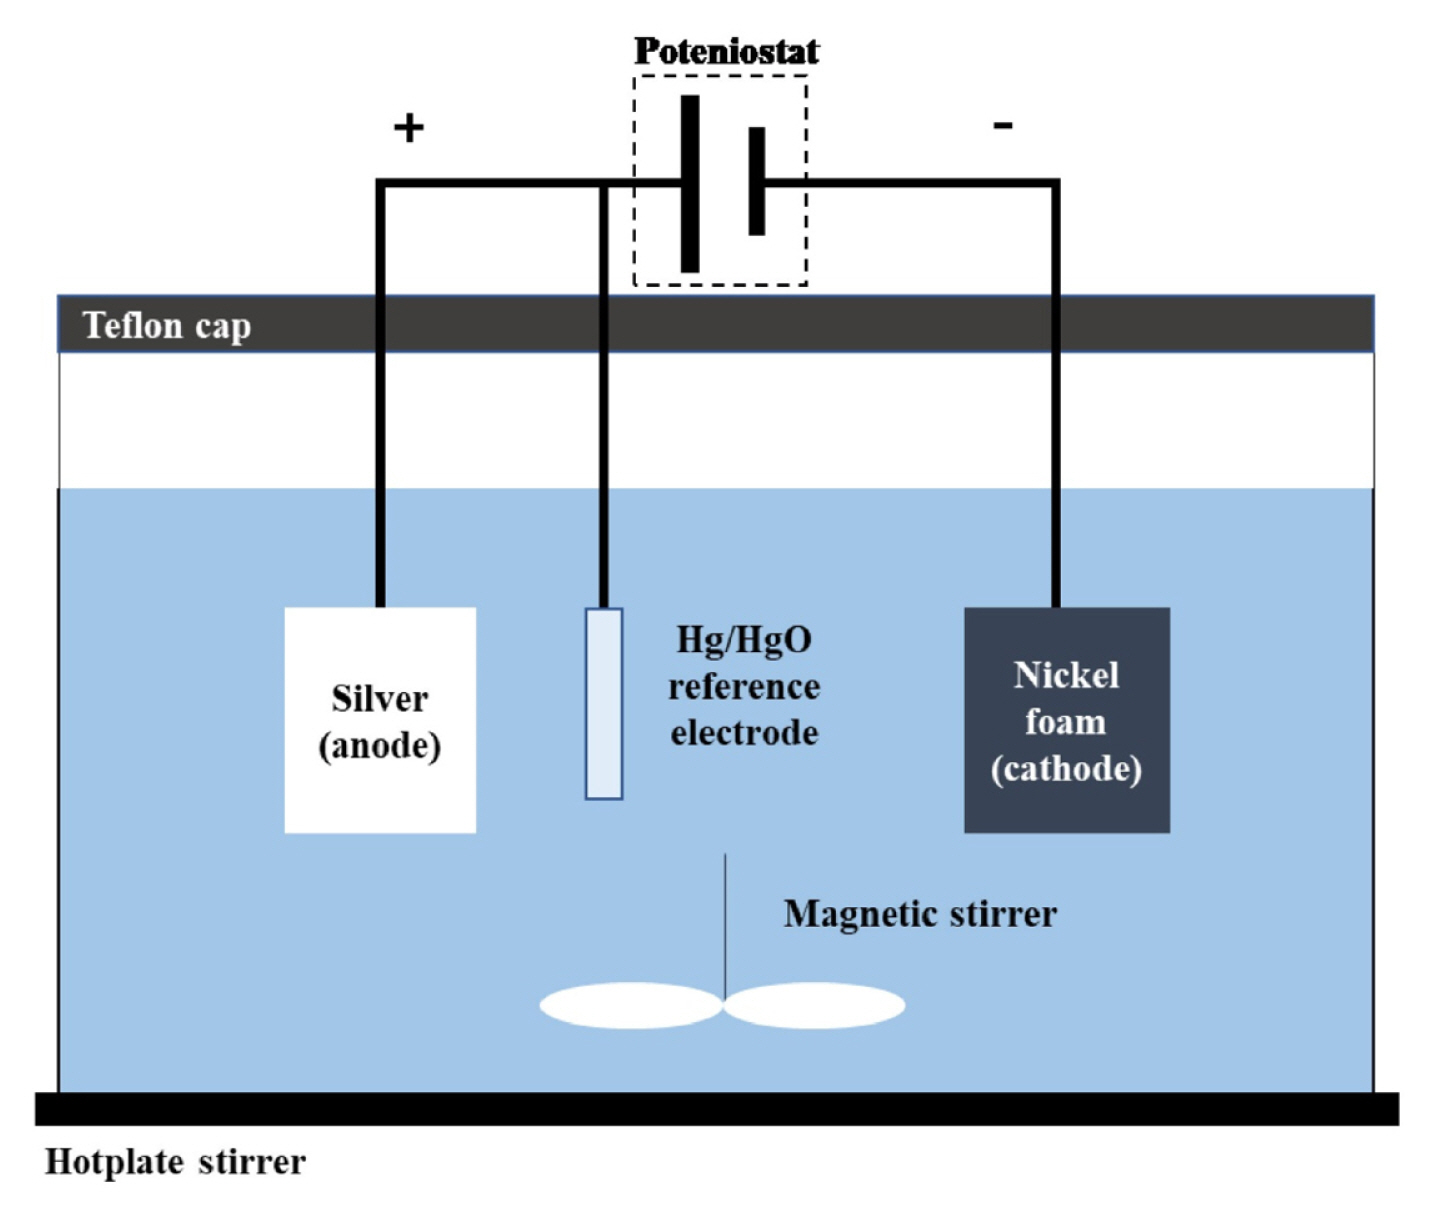
Schematic of the electrolytic cell.
The oxidation of Ag and subsequent reaction with hydroxide ions may lead to the formation of Ag2O according to the following reaction [16]:
Considering that the ratio of OH− to Cl− ions is approximately 18,000:1 in the commercially available 50% w/w NaOH solution (Cl− concentration equivalent to 100 mg Cl−/kg NaOH), reaction 1 may be considered thermodynamically less favorable than reaction 2 [17]. However, activation energies of 3.8 kJ/mol [15] and approximately 31.2 kJ/mol [16,18] have been reported for reactions 1 and 2, respectively. To promote reaction 1 relative to reaction 2, the voltage of the electrolytic cell was therefore varied, thereby achieving a kinetic control of the reactions [19,20] and the selective removal of chloride ions from the 50% w/w NaOH solutions.
2. Experimental
2.1 Electrolytic cell
A 100 mL cylindrical polypropylene cell containing three electrodes covered with a PTFE cap and electrode holders (Wizmac Co., Daejeon, South Korea) was employed as the electrolytic cell (see Fig. 1). A Ag plate (20 × 20 × 0.05 mm) with a purity of 99.9% (Daihan Scientific Co., Wonju, South Korea) was used as the anode, while the cathode consisted of a Ni foam (20 × 20 × 1.6 mm) with a purity of better than 99.5%, 110 pores per inch, and a density of 350 g/m2 (Invisible Inc., Seoul, South Korea). Here, the Ni foam was selected based on evidence of its previous successful application as an electrocatalyst for the hydrogen evolution reaction (HER) in alkaline solutions [21]. Hg/HgO (NaOH, 1 M) (Model RE-61AP, ALS. Co. Ltd., Tokyo, Japan) was employed as the reference electrode at 25°C and a potential of 0.14 V. A potentiostat (Model WPG100e, Wonatech, Seoul, South Korea) was connected to the electrolytic cell to control the cell potential, with specific focus on the anode potential vs. the reference electrode. Finally, 100 mL of the 50% w/w NaOH solution (Duksan Co., Ansan, South Korea) as well as a magnetic stirrer were added to the cell and placed on a hotplate stirrer (Model MSH-20D, Daihan Scientific Co.). The temperature of the cell solution was monitored with a digital thermometer (Model B-101, Benice Co., Pocheon, South Korea).
2.2 Cyclic voltammetry and Linear sweep voltammetry
Cyclic voltammetry (CV) and linear sweep voltammetry (LSV) were performed to identify the anode potential at which only reaction 1, the target reaction of this study, would occur. The scan rate, stirring rate, and temperature were maintained at 10 mV/s, 200 rpm, and 50 ± 1.3°C, respectively. The anode potential vs. Hg/HgO (reference electrode) was varied between zero and 0.2 V, as black-colored Ag2O particles [22] appeared at the anode when potentials higher than 0.2 V were applied. Here, both CV and LSV measurements was repeated three times.
2.3 Electro-formation of silver chloride
To determine the anode potential that would ensure the selective removal of chloride ions from the 50% w/w NaOH solution, a peak corresponding to the formation of AgCl first had to be identified in both CV and LSV. During evaluations, the stirring rate and temperature were maintained at 200 rpm and 50 ± 1.3°C, respectively. Three NaOH solution samples were further taken for analysis at each time interval. Here, the chloride concentration was determined employing ion chromatography (Easion IC, Dionex, CA, USA), while the NaOH concentration was determined following an acid/base titration with 1 N hydrochloric acid and phenolphthalein, as a titrant and indicator, respectively. Chloride-free deionized water was used whenever dilution of the samples was required. The formation of AgCl was confirmed through XRD analysis (Model SmartLab, Rigaku Corp. Tokyo, Japan) of the Ag anode. In addition, the color of the anode was monitored to identify the formation of white AgCl or black Ag2O during the process.
3. Results and Discussion
The reduction half-reactions corresponding to reactions 1 and 2 can be represented as follows:
According to the Nernst equation, the potential of the reduction half-reaction is dependent not only on its standard potential, but also on the activities of the species involved (e.g., Cl− and OH− in reactions 3 and 4, respectively). The potentials of reactions 3 and 4 can then be determined as follows:
where E0 (AgCl/Ag, Cl−) and E0 (Ag2O/Ag, OH−) are the standard potentials associated with reactions 3 and 4, respectively, R is the universal gas constant, T is the temperature in Kelvin, and F is Faraday’s constant. Based on previously reported values obtained at 25°C [23,24], the E0 (AgCl/Ag, Cl−) and E0 (Ag2O/Ag, OH−) values at 50°C were assumed to be 0.222 and 0.342 V, respectively. The activities of Ag, AgCl, and Ag2O (i.e., aAg(s), aAgCl(s), and aAg2O(s) in Eq. 5 and 6) were assumed to be 1. The chloride concentration in the 50% w/w NaOH solution was approximately 100 mg Cl−/kg NaOH, which is equivalent to 100 mg Cl−/kg water and therefore a molal concentration of approximately 2.82×10⁻³ mole Cl−/kg water. Although the activity coefficient associated with chloride ions in a 50% w/w NaOH solution has not previously been reported, it may be assumed the activity of chloride ion (i.e., aCl - (aq) in Eq. 5) would be less than 1. Petrenko and Pitzer [25] reported that the mean activity coefficient of NaOH (g±NaOH) increased with increasing NaOH concentration and was 14.28 at 24 mole NaOH/kg water and 50°C. As the concentration of NaOH in the 50% w/w NaOH solution was 25 mole NaOH/kg water, g±NaOH could therefore be assumed to be higher than 14.28. Finally, the activity of the OH− ion (i.e., aOH - (aq) in Eq. 6) must be higher than 357. Nickell et al. [26] suggested the following equation to determine the activity of water in a concentrated NaOH solution:
where m is the molal concentration of NaOH, and T is the temperature in Kelvin. Based on this calculation, the water activity in a 50% w/w NaOH solution at 50°C (i.e., aH2O(l) in Eq. 6) would be 0.0791. Furthermore, the potentials of reactions 3 and 4 (i.e., E3 and E4 in Eq. 5 and 6) at 50°C were higher than 0.222 V, and lower than 0.143 V, respectively. It may therefore be concluded that reaction 1 would be thermodynamically less favorable than reaction 2.
The rate constants of reactions 1 and 2 can be expressed according to the Arrhenius equation [27]:
where A is the pre-exponential factor, and Ea is the activation energy. Considering that the Ea values for reactions 1 and 2 are 3.8 kJ/mol and approximately 31.2 kJ/mol, respectively, the exponential term (i.e.,e−Ea/RT in Eq. 8) for reaction 1 at 50°C would be approximately 27,000 times higher than that for reaction 2. Thus, an appropriate anode potential would have to be determined at which both reactions would become thermodynamically feasible, while only providing sufficient energy to exceed the activation energy of reaction 1.
CV and LSV results are shown in Fig. 2 and 3, respectively. Because of the highly viscous nature of the 50% w/w NaOH solution, the experiments were performed at 50 1.3°C. Here, the first peak that was detected between 0.156 and 0.17 V indicated the formation of AgCl. At anode potentials higher than 0.2 V, peaks associated with the formation of Ag2O could be detected. This could further be confirmed through the observation of black Ag2O crystals at the anode surface. Here, a potential of 0.156 V vs. Hg/HgO corresponds to 0.296 V vs. the standard hydrogen electrode (SHE) as the Hg/HgO reference electrode used in this study has the potential of 0.14 V vs. SHE. The formation of AgCl began at 0.296 V (vs. SHE), which indicated that this potential was higher than E3 and E4 (in Eq. 5 and 6), which were estimated to be higher than 0.222 V, and lower than 0.143 V, respectively. It may therefore be concluded that reaction 1, which is thermodynamically less favorable than reaction 2, would be thermodynamically feasible at 0.156 V and higher potentials vs. Hg/HgO. The current fluctuation near 0.17 V (see Fig. 2) is believed to be due to the local heterogeneity of the anode surface caused by reaction 1. Based on the CV and LSV results, anode potentials of 0.17, 0.18, and 0.19 V were selected and tested for the selective formation of AgCl. The current flow measured at these anode potentials is shown in Fig. 4. Here, the current flow was not proportional to the supplied voltage. This was attributed to the additional electrical energy that was required to overcome the activation energy. The highest current was observed at 0.19 V, which indicated the highest rate of Cl− removal occurred at this potential. This corresponded to a 48.53 mg Cl−/kg NaOH reduction in the Cl− concentration (i.e., from 77.38 ± 0.73 to 28.85 ± 1.23 mg Cl−/kg NaOH) and could be achieved within an hour. In comparison, the Cl− concentration decreased by 33 mg Cl−/kg NaOH (i.e., from 77.38 ± 0.73 to 44.38 ± 1.29 mg Cl−/kg NaOH) within an hour at 0.18 V, while it decreased by 23.57 mg Cl−/kg NaOH (i.e., from 77.38 ± 0.73 to 53.81 ± 1.61 mg Cl−/kg NaOH) after 6 hours at 0.17 V. The highest rate of AgCl formation at 0.19 V is believed to have caused the difficulty in the temperature control, and thereby resulted in the current fluctuation.
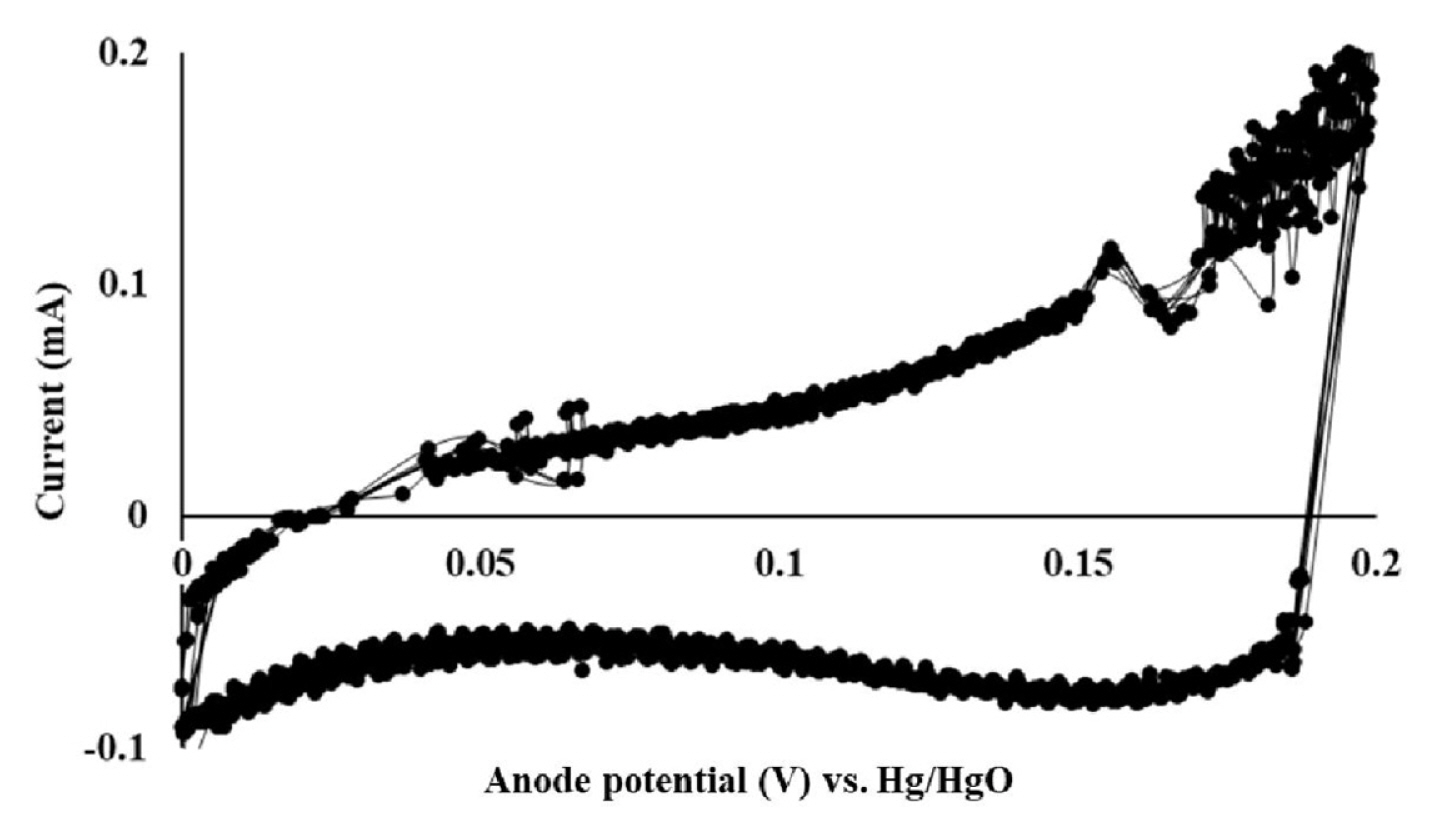
Cyclic voltammetry (CV) profile of the silver anode in the 50% w/w NaOH solution at 50°C. The anode potential was measured vs. Hg/HgO (reference electrode). CV was repeated over three cycles.
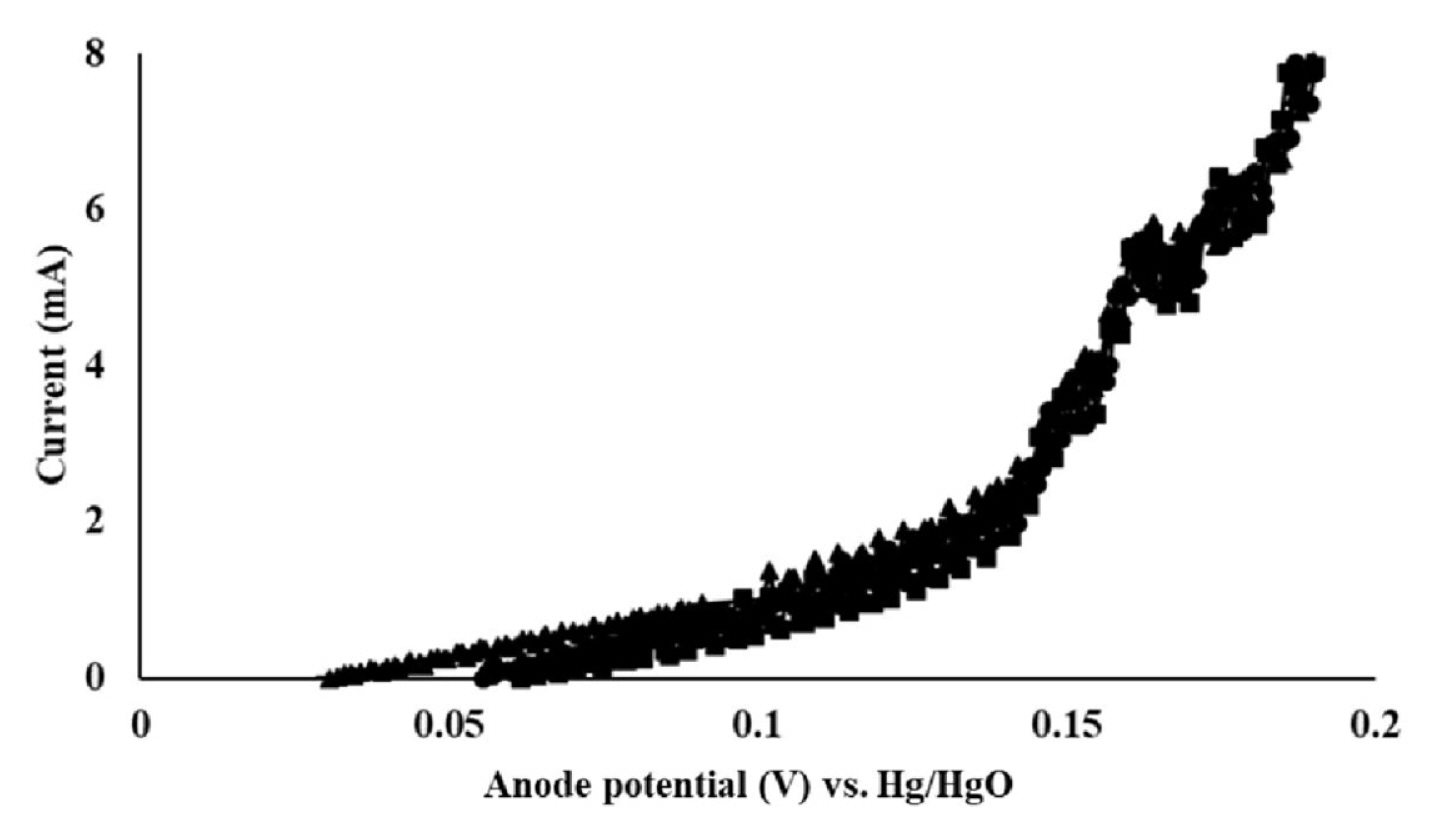
Linear sweep voltammetry (LSV) profile of the silver anode in 50% w/w sodium hydroxide solution at 50°C. The anode potential was measured vs. Hg/HgO (reference electrode). LSV was repeated three times.
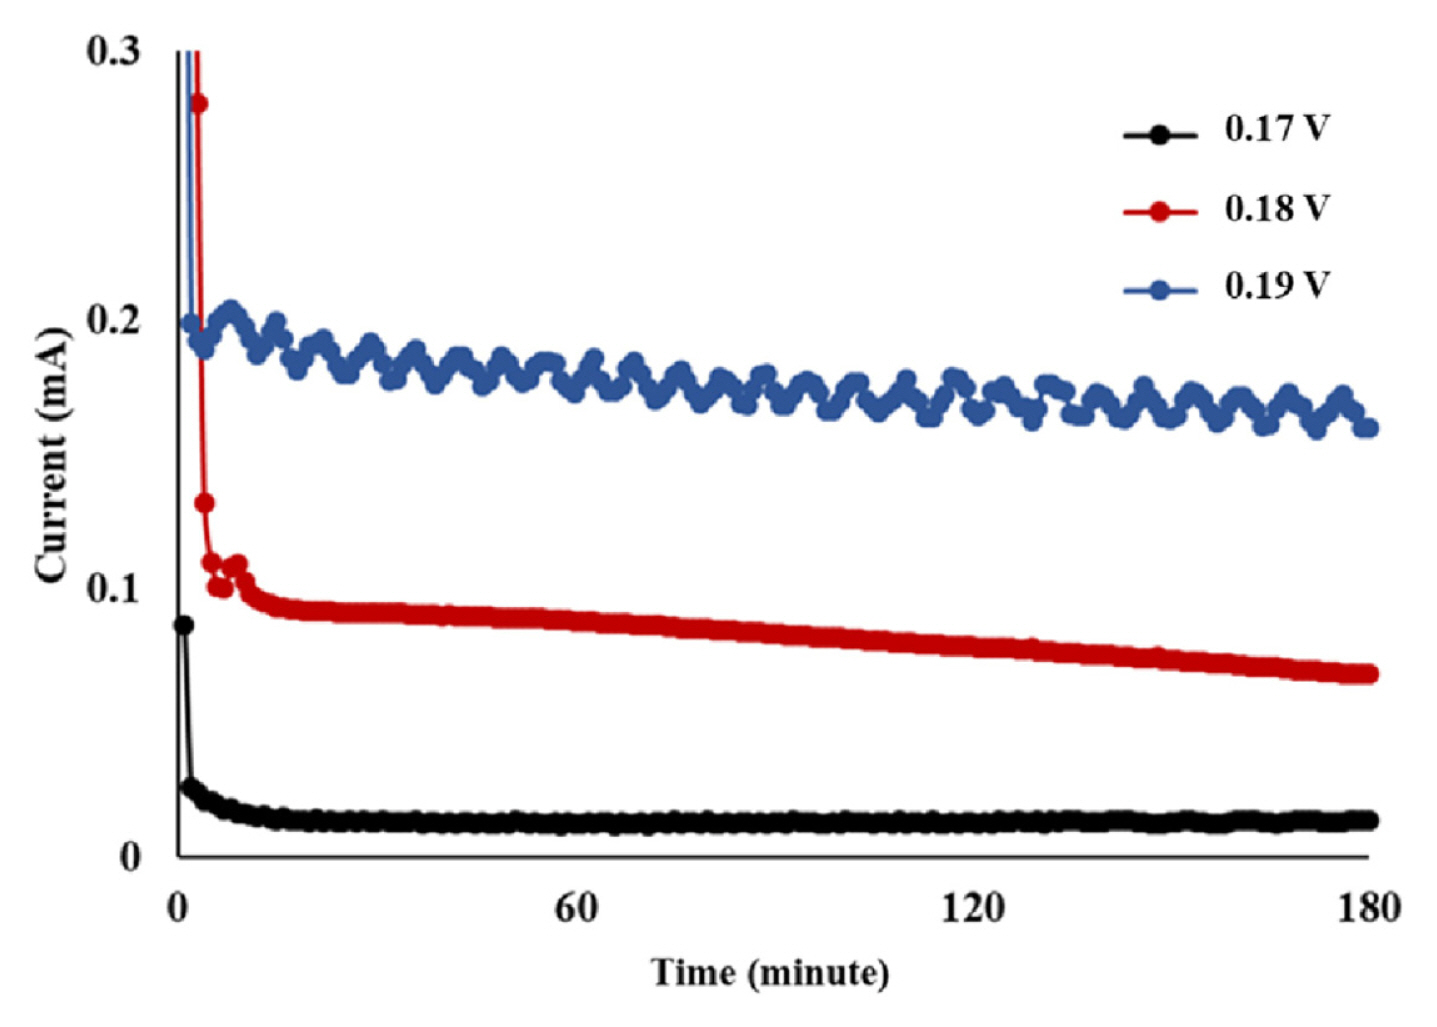
Current flow in the electrolysis cell at anode potentials of 0.17, 0.18, and 0.19 V monitored vs. Hg/HgO (reference electrode). Temperature was maintained at 50°C.
Fig. 5a and 5b show the color change observed at the Ag anode, before and after reacting at 0.18 V for one hour, respectively. Here, the deposition of AgCl on the anode resulted in the color of the anode changing from gray to white. When the anode potential was increased above 0.2 V (e.g., 0.3 V), reaction 2 was favored and black Ag2O particles appeared on the anode surface, as shown in Fig. 5c. To confirm the formation of AgCl on the anode surface, XRD analysis was performed on the Ag anodes before and after reacting at 0.18 V for one hour. These results are shown in Fig. 6. Here, XRD analysis of the anode after the reaction revealed four prominent peaks at 38.06°, 44.26°, 64.38°, and 77.34°, along with a small peak at 57.5° (see Fig. 6a). The small peak was further magnified, as shown in Fig. 6b. As the four main peaks identified in Fig. 6a were also present in the XRD spectrum of the Ag anode before the reaction, as shown in Fig. 6c, it could be concluded that these peaks corresponded to crystalline Ag [28]. The small peak observed at 57.5° was attributed to the AgCl peak previously observed at 57.49° [29]. For Ag2O, six XRD peaks have previously been observed at 26.7°, 32.8°, 38.1°, 54.9°, 65.4°, and 68.8° [30]. The absence of peaks at these angles confirmed that no Ag2O was formed when the anode potential was restricted to a range of 0.17 to 0.19 V at 50°C.

Photographs of the anode before (a), and after (b) one hour’s reaction at 0.18 V and 50°C. The silver anode was initially gray (a) but became white (b) due to the oxidative deposition of AgCl on its surface. For comparison, the photograph of the anode after the same reaction at 0.3 V and 50°C is shown in (c). Here, the anode turned black due to the formation of black Ag2O particles.
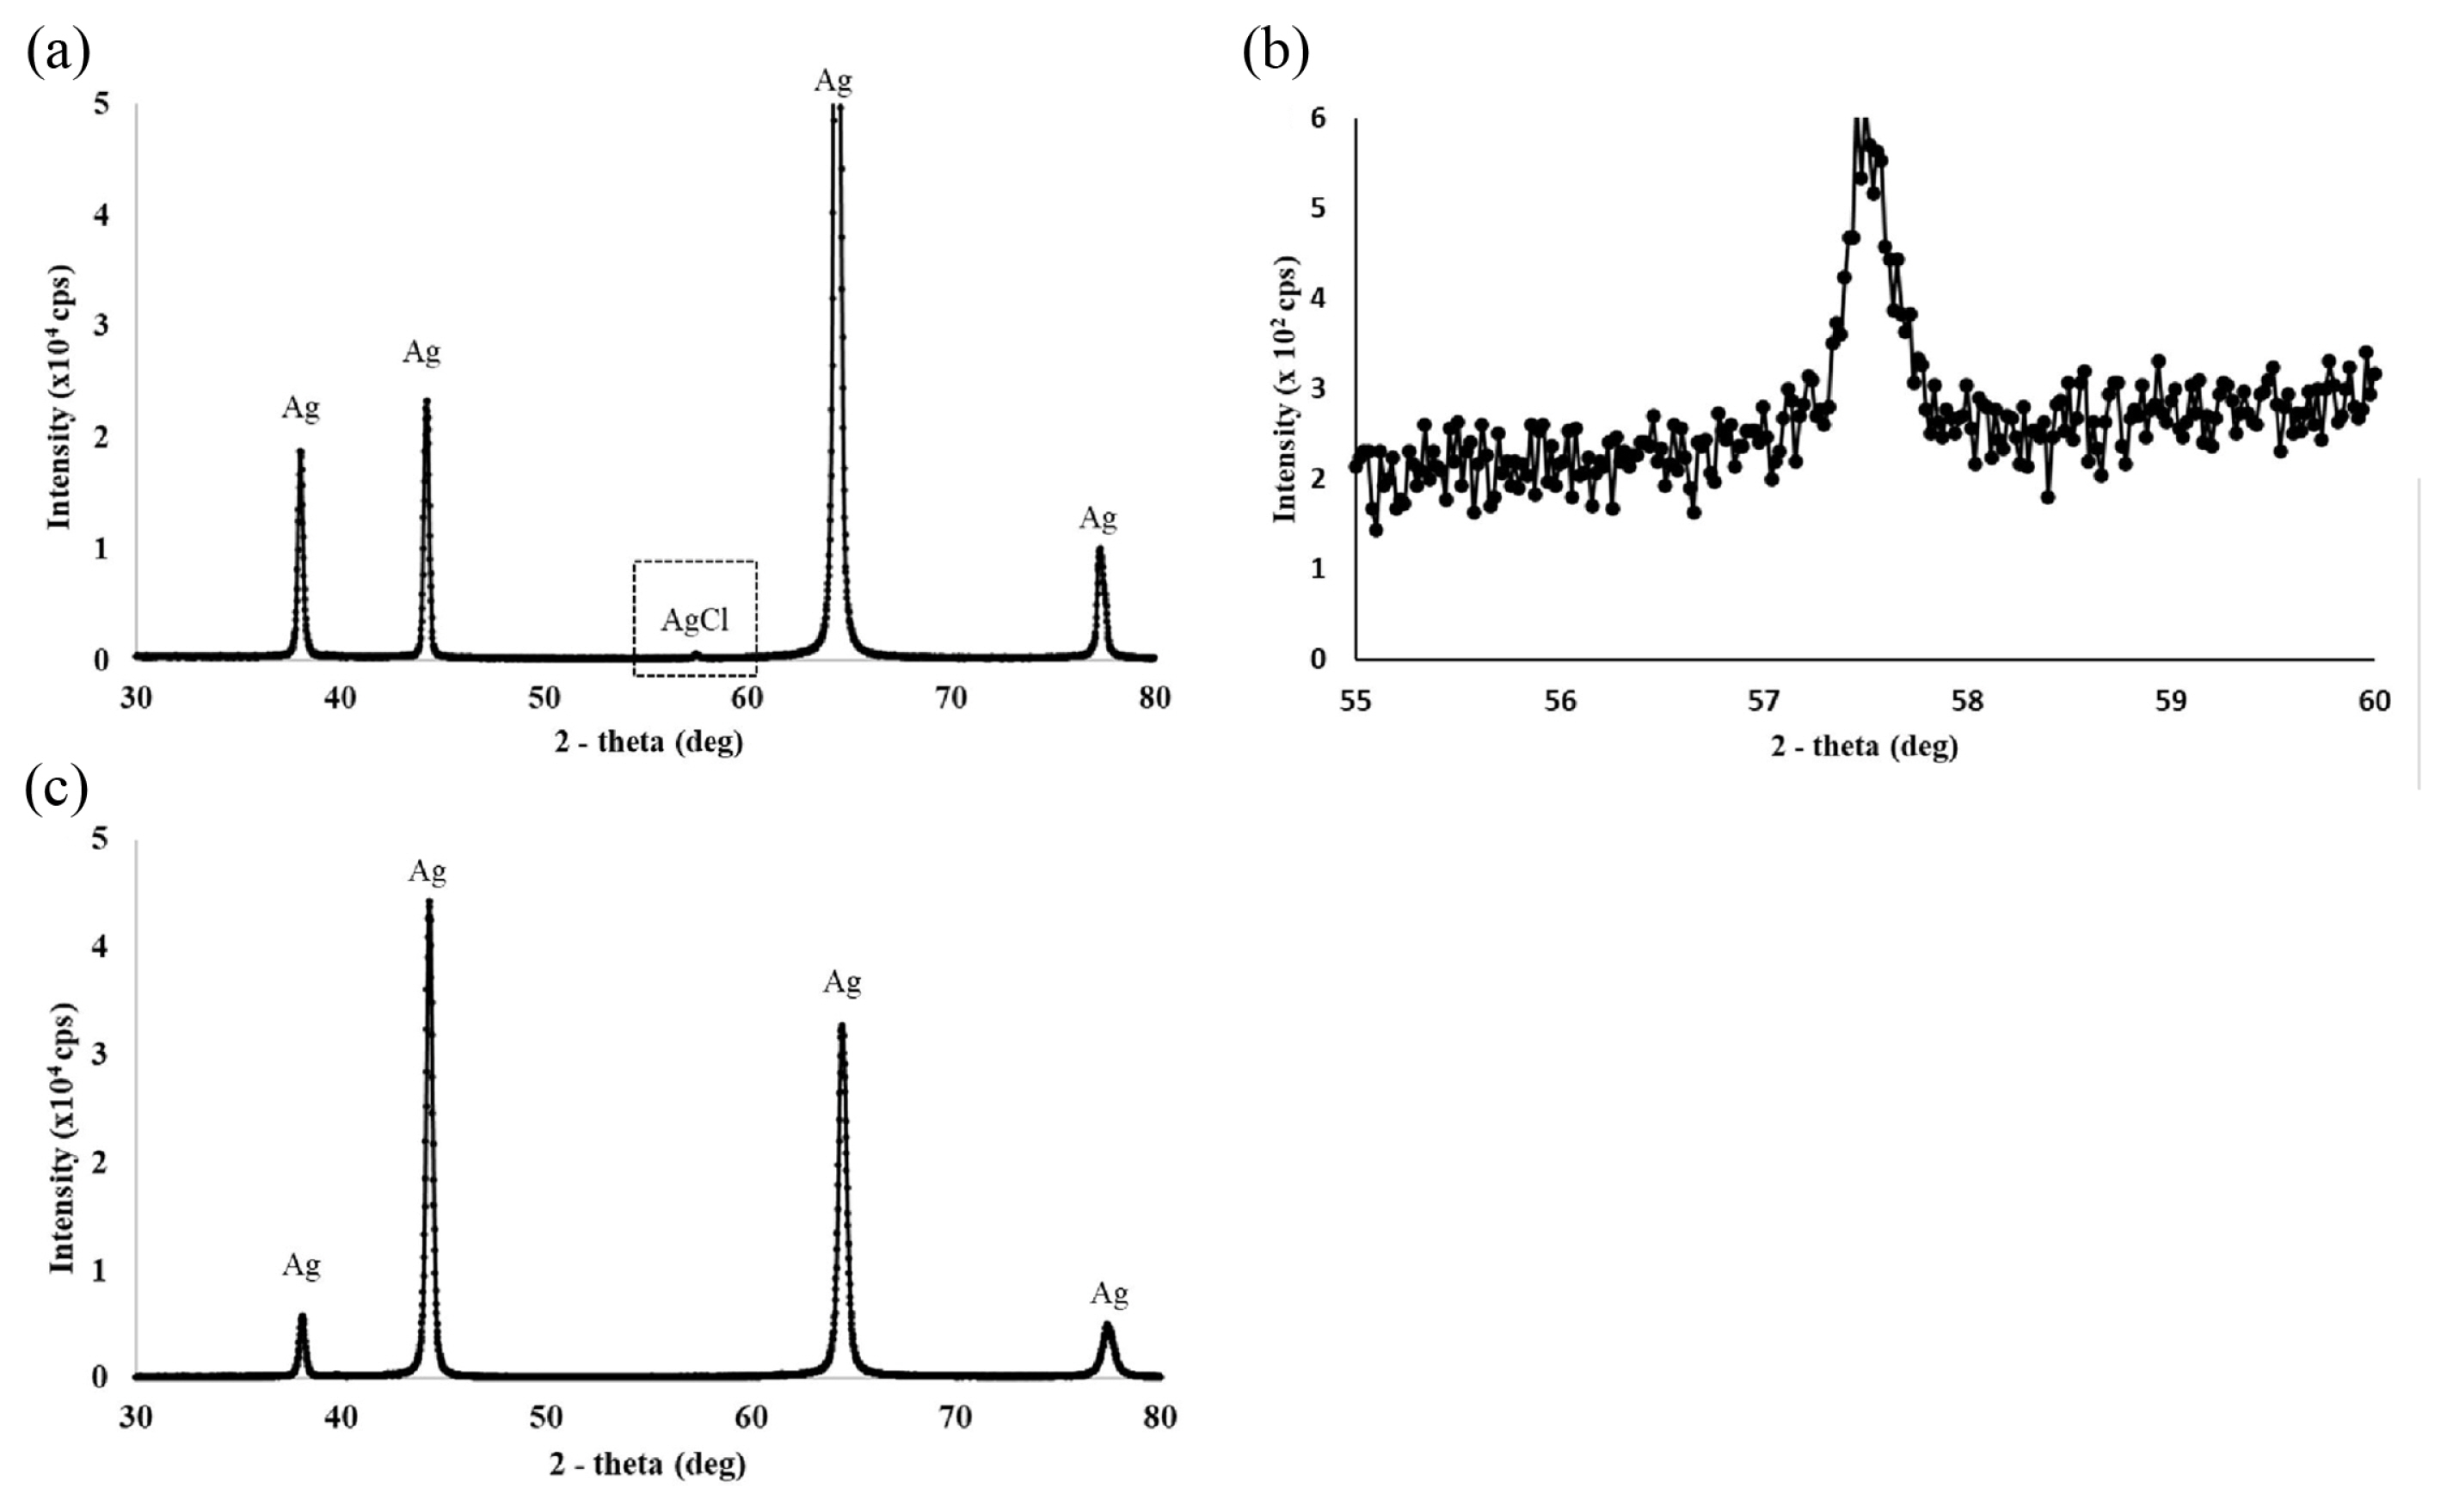
XRD analysis of the anode after one hour’s reaction at 0.18 V and 50°C are shown in (a) and (b). The four prominent peaks in (a) were identified as Ag and are marked accordingly. The small peak identified as AgCl is further magnified in (b). For comparison, XRD analysis of the anode before the reaction is shown in (c).
4. Conclusions
Sodium hydroxide solution is often employed as a sterilization agent in the pharmaceutical industry. NaOH is mostly produced from NaCl solutions via the chloro-alkali process. Residual chloride ions (Cl−), which may contribute to corrosion, are therefore considered as a critical impurity in NaOH. In this study, an electrochemical method for the preferential removal of Cl− from a highly concentrated NaOH solution was developed. Here, Ag was used as the anode for the oxidative deposition of AgCl, with the oxidative formation of Ag2O being evaluated as a potential competitive reaction. The Cl− content in the commercially available 50% w/w NaOH solution employed in this study was approximately 100 mg Cl−/kg NaOH. Considering that the OH− content would therefore be significantly higher than the Cl− content (a ratio of approximately 18,000 to 1), the formation of AgCl was considered thermodynamically less favorable than the formation of Ag2O. However, the activation energy of the former reaction was reported to be 3.8 kJ/mol, while that of the latter reaction was approximately 31.2 kJ/mol. Employing the Arrhenius equation for the rate constants of these reactions at 50°C, the exponential term of the former reaction was calculated to be approximately 27,000 times higher than that of the latter. By maintaining an anode potential lower than 0.2 V, it was subsequently possible to selectively form only AgCl, although both reactions were thermodynamically feasible. Operating the electrolytic cell for one hour at 50°C and at an anode potential of 0.18, or 0.19 V vs. Hg/HgO, the Cl− concentration could be reduced to less than 50 mg Cl−/kg NaOH. XRD analysis and visual monitoring of the Ag anode confirmed the oxidative deposition of AgCl on the anode surface. Although the AgCl formation reaction was thermodynamically less favorable than the Ag2O formation reaction, the selective removal of chloride from the concentrated NaOH solution was successfully achieved by controlling the anode potential, thereby ensuring that sufficient energy would be available to exceed only the activation energy of AgCl formation.
Acknowledgement
This work was supported by Bio Industrial Technology Development Program (20009668, Development of Sodium Hydroxide (NaOH) Purification Technology for Biomedicine Production) funded by the Ministry of Trade, Industry and Energy (MOTIE, Korea). We appreciate Dr. Han Sung Kim in the department of Chemical and Biomolecular Engineering of Yonsei University for the advice in experimental designs and data analysis.