Degradation Mechanisms of a Li—S Cell using Commercial Activated Carbon
Article information
Abstract
In lithium–sulfur (Li–S) batteries, encapsulation of sulfur in activated carbon (AC) materials is a promising strategy for preventing the dissolution of lithium polysulfide into electrolytes and enhancing cycle life, because instead of solid–liquid–solid reactions, quasi-solid-state (QSS) reactions occur in the AC micropores. While a high weight fraction of sulfur in S/AC composites is essential for achieving a high energy density of Li–S cells, the deterioration mechanisms under such conditions are still unclear. In this study, we report the deterioration mechanisms during charge–discharge cycling when the discharge products overflow from the AC. Analysis using scanning electron microscopy and energy-dispersive X-ray spectrometry confirms that the sulfur in the S/AC composites migrates outside the AC as cycling progresses, and it is barely present in the AC after 20 cycles, which corresponds to the capacity decay of the cell. Impedance analysis clearly shows that the electrical resistance of the S/AC composite and the charge-transfer resistance of QSS reactions significantly increase as a result of sulfur migration. On the other hand, the charge–discharge cycling performance under limited-capacity conditions, where the discharge products are encapsulated inside the AC, is extremely stable. These results reveal the degradation mechanism of a Li–S cell with micro-porous carbon and provide crucial insights into the design of a S/AC composite cathode and its operating conditions needed to achieve stable cycling performance.
1. Introduction
Lithium–sulfur (Li–S) batteries, in which elemental sulfur is used as the cathode active material, theoretically provide an extremely high capacity of 1672 mAh g−1 (sulfur) and are expected to be one of the most attractive batteries for large-scale energy storages [1–3]. As the active material, sulfur is an electrical insulator (5×10⁻³⁰ S cm−1 at 25°C). Hence, composite electrodes in which sulfur is mixed with carbon materials are generally utilized to ensure electronic conduction in the cathode. It should be noted that carbon materials don’t contribute to any electrochemical reactions in Li–S cells, thereby the amount of carbon materials in the composite electrodes should be minimized to avoid reducing the energy density of Li–S cells. On discharge, sulfur (S8) is reduced to form lithium sulfide (Li2S) via the formation of lithium polysulfide (LiPS) as the intermediate. During charging, the opposite reaction occurs. As the intermediate LiPS is soluble in many electrolytes, such as 1,3-dioxolane–dimethoxyethane, dimethyl sulfoxide, and tetrahydrofuran [4], it diffuses freely toward the lithium anode and is reduced on the anode surface. This phenomenon leads to a redox shuttle effect during charging, where the reduced LiPS on the anode is re-oxidized on the cathode. This is a major problem in Li–S cells, leading to reduced coulombic efficiency and limited battery capacity [5].
Encapsulating sulfur in activated carbon (AC) with micro-pores (<2 nm) as the cathode is a promising strategy to avoid such a redox shuttle effect in Li–S cells [6–11]. In S/AC composites, the intermediate product of LiPS does not diffuse into electrolytes because the intermediate LiPS formed inside the micro-pores does not come into contact with solvent molecules; solvent molecules are absent in the micropores because the desolvation of lithium ions occurs on the surface of micro-pores, owing to the size effect when the pore diameter of AC is similar to the diameter of solvated Li ions [12,13]. Therefore, the elemental sulfur can be converted into Li2S on discharge without the diffusion of the LiPS intermediate into the electrolyte, which is the so-called quasi-solid-state (QSS) reaction [5]. This unique behavior does not appear when using carbon materials with larger pore size (>2 nm), such as mesoporous carbons [14,15].
While the use of encapsulated sulfur in ACs yields such a great benefit, this strategy exhibits a major drawback in terms of the energy density, as some studies reported that with increasing amounts of sulfur in S/AC composites there is a deterioration in the cycling performance [8–10]. While it is essential to design a Li–S cell with good cycling characteristics as well as a high energy density, the deterioration mechanism for such a high weight fraction of sulfur in the S/AC composite has not yet been clarified.
In this paper, we assembled a Li–S cell using commercially available AC (average pore diameter = 0.9 nm) with a high-sulfur-ratio in the S/AC composite and investigated the degradation mechanism using field-emission scanning electron microscopy (SEM) and energy-dispersive X-ray spectrometry (EDX) and AC impedance analysis. With the revealed degradation mechanism, we also provide an insight into the charge–discharge operating conditions needed to achieve stable cycling.
2. Experimental
Sulfur (Kanto Chemical) and AC (YP-80F, Kuraray Chemical) were used to prepare the S/AC composites. The AC product specification is described in Ref. [16]. First, the sulfur and AC were mixed with a ratio of 65/35 (w/w) using a granulator (Balance Gran, Akirakiko) for 35 min, and the resultant mixture was heated to 155°C for 5 h under N2 for the impregnation of sulfur into the AC. The obtained S/AC composite was further heated to 300°C for 2 h to remove the additional sulfur from the AC. It was then ball-milled using a high-energy ball mill (Retsch, MM500 nano) at a frequency of 25 Hz for 5 h with a zirconia ball and zirconia container. Thermo-gravimetric analysis (TGA) using a TG8120 (Rigaku) system under N2 revealed that the resultant sulfur content of the S/AC composite was approximately 60 wt.%, as shown in Fig. S1; approximately 5 wt.% of sulfur was evaporated during heating at 300°C for 2 h. The S/AC composite slurry was prepared using 92.5 wt.% of the S/AC composite, 4.0 wt.% of the carbon nano-fiber (Showa Denko, VGCF-H), 1.5 wt.% of carboxymethyl cellulose, and 2 wt.% of styrene-butadiene, which were mixed by hand for 15 min and dissolved in purified water. The prepared slurry was coated onto a carbon-coated Al foil (7 mm thickness) with a sulfur loading of ca. 4 mg cm−2 and was preliminarily dried at 35°C for 1 h. The coated carbon was composed of graphite and carbon black (TN5, Dynic). The as-obtained cathode was cut into a 2 × 3 cm2 sheet (active material area of 2 × 2 cm2) and dried under vacuum at 50°C for 16 h in a dry-room atmosphere.
Instead of using 1,3-dioxolane-dimethoxyethane-based electrolytes in which the intermediate products of LiPSs (Li2SX, 4 < X < 8) are easily dissolved during charge–discharge cycling, we used a sulfolane (SL)-based electrolyte with very low solubility of LiPS (Li2S8) (<10 mM) [17] to investigate the sulfur cathode without any dissolution of LiPS. We prepared the electrolyte using battery-grade SL (Kishida Chemical), 1,1,2,2-tetrafluoroethyl 2,2,3,3-tetrafluoropropyl ether (Daikin Industries Co.), battery-grade lithium bis(trifluoromethanesulfonyl)imide (Kishida Chemical), and lithium bis(fluorosulfonyl)imide (Wako Chemical). They were mixed in the molar ratio 2/2/0.8/0.2. The electrolyte composition reported by Watanabe et al. [17] was used herein.
A small pouch cell composed of a cathode with an active area of 2 × 2 cm2, lithium metal with an area of 3 × 3 cm2 (100 mm thickness, Honjo Metal Co., Ltd.), and a separator (UP3085, Ube Maxell) was constructed for the charge–discharge test. Prior to sealing the cell, the prepared electrolyte was dropped into the separator. The ratio of the electrolyte volume to sulfur weight (E/S) was controlled at 4.0.
The assembled Li–S cells were examined with a battery-testing instrument (HJ1010SM8A, Hokuto Denko) for the charge–discharge cycling test. We conducted three cycling sequences, namely limited capacities of 500 mAh g−1 (sulfur) and 800 mAh g−1 (sulfur), and full capacity with limited voltage. For the limited-capacity sequences, a galvanostatic charge–discharge test was performed with a limited capacity of 500 mAh g−1 (sulfur) or 800 mAh g−1 (sulfur) at a current density of 0.1 C. The cutoff voltage was set within a voltage range of 1.0–3.3 V. Prior to the cycling test, the cell was discharged at a rate of 0.02 C from an open-circuit voltage to the limited capacity of 500 mAh g−1 (sulfur) or 800 mAh g−1 (sulfur) as the lithiation process for the sulfur cathode. The experimental condition for the full capacity with limited-voltage sequence was the same as that for the limited-capacity sequence, except for the cycling and lithiation capacity; the galvanostatic charge–discharge test and lithiation process were carried out within a voltage range of 1.0–3.3 V. All of the cycling tests herein were conducted at 30°C.
The cross-sectional images and elemental characteristics of the S/AC composite cathode were observed using field-emission SEM (SU8220, Hitachi) and EDX (Quantax XFlash 5060FQ, Bruker).
The AC impedance spectra of the battery cells were measured using a potentiostat system (VMP-300, BioLogic) at the open-circuit voltage, with an AC signal of 10 mV (zero to peak) in a frequency range of 100 kHz to 10 mHz. The impedance measurements were conducted at the end of lithiation or discharge under an atmospheric temperature of 30°C. Data fitting was performed using the Microsoft Excel Solver package until the minimum error was obtained, which was achieved by minimizing the sum of all differences between the complex impedance data obtained through experiments and the impedance calculated from the equivalent circuit using the fitted parameters at each frequency; this method was similar to that detailed in our previous studies [18–21]. To identify the frequency response of each fundamental electrochemical process, distribution of relaxation times (DRT) analysis was performed on the obtained impedance spectra using commercial software (Z-Assist, TOYO Corporation).
3. Results and Discussion
Fig. 1 shows the charge–discharge curves for Li–S cells with limited capacities of (a) 500 mAh g−1 (sulfur) and (b) 800 mAh g−1 (sulfur) and (c) at full capacity within a voltage range of 1.0–3.3 V. In all cases, a single plateau in the discharge curve is observed, which is typical when the sulfur-encapsulated cathode is used [6,8–11]. In terms of the cycling performance with limited capacities of 500 mAh g−1 (sulfur) and 800 mAh g−1 (sulfur), there is no significant deterioration in discharge capacity throughout cycling up to twenty cycles. Compared to cycling with limited capacities, a significant capacity decay is observed in the full charge–discharge cycling; the discharge capacity gradually decreases until six cycles and steeply drops afterwards to less than 200 mAh g−1 (sulfur) (Fig. 1(c,d)). One of the significant differences between full charge–discharge cycling and limited-capacity cycling is the degree of the volume expansion of sulfur during discharging; elemental sulfur expands 178% to form Li2S during discharge, so the depth of discharge affects the volume expansion of sulfur. According to the product specifications [16] and some previous studies [22,23], the total pore volume of AC is approximately 1 cc g−1. As the sulfur content of the S/AC composite is 60 wt.% in this study (Fig. S1), approximately 77% of the pores in AC are filled with sulfur in the prepared S/AC cathode, when the weight density of S8 (2.03 g cm−3) is taken into account. The weight density of Li2S is 1.67 g cm−3 and the resultant volume of Li2S after full discharge will be approximately 131% against the total pore volume in AC; that is, approximately 31% of the discharge products cannot be encapsulated inside the AC. On the other hand, Zhang et al. reported that, in the QSS reactions in the micro-pores, the final discharge product of Li2S is only formed when the voltage reaches below 1.5 V vs. Li/Li+ [10]. Helen et al. reported that sulfur in the micro-pores is transformed directly to form Li2S2 or Li2S and that the ratio of the resultant products is Li2S2/Li2S = 71%/29% [24]. By taking the weight densities of Li2S2 (1.65–2.01 g cc−1) [25] and of Li2S (1.67 g cc−1) into consideration, it is presumed that approximately 3–21% of sulfur overflows from the AC. Regardless of these assumptions based on the discharge products, a partial amount of sulfur may overflow outside the AC when the full discharge capacity sequence is adopted.

Electrochemical properties of Li–S cells with limited capacities of (a) 500 mA g−1 (sulfur) and (b) 800 mA g−1 (sulfur), and (c) at full capacity. (d) Comparison of the cycling performance of the Li–S cells with limited capacities of 500 mA g−1 (sulfur) and 800 mA g−1 (sulfur) and at full capacity.
From the abovementioned results, the cycling performance with the limited capacity sequence is superior to that with the full capacity sequence. An advantage of cycling with limited capacity is also observed in terms of the accumulated discharge capacity, which can be extracted from the Li–S cells (Fig. S2). While Su et al. reported a similar phenomenon for a Li–S cell with solid–liquid–solid reactions using non-microporous carbon [26], their mechanism is quite different from our case. Su et al. improved the cycling performance of a Li–S cell by controlling the charge–discharge voltage within the voltage range where the formation of soluble LiPS is avoided. On the other hand, there is no dissolution (or very little dissolution) of LiPS in our case, owing to the utilization of micro-porous carbon and an SL-based electrolyte. Therefore, other factors apart from the dissolution of LiPS into the electrolyte may cause serious capacity decay in full charge–discharge cycling.
Fig. 2 shows cross-sectional SEM images and EDX mappings of the S/AC cathode after (a,d) lithiation, (b,e) the 5th discharge, and (c,f) the 20th discharge in the full charge–discharge cycling sequence. The observed particles of ~5 μm are attributed to the primary particles of AC in Fig. 2(a–c). As cycling progresses, some visible cracks appear in the AC (denoted as a red arrow in Fig. 2(b,c)), which is similar to the results reported by Aurbach et al. [5] These cracks may be due to the volume expansion of Li2S from S8. From the EDX mapping analysis, the elemental sulfur after lithiation is observed to be uniformly distributed in the AC (colored yellow in Fig. 2(d)). In contrast, the location of sulfur changes with the progress of cycling. After the 5th cycle, the content of elemental sulfur inside the AC decreases, while that outside the AC increases (Fig. 2(e)). After the 20th cycle, the signal of sulfur is barely detected inside the AC; it is mostly detected from around the AC (Fig. 2(f)). We use an SL-based electrolyte in which the solubility of LiPS is very low; hence, the elemental sulfur should remain in the cathode instead of diffusing into the electrolyte. The results indicate that the elemental sulfur, which is originally encapsulated inside the AC, gradually migrates to the exterior during charge–discharge cycling.
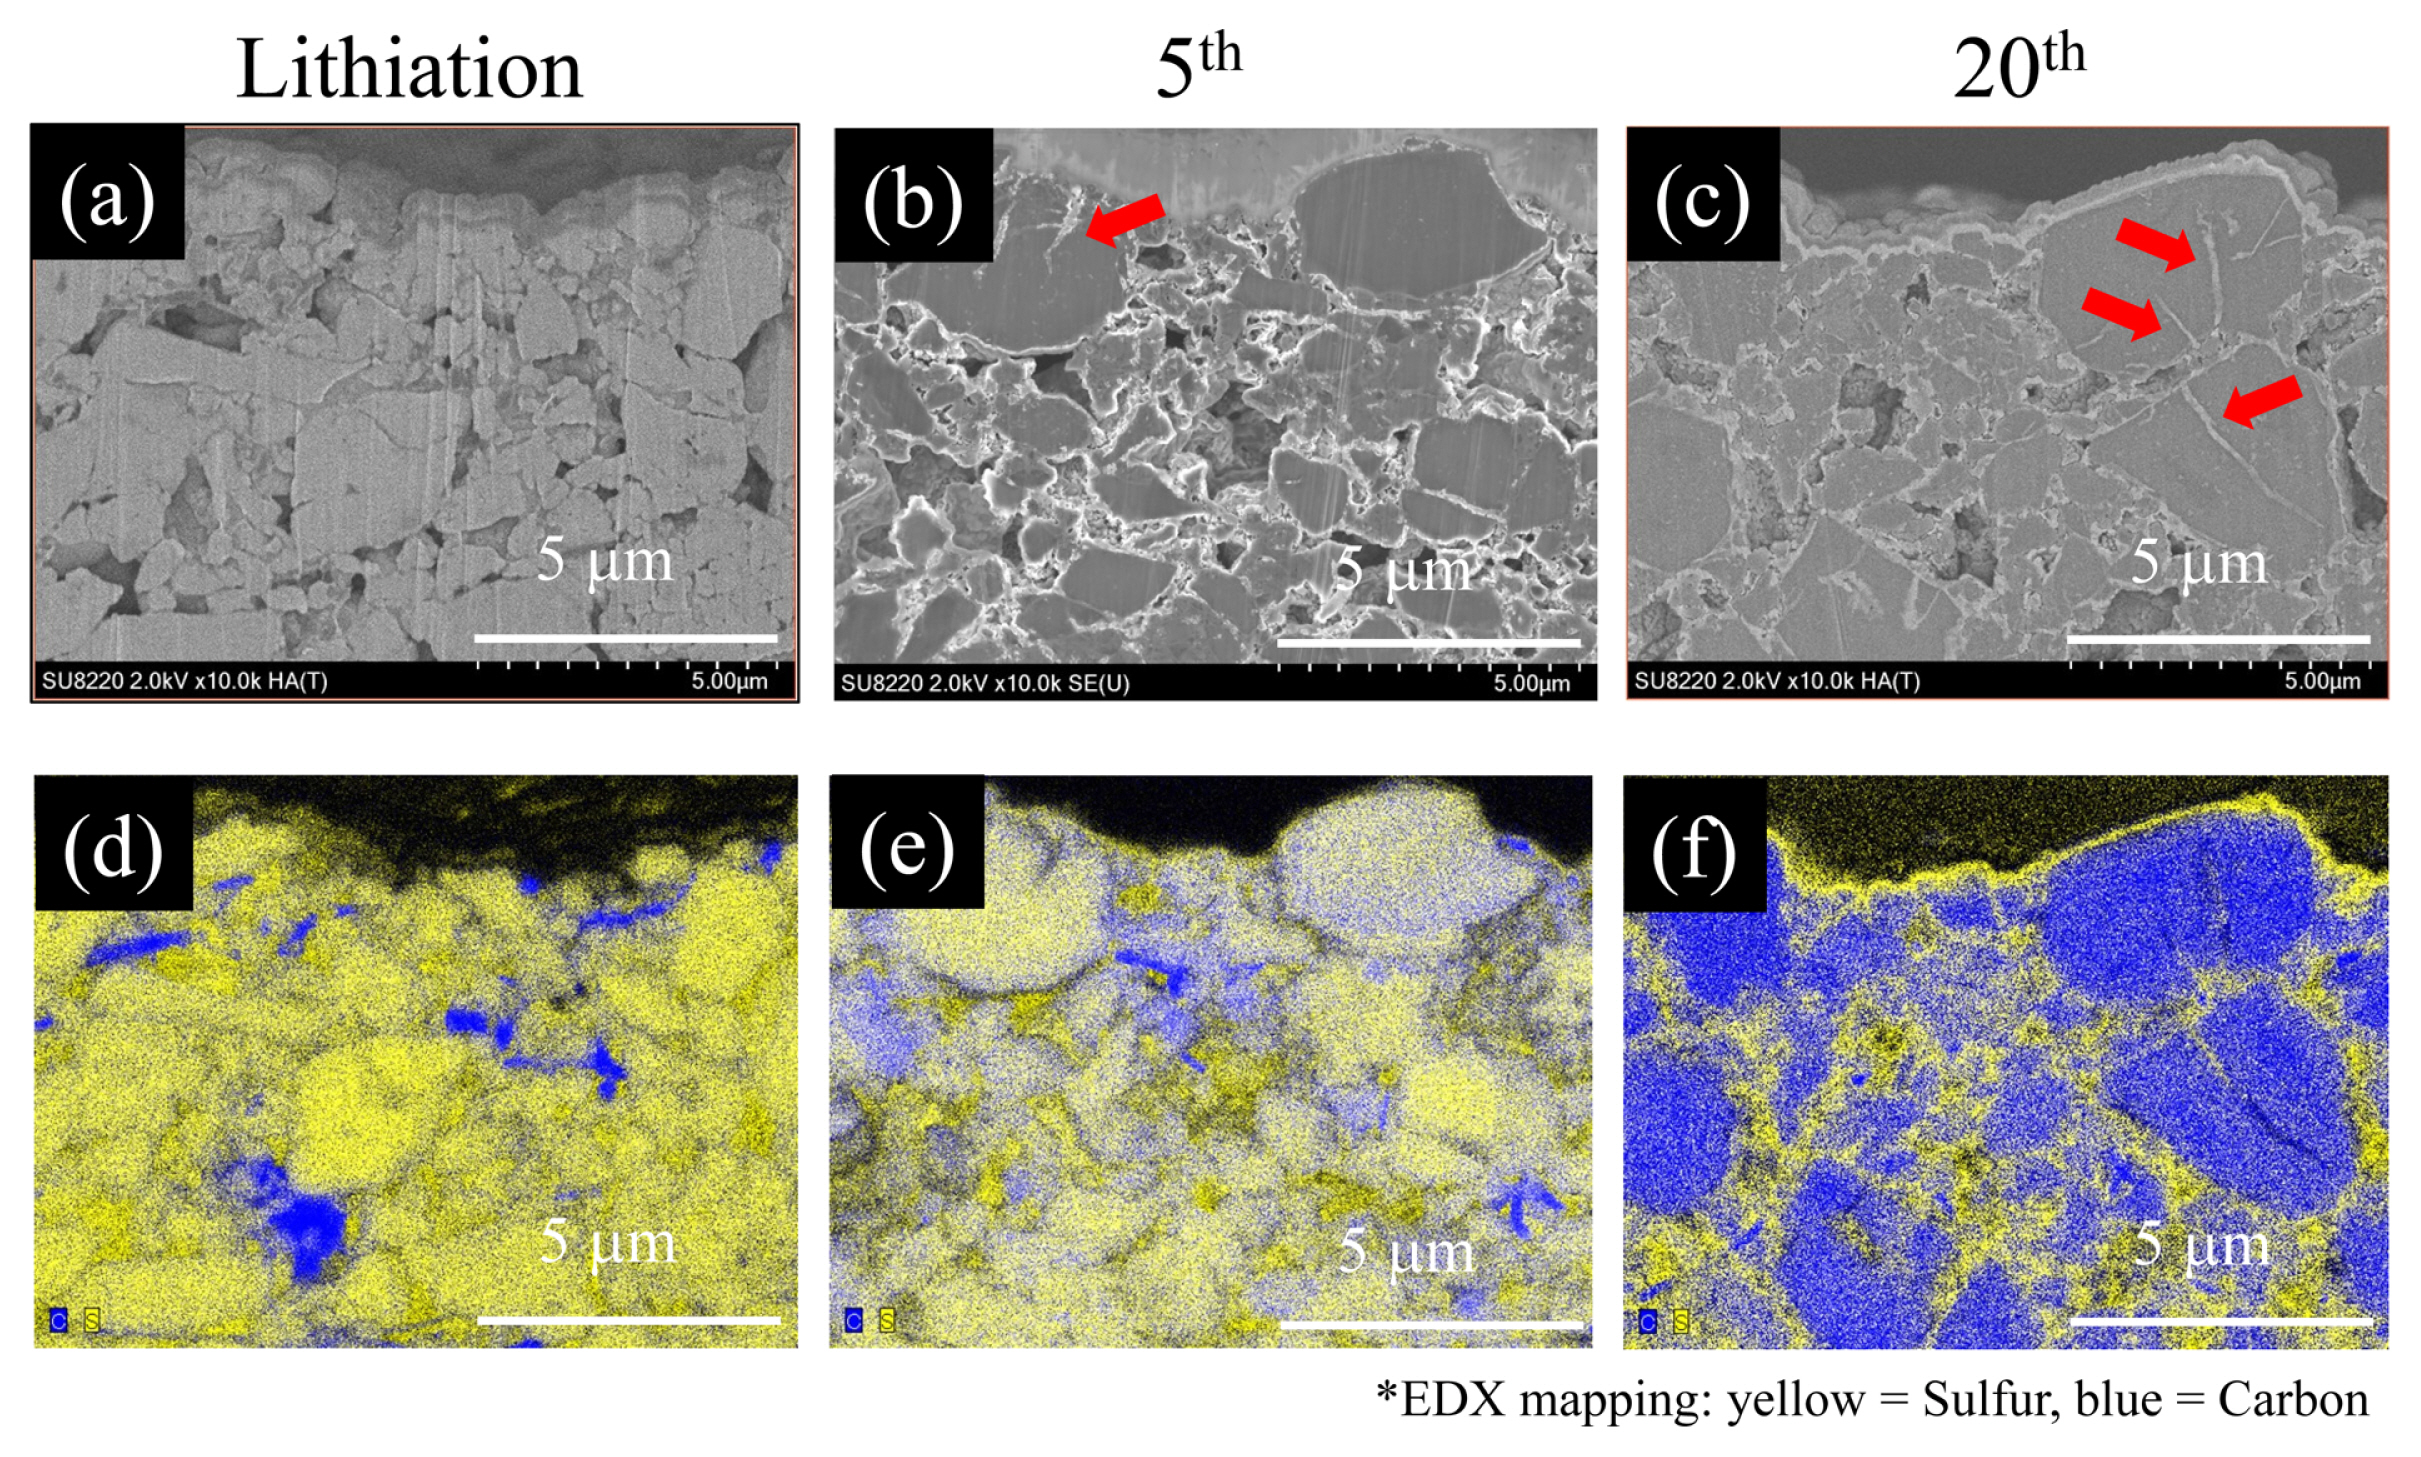
(a–c) Cross-sectional SEM images and (d–f) elemental EDX mapping images of the S/AC composite cathode in the full charge–discharge cycling sequence after (a,d) lithiation, (b,e) the 5th discharge, and (c,f) the 20th discharge.
Sulfur migration affects the electrochemical impedance of the Li–S cell. Fig. 3(a) shows the Nyquist plots obtained for the Li–S cell exposed to full charge–discharge cycling. The cell impedance increases with increasing the cycling number. Compared to the impedance of the Li–S cell with the limited capacity cycling sequence of 500 mAh g−1 (sulfur) or 800 mAh g−1 (sulfur) (Fig. S3), the impedance largely increases for the full capacity cycling sequence as cycling progresses.
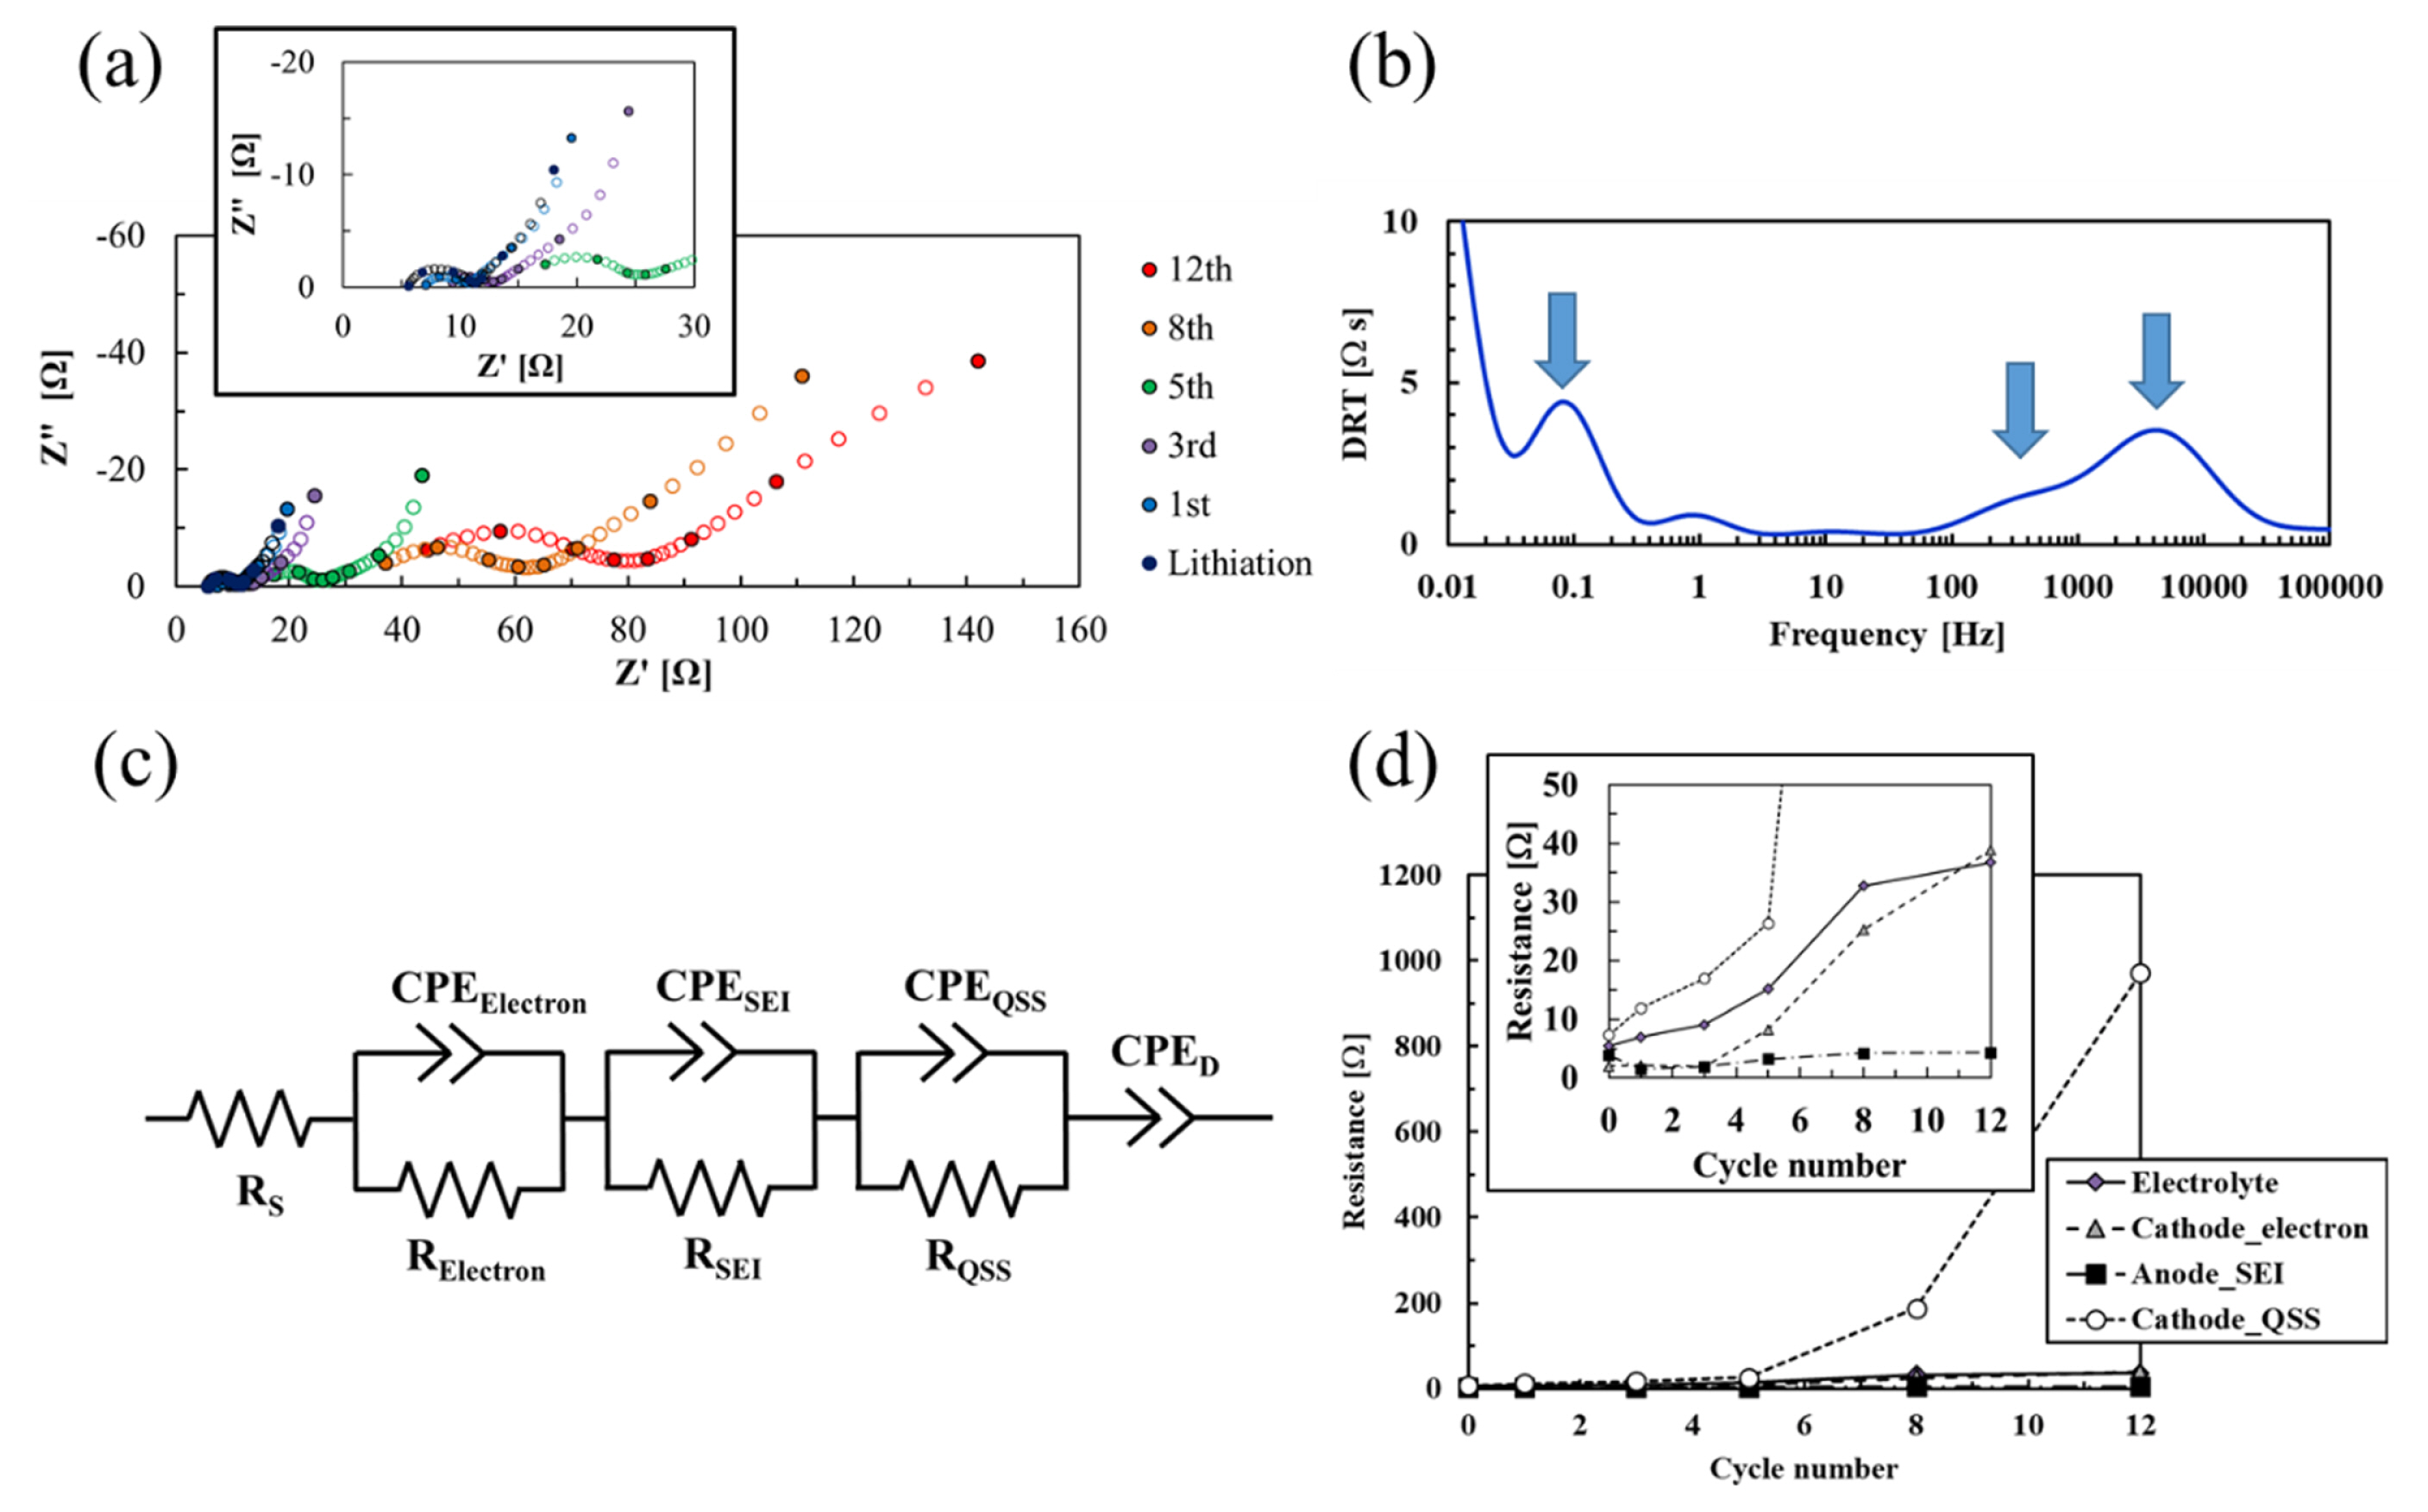
(a) Nyquist plots of the Li–S cell with the full charge–discharge cycling sequence. (b) DRT of the Li–S cell after lithiation at a voltage of 1.0 V. (c) The equivalent circuit used to analyze the impedance spectra in this study. Notation: RS: resistance of the electrolyte; RSEI and CPESEI: resistance and constant phase element, respectively, of the SEI on the lithium surface; RElectron and CPEElectron: electrical resistance and constant phase element, respectively, of the S/AC composite electrode; and RQSS and CPEQSS: charge-transfer resistance of the QSS reactions and its constant phase element.
To separate the fundamental electrochemical processes in the Nyquist plots, DRT analysis was conducted. Fig. 3(b) shows the DRT analyzed via the impedance spectrum obtained for the Li–S cell after the lithiation process when the voltage reaches 1.0 V. Three major peaks are observed at ~5 kHz, ~1 kHz, and ~0.1 Hz, respectively. As the vertical axis is a function related to the internal resistance at each fundamental electrochemical process, the internal resistance at a frequency of >0.03 Hz is mainly composed of three fundamental electrochemical processes. We attribute the apex frequency at ~1 kHz to the reaction of the lithium anode from the impedance analysis results using a Li/Li symmetrical cell (Fig. S4(a,b)); the apex frequency, resistance, and capacitance obtained from the full cell correspond to those from the Li/Li symmetrical cell, respectively. The fundamental electrochemical process at ~1 kHz may be attributed to the reactions of a compact solid electrolyte interphase (SEI) on the lithium surface, which contributes the impedance as the major resistance in the lithium anode reaction [27,28].
As the apex frequency at ~1 kHz is attributed to the anode reaction, the other two peaks at ~5 kHz and ~0.1 Hz are thought to be due to cathode reactions. Song et al. and Walus et al. reported that the fundamental electrochemical process appearing at ~10 kHz is the electrical response either in the cathode composite or at the interface between the cathode and current collector [29,30]. The elementary process occurring at ~0.1 Hz can reportedly be derived from QSS reactions in the micropores by using DRT impedance analysis [31].
Taking the above assumption into consideration, we designed the equivalent circuit shown in Fig. 3(c) and conducted impedance fitting analysis. In the Li–S cell with a solid–liquid–solid system, the fundamental process of the lithium anode is often neglected [32,33] because the LiPS in the electrolyte decomposes on the lithium anode to form a stable SEI, which reduces the SEI resistance negligible level [34]. However, we added it as a fundamental electrochemical process in the equivalent circuit because we adopted an insoluble electrolyte for LiPS. As shown in Fig. 3(b), the reaction of the lithium anode is one of the main elementary processes that constitute the impedance of the cell. We disregard the fundamental electrochemical processes observed at ~10 Hz and ~1 Hz because these processes are so small as to be negligible.
Fig. 3(d) shows the fitting results for the electrochemical processes of electrolyte resistance, electrical resistance of the cathode or at the interface between the electrode and current collector, the charge-transfer resistance (RCT-C) of the QSS reaction, and the SEI resistance of the lithium anode. The anode resistance decreases slightly from the beginning of the cycle and does not change significantly after the 5th cycle. According to Talian et al., the reduced resistance may be attributed to the increase in the reaction area of the lithium surface [35]. After a couple of cycles from the beginning, the reduction in the overpotential based on the anode reaction is also confirmed using a Li/Li symmetrical cell in Fig. S4(c), which supports the abovementioned presumption. Compared to the other fundamental electrochemical processes, the anode resistance remains low as cycling progresses. A high coulombic efficiency of >97% in the SL-based electrolyte (Fig. S4(d)) suggests that the formed SEI is stable during cycling, which implies that the observed steep capacity decay in the full charge–discharge sequence (Fig. 1(c)) is not due to the anode resistance.
We observe remarkable increases in the resistances for the charge transfer of QSS, electron conduction, and electrolyte between the 5th and 8th cycles. The charge-transfer resistance of QSS is a dominant process among all the fundamental electrochemical processes in the Li–S cell. The AC used herein exhibits a large surface area of >2200 m2 g−1 [16,23]. In the as-prepared S/AC composite, elemental sulfur is fully encapsulated in the pore; hence, the contact area between sulfur and AC is large enough to reduce the QSS reactions. Namely, the charge-transfer resistance of the QSS reaction should be low. Considering the result in Fig. 2, the significant increase in the QSS reaction resistance is thought to be due to the lack of the S/AC contact area as a result of the migration of elemental sulfur to outside the AC. The increase in the electron resistance of the cathode or at the interface between the electrode and current collector may also be due to the migration of sulfur because the presence of sulfur outside the AC may disrupt the percolation of electrons in the cathode.
In many cases, the increase in the electrolyte resistance of Li–S cells is attributed to the increase in the electrolyte viscosity by the dissolution of LiPS [32,36] or to the consumption of the electrolyte as a result of its decomposition on the lithium anode surface. However, those phenomena are not applicable in our case as the SL-based electrolyte is used; the dissolution of LiPS does not occur in the SL-based electrolyte and its consumption in the electrolyte is marginal during charge–discharge cycling (Fig. S4(d)). One possible reason for this result is the increase in the ionic resistance of the cathode. As shown in Fig. S5, the S/AC composite cathode appears to be densely packed as cycling progresses, which is attributed to sulfur migration. The densely packed cathode may prevent the electrolyte from infiltrating into the cathode, resulting in the enhanced electrolyte resistance, as shown in the Nyquist plots. Further impedance analysis, such as the transmission line model, which can focus more on the ionic resistance of the electrode [27,37], should be carried out in future studies.
4. Conclusions
In summary, the degradation mechanism in a Li–S cell incorporating encapsulated sulfur in commercial AC was investigated using SEM–EDX and electrochemical impedance analysis. The SEM–EDX observation confirmed that the sulfur originally encapsulated in the AC gradually migrated outside the AC as the cycling progressed. Owing to sulfur migration, the increased resistance of the QSS reactions and electrical resistance of the S/AC composite cathode were revealed by electrochemical impedance analysis. As sulfur migration was caused by the volume expansion of sulfur to form Li2S (or Li2S2) during discharge, limited capacity cycling, where the excess volume expansion of sulfur can be avoided, may be a potential option for achieving a prolonged stable cycling performance of a Li–S cell using AC materials.
Acknowledgments
The authors would like to thank Kuraray Chemical Co. (Japan) for providing YP-80F. This study was partially supported by the “Advanced Low-Cost Technology Research and Development Program, Specially Promoted Research for Innovative Next Generation Batteries” (ALCA-SPRING) from the Japan Science and Technology Agency (JST), Japan.