Applications of Voltammetry in Lithium Ion Battery Research
Article information
Abstract
Li ion battery (LIB) is one of the most remarkable energy storage devices currently available in various applications. With a growing demand for high-performance batteries, the role of electrochemical analysis for batteries, especially, electrode reactions are becoming very important and crucial. Among various analytical methods, cyclic voltammetry (CV) is very versatile and widely used in many fields of electrochemistry. Through CV, it is possible to know electrochemical factors affecting the reaction voltage and reversibility, and furthermore, quantitative analysis on Li+ diffusivity as well as intercalation and capacitive reactions, and also anionic redox reaction. However, the explanation or interpretation of the results of CV is often deficient or controversial. In this mini-review, we briefly introduce the principle of cyclic voltammetry and its applications in LIB to bring a better understanding of the electrochemical reaction mechanisms involved in LIB.
1. Introduction
Li ion battery has the best performance among rechargeable batteries that are currently in commercial use and is widely used in portable products such as mobile phones, laptops, power tools, and electric vehicles. In addition, due to technological advances, the performances required for Li ion batteries such as high capacity long cycle life have been gradually enhanced [1–6]. Looking at the Li ion batteries, electrochemical reactions take place in the electrodes, and even in the electrolyte. To analyze these electrochemical processes, various electrochemical analysis are being studied. Commonly used electrochemical methods include cyclic voltammetry (CV), chronoamperometry (CA) [7], chronopotentiometry (CP) [8], stripping voltammetry (SV) [9], and linear sweep voltammetry (LSV) [10]. It is possible to know the voltage at which oxidation or reduction occurs, and whether impurities are present or whether the reaction has occurred properly. These electrochemical analyses are very useful in a variety of fields, especially energy storage systems like Li ion batteries. Cyclic voltammetry has long been a fundamental analytical technique among electrochemical methods. The advantages of CV compared to other measurements are: 1) It is possible to know whether the chemical reaction of the reactants is reversible or irreversible. 2) The potential at which an oxidation or reduction reaction occurs can be determined. 3) Quantitative analysis is also possible for substances whose concentration is not known. 4) It is possible to measure by changing test conditions such as scan rate, temperature and concentration of reactant. In this mini-review, the basic principles and applications of CV for Li ion batteries research are introduced.
2. Principle of voltammetry
2.1 Linear sweep and cyclic voltammetry
First, cyclic voltammetry is based on the principle of linear sweep voltammetry that is a technique to measure the current while the potential is swept linearly as a function of time. Here, the slope of the voltage change over time is defined as a scan rate (m s−1). LSV shows various results depending on the following factors: 1) the rate of electron transfer process, 2) the electrochemical reactivity of the materials, and 3) the scan rate for measurement. The results of LSV are presented as one of anodic or cathodic peak as described in Fig. 1a. Although CV is very similar to LSV, it does not finish with a single sweep within a fixed voltage range. For example, assuming the voltage range from E1 to E2, when E2 is reached at the end, it reverses to E1 again. Because of this feature, it is called ‘cyclic’ current versus voltage plot is termed a ‘cyclic voltammogram’, as shown in Fig. 1b. In the CV measurements, the most important parameter is the scan rate (v). The voltage is swept from E1 to E2 and it represents the slope for a linear voltage change during the measurement. By repeating several cycles with the same conditions, additional information on the voltage, reversibility, and cyclability of redox reactions can be obtained. Also, it can be used to investigate the kinetics of electrochemical redox reaction by changing the scan rate.

a) Voltage vs. time profile for linear sweep and cyclic voltammetry. b) Typical cyclic voltammogram plotting cathodic and anodic peak.
2.2 Comparison of cyclic voltammogram and dQ/ dV plot
For differential capacity (dQ/dV) plot, it can be recorded based on a similar principle with cyclic voltammogram. Although it provides useful information on the redox reaction of electrochemical systems the difference between cyclic voltammogram and dQ/dV plot should be recognized as cyclic voltammogram contains the rate information. In general, the current (I) is plotted on the y-axis versus the voltage (V) on the x-axis in the cyclic voltammogram and it can be transformed into to dQ/dV plot. For transformation of cyclic voltammogram to dQ/dV, the I and V can be expressed as
where v is scan rate (V s−1), V is the voltage (or potential, V), I is the current (A), Q is charge stored (Ah), and t is time (s). And the formula (4) which indicate the y-axis of dQ/dV plot was obtained by combining the equation (2) and (3)
Moreover, it is necessary to understand the different experimental conditions between galvanostatic cycling (charge-discharge) and CV in terms of a driving force for electrochemical reactions; the potential increases linearly with time in CV, whereas the current is maintained during galvanostatic cycling. Regardless of state of charge (SOC) of the working electrode, these forced changes in potential increase the current beyond the operating limits of the cell. Thus, it would be difficult to make a comparison of accessible capacity [11]. In addition, the IR drop of the cell remains consistent during the constant current scan, which depends on the CV sweep, so the peak position and shape can be changed as shown in Fig. 2.
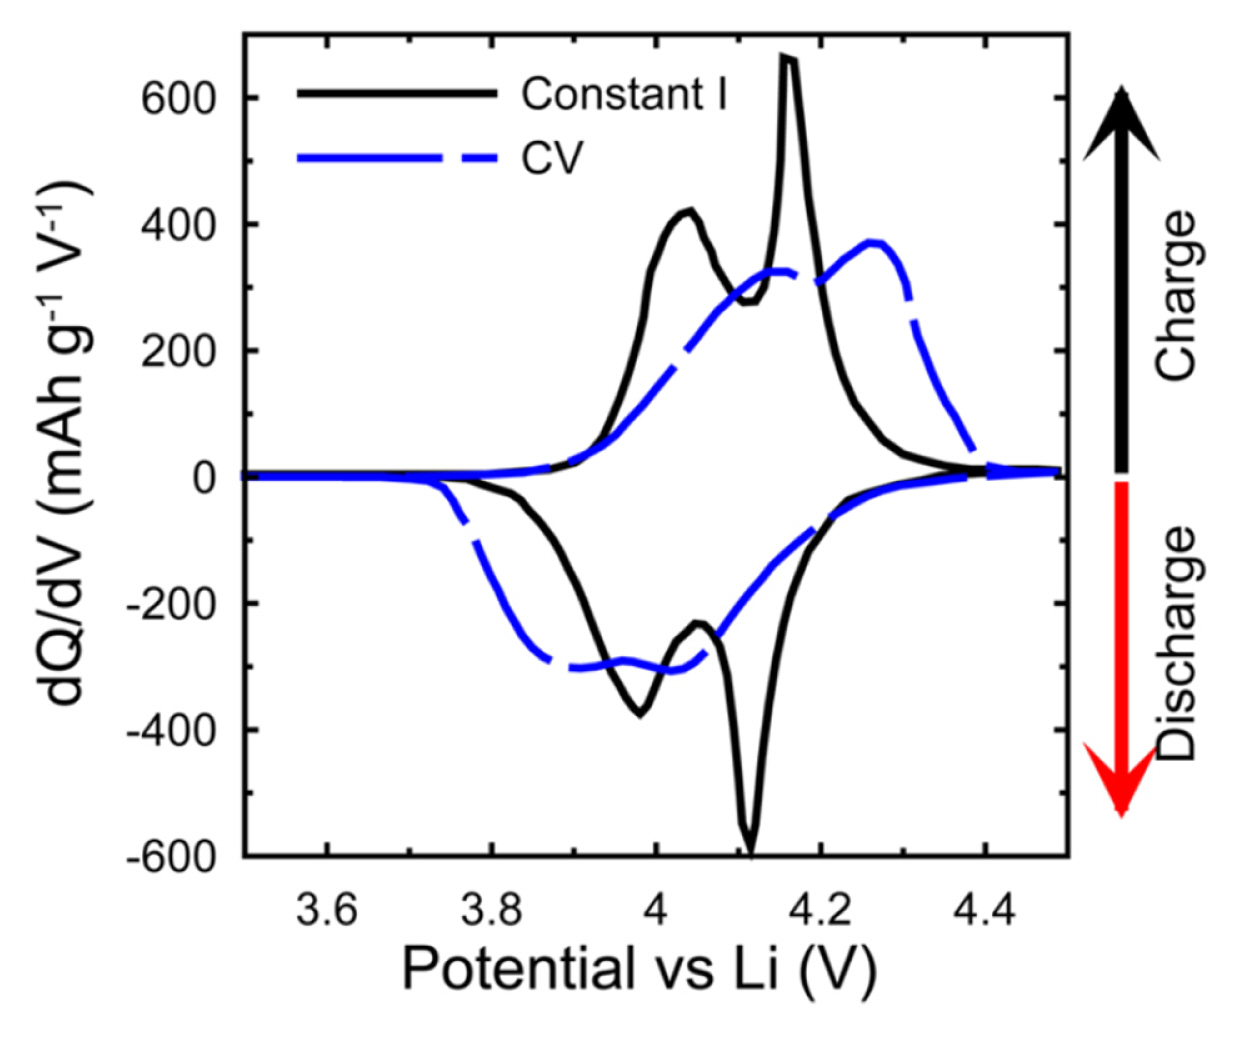
Therefore, before using dQ/dV plot, it is necessary to understand the commonalities and differences between CV and dQ/dV.
2.3 Equations of voltammetry for intercalation system
Fig. 3 shows a unique cyclic voltammogram that is distinguished by reversible, quasi-reversible and irreversible processes depending on the rate of charge transfer. One of the ways to distinguish each process is checking the change of cyclic voltammogram with various scan rates. Matsuda and Ayabe suggested the zone boundaries of reversible, quasi-reversible, and totally irreversible systems [14]. In a reversible processes, since the rate of electron transfer is rapid enough at the surface of electrode, the peak potential Ep is independent on the variation of scan rate v, and anodic (Ep,a) and cathodic (Ep,c) peak potential separation, is 59.0/n mV, ip,a/ip,c =1, in addition, the following equation is satisfied.
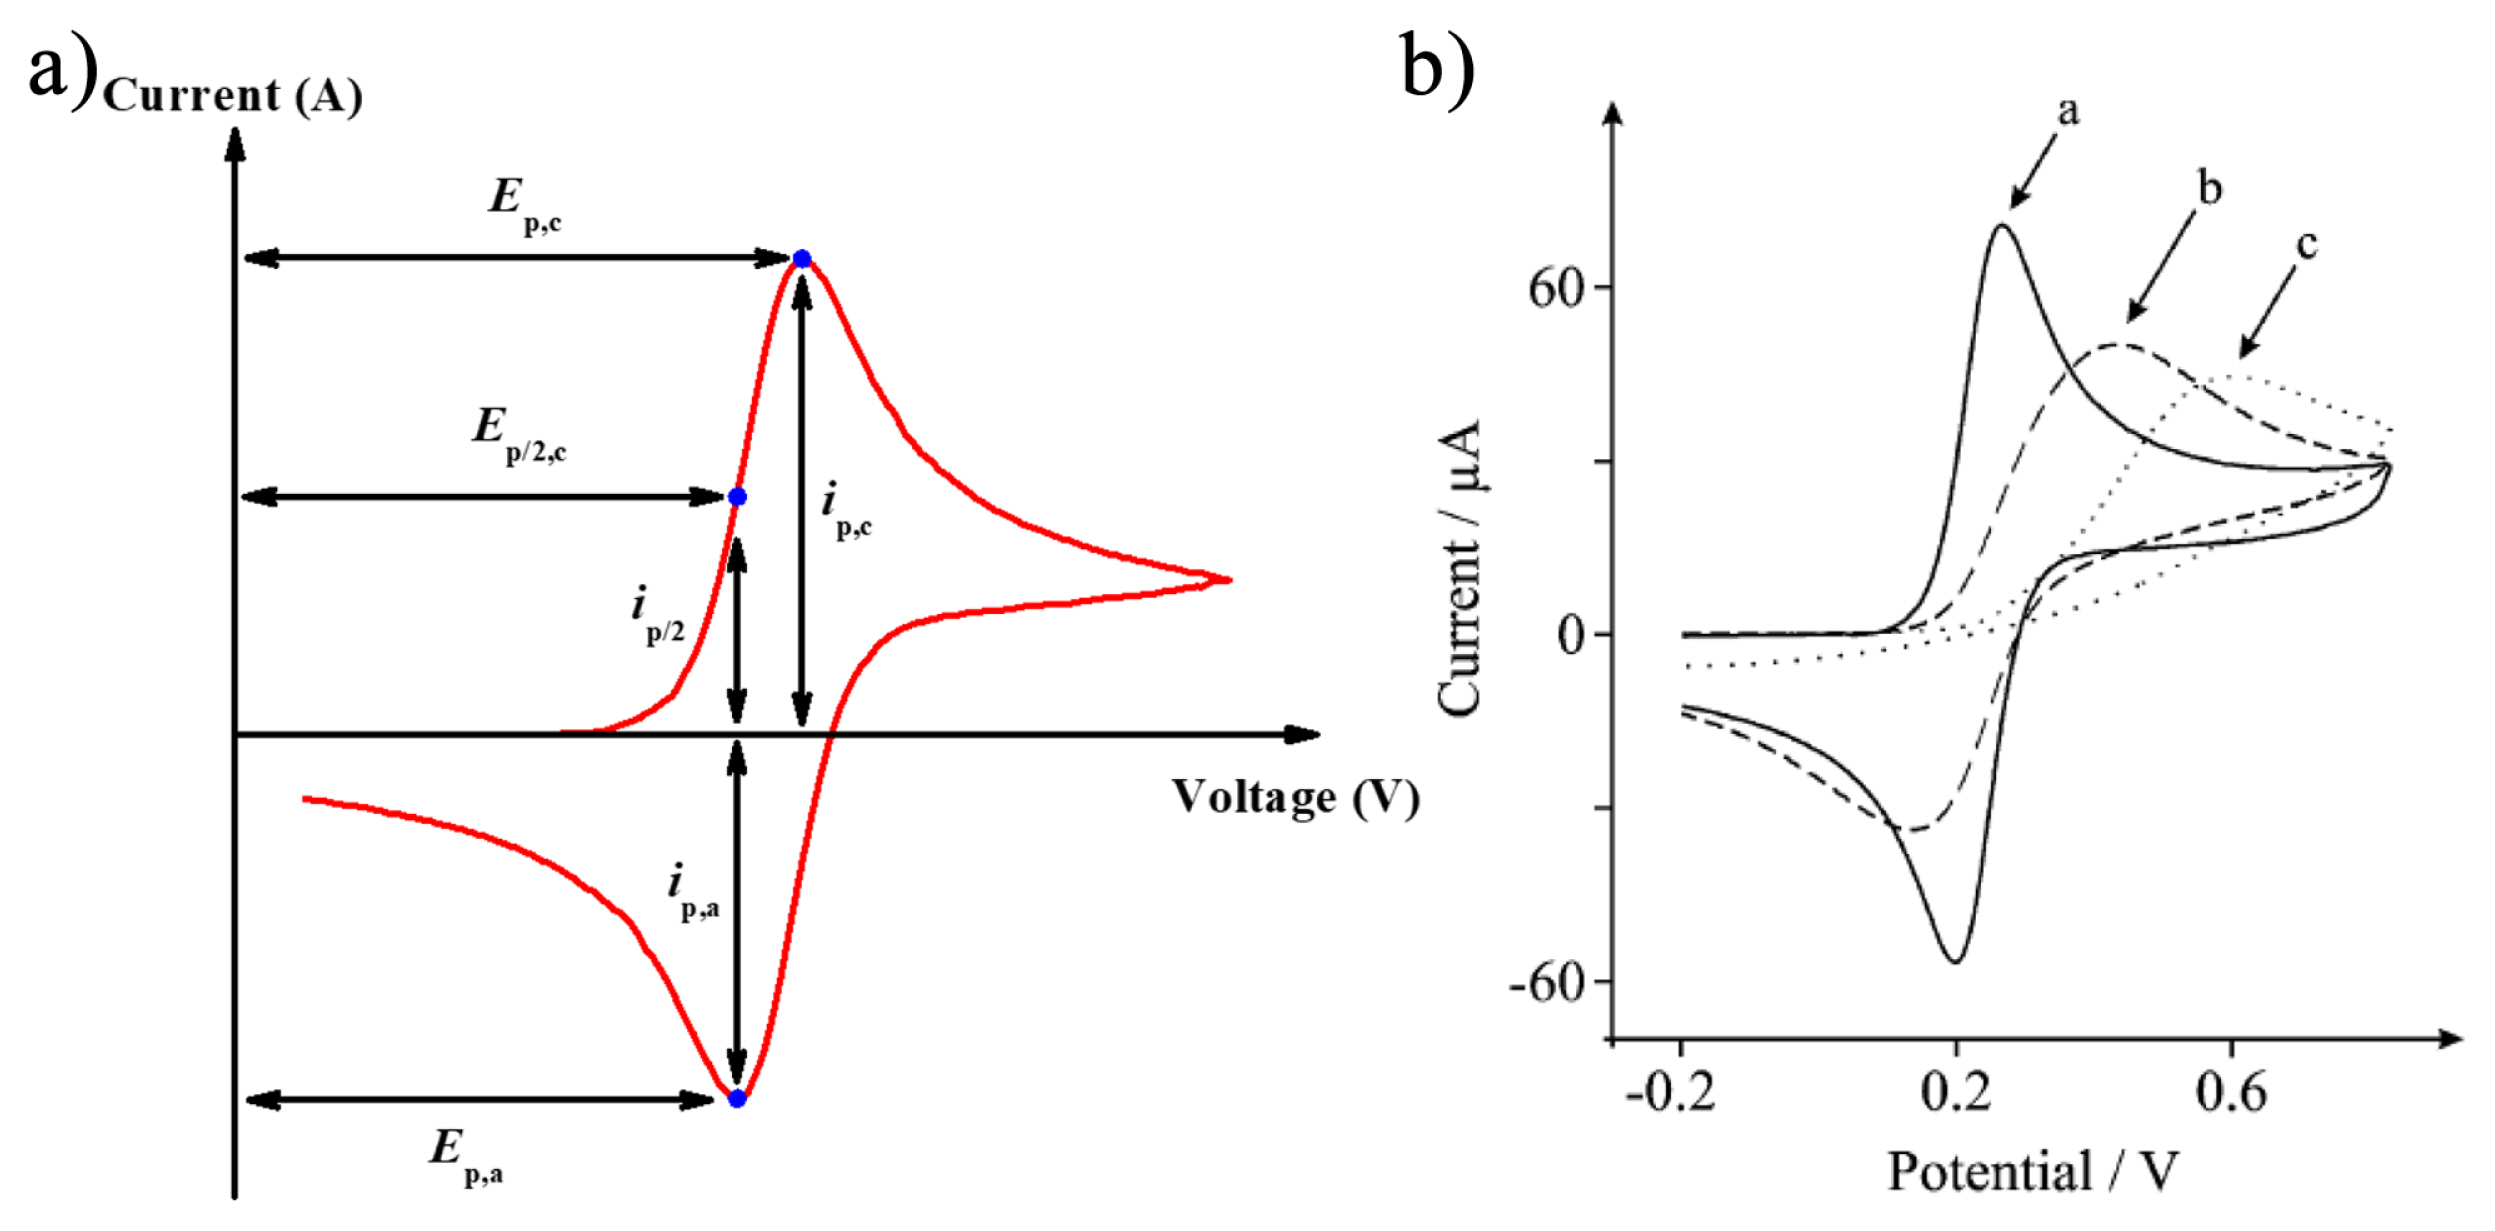
Unlikely, in a quasi-reversible process which show limitation of electron transfer kinetics, the peak potential is a function of scan rate. Li+ intercalation reactions tend to follow a quasi-reversible process since cathodic and anodic peaks are dependent on the scan rate [15]. The cyclic voltammogram of quasireversible process shows gradual peak shifts to higher potential value with an increase of scan rate than one of reversible process due to the overpotential.
The magnitude of the current
where n is the total number of electrons reacted per mole in the electrochemical process, A is the electrode area (cm2), C is the concentration of the electrode material at surface, and D is the diffusion coefficient.
However, above equation (6) would be difficult to adapt in the case of intercalation compounds for LIB. To obtain exact Li+ ion diffusivity, two boundary conditions should be considered according to the scan rate; i) a semi-infinite diffusion process (a fast scan rate) and ii) a finite diffusion process (a slow scan rate). In the case of the semi-infinite diffusion process, the peak current is proportional to the square root of scan rate. In contrast, the peak current is proportional to scan rate in the finite diffusion process, in which the anodic/cathodic reaction can be characterized by the following equation;
Considering the different diffusion behaviors induced by the scan rate, Aoki et al. generalized the equations for peak currents at all scan rates. The generalized equation is given by[16]
where β(= nFv(l 2/D)/RT) is a dimensionless characteristic time parameter, l means distance of electrode and F (=9.65 × 10⁴ C/mol) refer to Faraday constant.
2.4 Sweep rate voltammetry technique
In a battery system, electrochemical reactions occurs in the electrode through consecutive processes. Such electrochemical reactions can be clearly understood by using a CV technique based on the correlations between current, scan rate, and potential. The currents obey the power law, i.e.
where i is current (A), v is scan rate (mV s−1), and a,b are adjustable values. Then b value can be obtained by using simultaneous equations.
The b value can be explained by the sum of the faradaic (diffusion-controlled) and non-faradaic (capacitive) currents. If only diffusion-controlled reaction occurs without any faradaic reaction, the observed current would be proportional to the square root of the scan rate, v1/2, according to Randles-Sevcik equation, equation (6). On the other hand, the capacitive current (also called “non-faradaic” or “double-layer” current.) follows linearly to the scan rate;
where ic is the current for electric double-layer charging, A is surface area of electrode and Cd is the capacitance of electric double-layer. As can be seen from the above equation (10), the capacitive current is proportional to scan rate, v, therefore, the capacitive current is dominantly measured at a fast scan rate. On the contrary, the recorded current will be mainly associated with a diffusion-controlled reaction at a slow scan rate.
Therefore, the b value of total electrochemical reactions composed of diffusion-controlled and capacitive reactions will have values between 0.5 (diffusion-controlled) and 1.0 (capacitive). Set a log on both side of equation (9), then it can be plotted like Fig. 4a.
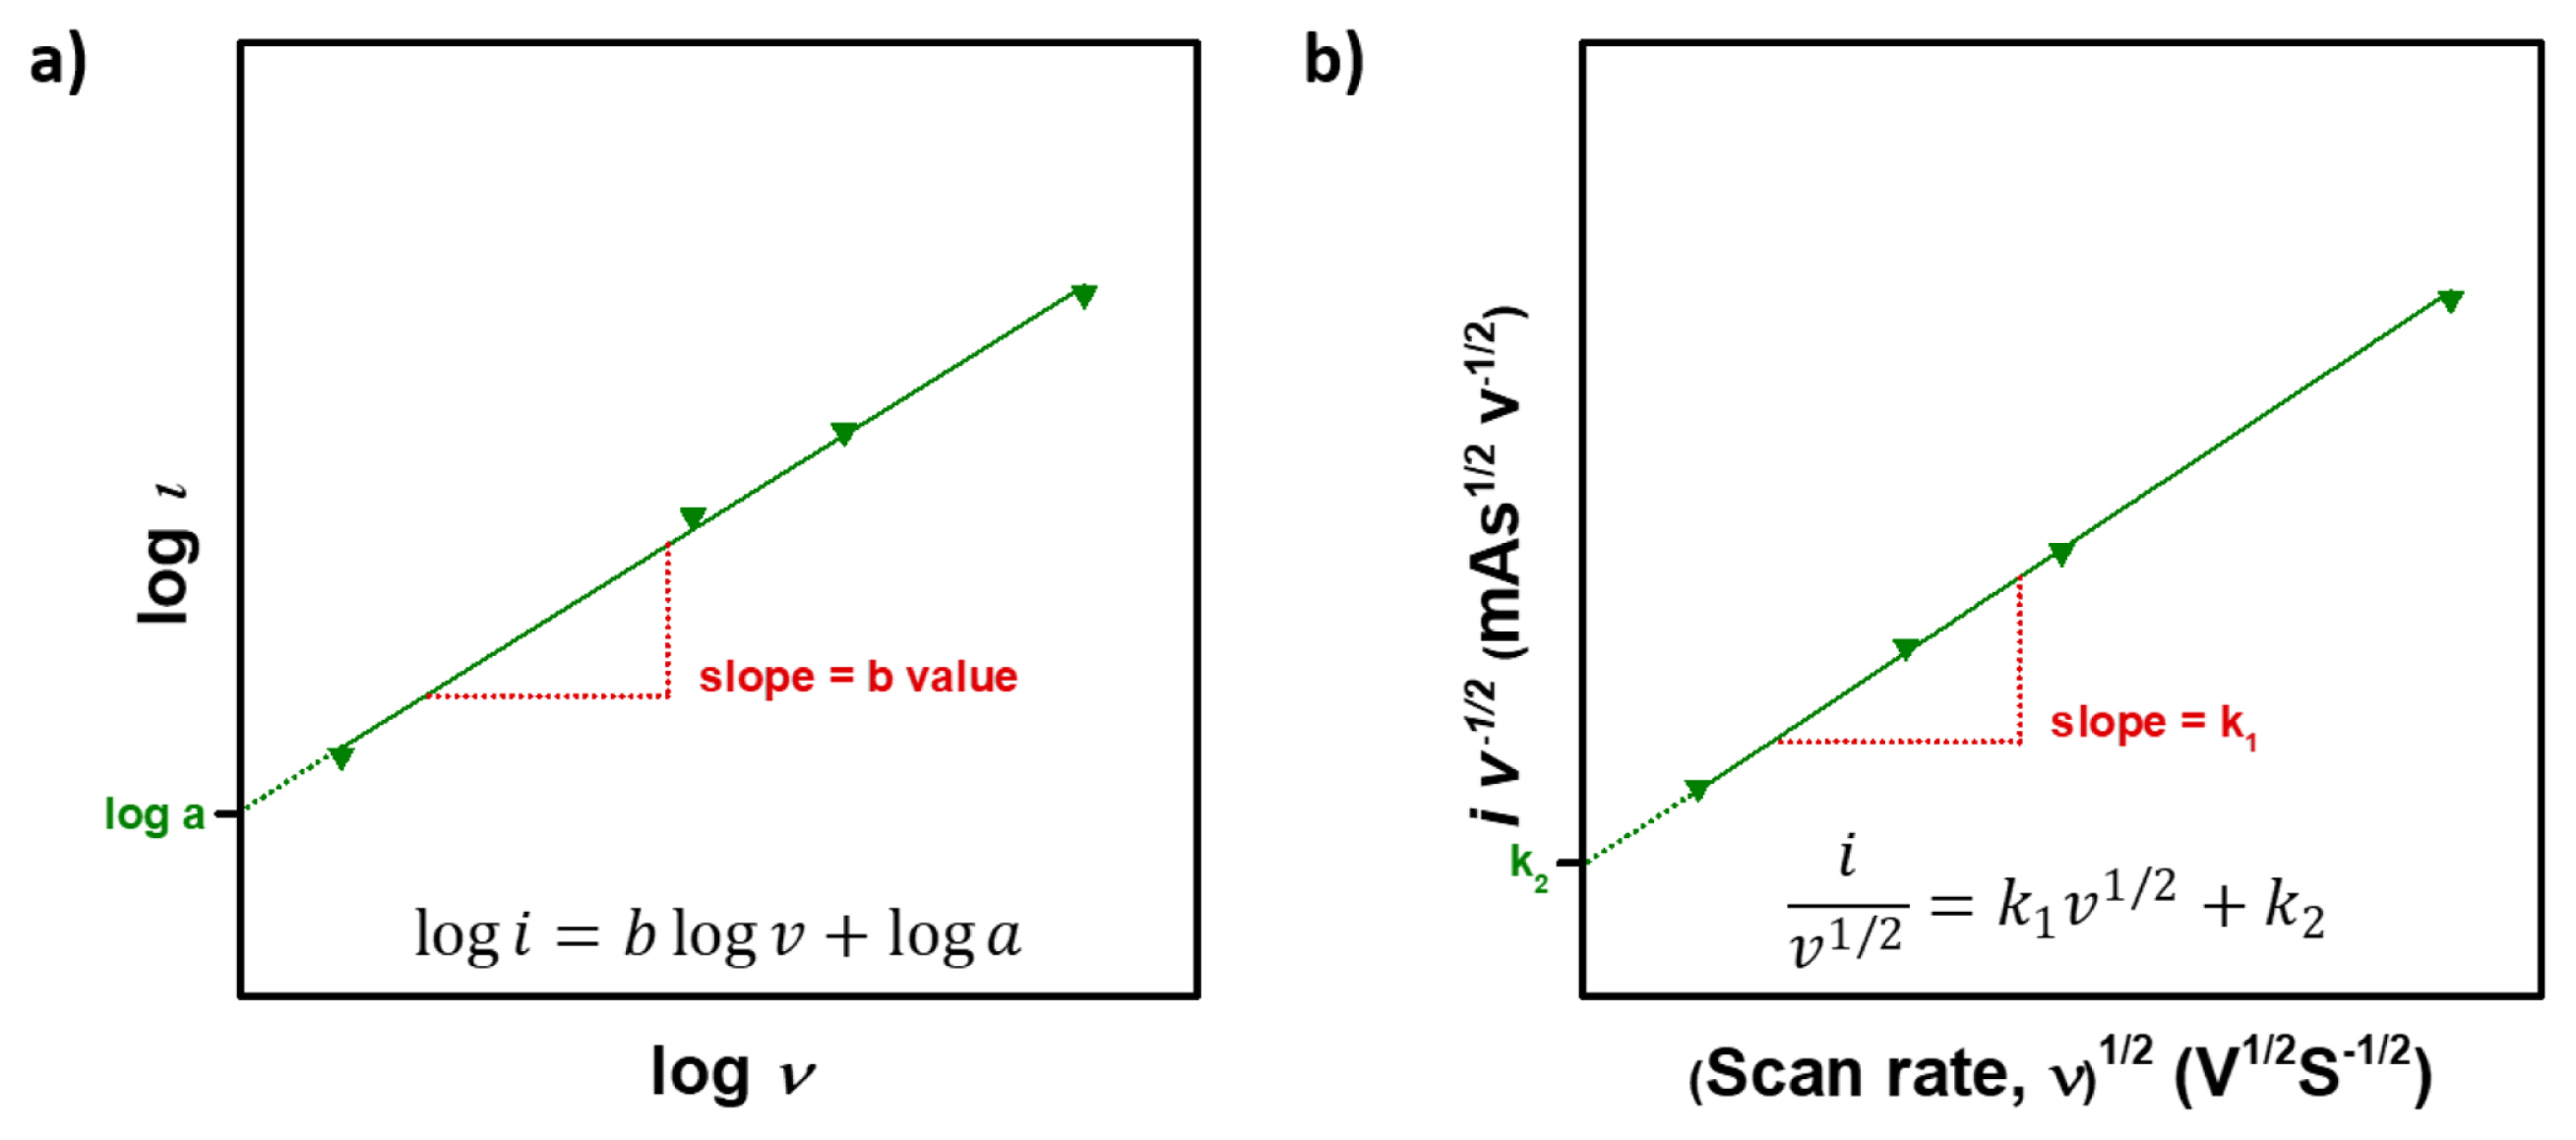
a) Log-scale plot of peak current dependence on the scan rate, b) The plot from equation (17) for analyzing sweep rate CV data.
Then, the total current at a specific potential is the sum of both the diffusion-controlled and capacitive reactions.
For analytical purposes, it can be slightly rearranged to,
In equation (15)k1v and k2v1/2 correspond to the current attributed to capacitive reaction and diffusion-controlled reaction, respectively. Then, k1 and k2 can be obtained through the linear fit of
2.5 Estimation of diffusion coefficient through voltammetry
In order to analyze the kinetics of active materials, we note the Randles-Sevcik equation, equation (6), describing the dependence of the peak current on the scan rate. If the kinetics of electrochemical reactions is only controlled by a single-phase diffusion without phase transition, the oxidation and reduction currents should have a linear dependence on the square root of the scan rate, v1/2. Like calculating b value, from the relationship of ip vs. v1/2, the apparent diffusion coefficient of Li+ (DLi+) can be obtained. If the Randles-Sevcik equation is considered as a linear equation, the plot for current ip as a function of the square root of the scan rate, v1/2, shows a linear correlation, and all variables can be found as constants. Like sweep rate CV technique, the diffusion coefficient can be obtained by linear fitting of the slope from the plot ip vs. v1/2;
The above equation is only valid when the phase does not undergo phase transformation during the lithiation/de-lithiation process, i.e., the single-phase diffusion, not multi-phase diffusion. This is an important prerequisite for calculating the diffusion coefficient.
2.6 Determination of specific capacity by voltammetry
When calculating the charge storage in a cyclic voltammogram with an asymmetric shape of the cathodic and anodic peaks, it is usually possible to obtain the integrated area of the cyclic voltammogram. The equation for the specific capacitance estimated from the cyclic voltammogram (i vs V plot) is as follows[17],
where C is the specific capacitance of electrode, in unit F g−1. is the voltage window and i(E) is the current.
The capacitance is constant in a fixed voltage window and is used to calculate the charge storage,
where ΔQ is the capacity (C or mAh) and ΔU is the voltage window (V). Further specific capacity (Q) in mAh g−1 was evaluated from the cyclic voltammograms using the following equation[18],
3. Factors affecting the shape of voltammetric curves
When evaluating the electrochemical performance, all internal and external factors of the battery should be further considered. Importantly, certain of these factors will directly affect the battery performance because material characteristics, cell configurations and experimental conditions might be various. In this part, we focus on the effects of particle size of active materials, electrolyte concentration, thickness of electrode, scan rate and operating temperature as influential factors for CV measurements.
3.1 Particle size
Particle size of active materials is one of the predominant factors directly affecting electrochemical performance. Size reduction induces an increase in the interfacial area of particles (i.e contact area with electrolyte) and shorten the diffusion length of Li+. As a result of enhancement in kinetics of redox reaction, the overall peak current increases at the same scan rate in the cyclic voltammograms. For these reasons, the same active material exhibits different electrochemical performance depending on its particle size. In practice, Yang et al, reported the different electrochemical behaviors in the cyclic voltammograms obtained from LFP nanoplates and microplates having different particle sizes at various scan rates (Fig. 5a) [19]. Wang et al, also showed the particle size effect of TiO2 on the cyclic voltammograms, in which the contribution of Li+ intercalation become smaller but that of capacitance increases by decreasing the particle size [21].

Factors affecting cyclic voltammetry. a) Particle size. Reprinted with permission from Ref. [19]. Copyright © 2010 The Royal Society of Chemistry. b) electrolyte concentration (difference concentration of 2 and 0.4 M), c) electrode thickness & scan rate (film thickness of 0.11 and 4.20 μm at difference scan rate of 4, 9, and 16 mV/s) and d) temperature (30, 35, 40, 45 and 50°C). Reprinted with permission from Ref. [20]. Copyright © 1997 American Chemical Society.
Furthermore, due to the diffusion-controlled Li+ intercalation reaction changed to surface reaction, the overall reaction shows faster kinetic reaction. Therefore, the electrochemical reaction mechanism could be tuned by control the particle size, showing different cyclic voltammograms. Liu et al. also mentioned some electrodes which is composed of various particle sizes of Si exhibit significant differences in cyclic voltammograms [22]. The characteristic alloying reaction peak of Si with Li+ is not clearly detected due to sluggish alloying kinetics of large-particle Si. However, a characteristic alloying reaction peak is more clearly observed in the small-particle Si, which means that the kinetics of the alloying reaction of Si can be effectively enhanced by the particle size reduction.
3.2 Electrolyte concentration
The peak currents are not related to the concentration of Li+ in electrolytes fundamentally, and also the peak split between cathodic and anodic peak has nothing to do with the concentration of electrolytes. However, Fig. 5b shows some extent of peak shift with electrolyte concentration. The reaction voltage of the Li intercalation reaction is related to kinetics of ions in the electrolyte. Basically, electrolytes serve as H+, Na+, and Li+ carriers and do not have a significant effect on the Li+ ion diffusion process within the electrode because the charge transfer reactions in the electrode is much slower than those in electrolyte. In the case of aqueous Na ion battery (SIB), however, the redox peaks corresponding to Na+ insertion and extraction are becoming sharper and closer, which indicates faster kinetics at high electrolyte concentrations [23]. As expected by Nernst equation, it is because the equilibrium potential shifts toward more positive direction as the electrolyte concentration increases. Some authors mentioned that the characteristic shifted potential with different electrolyte concentration depends on specific ions, such as H+, Na+, and Li+ [24,25].
3.3 Scan rate
In the cyclic voltammograms, peak separation is generally occurs by increasing the scan rate except for reversible process. This peak split is mainly caused by the following reasons; i) potential drops or increase of resistance due to a slow electron transfer or steric hindrance of electrolyte permeation (i.e. porous structure), ii) slow and quasi-reversible or irreversible electrochemical reactions15. In principle, the currents induced by the capacitive reaction and the diffusion-controlled reaction are proportional to v and v1/2, respectively (equation 6, 10). This is because the peak current becomes a semi-infinite diffusion process at a high scan rate, and in slow rate condition the peak current is proportional to the square root of the scan rate. Therefore, the general formula including the all of scan rate describe by Aoki et al as mentioned in equation (8). This is the basic principle of the sweep rate CV technique, which can analyze what reaction contributes to charge storage at fixed potential.
Many studies referred to CV with various scan rates have been reported, as shown in Fig. 5c, and most of the electrode materials tended to follow quasi-reversible processes in which the peak potential increased as the scan rate increased [20,21,26–32]. Sweep rate CV technique is used to obtain a clue as to how the mechanism of each electrode proceeds through the electrochemical reaction. This is described in detail in Sections 2.4 and 4.1.
3.4 Electrode thickness
As the electrode thickness increases, the peak split between cathodic and anodic peak also increases with scan rate increase, as shown in Fig. 6c. For the thin electrode condition, the entire portion of the electrode is in the uniform state and electrochemically active, so peak split changes are not so large. This means that both the surface and the bulk structure of the electrode have a uniform potential and are homogeneous. However, thick electrodes with scan rate increase show larger peak split compared to thin electrode, since Li+ ion diffusion from surface to bulk becomes more difficult [33]. The bulk potential of the electrode depends on distance from surface, which causes potential drop [20].


Comparison of Li ion diffusivity for anode and cathode materials obtained from CV and other analysis (GITT and EIS).
3.5 Temperature
In general, the peak current arising from a diffusion-controlled reaction is significantly affected by operating temperature [34]. Since the capacitive current is essentially independent on the temperature, a small peak split at higher temperatures indicates that diffusion-controlled reaction dominantly occurs at the surface of electrode. The rate of electrochemical reaction depends on the Li+ diffusion in the lattice of the active materials, and this diffusion process is temperature-sensitive. When potential is applied, the capacitive currents occur and the Helmholtz layer is continually reconfigured on the surface of electrode. The temperature dependence is significantly different between the capacitance of non-faradaic process and the diffusion-controlled reaction of faradaic process. When the peak split decreases at high temperatures, it indicates that the rate of electrochemical reaction becomes faster and the corresponding redox peaks can appear earlier [20] as shown in Fig. 5d.
4. Applications of voltammetry to the study of Li battery
4.1 Sweep rate voltammetry technique
A sweep rate CV technique is useful to investigate pseudo-capacitive electrochemical behaviors of cathode materials (e.g. Lithium-free LiF-MO) [30]. Unlike Li+ intercalating cathode materials, approximately 94% of the total capacity is derived from a surface-controlled reaction. As a result, they show excellent power capability maintaining a high discharge capacity of 110 mAh g−1 even at a high current density of 5000 mA g−1. The sweep rate CV technique provides an analysis of the pseudocapacitve electrochemical behavior of the surface-controlled reaction in LiF-MnO nanaocomposite.
On the other hand, the reaction mechanism of various anode materials have been extensively studied by using the sweep rate CV technique. For example, Bruce Dunn group have studied the electrochemical behaviors of Li+ intercalating anode materials such as Nb2O5 [28,29], TiO2[20,21,36] using the sweep rate CV. Based on equation (17), each contribution of capacitive and intercalation reactions to the total capacity of the anode materials was calculated at a specific voltage, as shown in Fig. 6c.
According to the fraction of capacitive current in the whole cyclic voltammograms in Fig. 6a and 6b, it is evident that the capacitance current and total capacity increase as the particle size decrease. Also, it can be seen that the mechanism changes depending on the change of the sweep rate, that is, the change of the charging time. In the case of Nb2O5, the b value is estimated to be almost 1.0 at a slow sweep rate (< 20 mV s−1), indicating a surface-controlled reaction. On the other hand, the b value decreases to 0.7 at a faster sweep rate (> 20 mV s−1). These differences with scan rate can come from ohmic contribution, including active material, SEI resistance, and/or diffusion limitations [37,38]. Since these results depend on the sort and the reaction mechanism of the electrode materials, it is necessary to closely examine the experimental conditions. According to the above paper, the capacitance effect of Nb2O5, TiO2, which is known that Li insertion reaction is the main mechanism, increases greatly depending on various conditions such as electrode thickness, particle size and sweep rate.
4.2 Estimation of diffusion coefficients
The sweep rate CV technique can be used for calculating the diffusion coefficients of both cathode and anode materials. In practice, it has been extensively used for various cathode materials such as layered [39], spinel [40], olivine [19,41], and even LiF-MO [30] nanocomposite. In addition, the overall average Li+ diffusivity of various anode materials also can be estimated. To clarify the reaction mechanism, it needs to analyze Li+ diffusivity when each phase transition occurs in the active materials. For example, spinel LiMn2O4 exhibits multiple phase transitions, LiMn2O4 → Li0.5Mn2O4 and Li0.5Mn2O4 → λ-MnO2, during the charge process. The corresponding Li+ diffusivities are calculated to be MnO2 are 4.63 × 10⁻¹² and 1.04 × 10⁻¹¹ cm2 s−1, respectively, and in the discharge process are 2.88 × 10⁻¹² and 1.68 × 10⁻¹² cm2 s−1, respectively. The Li+ diffusivity values obtained by the sweep rate CV are comparable to the diffusion coefficient calculated from PITT (1.9 × 10⁻¹² to 8 × 10⁻¹¹ cm2 s−1). Note that the sweep rate CV can be used for estimation of the diffusion coefficients in the single-phase reaction. However, the values of the diffusion coefficients obtained from the materials which undergo phase transition need to be carefully approached for their reliability.
On the other hand, some authors reported the difference of diffusion coefficient of active materials according to the analytical methods such as CV and EIS or GITT. Ding et al. [42]. claimed that different diffusion coefficients were obtained from nano-Si with values of 5.1 × 10⁻¹² cm2 s−1 and 10−12 cm2 s−1 by CV and EIS measurements, respectively. The diffusion coefficient measured by EIS is about 5 times lower than one calculated from GITT. A significant difference of diffusion coefficients of WO3 were also obtained by CV and GITT. The difference is even more pronounced at high scan rates (above 2 mV s−1), because the Randles-Sevcik method tends to generate large potential gradients in the active material, which greatly overestimates the diffusion coefficient. In addition, the characteristic is attributed to different equilibrium conditions between analytical methods. In practice, the EIS measurement is conducted under more equilibrium conditions (more relaxation time) compared with GITT. However, both methods show similar variation of Li+ diffusivity in silicon. The diffusion coefficient for single-phase reaction is more reliable when the slope of log (peak current) vs. log (scan rate) is 0.5 (i.e. diffusion-controlled). When Li+ transport is governed by the cell resistance, such relationship will be invalidated which is called as “cell-impedance-controlled” situation [43].
4.3 Stepwise voltage window technique
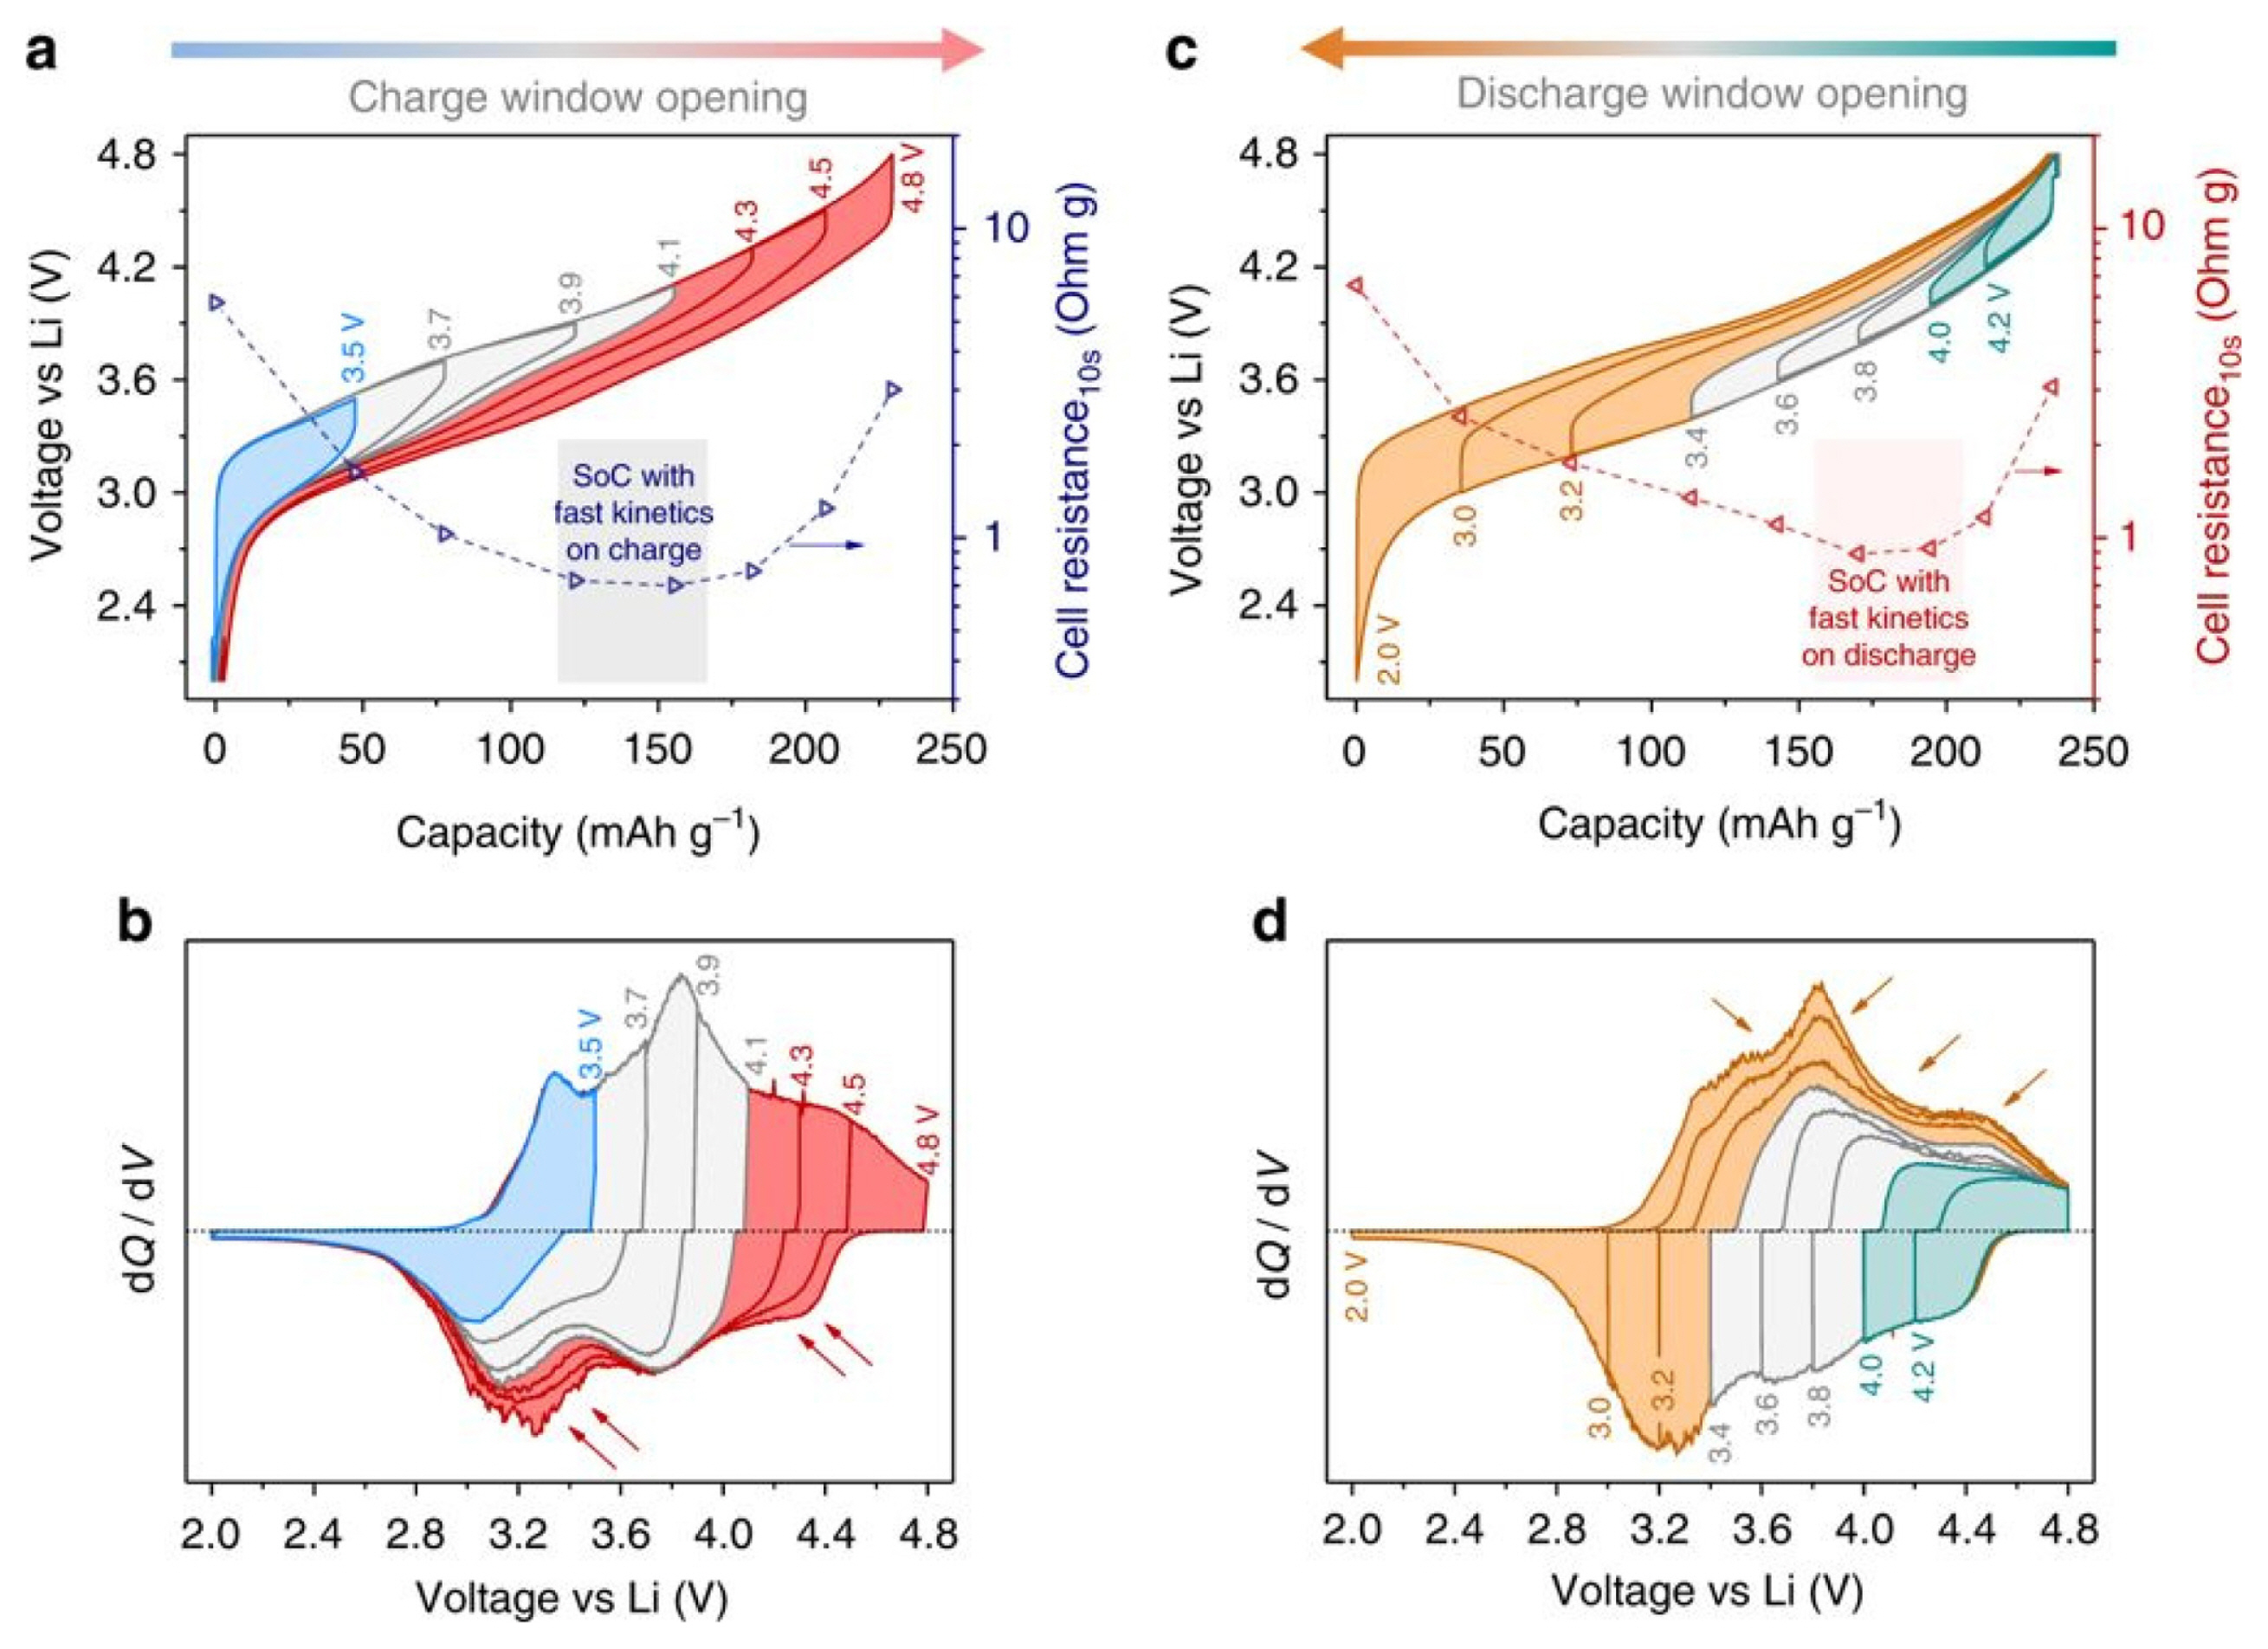
An useful application of the stepwise voltage window technique is an anionic redox analysis of LR-NMC( Li-rich Li1.2Ni0.13Mn0.54Co0.13O2) [44]. To clarify the reaction mechanism of Li-rich cathode materials, a lot of research has been carried out on anionic redox as well as cationic redox reactions in these days. The measurement proceeds with an increase of potential cut-off starting from a small value, gradually increasing to the existing voltage window after a few formation cycles. For example, in a voltage window from 2.0 to 4.8 V, the potential cut-off gradually increases from 2.0 to 3.5, to 3.7, to 3.9, and finally reaches 2.0 to 4.8 V. As shown in Fig. 7a, the voltage hysteresis appears noticeably beyond 4.1 V (red curves) when the charge voltage window starts to increase gradually from 2.0 V. In the corresponding dQ/dV curve, it was observed that the charge capacity beyond 4.1 V is only partially recovered on reduction at a high voltage and the remaining reduction took place at a low voltage (below 3.6 V). The charge compensation above 4.1 V (red curves) can be assumed to be the contribution of anionic oxidation, since the cationic oxidation is nearly finished at about 4.1 V. Similarly, in Fig. 7c and 7d, anionic redox reaction is clearly visible at reductions of less than 3.4 V. It shows that the voltage hysteresis due to anionic redox reaction appears asymmetrically during the charge-discharge process.
5. Conclusions
Cyclic voltammetry (CV) is an electrochemical analysis technique that is widely used in various fields of electrochemistry, enabling the analysis of electrochemical redox reactions of active materials by recording the current according to voltage change. It is useful for determining the redox reaction potential, and furthermore, understanding the thermodynamics and kinetics of the electrochemical systems in detail. It was also found that different cyclic voltammograms were derived from various factors such as particle size of active materials, thickness of electrode, electrolyte concentration, operating temperature and scan rate of experimental conditions. In addition, it can be used for quantitative analysis of the current attributed to surface- and diffusion-controlled reactions, and the Li+ diffusivity of each reaction by varying the scan rate. Furthermore, anionic redox, which is mainly studied in Li-rich cathode materials, can also be analyzed through a stepwise voltage window technique.
In this mini-review, we briefly introduce the fundamental principle of cyclic voltammetry, and its applications for research in LIB. As technology is increasingly sophisticated, the role of state-of-the-art analytical technology is becoming more important. However, it should not be blindly pursued without an understanding of basic electrochemistry. For a better understanding of electrochemistry and batteries, cyclic voltammetry will provide us plenty of ideas about the overall electrochemical mechanism.
Acknowledgment
This work was supported by the National Research Foundation of Korea (NRF) grant funded by the Korea government (MSIP) (No. NRF-2017R1A4A1015770). This work was also supported by the National Research Foundation of Korea (NRF) grant funded by the Korea government (MSIP) (No. NRF-2019R1A2C2003731). W.C. acknowledges NRF Grant funded by Korean Government (NRF-2016H1A2A1910157-Global Ph.D. Fellowship Program).
Supporting Information
Supporting Information is available at https://doi.org/10.33961/jecst.2019.00619