Improving Electrochemical Performance of Ni-rich Cathode Using Atomic Layer Deposition with Particle by Particle Coating Method
Article information
Abstract
Atomic layer deposition (ALD) enhances the stability of cathode materials via surface modification. Previous studies have demonstrated that an Ni-rich cathode, such as LiNi0.8Co0.1Mn0.1O2, is a promising candidate owing to its high capacity, but is limited by poor cycle stability. In this study, to enhance the stability of the Ni-rich cathode, synthesized LiNi0.8Co0.1Mn0.1O2 was coated with Al2O3 using ALD. Thus, the surface-modified cathode exhibited enhanced stability by protecting the interface from Ni–O formation during the cycling process. The coated LiNi0.8Co0.1Mn0.1O2 exhibited a capacity of 176 mAh g−1 at 1 C and retained up to 72% of the initial capacity after 100 cycles within a range of 2.8–4.3 V (vs Li/Li+). In contrast, pristine LiNi0.8Co0.1Mn0.1O2 presented only 58% of capacity retention after 100 cycles with an initial capacity of 173 mAh g−1. Improved cyclability may be a result of the ALD coating, which physically protects the electrode by modifying the interface, and prevents degradation by resisting side reactions that result in capacity decay. The electrochemical impedance spectra and structural and morphological analysis performed using electron microscopy and X-ray techniques establish the surface enhancement resulting from the aforementioned strategy.
1. Introduction
Lithium ion batteries (LIBs) have been extensively applied to several devices such as smartphones, laptops, and tablet PCs, and their market has expanded drastically. Due to the growing demand for electric vehicles (EVs) and energy storage systems (ESSs), LIBs with increased energy density are thus essential. Low cost and highly stable electrodes are the key to the commercial success of LIB. LIBs are in high demand because of their high capacity for energy storage and their necessity after the production of renewable energy.
Lithium cobalt oxide (LCO) has been predominantly used as a cathode in LIBs over the past decades owing to its high capacity and stability [1,2]. However, LCO is insufficient for application in the battery packs of EVs or ESSs. Most importantly, cobalt is very expensive and relatively less abundant, and its supply-chain is very unstable. However, the replacement of a portion of Co with the less expensive Ni in LiNixCoyMn1−x−yO2 (1 < x, y < 1), also called Ni-rich cathode, may yield potential material with high capacity. Increasing the Ni content in Nirich cathode could result in a capacity exceeding 200 mAh g−1. Meanwhile, the commercial use of the Ni-rich cathode requires that certain limitations be addressed. One of these limitations is the capacity fade caused by cation mixing where Ni in the transition metal layer moves to the Lithium (Li) layer owing to the almost similar radii of Ni2+(0.69 Å) and Li+(0.76 Å) ions. This phenomenon typically occurs during synthesis at high temperature and the iterative charge/discharge process [3]. Increased Ni content increases the severity of cation disordering as Ni occupies Li sites, thus hindering intercalation reactions and reducing available sites, and resulting in a capacity decay [4].
Side reactions between electrodes and electrolytes also occur. The oxidation state of Ni is increased to 4+ after charging, making it highly reactive with electrolytes, and thus O2 gas is released from the lattice. Due to this parasitic reaction, an irreversible Ni–O like phase is formed, deteriorating the electrochemical performance [5]. Safety risks such as thermal runaway could occur as a result of O2 gas generation [6].
Lithium hexafluorophosphate (LiPF6), an extensively used Li salt in electrolytes is decomposed spontaneously to lithium fluoride (LiF) and phosphorous pentafluoride (PF5) [7]. LiF, which has low conductivity, attaches to the surface of the electrode, and acts as a barrier for Li diffusion. In the presence of water in the electrolyte, hydrogen fluoride (HF) can be formed from LiPF6 which can detach transition metals from the Ni-rich cathode [8]. Thus, these side reactions cause continuous capacity fading during charging and discharging. To prevent these undesired reactions, many studies have adopted coating techniques [9–11]. The coating layer can physically separate the electrode from the electrolyte and prevent parasitic reactions. Hence, the presence of coating layer reduces the particle surface exposed to electrolyte and also mitigate the penetration of electrolyte into the particle. And some coating materials can remove the species which can cause deteriorating effect like transition metal dissolution. Many previous studies have reported surface coating in wet process with materials like ZrO2, SiO2, Li2TiO3, Li3PO4, and AlF3 [12–16]. Typically, surface coating in wet process involves a solution and heating process through which the cathode particle cannot be completely surrounded with coating material, thus exposing some areas to attack by non-aqueous electrolyte species [17].
In this study, atomic layer deposition (ALD) was used to coat cathode particles. Upon comparison to other solution techniques, ALD was observed to be a non-solution coating technique with uniform and conformal layers that exhibited a high degree of control over the possible number of layers or level of thickness of coating. The ALD process is conducted at a relatively low temperature, to avoid damaging active materials as is the case in solution techniques that are subjected to high temperature and a highly reactive process [18]. In the ALD process, precursors and purge gas are alternately injected into the chamber in vacuum state. The number of cycles of the alternate injection of precursors and purge gas into the chamber represents the atomic-level thickness of the layer. This technique can thus control the thickness of the coating layer via the number of cycles performed. Al2O3 was used as coating material, which can act as a scavenger of HF, thus suppressing the dissolution of transition metal [19,20]. With the aid of Al2O3 coating via ALD, capacity retention at 1 C improved from 58 to 72% in sol-gel synthesized LiNi0.8Co0.1Mn0.1O2.
In our previous report [19], prefabricated electrodes of the commercial NCM811 (typically synthesized by co precipitation) were coated via ALD. In contrast, the pristine NCM811 in this study was synthesized in-house through the sol-gel method and particle ALD coated, thus improving the capacity of pristine from 167 to 173 mAh g−1. Upon performing a comparison analysis of 10 cycles of coated samples, the in-house sample yielded an initial capacity of 176 mAh g−1 compared to the commercial sample which could only yield a mere 144 mAh g−1. Unlike our previous study wherein ALD coating for large scale electrodes was impossible, in this study, the particle ALD coating process and the results demonstrated commercial viability through an easily adoptable technique. Additionally, the synergistic improvement in capacity as well as stability of inhouse NCM811 was systematically achieved and analyzed using relevant characterization techniques such as electron microscopy and X-ray techniques.
2. Experimental Section
2.1 Synthesis of LiNi0.8Co0.1Mn0.1O2 and ALD coating
LiNi0.8Co0.1Mn0.1O2 was prepared via the sol-gel method. A mixture of LiCH3COO·2H2O (99%, Alfa Aesar), Ni(CH3COO)2·4H2O (98%, Sigma Aldrich), Co(CH3COO)2·4H2O (98%, Sigma Aldrich), and Mn(CH3COO)2·4H2O (99%, Sigma Aldrich) with a molar ratio of Li:Ni:Co:Mn = 1.05:0.8:0.1:0.1 was dissolved in distilled water (Solution A). Citric acid (99%, Sigma Aldrich) which served as a chelation agent was dissolved in distilled water in another beaker (Solution B), and then poured into solution A slowly (the molar ratio of citric acid to total metal ions was 1:1). The mixture of the two solutions was stirred and heated at 80°C to remove the liquid phase. After the solution was completely vaporized, a greenish-blue gel was formed, dried at 120°C in vacuum oven for 24 h, and then ground for minutes. The ground gel powder was preheated at 480°C for 5 h in air in a box furnace to decompose acetate and organics, and subsequently ground slightly, forming dark-brown powder. LiNi0.8Co0.1Mn0.1O2 was finally obtained after the calcination of the dark-brown powder at 800°C for 10 h in O2 in a tube furnace.
ALD was used to coat the obtained LiNi0.8Co0.1 Mn0.1O2 with Al2O3. The obtained cathode powder was placed in the chamber in vacuum state at 100°C, and trimethyl aluminum (TMA), which is the first precursor, was supplied into the chamber. The N2 gas was then purged to remove extra TMA except the TMA layer directly adsorbed onto the surface of the powder. Afterward, the second precursor water vapor was injected into the chamber to react with the first precursor (TMA) to form Al2O3. Finally, the N2 purge process was repeated. This is the cycle of ALD coating that was repeated 10 times (10 cycles of ALD coating). The two rate limiting steps of Al2O3 in ALD growth are expressed as follows [21–23]:
2.2 Material characterization
High Resolution X-ray Diffraction (HR-XRD, Cu Kα, D/max Ultiam III, Rigaku Co.) was performed within the 2θ range of 10–90° to observe crystal structures. The composition of synthesized LiNi0.8Co0.1 Mn0.1O2 was analyzed through inductively coupled plasma optical emission spectroscopy (ICP-OES, Avio 500, Perkin Elmer). Scanning electron microscopy (SEM, Gemini 500, ZEISS) was used to observe the morphology and size of the synthesized LiNi0.8Co0.1Mn0.1O2. High resolution-transmission electron microscopy (HR-TEM, TECNAI F20 UT, FEI) was conducted to confirm the formation and the thickness of the coating layer. Energy dispersive x-ray spectrometer (EDX) attached to TEM, and X-ray photoelectron spectroscopy (XPS, K-alpha+, Thermo Fisher Scientific) were used to measure the elemental composition of the bulk and coating layer of the coated LiNi0.8Co0.1Mn0.1O2.
2.3 Electrochemical test
The electrochemical test on pristine LiNi0.8Co0.1Mn0.1O2 (P-NCM) and coated LiNi0.8 Co0.1Mn0.1O2 (A-NCM) was performed using CR2032 coin cells which were assembled in an Ar-filled glove box. For the cathode material, P-NCM and A-NCM were used. Li metal was used as an anode and 1 M LiPF6 in EC:DMC (1:1 v/v) was used for the electrolyte. Glass fiber and Celgard 2302 were added to serve as a separator. Cathode active material weighing 2.5 mg was mixed with 0.5 mg of Ketjen black (carbon additive) and 0.5 mg of teflonized acetylene black-binder (TAB-binder) with the addition of ethanol to make a dough. The dough mixture was pressed on a stainless-steel current collector and dried in a vacuum oven at 160° C for 4 h, yielding cathode.
The charge/discharge tests were conducted at 1 C rate (180 mA/g) within the range of 2.8–4.3 V versus Li/Li+ using a BTS2005W charger (NAGANO). Cycle performance was analyzed at rates of both 1 and 2 C. Before and after cycling, electrochemical impedance spectroscopy (EIS, SP-150, Bio logic) were performed to observe the change in the charge-transfer resistance. Rate performance was then conducted at 0.1, 0.2, 0.5, 1, 2, 3, to 0.1 C, and each C-rate was repeated 5 times.
3. Results and Discussion
3.1 Material characterization
Sol-gel synthesized samples were analyzed for structural changes and impure phases using the XRD. In Fig. 1a, phases corresponding to all major peaks were identified and found to match ICSD-10199(LiNiO2) suitably. This confirms the layered structure of the LiNi0.8Co0.1 Mn0.1O2(NCM811) cathode active material with a hexagonal α-NaFeO2 structure belonging to the R-3m space group. No significant shifts in peaks positions were observed after Al coating indicating that coating occurred on the surface only without modification of the bulk structure. The XRD peak for Al was rendered insignificant by the thin layer of coating. Thin layer coating is essential for efficient surface modification effects. No impurities other than NCM811 phases were observed.
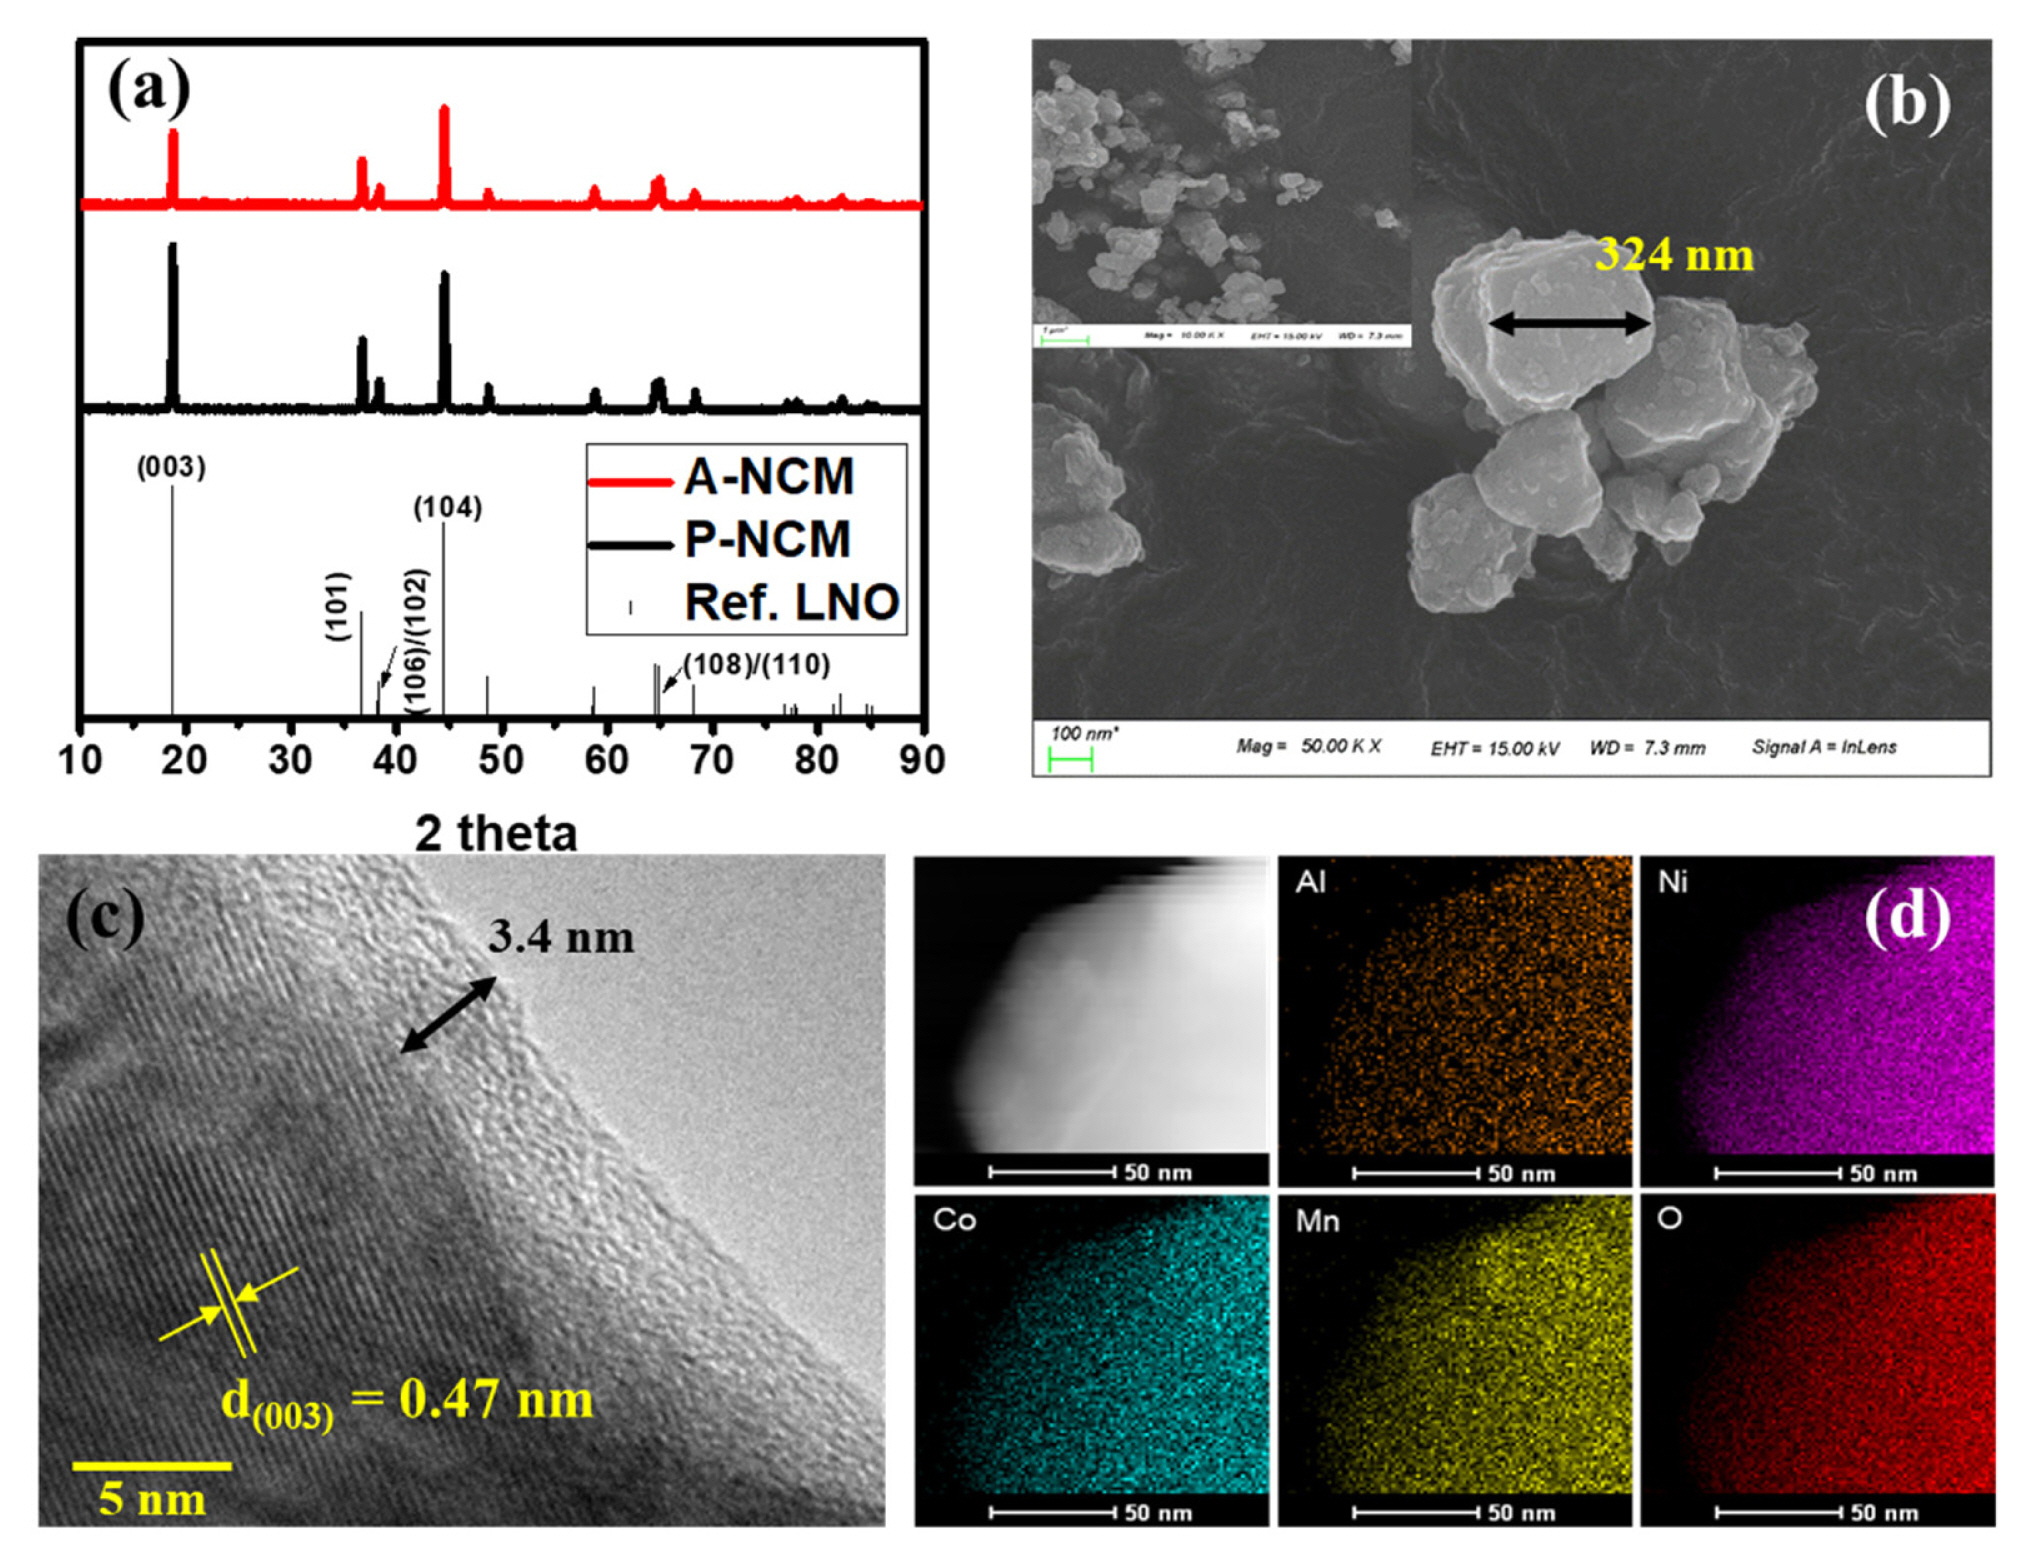
(a) XRD patterns for synthesized P-NCM and A-NCM; (b) SEM images of synthesized P-NCM; (C) TEM image of 10-cycle A-NCM; (d) EDX mapping of A-NCM sample.
The molar stoichiometry of synthesized NCM811 was further confirmed using ICP-OES data. Based on the ICP-OES data presented in Table 1, a similar stoichiometry of elements was confirmed as desired, proving the successful synthesis of NCM811 via the sol-gel method. To understand the structural morphology, SEM images were captured, as shown in Fig. 1 b. The particles were approximately 300–500 nm in size with few agglomerates and rough surface textures. The preparation technique is a critical determinant of the shape and size of the synthesized particle. In contrast to solid state synthesis where the distribution range of the particle size is wide, the solgel synthesis has relatively better control over size range. Similarly sized particles exhibit better capacity than their compact counterparts in many cases [24,25].

ICP-OES data for synthesized LiNi0.8Co0.1Mn0.1O2.
To further analyze the coating layer thickness and its morphology, TEM images were obtained. The image in Fig. 1c image affirms the thin layer of Al2O3 coating above NCM811 with a uniform thickness of approximately 3.4 nm and lattice fringes were clearly observed with an interplanar distance of 0.47 nm at (003) plane. Notably, the coating was formed ex-situ by ALD deposition. Typically an amorphous and rigid coating increases by approximately 2 in thickness per cycle and can grow slightly larger in the presence of H2O [22,23,26]. Thus, coating layer thickness observed after the 10 cycles is consistent with that reported in earlier reports. The thickness of the coating is critical, as greater thickness can hinder intercalation activity and lesser thickness can have no effect. The mapping of elements Al, Ni, Co, Mn, and O is presented in d. A high concentration of Al mapping toward outer layers of particles confirms the surface level coating of Al upon NCM.
In Fig. 2, XPS spectra for coated LiNi0.8Co0.1Mn0.1O2 and pristine LiNi0.8Co0.1Mn0.1O2 (inset), shows the surface presence of Al2O3 in ALD deposited electrode. The only Al 2p peak located at 74.1 eV confirms [27] the presence of only Al2O3 without other oxide impurities. This confirms the outer coating layer displayed in TEM consisted of amorphous Al2O3 only. The samples were further analyzed with respect to their electrochemical behavior.
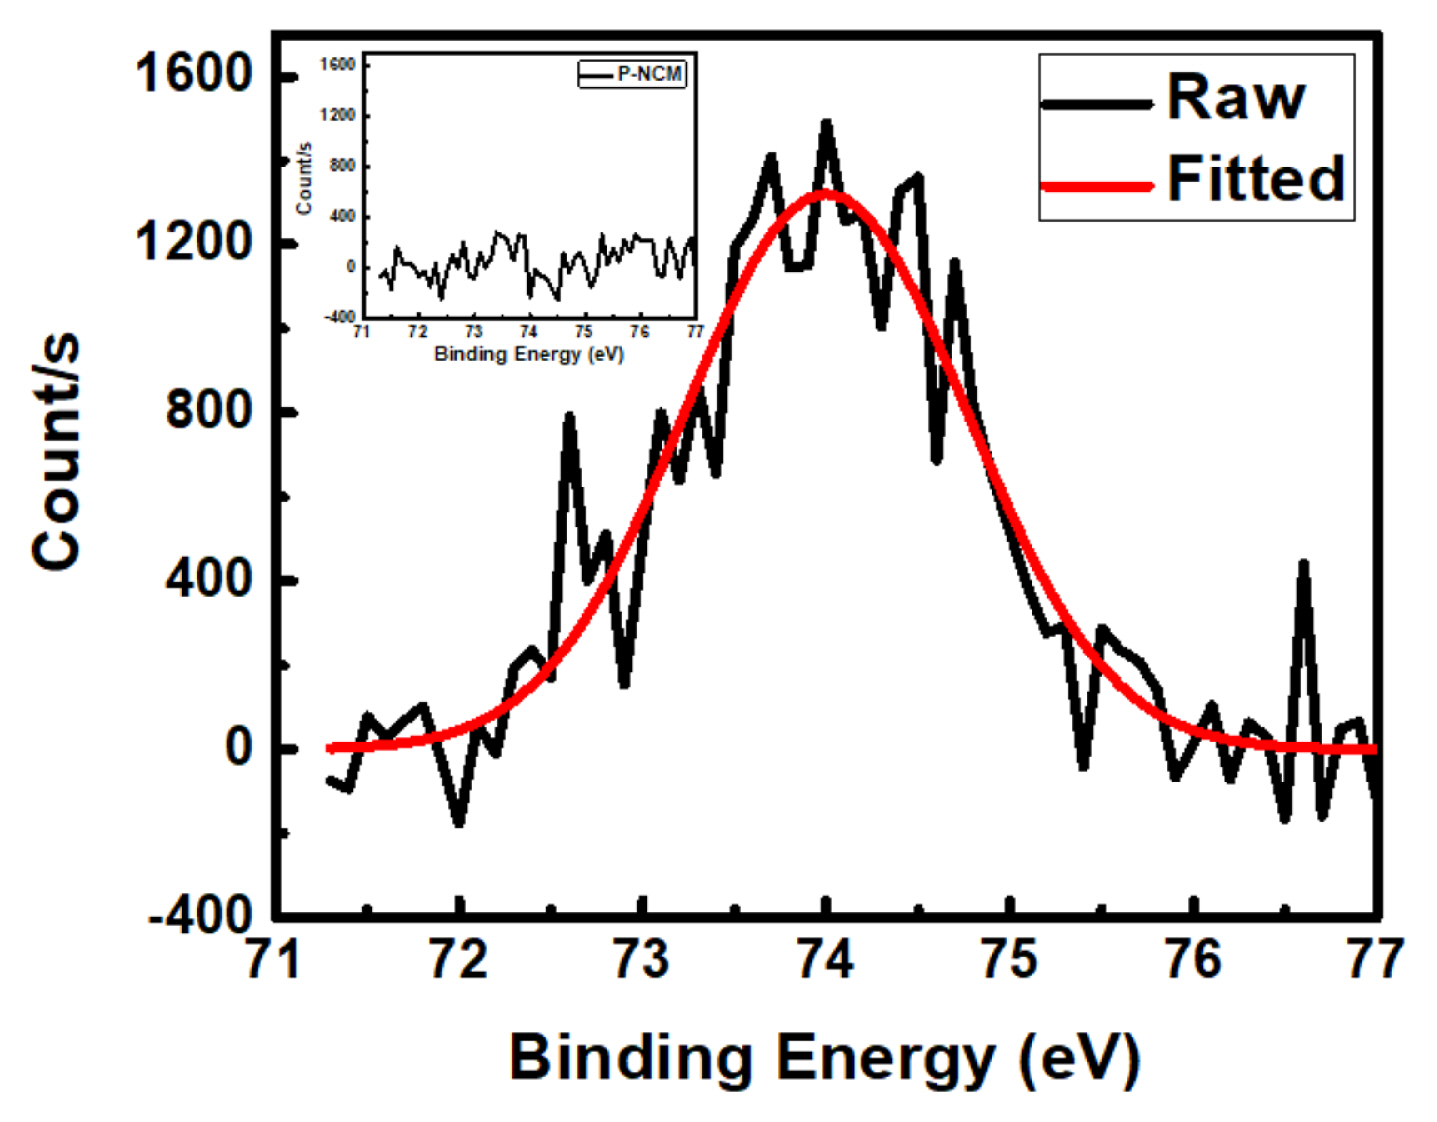
XPS spectra of Al 2p peaks for A-NCM sample with P-NCM (inset)
3.2 Electrochemical characterization
Initial charge/discharge curves are presented in Fig. 3a and 3b. Charge/discharge tests were conducted at 1 C rate and 180 mA g−1) in the potential range of 2.8–4.3 V. The initial charge capacity of pristine LiNi0.8Co0.1Mn0.1O2 (P-NCM) was 195 mAh g−1 and during initial discharge, P-NCM showed a capacity of 173 mAh g−1. Meanwhile, ALD coating was performed systematically and with increasing numbers of cycles, the increase in capacity was observed. Significant increase in capacity was observed after 10 cycles of Al2O3 coating on the LiNi0.8Co0.1Mn0.1O2 (A-NCM) sample, yielding a capacity of 200 mA g−1 during charging and 176 mA g−1 during discharging. The critical coating thickness was achieved at 10 cycles beyond which the coating acted as a barrier, hindering Li ion diffusion and leading to capacity fade. Upon comparison of the voltage plateau for both samples during discharging, A-NCM showed higher discharging voltage, indicating that the coated sample had more energy density and higher capacity than pristine sample did. This phenomenon is not uncommon and was observed in a previous study [25]. At 2 C (Fig. 3b), pristine (P-NCM) displayed an initial charge and discharge capacity of 176 and 152 mAh g−1, respectively. In contrast, the coated samples could deliver charge and discharge capacities of 183 and 157 mAh g−1, respectively. Despite the decrease in coulombic efficiency after coating (86.4%–85.8%), the initial charge and discharge capacity increased, as did the charge/discharge at 1 C, where coulombic efficiency decreased from 88.7% to 88.0%.
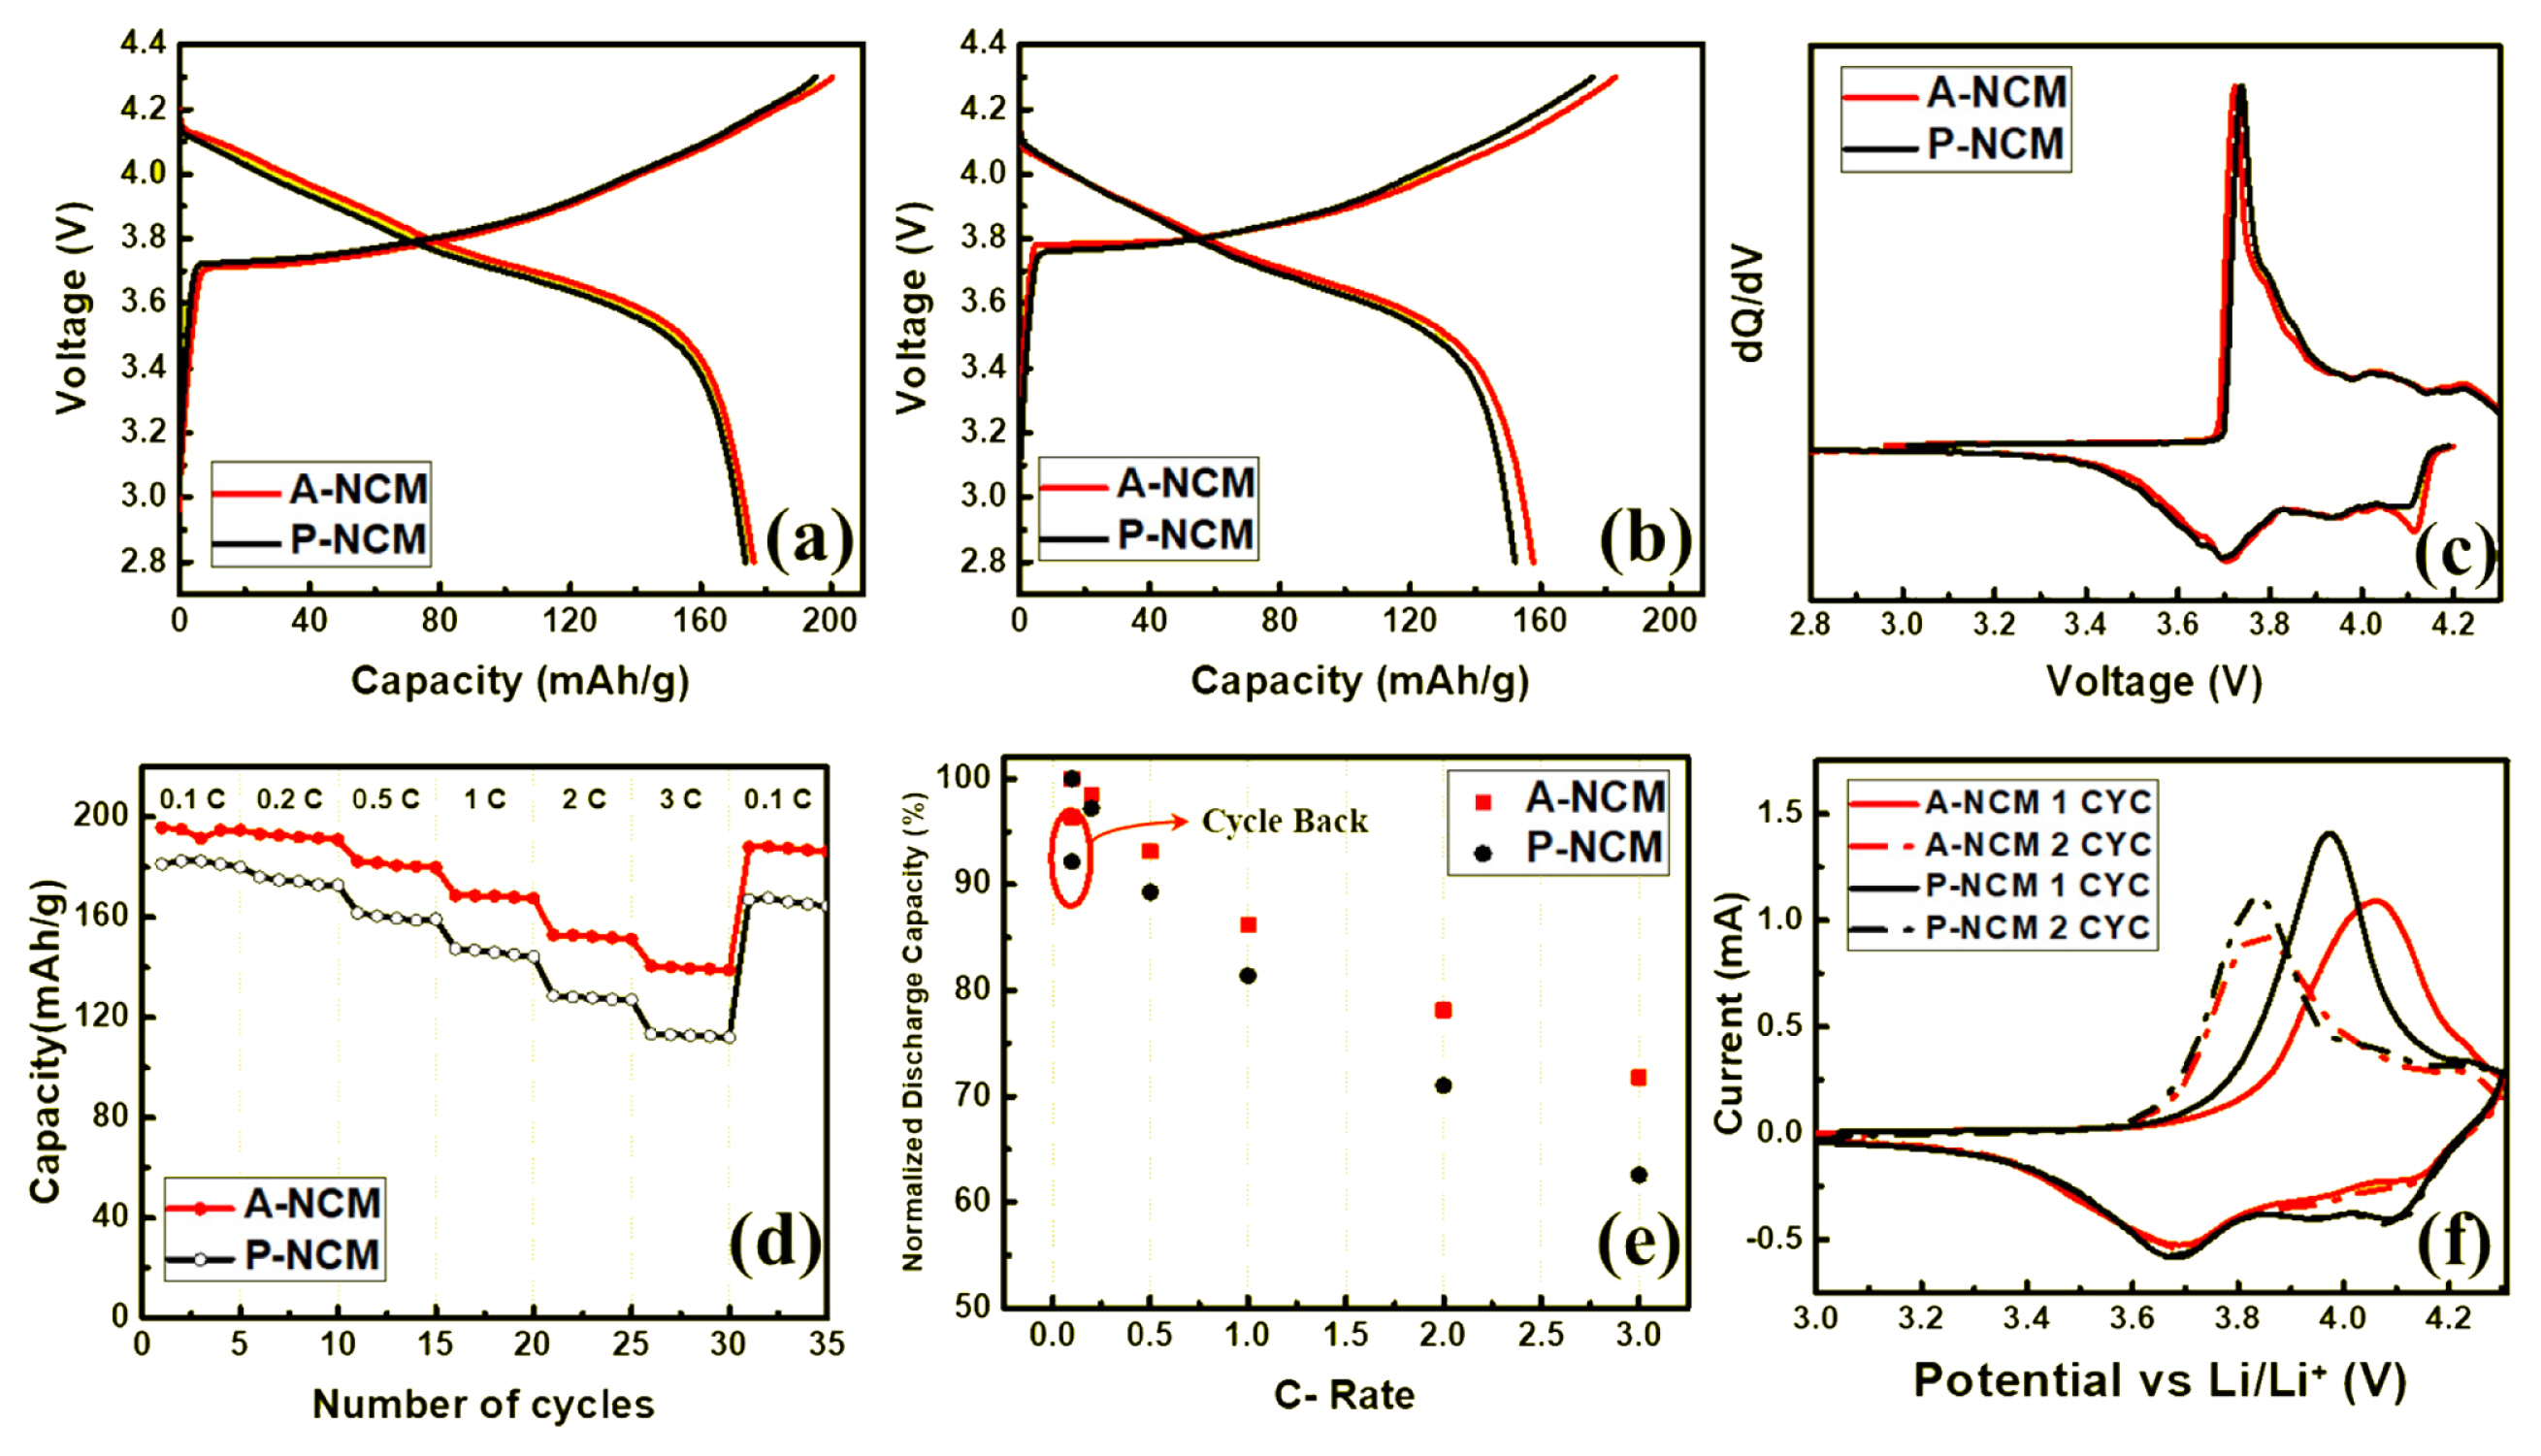
Initial charge/discharge curves of P-NCM and 10-cycle A-NCM cathode material (a) at 1 C (180 mAh g−1), and (b) at 2 C (360 mAh g−1) rate; (c) dQ dV−1 profiles for P-NCM and A-NCM at the initial cycle; (d) rate performance and (e) normalized discharge capacity of P-NCM and A-NCM at various C-rate. (f) cyclic voltammogram for A-NCM and P-NCM at the scan rate of 0.1 mV/s.
Differential capacity versus voltage (dQ/dV) was calculated using the initial charge–discharge curves at 1 C, as shown in Fig. 3c. The peak at 3.73 V in the pristine sample indicated the redox reaction of Ni2+–Ni4+. However, in A-NCM, the peak was shifted to a lower voltage, which indicated that this reaction occurred at a lower voltage, resulting in lower polarization and resistance after coating. This result also demonstrated the reason A-NCM showed higher initial capacity and lower discharging voltage plateau at 1 C compared to P-NCM.
Rate capabilities were measured at various C-rates within a voltage range of 2.8–4.3 V at 25°C in Fig. 3d. The ALD coated sample yielded 196, 193, 182, 169, 153, and 141 mAh g−1 at 0.1, 0.2, 0.5, 1, 2, and 3 C, respectively; for one back cycle to 0.1 C, a capacity of 188 mAh g−1 was measured. However, for PNCM, capacities of 181, 176, 162, 147, 129, 113, and 167 mAh g−1 was measured at 0.1, 0.2, 0.5, 1, 2, and 3 C, respectively, indicating that the coated sample A-NCM showed higher capacity than P-NCM at all C-rate intervals. At a relatively higher C-rate, a significant difference in capacity between pristine and coated samples was observed due to thin and uniform coating, and its synergistic effect on improving the capacity of NCM. When cycled back to 0.1 C, the capacity of A-NCM almost recovered to the previous capacity at 0.1 C, indicating higher reversibility, but in P-NCM, the capacity fade was inevitable. The effect of the coating on discharge capacity is adequately illustrated in e where the discharge capacity is normalized to the initial discharge capacity at 0.1 C. This yields a magnitude of capacity loss with an increase in C-rate. For P-NCM, the capacity fade from 0.1 to 1.0 C, which is a 10-fold higher C-rate, resulted in significant reduction in capacity (up to 19%) and further worsened to 38% at 3.0 C. Conversely, the coated sample displayed superior Li diffusion with higher capacity at a higher C-rate. Coated sample A-NCM merely lost 14% of its initial capacity from 0.1–1.0 C rate and 28% when the rate was increased to 3.0 C, which is only 2/3 of its pristine counterpart. However, translating it to real capacity values, for the A-NCM with already significantly higher capacity, the resultant capacity at 3 C was significantly higher. Upon cycling back to 0.1 C, the coated A-NCM could retain up to 96% of its initial capacity, whereas the P-NCM could retain a mere 92%. This significant reversibility was possible owing to the Al2O3 protection layer which had a synergistic effect with NCM and high capability for faster Li ion diffusion during fast charge–discharge processes with high reversibility.
Cycle performances of P-NCM and A-NCM at 1 and 2 C along with coulombic efficiencies are shown in Fig. 4. In Fig. 4a, the discharge capacity of A-NCM maintained a rate of 127 mAh g−1 after 100 cycles, retaining 72% of the initial capacity. P-NCM could retain only 58% of its initial capacity at 101 mAh g−1 after 100 cycles. This indicates that the cycle performance of Ni-rich cathode significantly increased after Al2O3 coating using ALD. Here the outer layer of Al2O3 acts a scavenger by reacting with HF as follows:
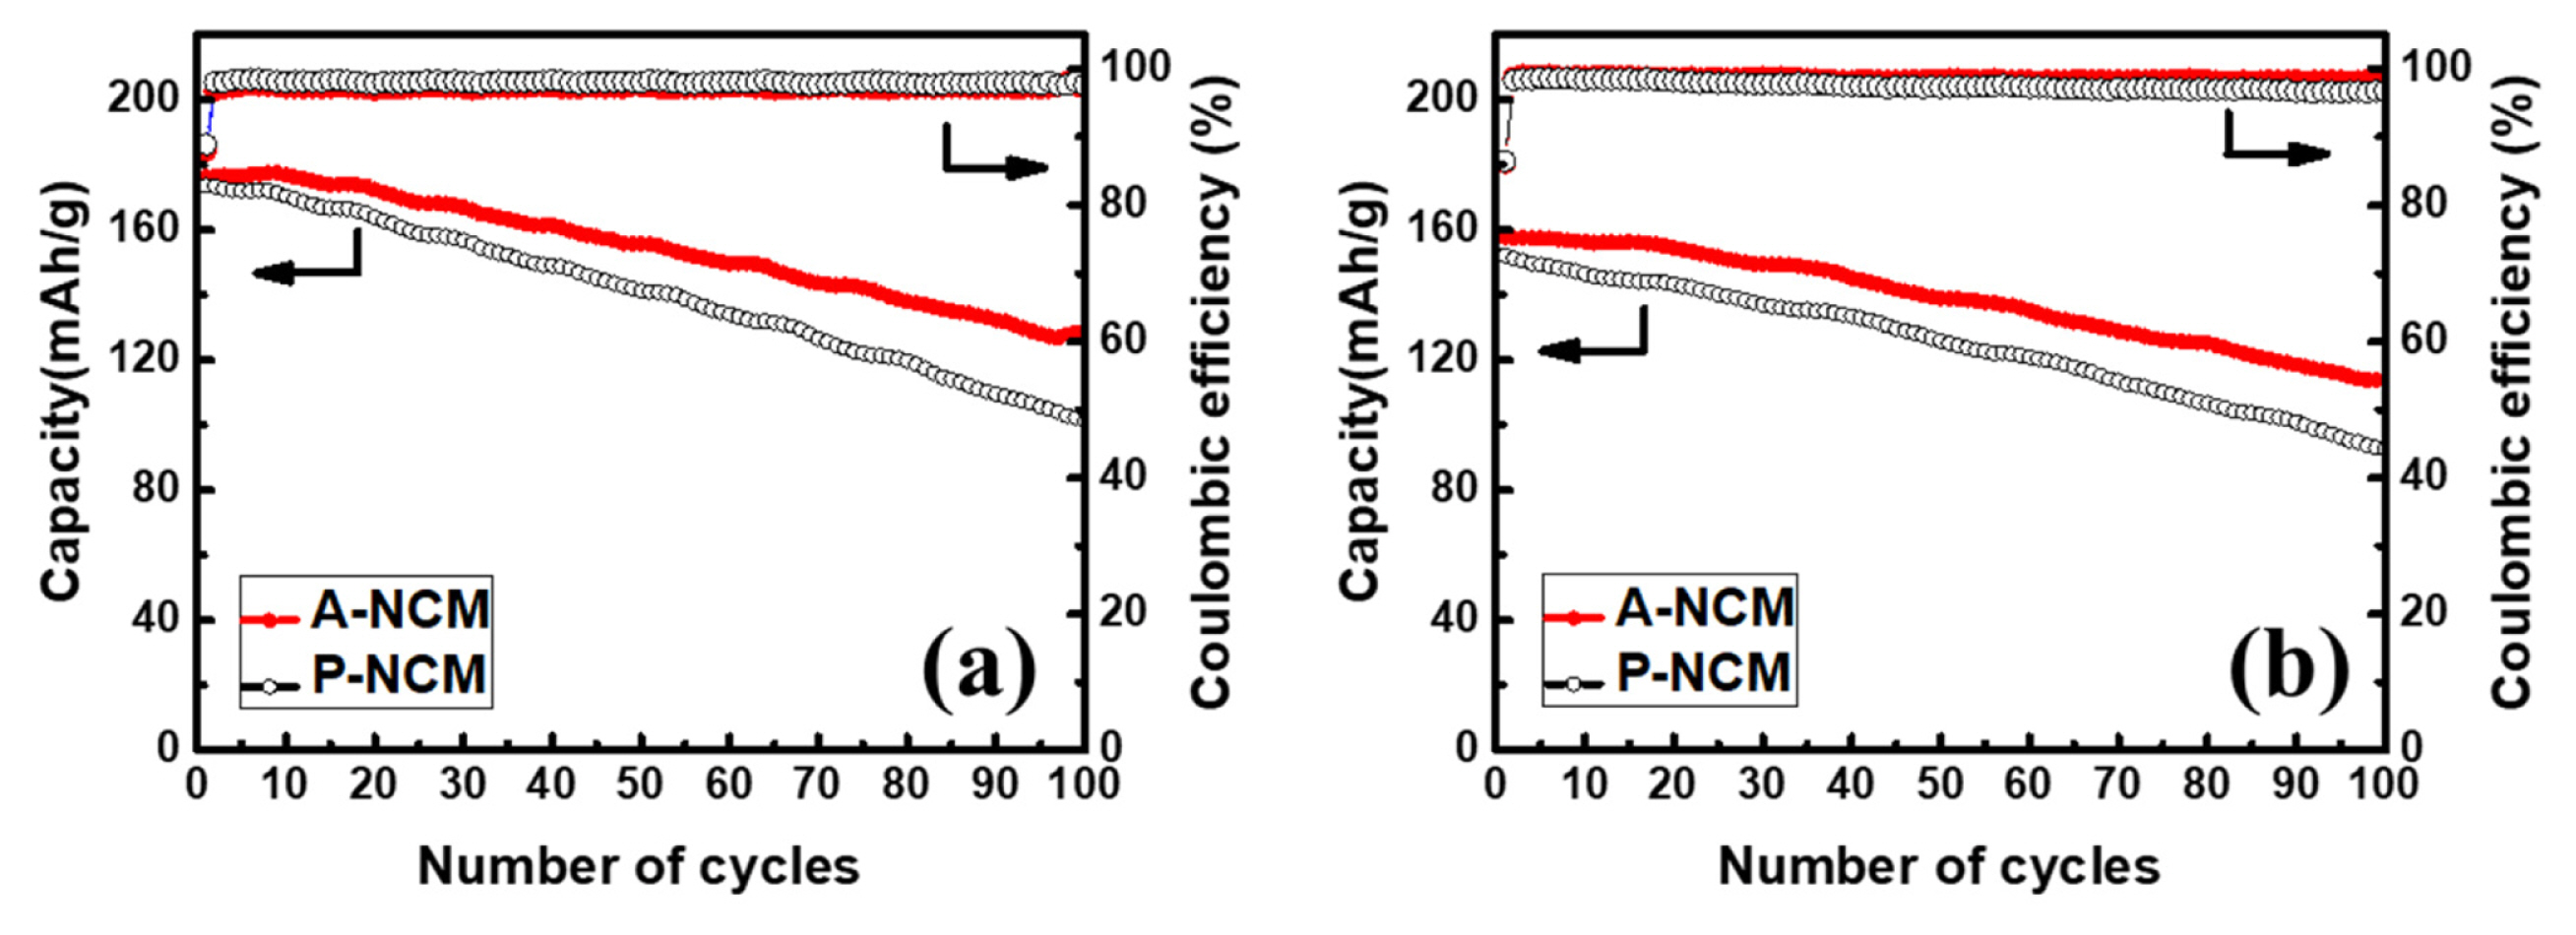
Cycle performance of P-NCM and 10-cycle A-NCM for 100 cycles (a) at 1 C, and (b) at 2 C rate.
This scavenging activity had a tremendous effect on cycle stability of A-NCM. whereas in A-NCM, during the end of the charging process, the Ni4+ state was present. This Ni4+ metal state in octahedral 3a sites, moved to Li sites (octahedral 3b) at a delithiated state. Ni4+ ion is also highly irreversible and thus its capacity loss is inevitable [19]. Conversely, in pristine P-NCM, the NCM is directly exposed to electrolyte and creates an interface. This interface is highly reactive to the HF that is present in the electrolyte resulting in decomposed products such as LiF, LixPFy and LixPOyF2 along with other gaseous products such as CO2 and alkanes [19,28]. The thin and uniform coating layer of Al2O3 on electrode material, as shown by TEM and XRD images acts as a protection layer from electrolytes, suppressing the side reactions that decay the capacity while cycling. Even at high currents of 2 C, the retention of A-NCM was 72.2%, which was higher than that of P-NCM. This demonstrates the efficacy of ALD coating in electrode material even in harsh conditions such as high C-rates, and its relevance to practical application such as fast charging.
EIS spectra were recorded to observe the changes in resistance after coating and cycling in . The EIS curves are a good fit for the calculated and an equivalent circuit proposed thereof. Fig. 5a and b show the state before and after 100 cycles at 1 C, the values of Rs (electrolyte resistance) from high to medium frequency range representing mainly the electrode–electrolyte interface, Rsf (surface resistance) and Rct (charge-transfer resistance). Each fitted value of resistance is listed in Table 2. Before cycling, Rct of ALD coated A-NCM was smaller than that of pristine P-NCM. The smaller Rct could be the main reason behind A-NCM showing higher initial charge/ discharge capacity at 1 C. Logically, the amorphous coating should be an additional resistance component to the pristine surface. However, EIS spectra exhibited antonymous behavior because of the perfect synergistic sync between the NCM surface and the Al2O3 coating layer. Smaller Rct in A-NCM was observed when compared to P-NCM even after cycling. An additional component of surface resistance, Rsf, appeared, indicating the plaguing reactions occurring on the surface leading to capacity decay. A comparison of the EIS spectra of A-NCM in 1 C and 2 C after cycling (Fig. 5b and c) showed that the Rsf remained almost the same, indicating minimal and consistent surface deterioration in coated A-NCM samples. In contrast, in P-NCM, the Rsf increment was significant, which is in good agreement with the faster and high magnitude capacity decay of P-NCM material. Thus, in addition to acting as a barrier from parasitic reactions, the Al2O3 coating layer enhances capacity by improving charge-transfer kinetics and thus improving overall energy density. A schematic depicting the enhanced stability effect of ALD coating in NCM is provided in Fig. 6.
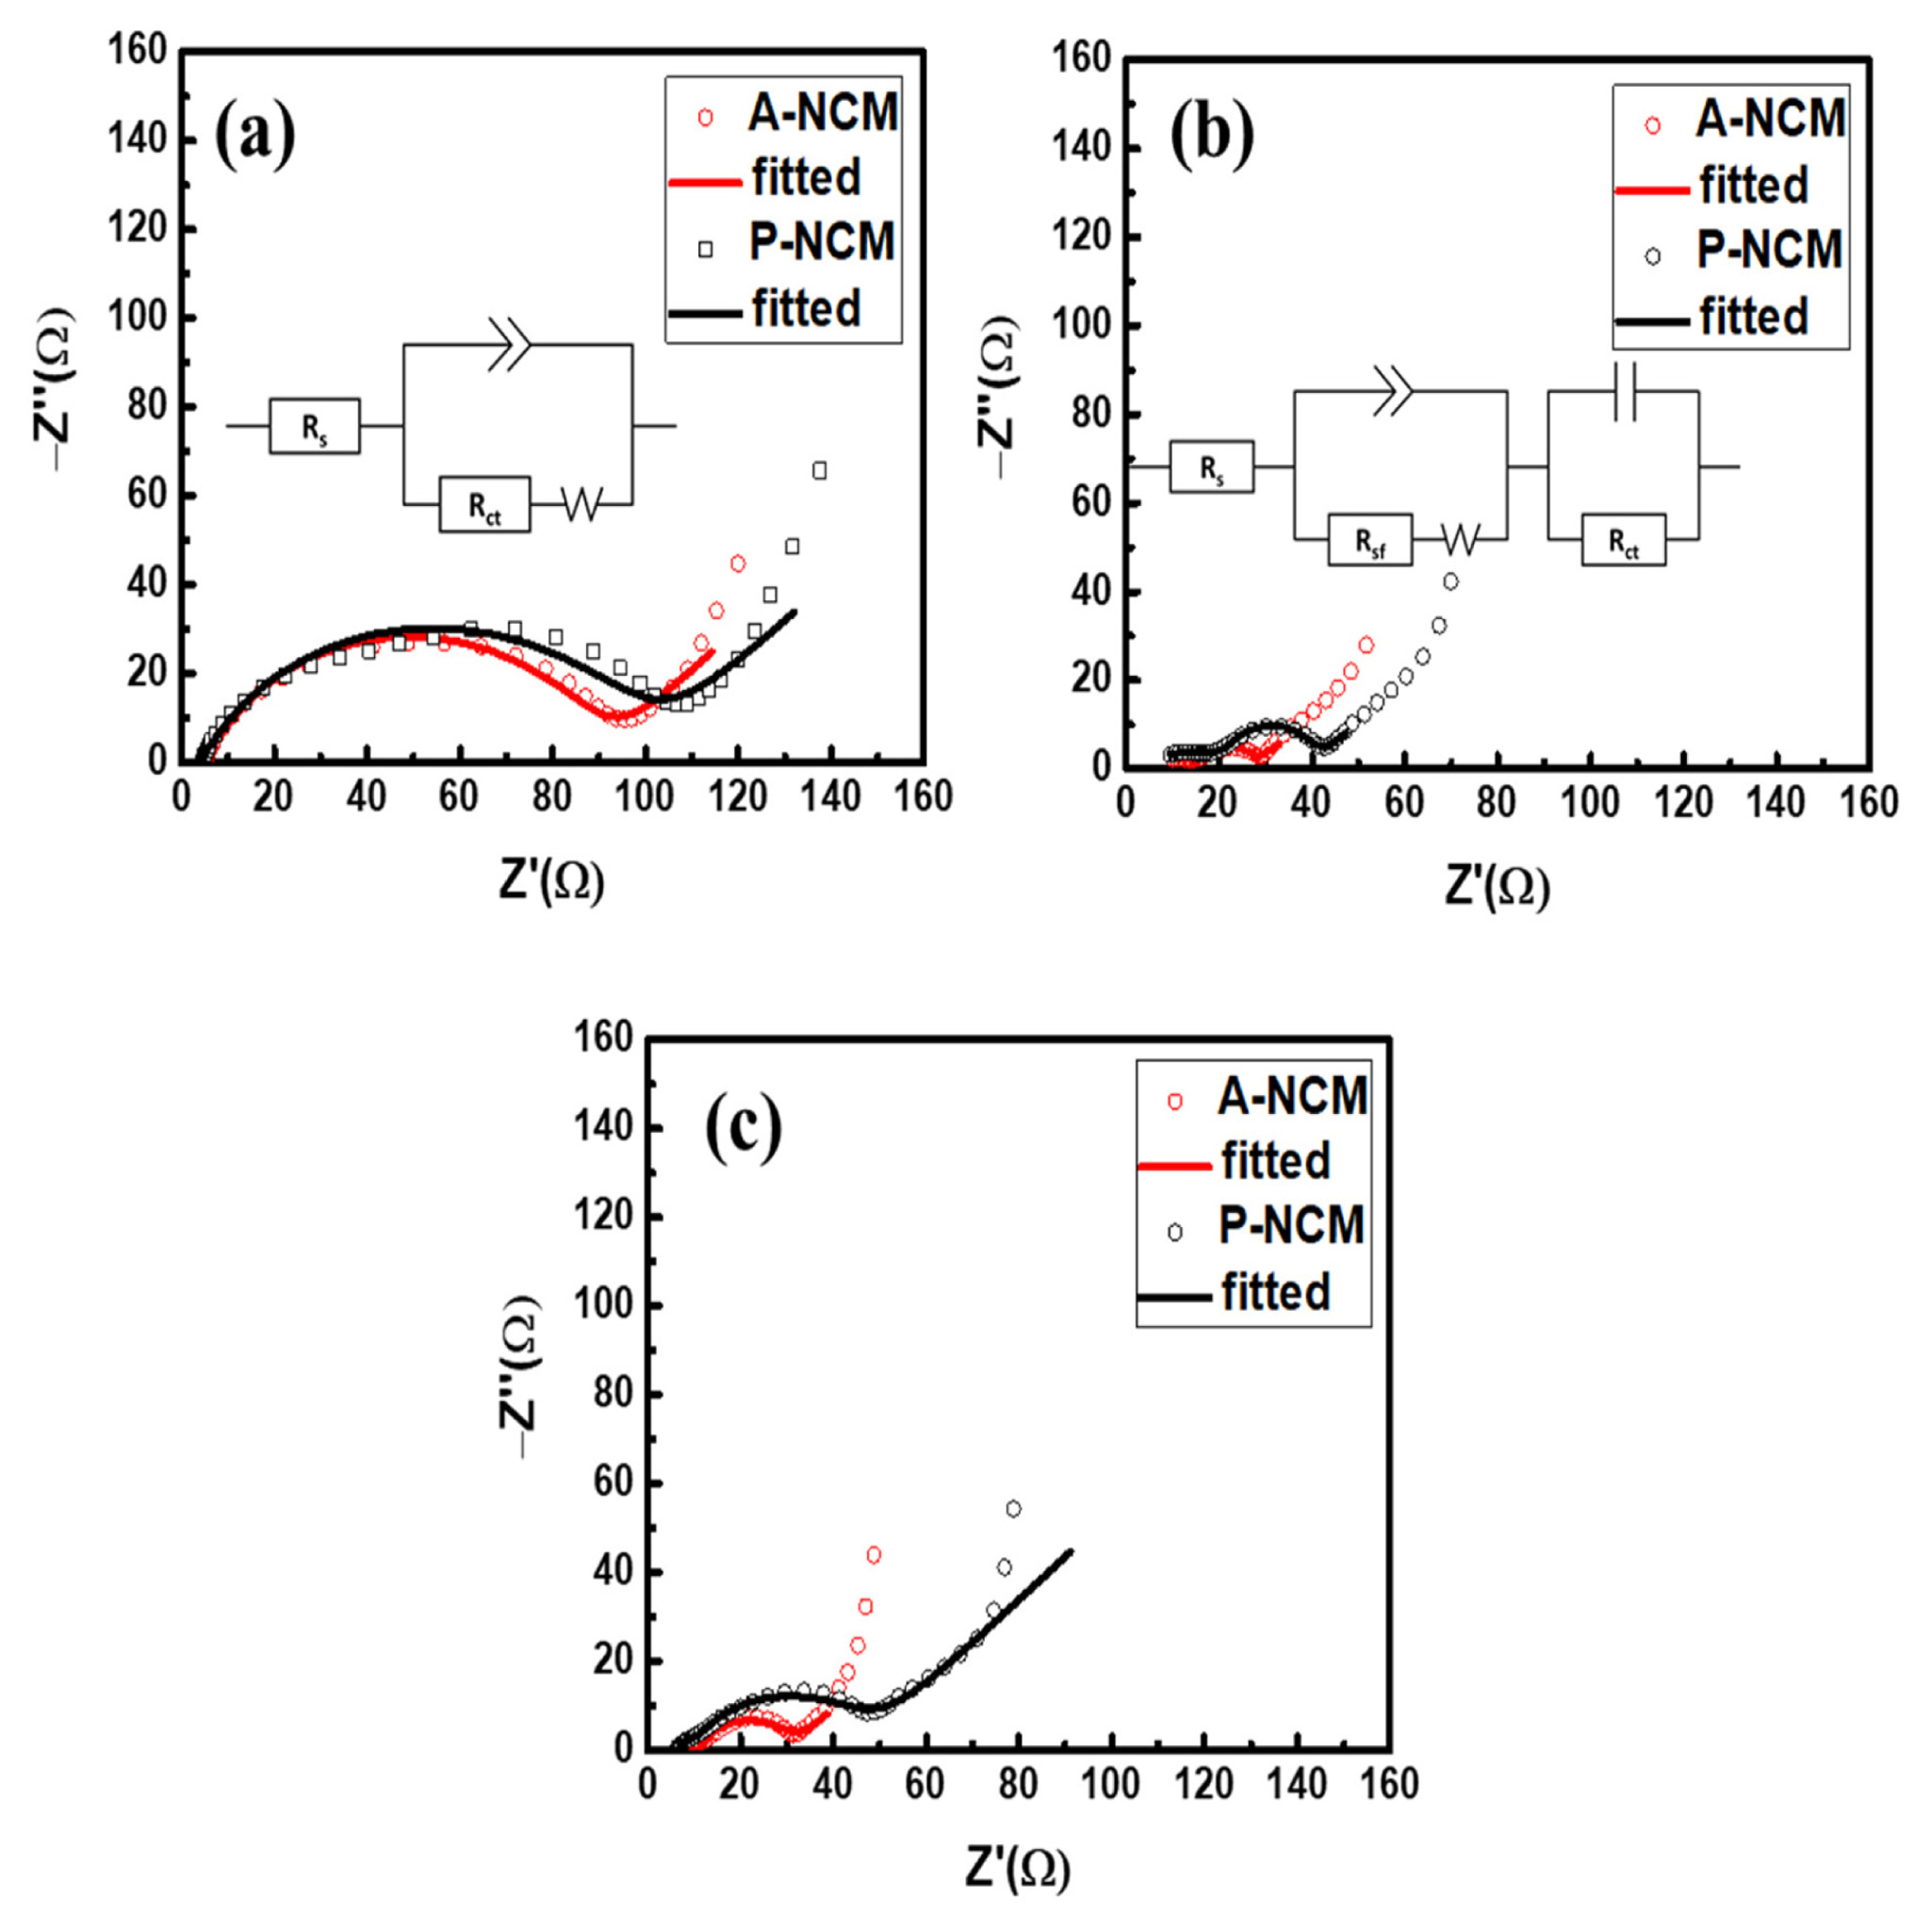
EIS curves of P-NCM and A-NCM (a) before cycling, and (b) after cycling at 1 C with each equivalent circuit. (c) after cycling at 2 C

The fitted values of EIS data of P-NCM and A-NCM.
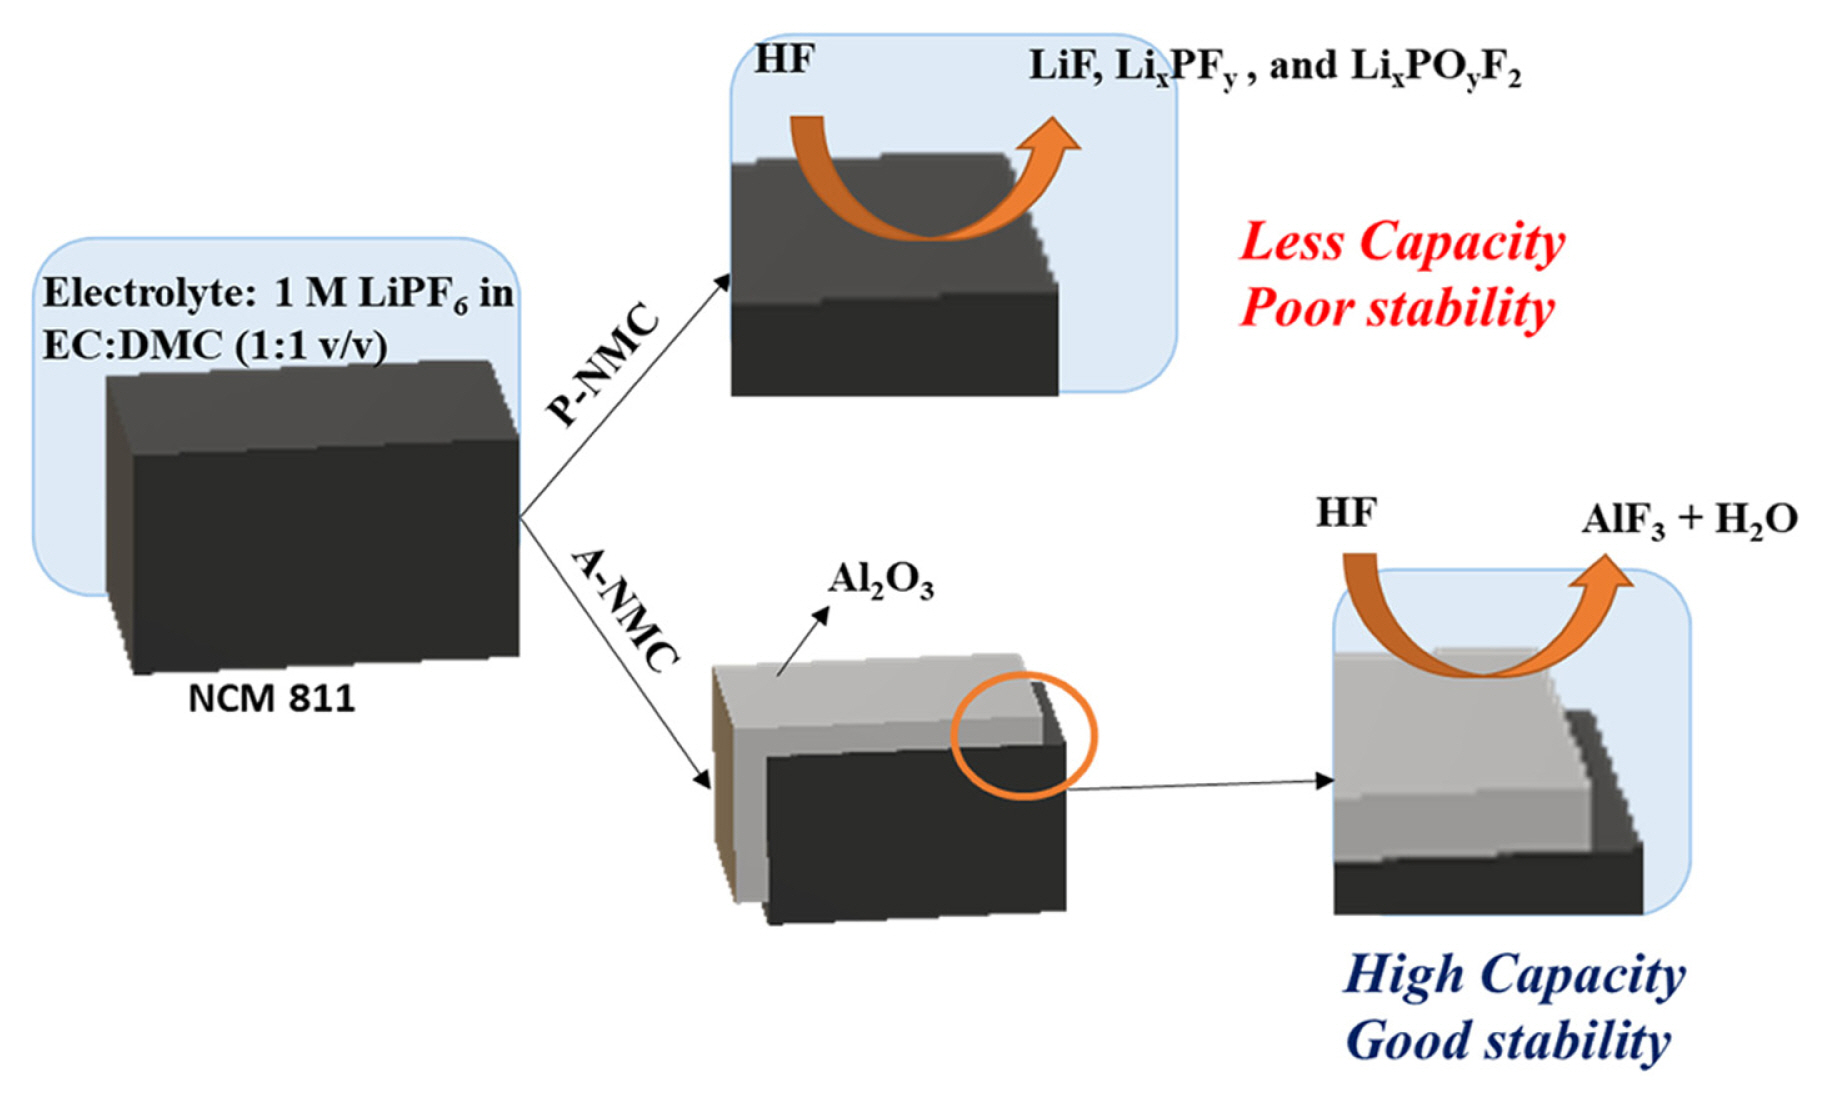
Schematic representation of degradation effect without and with ALD coating.
4. Conclusions
LiNi0.8Co0.1Mn0.1O2 (NCM811) was successfully synthesized using the sol-gel method, as verified by XRD, ICP-OES, and SEM analyses. Through the ALD technique, the synthesized LiNi0.8Co0.1Mn0.1O2 (NCM811) was successfully coated on the surface of the active material particles. The coating was systematically analyzed through TEM, EDS-mapping, and XPS data and thickness was calculated as approximately 3.4 nm. The improved electrochemical performance was investigated through 100 cycles of charge/discharge at 1 and 2 C. Enhanced capacity and rate capability were demonstrated by coated samples, which was reaffirmed by smaller Rct values before and after cycling. Coating via ALD can mitigate side reactions at the interface between electrodes and electrolytes, and lower resistance, making ALD coating adaptable to fast charging batteries and to industrial scale modification.
Acknowledgements
The authors gratefully acknowledge the financial support from the Ministry of Trade, Industry & Energy, Republic of Korea ( 10080314 ). DWK would like to thank Seon - yeong Lee and Bala Krishnan Ganesan for their help and support.