Effect of Solution-treated on Electrochemical Properties of AZ91 Magnesium Alloy Anode
Article information
Abstract
The effect of solution-treated on the self-corrosion performance and discharge performance of AZ91 magnesium alloy as anode material was analyzed by microscopic characterization, immersion tests, electrochemical measurements, and discharge performance tests. The study shows that the β-phase in the AZ91 magnesium alloy gradually dissolved in the matrix with the increase of the solution temperature, and the electrochemical activity of the magnesium alloy anode was significantly improved. Through the comparison of three different solution-treated processes, it is found that the AZ91 magnesium alloy has the most vigorous activity and better discharge performance after solution-treated of 415°C+12 h. In addition, the proportion and distribution of β-phase AZ91 magnesium alloy have a direct impact on its discharge performance as an anode material.
1. Introduction
Magnesium alloys are considered “green engineering materials in the 21st century” due to their low cost and density, safety, and green features, which have been widely used in automotive, aerospace, and 3C electronics [1,2]. Magnesium alloys have excellent engineering structural properties and also have significant advantages as anode materials. As a metal anode material, magnesium has a negative standard electrode potential of −2.36 V, a high theoretical specific capacity (2202 mWh·g−1), and a specific energy (2840 mWh·g−1) [3–5]. What’s more, magnesium is one of the most abundant light elements on earth and is widely distributed in nature; and magnesium batteries are also environmentally friendly, so magnesium and its alloys are an ideal electrode material [6].
In the early twentieth century, people invented the metal-air battery, which was not developed to the stage of practical application due to the technical conditions at that time. In recent years, in the face of the increasingly serious environmental and energy crisis, metal-air batteries are increasingly drawing the attention of researchers and market stakeholders [7]. The metal-air battery is a new type of battery consisting of metal with a negative electrode potential such as Mg, Al, and Zn as the negative electrode, pure oxygen or oxygen in the air as the positive electrode, and water or alkaline solution as the electrolyte [8]. As early as the 1930s, Zn-air batteries were developed and used for powering railway signals and beacon lights and were then gradually commercialized with continuous development [9]. Compared with Zn-air batteries (energy density of 1.65 kWh·kg−1), magnesium-air batteries show great potential with their higher energy density (6.8 kWh·kg−1) and are expected to be used on a large scale in small and medium-sized mobile power supplies, small portable electronic devices, and military seawater power supplies.
However, due to its negative difference effect, particle desorption and voltage hysteresis problems, the further development of magnesium alloys as anode materials is limited, how to reduce the self-corrosion of magnesium alloys and improve the discharge performance of magnesium anodes has become the focus of attention of researchers in this field [10,11]. Alloying is an effective method to improve the discharge performance of magnesium-based anodes. The addition of alloying elements can significantly refine the grain size and homogenize the organization, reducing the self-corrosion rate of magnesium alloys. For example, the addition of the Ce element to AZ31 magnesium alloy can significantly refine the grains, and the internal Al4Ce phase can promote the uniform dissolution of the Mg matrix; AZ31-xCe has higher corrosion resistance and discharge activity compared with AZ31 magnesium alloy [12]. However, some alloying elements, such as Nd, Zr, Pb, and Hg, pose environmental, weight, and cost issues that are not conducive to the widespread use of alloying. Therefore, heat treatment is a simple and effective treatment process that is expected to be used as a main treatment method in the preparation of magnesium alloy anode materials.
Heat treatment is also a practical method to improve the performance of magnesium alloy anodes. Heat treatment mainly improves the microstructure and properties of magnesium alloys by changing the distribution of the second phase and alloying elements, which can give full play to the advantages of magnesium-based materials, and the process is simple [13,14]. Song et al. found that heat treatment changed the proportion and distribution of the second phase of the alloy and improved the corrosion resistance of the alloy [15]. Ma et al. studied the effect of heat treatment on the electrochemical properties of AZT511 magnesium alloy [16]. The increased MgO on the corrosion surface of the magnesium alloy after heat treatment, which separated the matrix and the corrosive medium and reduced the corrosion rate of the alloy.
The AZ series alloys are one of the most widely used commercial magnesium alloys. Ma et al. did the electrochemical studies of AZ series magnesium alloys as anode materials in sodium chloride solution. The results showed that with the increase of Al content, the self-corrosion rate of magnesium alloy decreases, the anode utilization rate gradually increases, and Al has a promotion effect on the constant current discharge voltage of AZ series magnesium air batteries. Compared with AZ31 and AZ61, AZ91 has the highest discharge voltage and anode utilization [17].
In this work, AZ91 magnesium alloy was selected as the research material to explore the effect of solution-treated on the electrochemical performance and discharge performance of AZ91 magnesium alloy as an anode material. The self-corrosion performance and discharge performance of magnesium anodes were measured by microstructure characterization, immersion tests, electrochemical tests, and magnesium-air battery tests. And the work analyzed the effect of the second phase of the alloy on the performance of magnesium alloy anodes to provide theoretical support for the preparation of magnesium anode materials further.
2. Experimental
2.1 Materials
Commercial AZ91 magnesium alloy ingots were used for the experimental material, with a chemical composition of Mg (balance), 8.94 wt.% Al, 0.63 wt.% Zn, 0.19 wt.% Mn, and 0.03 wt.% Si. Cut magnesium alloy ingots into magnesium alloy sheets and treated them with a solution-treated in a KSL-1400X chamber sintering furnace. For magnesium alloy plates, the treatment options were 415°C+12 h, 400°C+12 h, and 415°C+12 h solution-treated. Preheating sintering furnace to 260°C, the magnesium alloy plate was placed in the furnace and heated to the specified temperature for heat preservation. The cooling method is air cooling. After the heat treatment, the magnesium alloy plate was cut into 10 mm × 10 mm × 10 mm samples.
2.2 Microstructure characterization
The microstructure of the alloy was observed using an optical microscope (OM), a scanning electron microscope (ZEISS FSEM, SEM, Germany), and an energy dispersive X-ray spectrometer. The alloy samples were ground with abrasive papers from 400# to 3000# and polished with diamond paste. Then it was rinsed with deionized water. The etching solution is 4.5 g picric acid, 5 mL acetic acid, 10 mL H2O, and 100 mL anhydrous ethanol.
2.3 Immersion test
Immersion test specimens were encapsulated in epoxy resin, exposing only a 10 mm × 10 mm working surface. Ground the sample to 2000# with abrasive paper and placed it in a 3.5 wt.% NaCl solution for 120, 240, and 360 h, respectively. The corrosion products were removed and weighed immediately after the immersion. At least three parallel samples were used in each immersion experiment, and the following formulas calculated the average corrosion rate [18]:
Where PW is the corrosion rate (mm·y−1), ΔW is the mass loss (mg·cm−2·h−1), ρ is the density of the material (g·cm−3), the density of AZ91 magnesium alloy is 1.82 g·cm−3.
2.4 Electrochemical test
Before the electrochemical measurement, the samples were polished from 400# to 2000# with abrasive paper and soaked in a 3.5 wt.% NaCl solution for 10 minutes to obtain a stable surface state. The electrochemical property was measured using a CHI760E equipment with a three electrodes system in 3.5 wt.% NaCl solution: magnesium alloy as the working electrode (working area of 100 mm2), Pt plate as a counter electrode, and saturated calomel electrode (SCE) as the reference electrode. Before the test, a 1200 s open circuit potential test was performed, and the open circuit potential (OCP) value was recorded. Electrochemical impedance spectroscopy (EIS) was performed at an open circuit potential with frequencies of 10 kHz to 0.1 Hz and a 5 mV voltage amplitude. All EIS results were fitted with Zview software. The polarization curve test was conducted at a scan rate of 1 mV·s−1, and the scan range was Eocp±0.5 V after 600s immersion in the electrolyte. The data obtained from the test was analyzed directly in CHI760E. Constant current discharge tests were performed by an electrochemical workstation at current densities of 5, 10, 20, and 50 mA·cm−2, and the discharge time was 1200 s. The discharge morphology was characterized by scanning electron microscopy (SEM).
2.5 Magnesium-air battery test
The magnesium-air battery test uses the blue battery test system CT3001A. The air battery device is shown in Fig. 1 and has a working area of approximately 1 cm2 (1.12 cm diameter) in a 3.5 wt.% NaCl solution with magnesium alloy as the anode and a commercial air cathode as the cathode. The test was carried at four current densities of 5, 10, 15, and 20 mA·cm−2. After testing, the reaction products on the anode surface were removed by a 200 g·L−1 chromic acid solution and anhydrous ethanol, blown dry with cold air, and weighed immediately using an analytical balance. The following formulas calculate the specific capacity, specific energy, and discharge efficiency [19]:
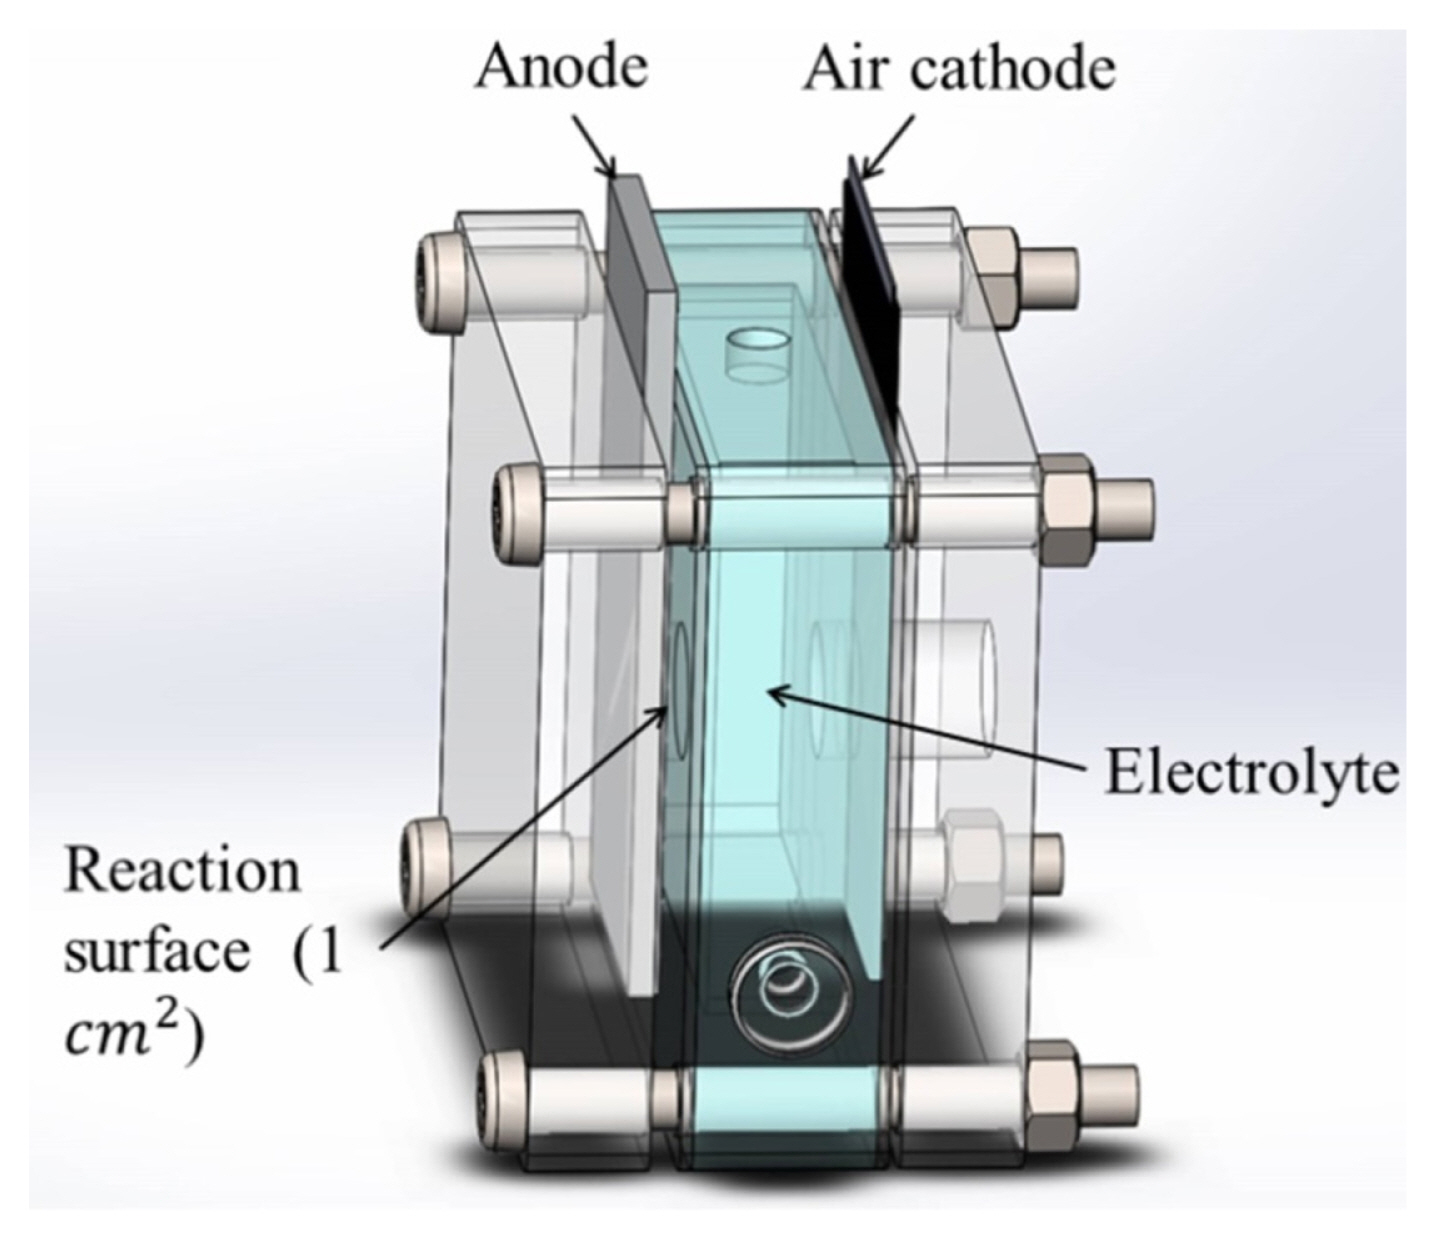
Schematic of the Mg-air cell for battery discharge test
Where I is the discharge current density (A), t is the discharge time (h), ΔW is the mass loss during discharge (g), E is the discharge voltage (V), Ma is the relative molecular mass, the relative molecular mass of AZ91 magnesium alloy is 24.69 and F is the Faraday constant (26.801 Ah·mol−1).
3. Results and Discussion
3.1 Microstructure analysis
Fig. 2 shows the XRD pattern of the AZ91 magnesium alloy after solution-treated. All four alloys contain α-phase and β-phase, and it can be seen that the intensity and number of diffraction peaks of β-phase of AZ91 magnesium alloy after solution-treated are significantly reduced.
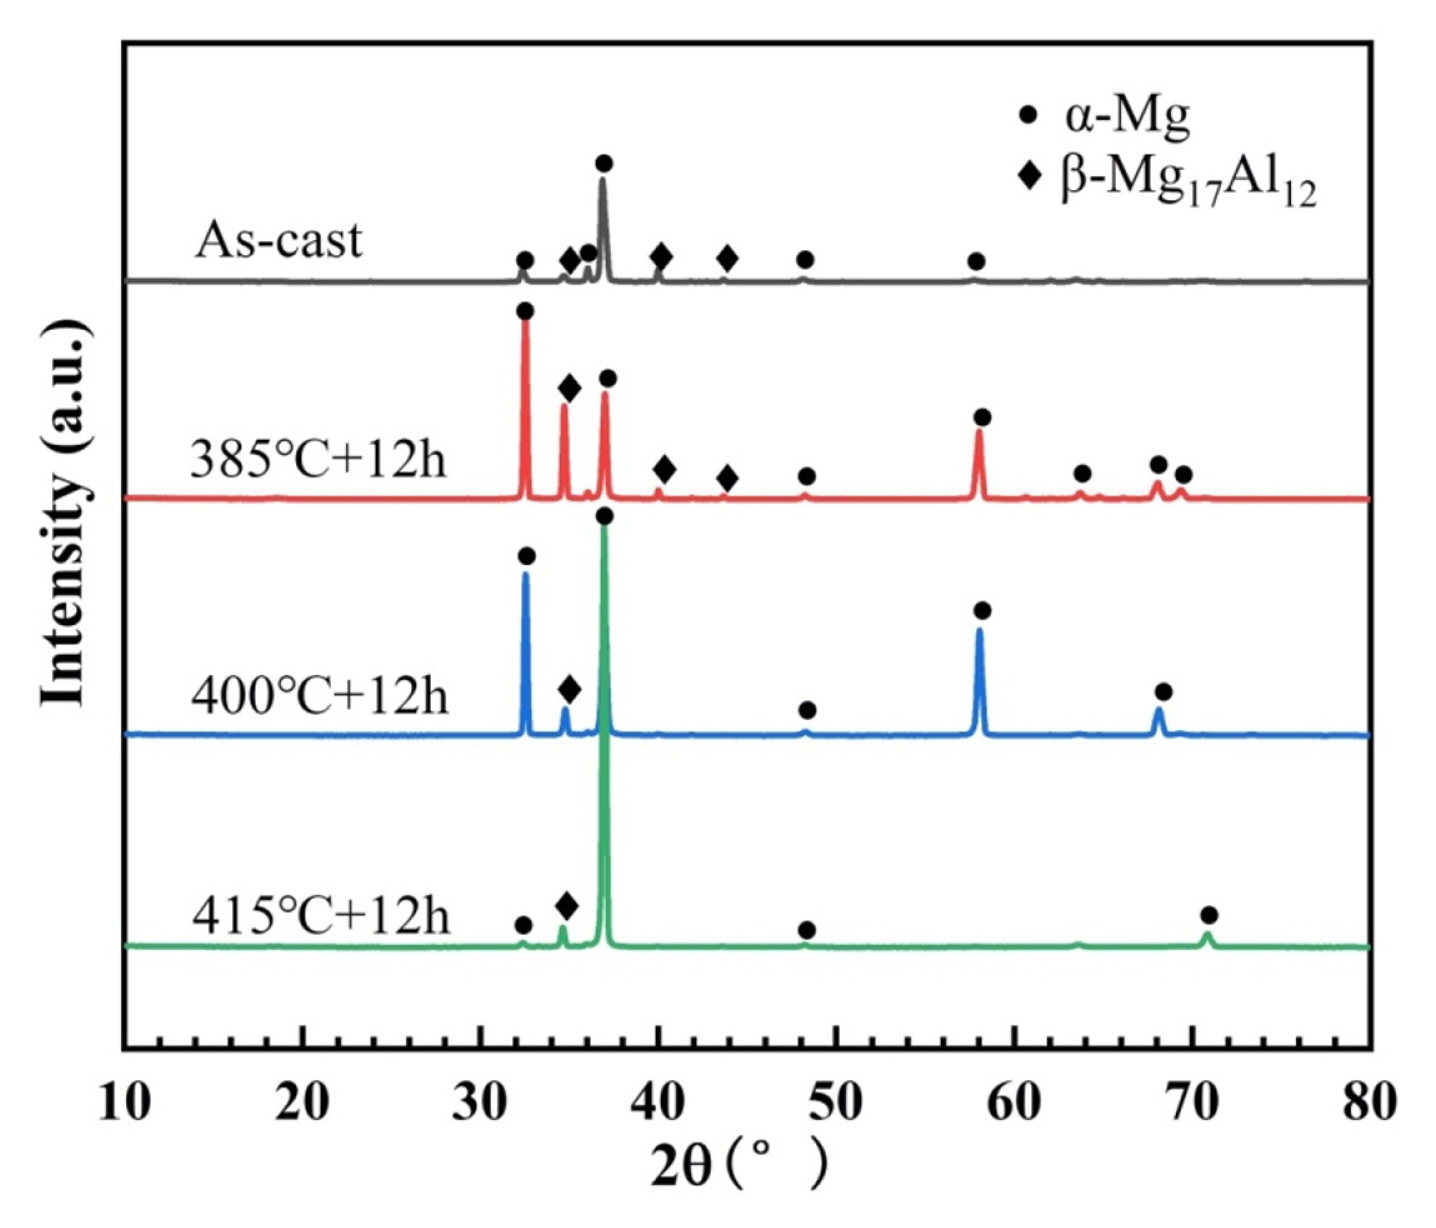
X-ray diffraction (XRD) patterns of AZ91 alloys
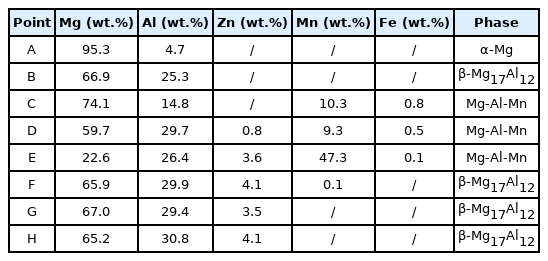
Fig. 3 and Table 1 show the microstructure and EDS spectrum of AZ91 magnesium alloy. It can be seen from Fig. 3a that the as-cast AZ91 magnesium alloy mainly consists of α-phase and β-phase, β-phase is intermittently arranged in a dendritic network within the alloy. It also shows that the β-phase distributed in a network intermittently begins to be slowly dissolved, and the shape of the β-phase also changes from the initial dendritic ribbon to strip, sheet, and filament with the increase of the solid solution temperature. When the solid solution temperature reaches 415°C, the β-phase is completely dissolved inside the alloy, but some still remains in the alloy in the form of lumps. As shown in Table 1, a small amount of Mg-Al-Mn phase was also found in the alloy in the form of needles and lumps [20,21], but this phase was not detected in the XRD pattern, which may be the reason for its very shallow content.
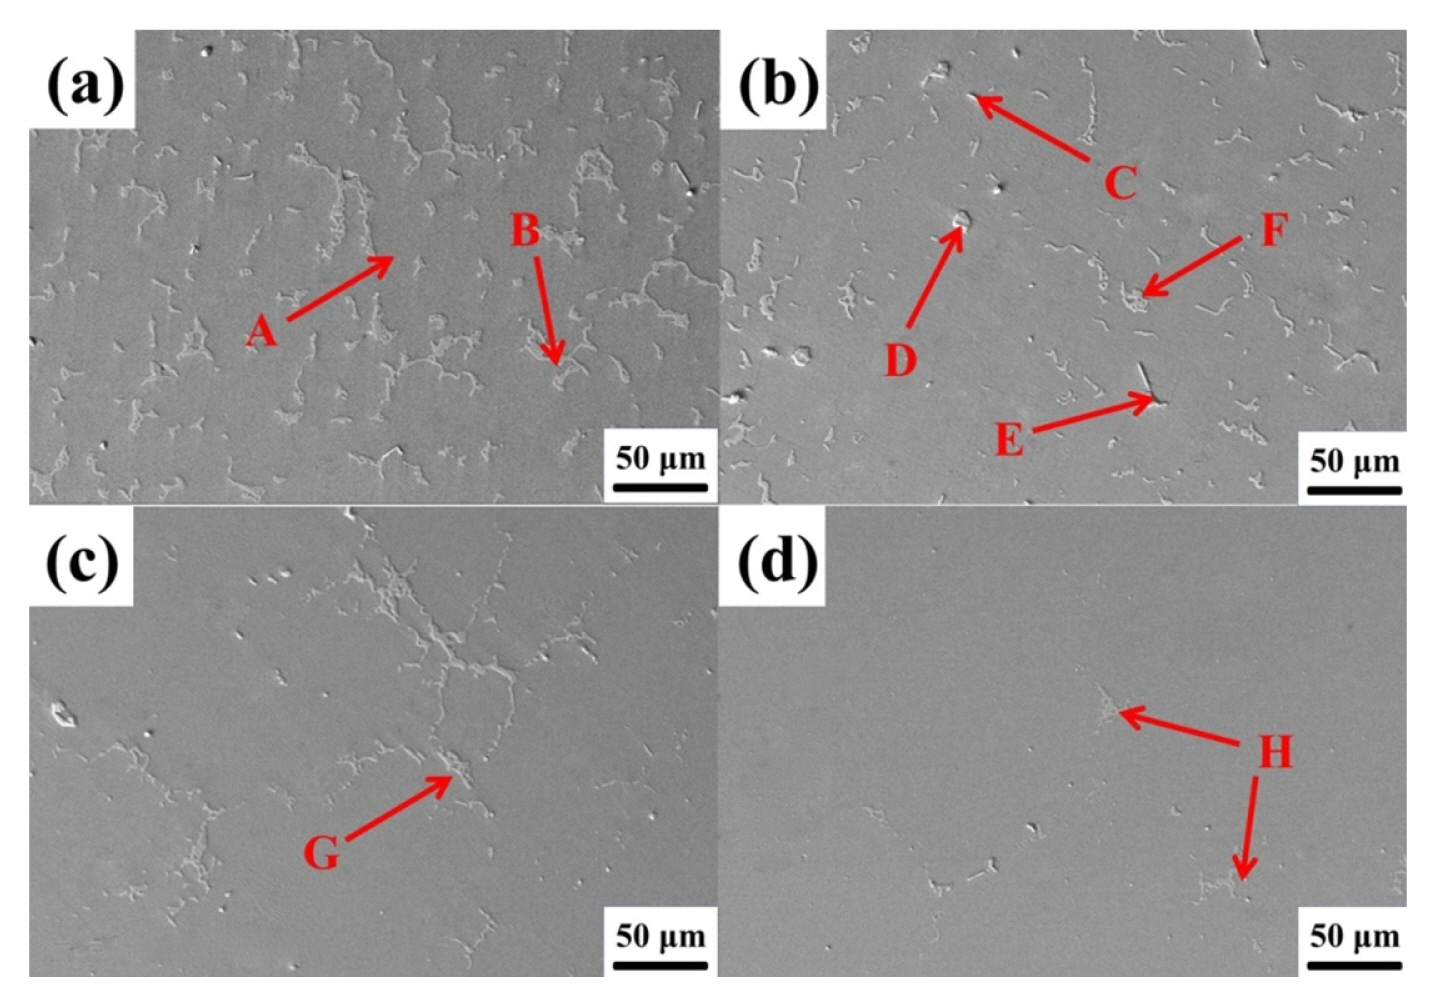
The SEM images of the AZ91 Mg-alloy: (a) Ascast, (b) 385°C+12 h, (c) 400°C+12 h, and (d) 415°C+12 h
3.2 Immersion analysis
Fig. 4 shows the mass loss and self-corrosion rates of AZ91 alloys in a 3.5 wt.% NaCl solution. The corrosion rate of the alloy gradually becomes stable with the prolongation of immersion time, which is related to the accumulation of corrosion products on the surface of the alloy. During the immersion process, Mg2+ and OH− in solution combined to form Mg(OH)2 precipitate; as the experiment progressed, corrosion products accumulated on the surface of the alloy, retarding further corrosion inside the alloy to a certain extent [22].
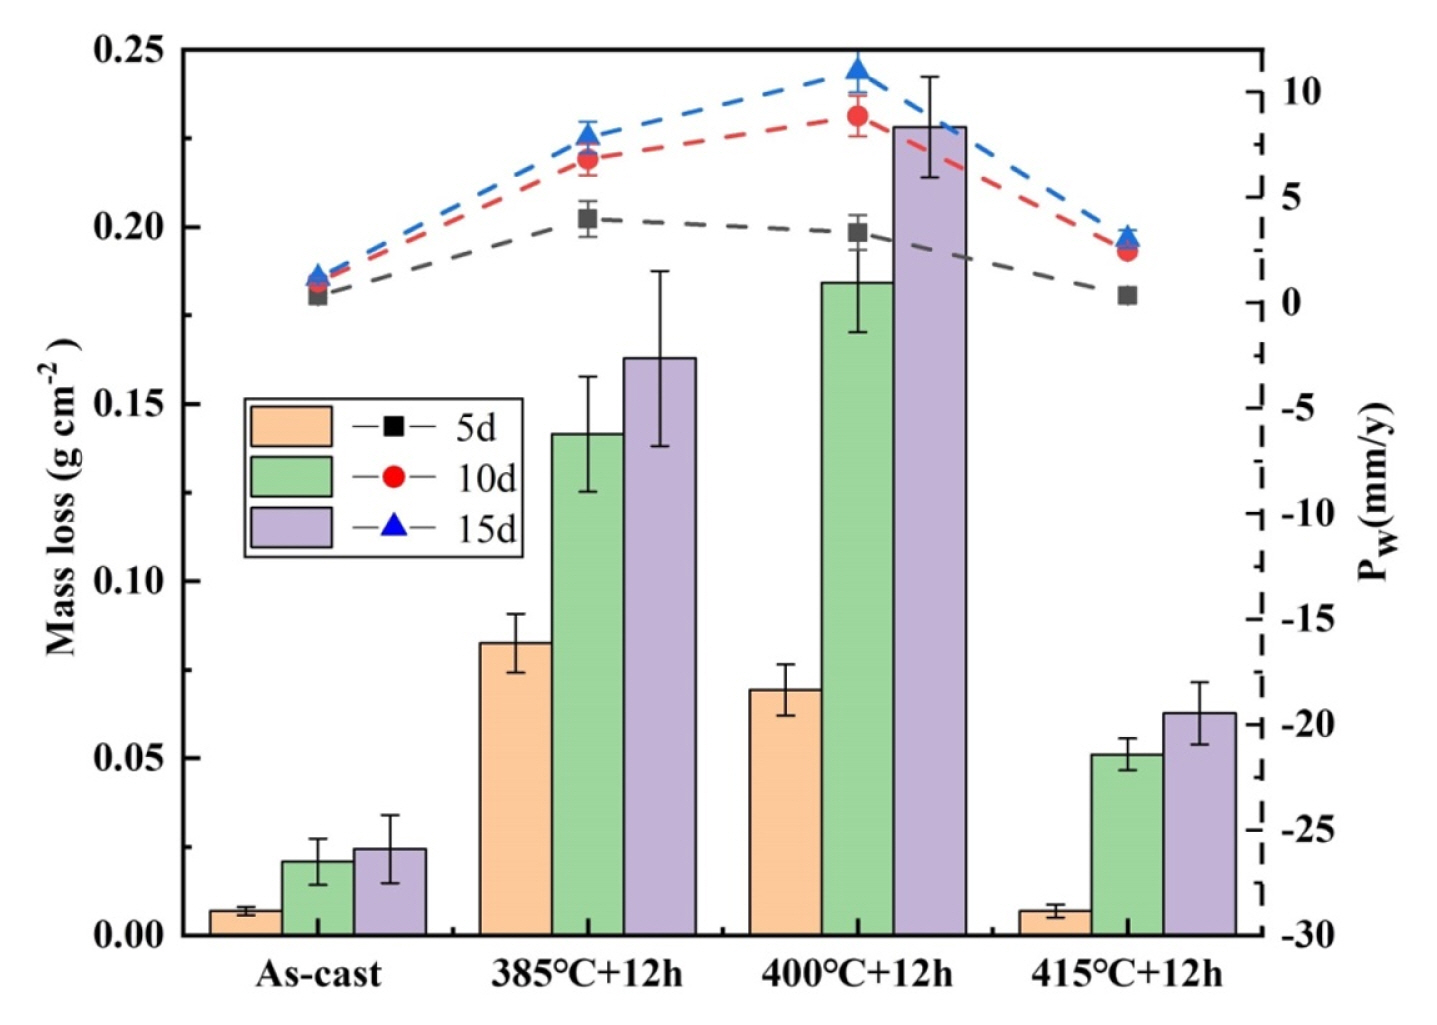
Mass loss and self-corrosion rate of AZ91 alloys in 3.5 wt.% NaCl solution
The microstructure of magnesium alloys is mainly composed of α-phase, β-phase, and dissociated eutectic. Studies have shown that the β-phase in magnesium alloy has two roles: (1) when the β-phase is continuous and high, it acts as a barrier to stop the corrosion process; (2) when the β-phase is low, it acts as a galvanic cathode to accelerate corrosion [23]. The β-phase is present in the as-cast AZ91 magnesium alloy at a high content and in the form of a mesh structure [24], which can form a corrosion barrier and hinder the corrosion of the alloy, so the cast AZ91 magnesium alloy corrosion resistance is stronger. However, after solution-treated of AZ91 magnesium alloy at 385°C+12 h and 400°C+12 h, part of the eutectic and β-phase dissolved inside the alloy, the immersion process will form a large number of α-Mg as the anode and β-phase as the cathode microcell on the surface of the alloy, intensifying the corrosion of magnesium alloy in solution [25,26], so its corrosion resistance is reduced. While AZ91 magnesium alloy was solution-treated at 415°C+12 h, most of the β-phase dissolved inside the alloy, the mesh corrosion barrier disappeared and also reduced the number of microcells formed on the surface of the alloy. The self-corrosion of the alloy decreased, the effective area of α-Mg matrix involved in the reaction increased, the utilization rate of magnesium alloy anode increased, and the discharge performance of magnesium alloy anode improved.
3.3 Electrochemical analysis
When studying the performance of magnesium alloys as anode materials for magnesium batteries, their self-corrosion rate is a problem worth paying attention to. The corrosion performance of AZ91 magnesium alloys was evaluated by potentiodynamic polarization and electrochemical impedance spectroscopy (EIS). Fig. 5 shows the polarization curves of the four magnesium alloys, and Table 2 gives the fitted values of Ecorr and Icorr for the electrochemical parameters obtained from the curves. The anodic polarization is related to the dissolution of magnesium, the cathodic polarization is related to the hydrogen evolution reaction, the corrosion potential represents the conditions of the reaction, and the self-corrosion current density represents the progress of the reaction process [27].
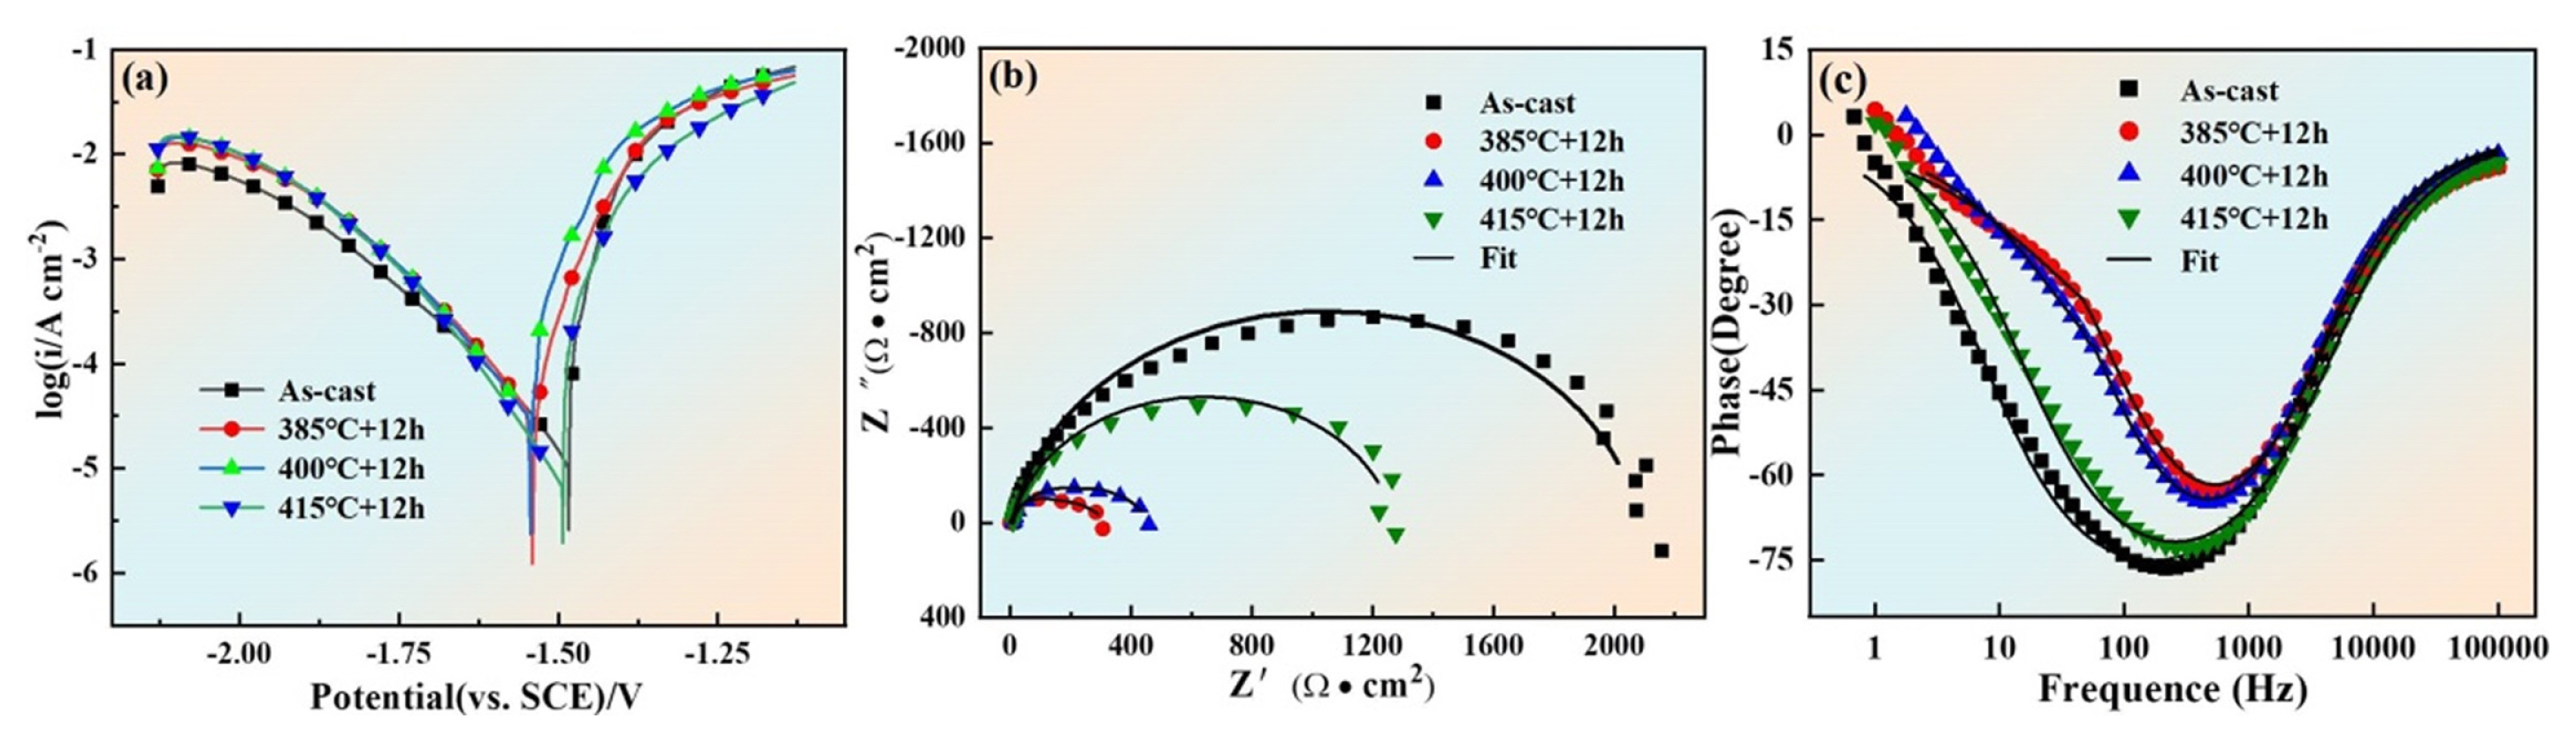
Polarization curves and Electrochemical impedance spectroscopy (EIS) of AZ91 alloys in 3.5 wt.% NaCl solution: (a) Polarization curves, (b) Nyquist plots, and (c) Bode plots of phase angle vs. frequency

Electrochemical parameters of AZ91 alloys obtained from polarization curves
It can be seen from Fig. 5a that the corrosion potentials of as-cast AZ91 magnesium alloys and after solution-treated at 415°C+12 h are the most positive, and the corrosion potentials of alloys treated at 415°C+12 h and 400°C+12 h are the most negative. In terms of self-corrosion current density, the corrosion current density of as-cast AZ91 magnesium alloys and after solution-treated at 415°C+12 h is the smallest, and the corrosion current density of magnesium alloys after solution-treated at 385°C+12 h and 400°C+12 h is the largest. The four magnesium alloys showed the same trend in corrosion potential and self-corrosion current density, and the order of corrosion resistance of the four alloys is as follows: As-cast > 415°C+12 h > 400°C+12 h > 385°C+12 h.
Figs. 5b and 5c show the electrochemical impedance spectroscopy (EIS) of the four magnesium alloys at open circuit potential. The Nyquist diagram and the equivalent fitted circuit diagram are shown in Fig. 5b, where Rs is the solution resistance from the reference electrode to the working electrode, Rt is the charge transfer resistance, equal to the diameter of the semicircle of the capacitive reactance arc, and CPE is the anode electric double-layer capacitance at the interface between the surface and the NaCl solution. Generally, the CPE value represents the size of the active area of the anode surface; the higher the CPE value, the larger the active area; the size of Rt represents the size of the corrosion performance; the larger Rt presents a stronger corrosion resistance [28].
Table 3 shows the electrochemical parameters obtained by EIS fitting. It demonstrates that the after-solution-treated of the AZ91 magnesium alloy is lower than the as-cast. The AZ91 magnesium alloy after treatment at 415°C+12 h has the lowest Rt, but it has the largest CPE value and the largest surface-active region. The alloy has poorer corrosion resistance and higher discharge activity in this state, but its self-corrosion reaction is relatively severe. Fig. 5c is the Bode plot of phase angle and frequency. For all tested materials, the magnitude of the phase angle determines the corrosion resistance of the material. The more negative the phase angle, the stronger the corrosion resistance. Moreover, the speed of the increase of the phase angle with frequency is also related to the products generated on the surface of the material. The faster the phase angle increases, the more stable passivation products are generated on the surface of the material, and the stronger the protection of the substrate [29]. The figure shows that the phase angle of the as-cast and AZ91 magnesium alloys treated at 415°C+12 h is more negative, and the phase angle increases faster with frequency, so its corrosion resistance is stronger.

Electrochemical parameters of AZ91 alloy anodes obtained by fitting the electrochemical impedance spectroscopy (EIS)
Constant current discharge tests were performed at current densities of 5, 10, 20, and 50 mA·cm−2. The discharge curves of the four magnesium alloys in 3.5 wt.% NaCl solution are shown in Fig. 6, and the average discharge potential of the alloys after the potential stabilized during the constant current discharge process is shown in Table 4. It can be seen from the figure that, whether at low current density or high current density, the discharge potential of the alloy after solution-treated is negatively shifted, and the discharge activity is enhanced. The alloy has the highest activity with solution-treated at 415°C+12 h. This is because a large amount of β-phase dissolved inside the matrix after solution-treated and the alloy surface micro-galvanic corrosion is reduced. At the same time, this also increases the effective discharge area of the alloy.
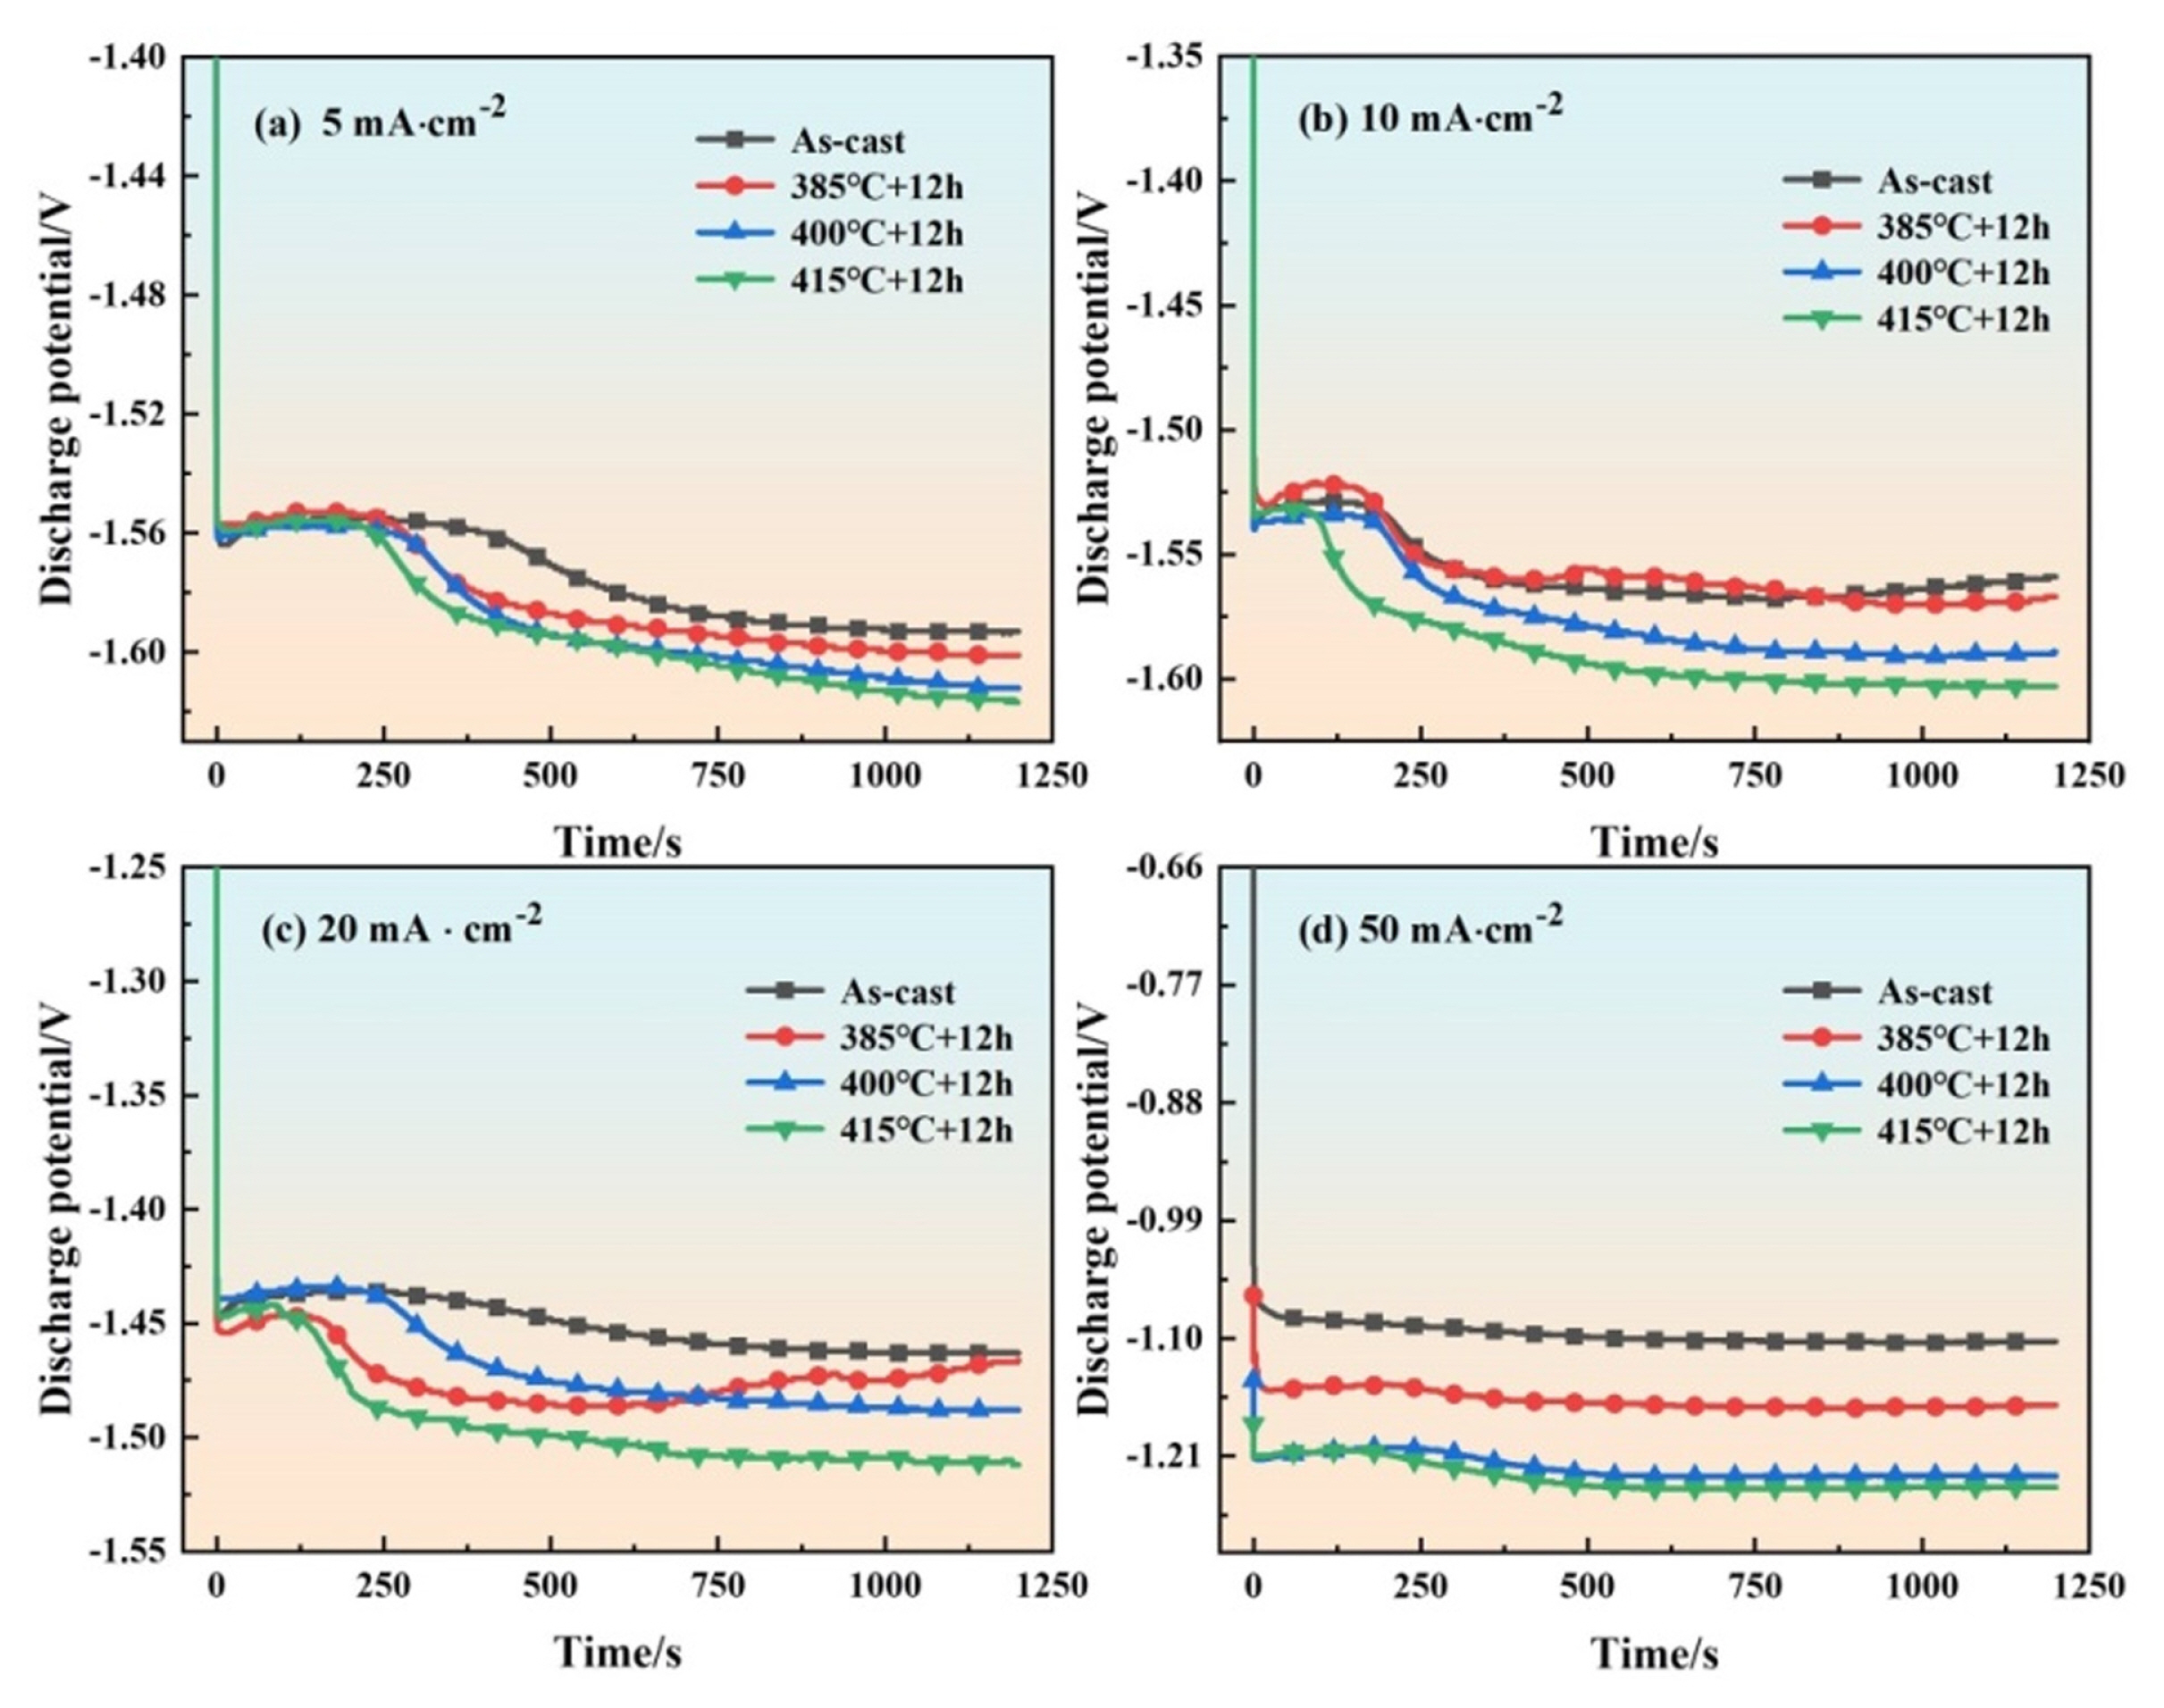
Discharge curves of AZ91 alloy anodes at four current densities: (a) 5, (b) 10, (c) 20, and (d) 50 mA·cm−2 in 3.5 wt.% NaCl solution

Discharge potential of AZ91 alloy anodes at different current densities
At the current densities of 5, 10, and 20 mA·cm−2, the discharge potential of the alloy showed a trend of first increasing slightly, then decreasing, and then tending to be stable. At the initial stage of discharge, a thin layer of discharge products is formed on the surface of the alloy. With the progress of the reaction, more and more discharge products accumulate on the surface of the anode, which hinders the further reaction between the alloy and the electrolyte, and the discharge potential tends to be positive; when the discharge products accumulate to a certain level, they start to fall off from the surface of the alloy, the alloy reacts further, and the discharge potential tends to be negative. As the reaction proceeds, the discharge products generated by the alloy reaction and the falling of discharge products form a dynamic equilibrium, and the discharge potential of the alloy tends to a stable state [30,31]. The discharge curve at the current density of 50 mA·cm−2 is relatively stable because the discharge process proceeds more rapidly at high current densities and the generation and shedding of discharge products quickly reach dynamic equilibrium, so the discharge curve is stable.
Fig. 7 shows the morphology of the four alloys by removing corrosion products after discharge at a current density of 20 mA·cm−2 for 1200 s. It is shown that in Figs. 7a–c, deep corrosion pits appear inside the AZ91 magnesium alloy, which indicates that more serious galvanic corrosion occurred inside the alloy during the discharge process. The formation of these corrosion pits and holes increased the electrode surface area, further accelerating the corrosion reaction rate. As can be seen in Fig. 7a, severe internal corrosion has occurred in the cast magnesium alloy and has penetrated deep into the substrate; the second phase of the alloy is distributed as a skeletal structure in a network in the interior of the corrosion pit. In Figs. 7b–d, there is a large amount of lamellar corrosion inside the alloy, where the corrosion of the solution-treated magnesium alloy extends internally in layers. This type of corrosion makes it easier to dislodge the corrosion products adhering to the surface of the alloy, facilitating the further discharge process [32]. In Fig. 7c, a nested bone-like structure appears within the alloy, which may be related to the eutectic organization and the formation of solute-rich zones within the grains by the solid solution of the second phase. As shown in Fig. 7d, the discharge morphology of the alloy after solution-treated at 415°C+12 h presents a honeycomb and layered structure. Compared with the other three alloys, its corrosion pits are smaller and denser. What’s more, the corrosion is more uniform, which may be an important reason for its higher discharge activity than the other three alloys. Fig. 7 also contains Al elemental maps of the four alloys after discharge. The distribution of the second phase and its shape can be clearly seen from the distribution of Al elements, and its quantity is reduced in turn. The second phase basically disappeared after the solution-treated at 415°C+12 h, the distribution of Al elements tends to be more uniform, and this change is also related to the formation of the honeycomb structure in Fig. 7d.
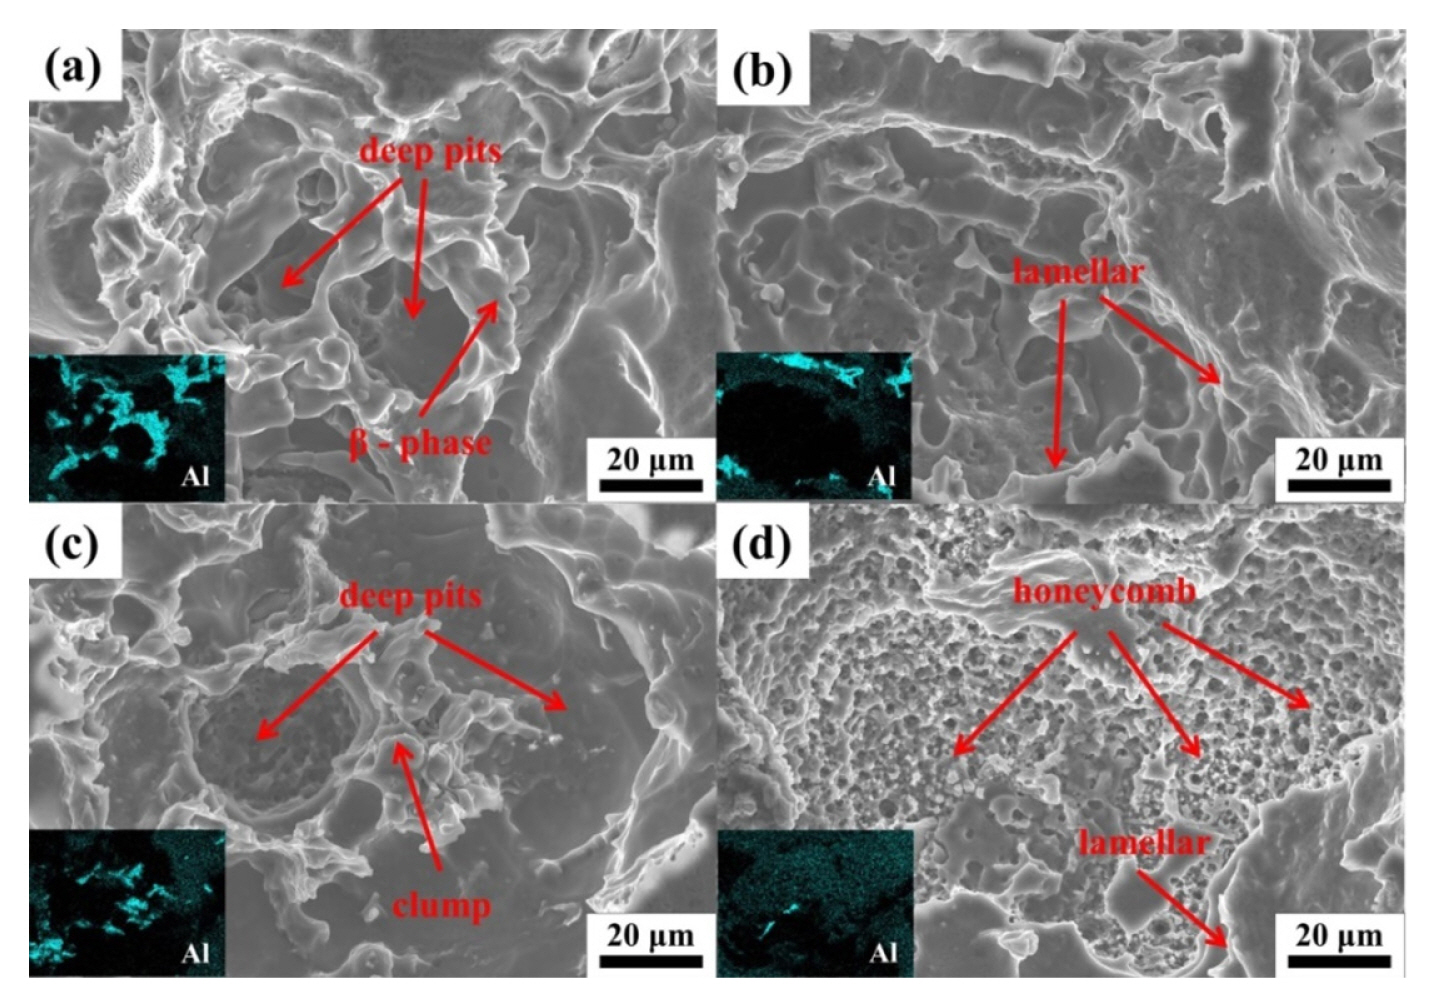
The SEM micrograph and EDS mapping of AZ91 magnesium alloy after removing corrosion products after discharging at 20 mA·cm−2 current density in 3.5 wt.% NaCl solution for 1200 s: (a) As-cast, (b) 385°C+12 h, (c) 400°C+12 h, and (d) 415°C+12 h
3.4 Magnesium-air battery test
Fig. 8 describes the discharge curves of magnesium-air batteries for four magnesium alloys at current densities of 5, 10, 15, and 20 mA·cm−2. The AZ91 magnesium alloy after solution-treated has a higher discharge voltage, and the discharge voltage increases with the increase of solution temperature. The AZ91 magnesium alloy after solution-treated at 415°C+12 h has the highest discharge voltage at different current densities, and the discharge curve has less fluctuation compared with the other three magnesium alloys, and it shows a very smooth discharge at low current densities. This is because the β-phase in the AZ91 magnesium alloy after solution-treated at 415°C+12 h has basically been dissolved into the matrix, so a large number of micro-batteries will not be formed on the surface of the alloy during the discharge process, and the side reaction of hydrogen evolution in the alloy will be reduced and the voltage will increase. Furthermore, when the phase decomposes, a large amount of aluminum ions dissolve into the magnesium matrix. Studies have shown that the increase of the Al element content in the magnesium alloy can improve the discharge activity of the magnesium alloy anode [33]. Combining the above two factors, the AZ91 magnesium alloy has excellent discharge performance after solid solution treatment at 415°C+12 h.
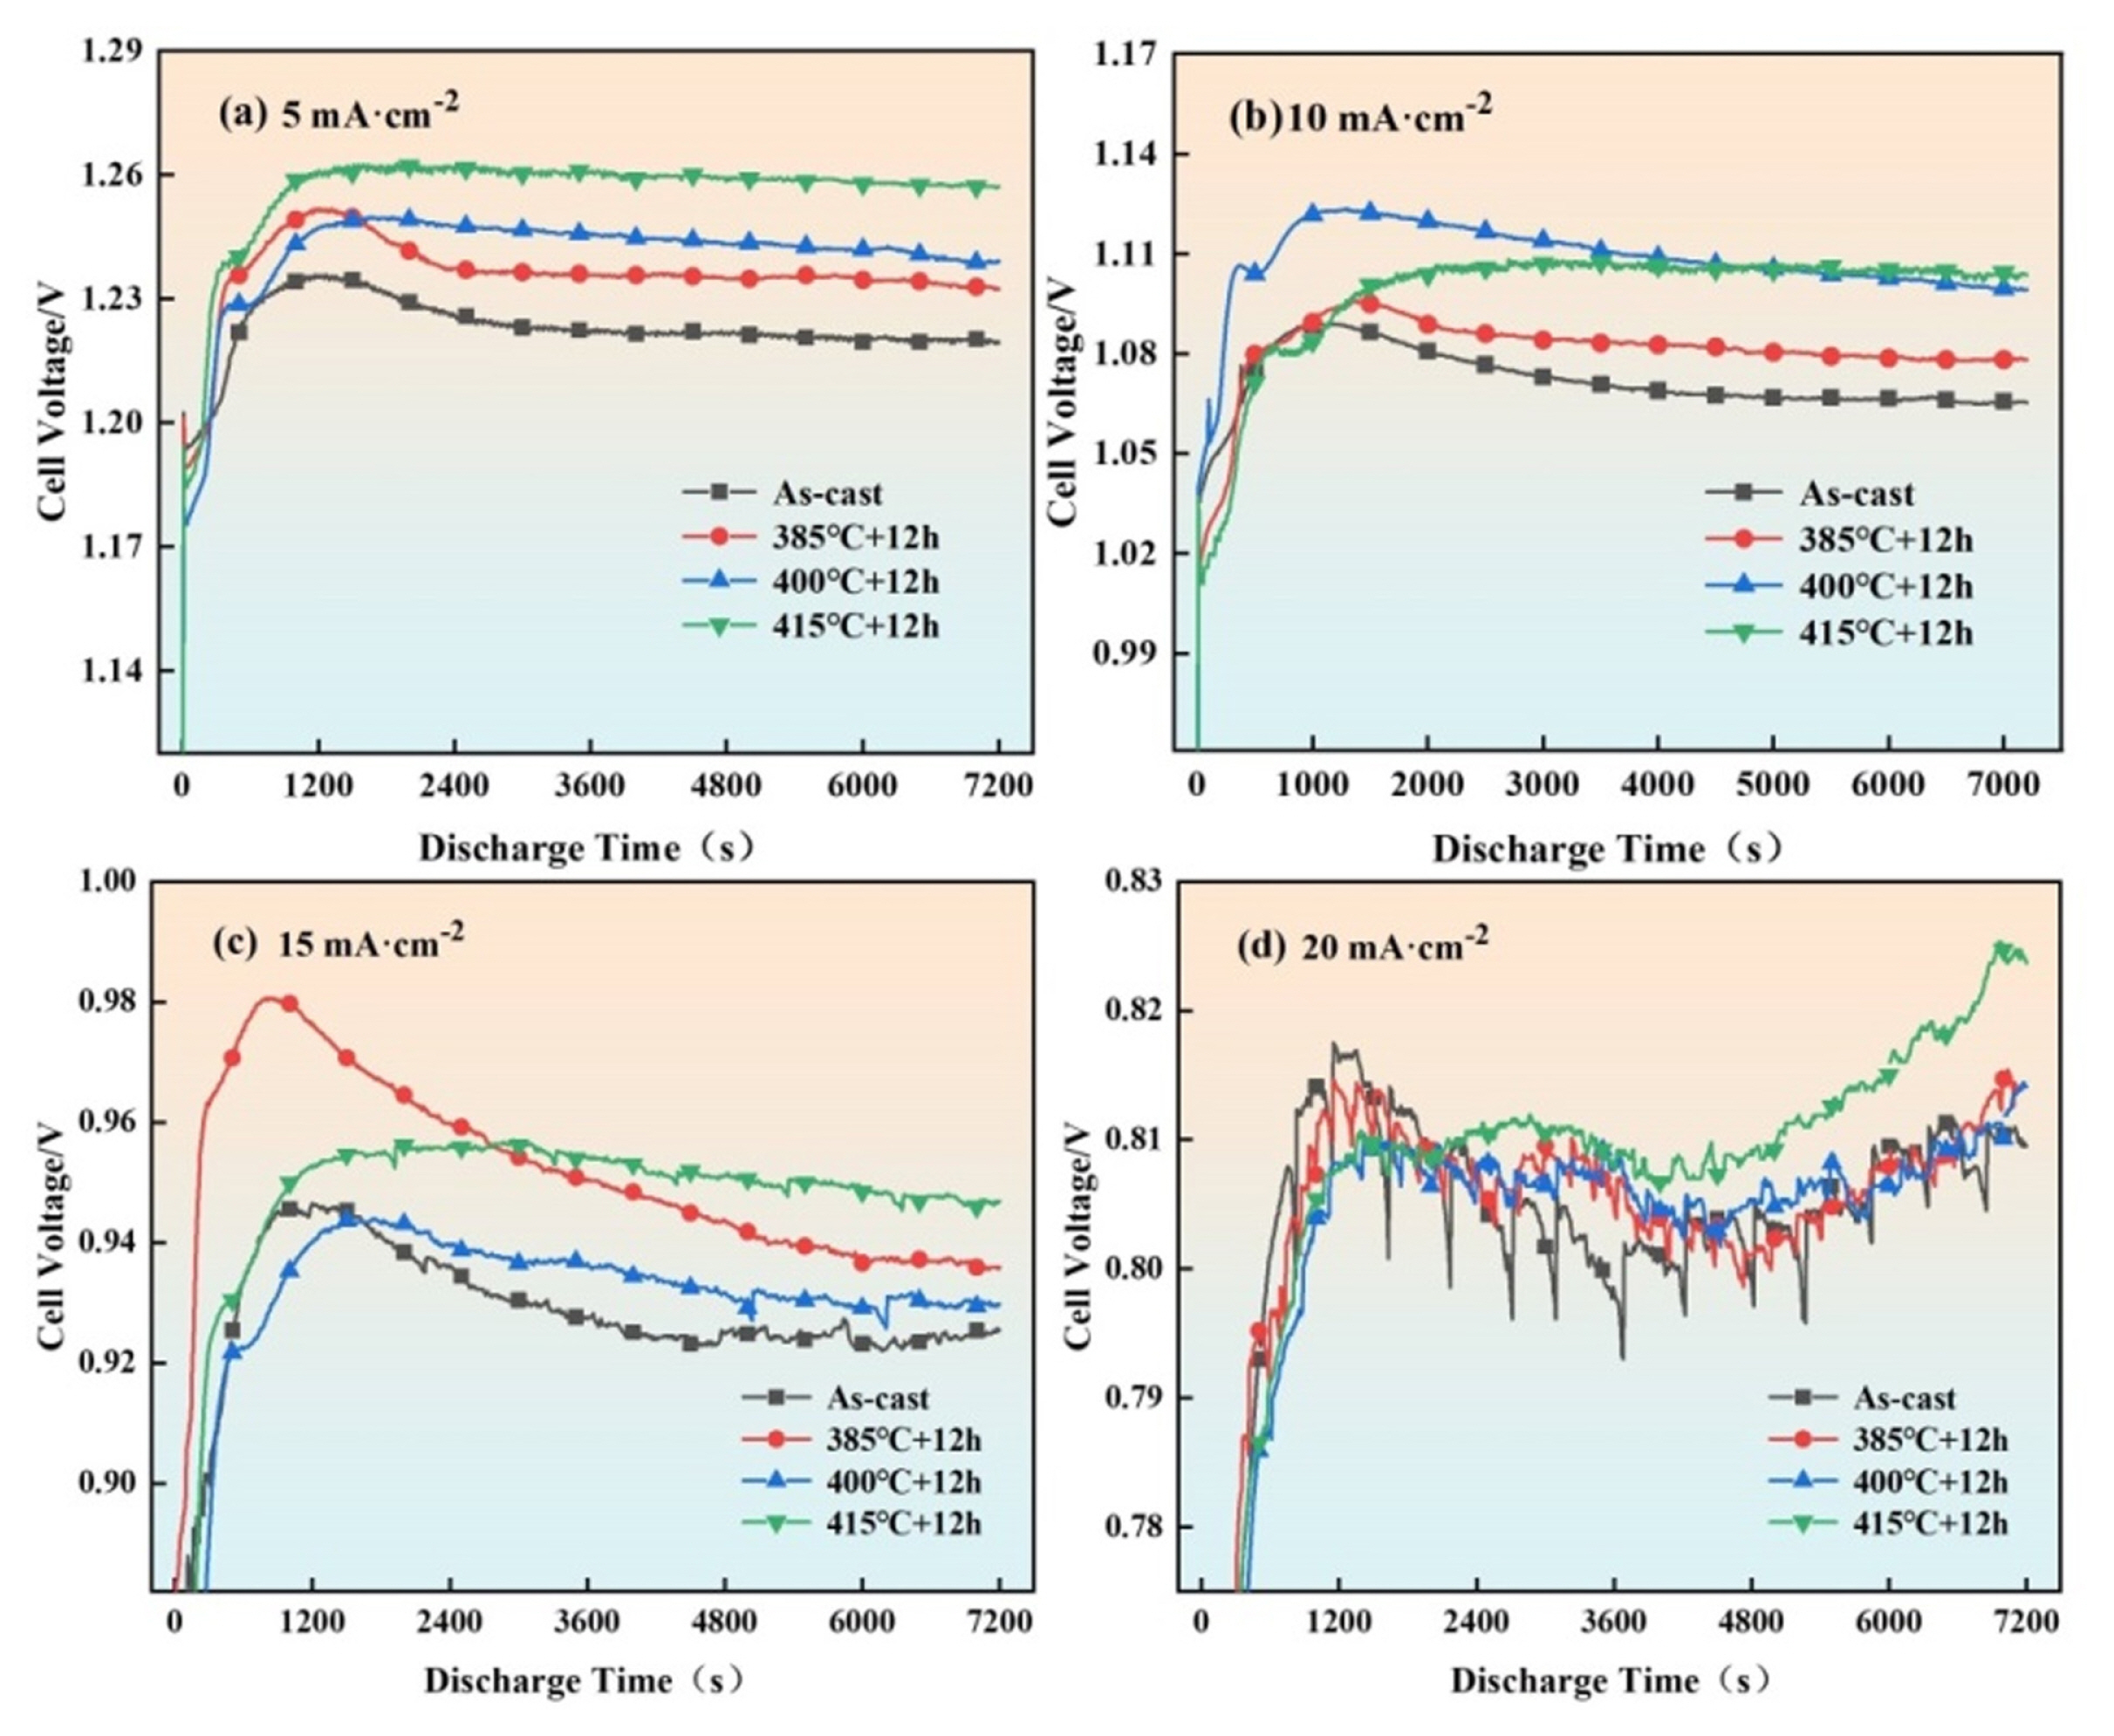
Discharge curves of the assembled Mg-air batteries with AZ91 anodes in 3.5 wt.% NaCl at different current densities (discharge for 2 h): (a) 5, (b) 10, (c) 15, and (d) 20 mA·cm−2
At current densities of 10 and 15 mA·cm−2, the discharge curves showed a trend of first increasing, then decreasing, and then stabilizing, which was related to the balance of deposition and shedding of discharge products on the alloy surface. At a current density of 20 mA·cm−2, the discharge voltage curves of the four alloys showed sawtooth fluctuations, which may be affected by the more intense discharge process of the alloys at high current densities, resulting in the breaking of the balance between the deposition and shedding of discharge products [34].
Table 5 shows the utilization efficiency, specific energy, and specific capacity of magnesium alloy anodes in magnesium-air batteries at different current densities. The results show that the utilization efficiency of the magnesium alloy anode after solution-treated at 415°C+12 h and 400°C+12 h increased to 50.3650% and 48.7633% respectively compared with the as-cast at a current density of 5 mA·cm−2. Furthermore, the specific capacity and specific energy also increased. At a current density of 15 mA·cm−2, the utilization efficiency of the magnesium alloy anode treated at 415°C+12 h was increased by 15.24% and the anode utilization rate reached 56.326%. However, at 10 and 20 mA·cm−2 current densities, the discharge performance of the solution-treated AZ91 magnesium alloy as magnesium-air battery anode decreased, which may be because the solution-treated magnesium alloy increased its discharge voltage and also increased its internal self-corrosion, resulting in a decrease in its anode utilization.
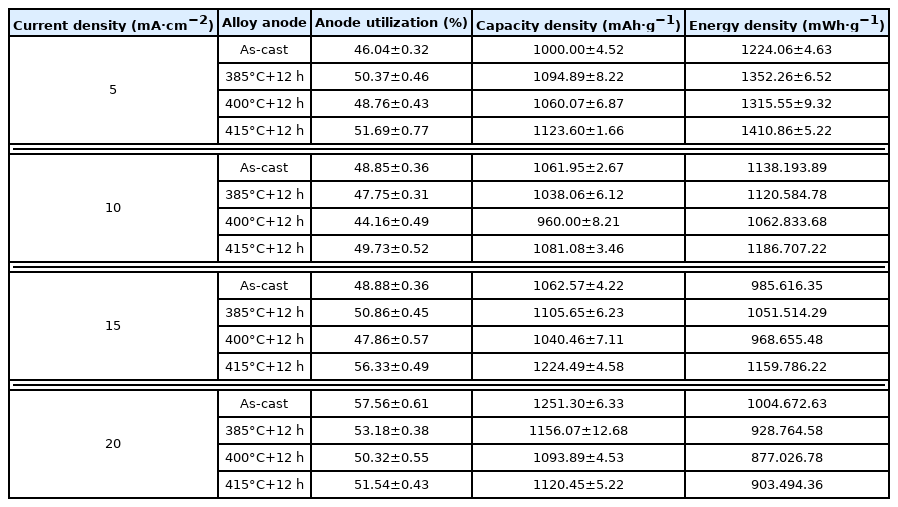
Discharge performance of Mg-air battery with AZ91 alloy
In terms of AZ91 as a magnesium alloy anode, there is a linear relationship between the discharge efficiency and current density; the higher the current density, the higher the discharge efficiency; specific energy and current density do not have a linear relationship. The highest values of specific energy of the four alloys are at 5, 5, 5, and 10 mA·cm−2 current density, respectively. The specific energy of the AZ91 magnesium alloy anode decreased significantly at current densities of 15 and 20 mA·cm−2, which was related to the drop of discharge voltage at high current densities. It can also be seen from the figure that as the current density increases, the discharge efficiency of the magnesium alloy anode tends to increase and the specific energy tends to decrease.
4. Conclusions
The effects of solution-treated on the microstructure, corrosion resistance, electrochemical properties, and discharge performance of AZ91 magnesium alloy as an anode for magnesium alloy batteries were studied, and the main conclusions can be addressed as follows:
With the increase of the solution temperature of AZ91 magnesium alloy, the amount of the second phase dissolved in the matrix increases, and the corrosion resistance shows a trend of first decreasing and then increasing.
In the discharge performance test, the AZ91 solution-treated at 415°C+12 h has the strongest discharge activity and higher discharge voltage; it has excellent discharge performance compared with the other three alloys.
The proportion and distribution of the second phase have a direct impact on the discharge performance of the alloy.
Acknowledgements
This work was supported by the National Natural Science Foundation of China (52075357); the national key R & D plan project (2018YFA0707301); and the Graduate Innovation Project of Taiyuan University of Science and Technology (XCX212066).
Notes
Declaration of Competing Interests
The authors declare that they have no known competing financial interests or personal relationships that could have appeared to influence the work reported in this paper.