Zn3(PO4)2 Protective Layer on Zn Anode for Improved Electrochemical Properties in Aqueous Zn-ion Batteries
Article information
Abstract
Aqueous zinc-ion batteries are considered as promising alternatives to lithium-ion batteries for energy storage owing to their safety and cost efficiency. However, their lifespan is limited by the irreversibility of Zn anodes because of Zn dendrite growth and side reactions such as the hydrogen evolution reaction and corrosion during cycling. Herein, we present a strategy to restrict direct contact between the Zn anode and aqueous electrolyte by fabricating a protective layer on the surface of Zn foil via phosphidation method. The Zn3(PO4)2 protective layer effectively suppresses Zn dendrite growth and side reactions in aqueous electrolytes. The electrochemical properties of the Zn3(PO4)2@Zn anode, such as the overpotential, linear polarization resistance, and hydrogen generation reaction, indicate that the protective layer can suppress interfacial corrosion and improve the electrochemical stability compared to that of bare Zn by preventing direct contact between the electrolyte and the active sites of Zn. Remarkably, MnO2 || Zn3(PO4)2@Zn exhibited enhanced reversibility owing to the formation a stable porous layer, which effectively inhibited vertical dendrite growth by inducing the uniform plating of Zn2+ ions underneath the formed layer.
1. Introduction
Considering the climate crisis and the need to reduce the usage of fossil fuels, which are the main cause of greenhouse gases, as well as the global demand for increasing the use of ecofriendly renewable energy sources in grid operations, expanding the utilization of energy storage systems (ESSs) with the production of renewable energy generators is the first step in creating a better society for all [1]. Lithiumion batteries (LIBs) are prevalent in the current battery market owing to their excellent performance, including high energy density and stable reversibility [2,3]. Nevertheless, their disadvantages, such as safety issues, limited supply of lithium, and high cost of rare earth metals used in cathodes, limit their development for large-scale energy storage applications [4,5]. Owing to the recent fire incidents of LIBs developed for ESSs, securing battery safety has become a prime factor in the selection of large-scale battery systems. As one of the fatal failures, the use of organic electrolyte in LIBs can cause thermal runaway due to internal defects or external stress factors [6–8]. To prevent such fatal fire risks, significant efforts have been devoted to the development of alternative safe battery systems with LIBs.
Aqueous zinc-ion batteries (AZIBs) are one of the promising electrical devices for grids because of their inherent safety, low cost, and eco-friendliness [9–11]. The Zn-metal anode of AZIBs has advantages in terms of a high theoretical capacity (820 mAh g−1, 5855 mAh cm−3), relatively low redox potential (−0.76 V vs. standard hydrogen electrode), high safety, and non-toxicity [12–14]. However, the Zn anode also suffers from dendrite growth, similar to common metal anodes. Irregular and uncontrollable Zn deposition is the main reason for Zn dendrite growth during the Zn plating process [15]. The Zn dendrites cause undesirable short circuit and battery failure issues, although dendrite growth in AZIBs does not result in the same detrimental outcome, such as cell explosion, as in LIBs [6–8,16–18]. In a zinc foil electrode, zinc ions tend to deposit onto specific sites enclosed by uneven and inhomogeneous electric fields and concentrated electric fields (tip effect); these sites continuously grow into protuberances and attract more Zn2+ flux onto adjacent regions of the tips [15,19]. In addition to Zn dendrite growth, competitive hydrogen evolution [20,21] and corrosion reactions occur continuously in AZIBs because of the intrinsic electrochemical instability of the Zn metal in mildly acidic aqueous electrolytes [22,23]. The continuous hydrogen evolution causes pH changes, which further induce the formation of by-products at the electrode/electrolyte interface as the physical contact surface increases [24].
To enhance the performance of Zn anodes in neutral electrolytes, significant efforts have recently been dedicated to inhibit Zn dendrite growth and side reactions [25] using various methods, such as the use of electrolyte additives [26] and highly concentrated electrolytes [27], and the formation of artificial and Zn2+-conducting organic [28] and inorganic [29] layers on the electrode surface. Surface coatings using polymers, such as poly(vinyl butyral) [30] and sulfonated poly(ether ketone) [31], and inorganic materials, such as ZnF2 [32], Ti-MoF [33], and Zn-Al [34], have been actively employed. In particular, Chu et al. designed an artificial solid electrolyte interphase (SEI) layer composed of ZnF2 and Zn3(PO4)2 on the Zn anode surface by electrochemical decomposition during cycling [29]. According to their study, SEI films from Zn surface-protecting layers, including ZnF2 and Zn3(PO4)2, show notable effects in inhibiting dendrite growth and suppressing side reactions during cycling. This was demonstrated by calculating the dendrite suppression ability (yE) of the Zn3(PO4)2. The extraordinary yE value of the Zn3(PO4)2 coating indicated its ability to effectively inhibit Zn dendrite growth [29]. Furthermore, as Zn3(PO4)2 not only suppresses the growth of Zn dendrites but also inhibits the corrosion reaction, it is considered to be effective for controlling metal corrosion reactions [35] and is being used as a corrosion inhibitor in many industries.
In this context, we propose the formation of a Zn3(PO4)2 protective layer using a precursor on the Zn surface for preventing dendrite growth and corrosion reactions during the charge/discharge process. We adopted the phosphidation method to synthesize multifunctional Zn3(PO4)2 from a precursor, NaH2-PO2 [36]. By controlling the amount of the phosphidation precursor, we could easily control the thickness of the Zn3(PO4)2 layer on the micrometer to nanometer scale. The Zn3(PO4)2 layer can be easily formed on the Zn anode in a short time without damaging it, which renders it both economically and industrially viable. We demonstrate that the formation of a Zn3(PO4)2 layer on the Zn surface via the phosphidation method is an effective way to suppress Zn dendrite growth and surface side reactions of zinc anodes.
2. Experimental
2.1 Preparation of a Zn3(PO4)2 protective layer on Zn foil
The Zn3(PO4)2 protective layer on the Zn anode was prepared by a phosphidation process. Commercial Zn foil (220 μm, 99.98% metals basis, Alfa Aesar) was polished with sandpaper to remove impurities such as oxidized products. The cleaned Zn foil and a specific amount (varied between 1.25 and 3.75 g) of sodium hypophosphite (NaH2PO2, Sigma–Aldrich) (see Table 1) were each placed in two different tube furnaces connected in series. For phosphidation, the temperatures of the tube with the Zn foil and the precursor were increased gradually at 5°C min−1 rate. The temperature of the first tube with NaH2PO2 was increased and maintained at 300°C for 1 h to generate phosphorus vapor, while the temperature of the second tube with the Zn foil was maintained at 100°C for 1 h. During heat treatment, Ar gas was used as the carrier to transport the phosphorus vapor generated by the thermal deposition of NaH2PO2 in the first tube onto the Zn foil in the second tube.

Mass composition of phosphorous corresponding to different variables in the synthesis of the Zn3(PO4)2 protective layer on Zn foil
2.2 Electrochemical measurements
A MnO2 electrode was prepared as the cathode by mixing MnO2 (β-phase, 85%, ~10 μm, Sigma–Aldrich), Super P black conduction agent, and a binder composed of polyacrylic acid, carboxymethyl cellulose, and styrene butadiene rubber at a weight ratio of 90:5:5 (1.25:1.25:2.5) by casting on SUS foil (11 μm) with a active mass loading of 0.6–0.7 mg cm−2. The experimental process also carried out in dry-room. To evaluate the electrochemical performance, 2032 coin-type cells were assembled with MnO2 as the cathode and Zn foil as the anode, separated by an cellulose membrane (NKK, 100 μm) and a glass filter (GF, 250 μm, Whatman, USA). The electrolyte was a mixture of 2 M zinc sulfate (ZnSO4) and 0.1 M manganese sulfate (MnSO4) in deionized water. The cells were tested in the voltage range of 1.0 to 1.85 V (vs. Zn/Zn2+) at 25°C under different current rates (1C and 3C) using a battery cycler (WBCS3000L, WonAtech, Korea). To evaluate the protective layer on the zinc anode, symmetric cell tests were conducted on Zn || Zn and Zn3(PO4 )2 @Zn || Zn3(PO4)2@Zn at various current densities in the range of 0.5 to 2.5 mA cm−2 in an aqueous electrolyte containing 2 M ZnSO4 and 0.1 M MnSO4. Electrochemical impedance spectroscopy (EIS) was conducted using a VMP3 cycler (Biologic, France) at an amplitude of 5 mV in the frequency range of 1 MHz to 0.1 Hz. For corrosion analysis, potentiodynamic polarization curves were obtained using Zn || Zn and Zn3(PO4)2@Zn || Zn3(PO4)2@Zn symmetric cells within the potential range of −0.2 to +0.2 V, at scan rate of 5 mV s−1.
2.3 Characterization
The obtained electrode was observed using a Field-Emission Scanning Electron Microscope (FE-SEM; Hitachi, S-4800, Japan) and a Cross-section Polisher (CP; JEOL, SM-09010, Japan) to analyze the surface morphology and elemental distribution. X-ray Diffraction (XRD; Panalytical X'Pert PRO MPD, Philips, The Netherlands) was performed using Cu Kα radiation in the 2θ range of 10° to 90° to study the phase and structure of the Zn3(PO4)2 layer. High-Performance X-ray Photoelectron Sepctroscopy (HRXPS; ThermoFisher, K-alpha+, USA) was conducted to identify the chemical bonding of the Zn3(PO4)2 layer. A Field-Emission Transmission Electron Microscope (FE-TEM; FEI Company, Titan G2 ChemiSTEM Cs Probe, USA) and a Focused Ion Beam (FIB; Hitachi, NX5000, Japan) were used to investigate the lattice structure of the Zn3(PO4)2 layer.
3. Results and Discussion
A phosphorous-containing protective layer was synthesized on the surface of Zn anode via phosphidation. This process has many advantages, such as a short synthesis time and control of the coating thickness by simply adjusting the precursor amount. In the phosphidation process, NaH2PO2 used as the precursor was decomposed into phosphorous vapor at 300°C [36] and deposited on the surface of the Zn metal. The protective layer is composed of chemical compounds formed by the reaction of the deposited phosphorus with Zn. To confirm the effect of the precursor amount on the products formed, the precursor quantity was varied as 1.25, 2.5, and 3.75 g (the corresponding samples are denoted as Zn-P 1.25 g, Zn-P 2.5 g, and Zn-P 3.75 g, respectively). The amount of phosphorus generated by the decomposition of NaH2PO2 is shown in Table 1.
To investigate the elemental composition and understand the crystal structure of the coating layer composed of Zn and P on the Zn-metal anode, XRD was conducted. Fig. 1 shows the XRD patterns of the pristine Zn foil and Zn-P@Zn samples. All the peaks of the Zn foil could be indexed to the hexagonal phase of Zn belonging to the P63/mmc space group (ICSD #65791), and no impurity peaks were observed. The broad peak at 2θ = 20°–25° is due to undefined residues on the Zn surface after the polishing process. The Zn foils with a protective layer composed of Zn-P compounds yielded no additional peaks compared with those of the pristine Zn electrode because the protective layer was extremely thin to be detected, indicating that the P source decomposed from NaH2PO2 was deposited on the surface of the bare Zn metal as a thin layer.
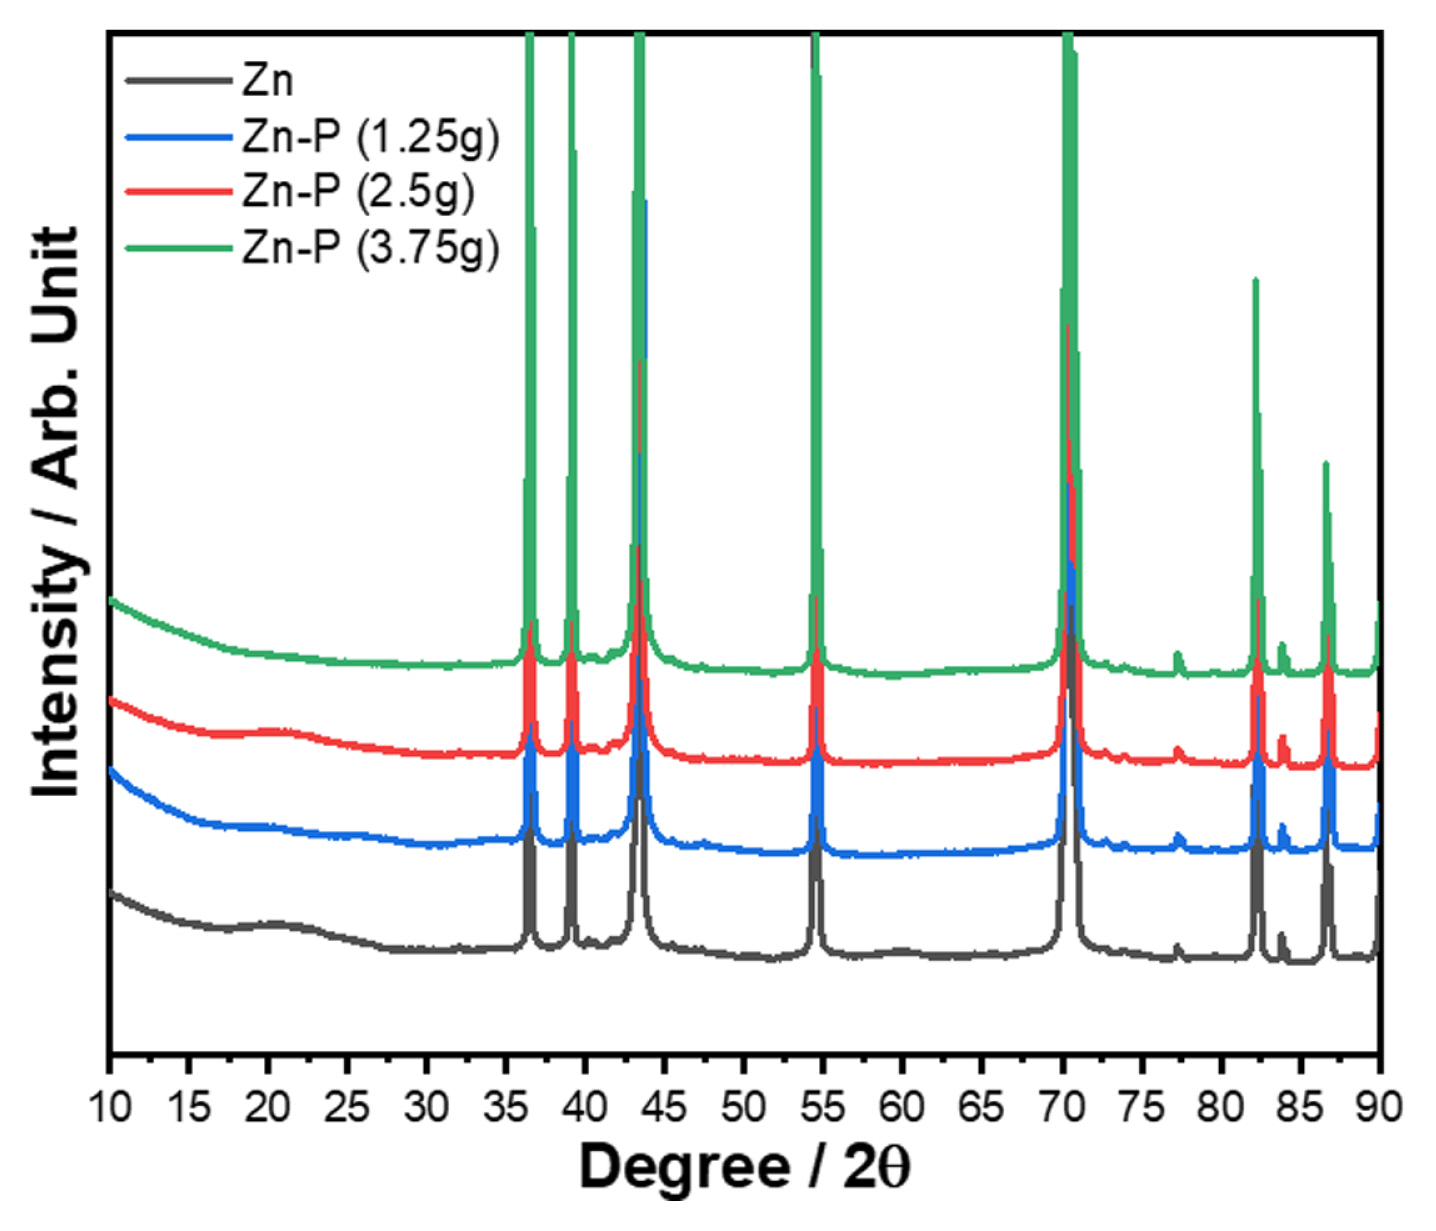
XRD patterns of the bare Zn foil and Zn foils subjected to phosphidation using different amounts of the P precursor (NaH2PO2).
The surface morphology of Zn with and without the Zn-P protecting layer was analyzed using FE-SEM. Fig. 2 shows the SEM images and EDS maps of the bare Zn foil and Zn foils with a Zn-P protecting layer. As shown in Fig. 2(a), the bare Zn foil had a clean and flat surface without any impurities because of the elimination of the protruding residues by the polishing process. However, the surface of the Zn-P-coated Zn foil was covered with nanosized particles, as shown in Fig. 2(b). As the amount of NaH2PO2 increased, larger particles appeared on the surface (Fig. 2(c,d)). This is because P vapor produced by the decomposition of NaH2PO2 was uniformly deposited on the Zn electrode surface, and then the cohesive force between the particles of the product became stronger than the dispersion force between the particles and Zn-metal surface. EDS mapping analysis (Fig. 2(e–g)) revealed that the particles on the surface of the Zn foil consisted of oxygen and phosphorus; the larger particles were also composed of phosphorus and oxygen. Fig. 2(h–j) shows the cross-sectional SEM images of the Zn-P-coated Zn anode. A uniform surface layer with a thickness of 1 μm is observed for the Zn-P 1.25 g-coated Zn anode. As the amount of the precursor was increased, the particles containing phosphorous and oxygen grew in size on the surface of zinc. Based on the XRD and SEM analysis results, we determined that the coating obtained using 1.25 g of the P precursor formed the most uniform layer with nanosized particles.
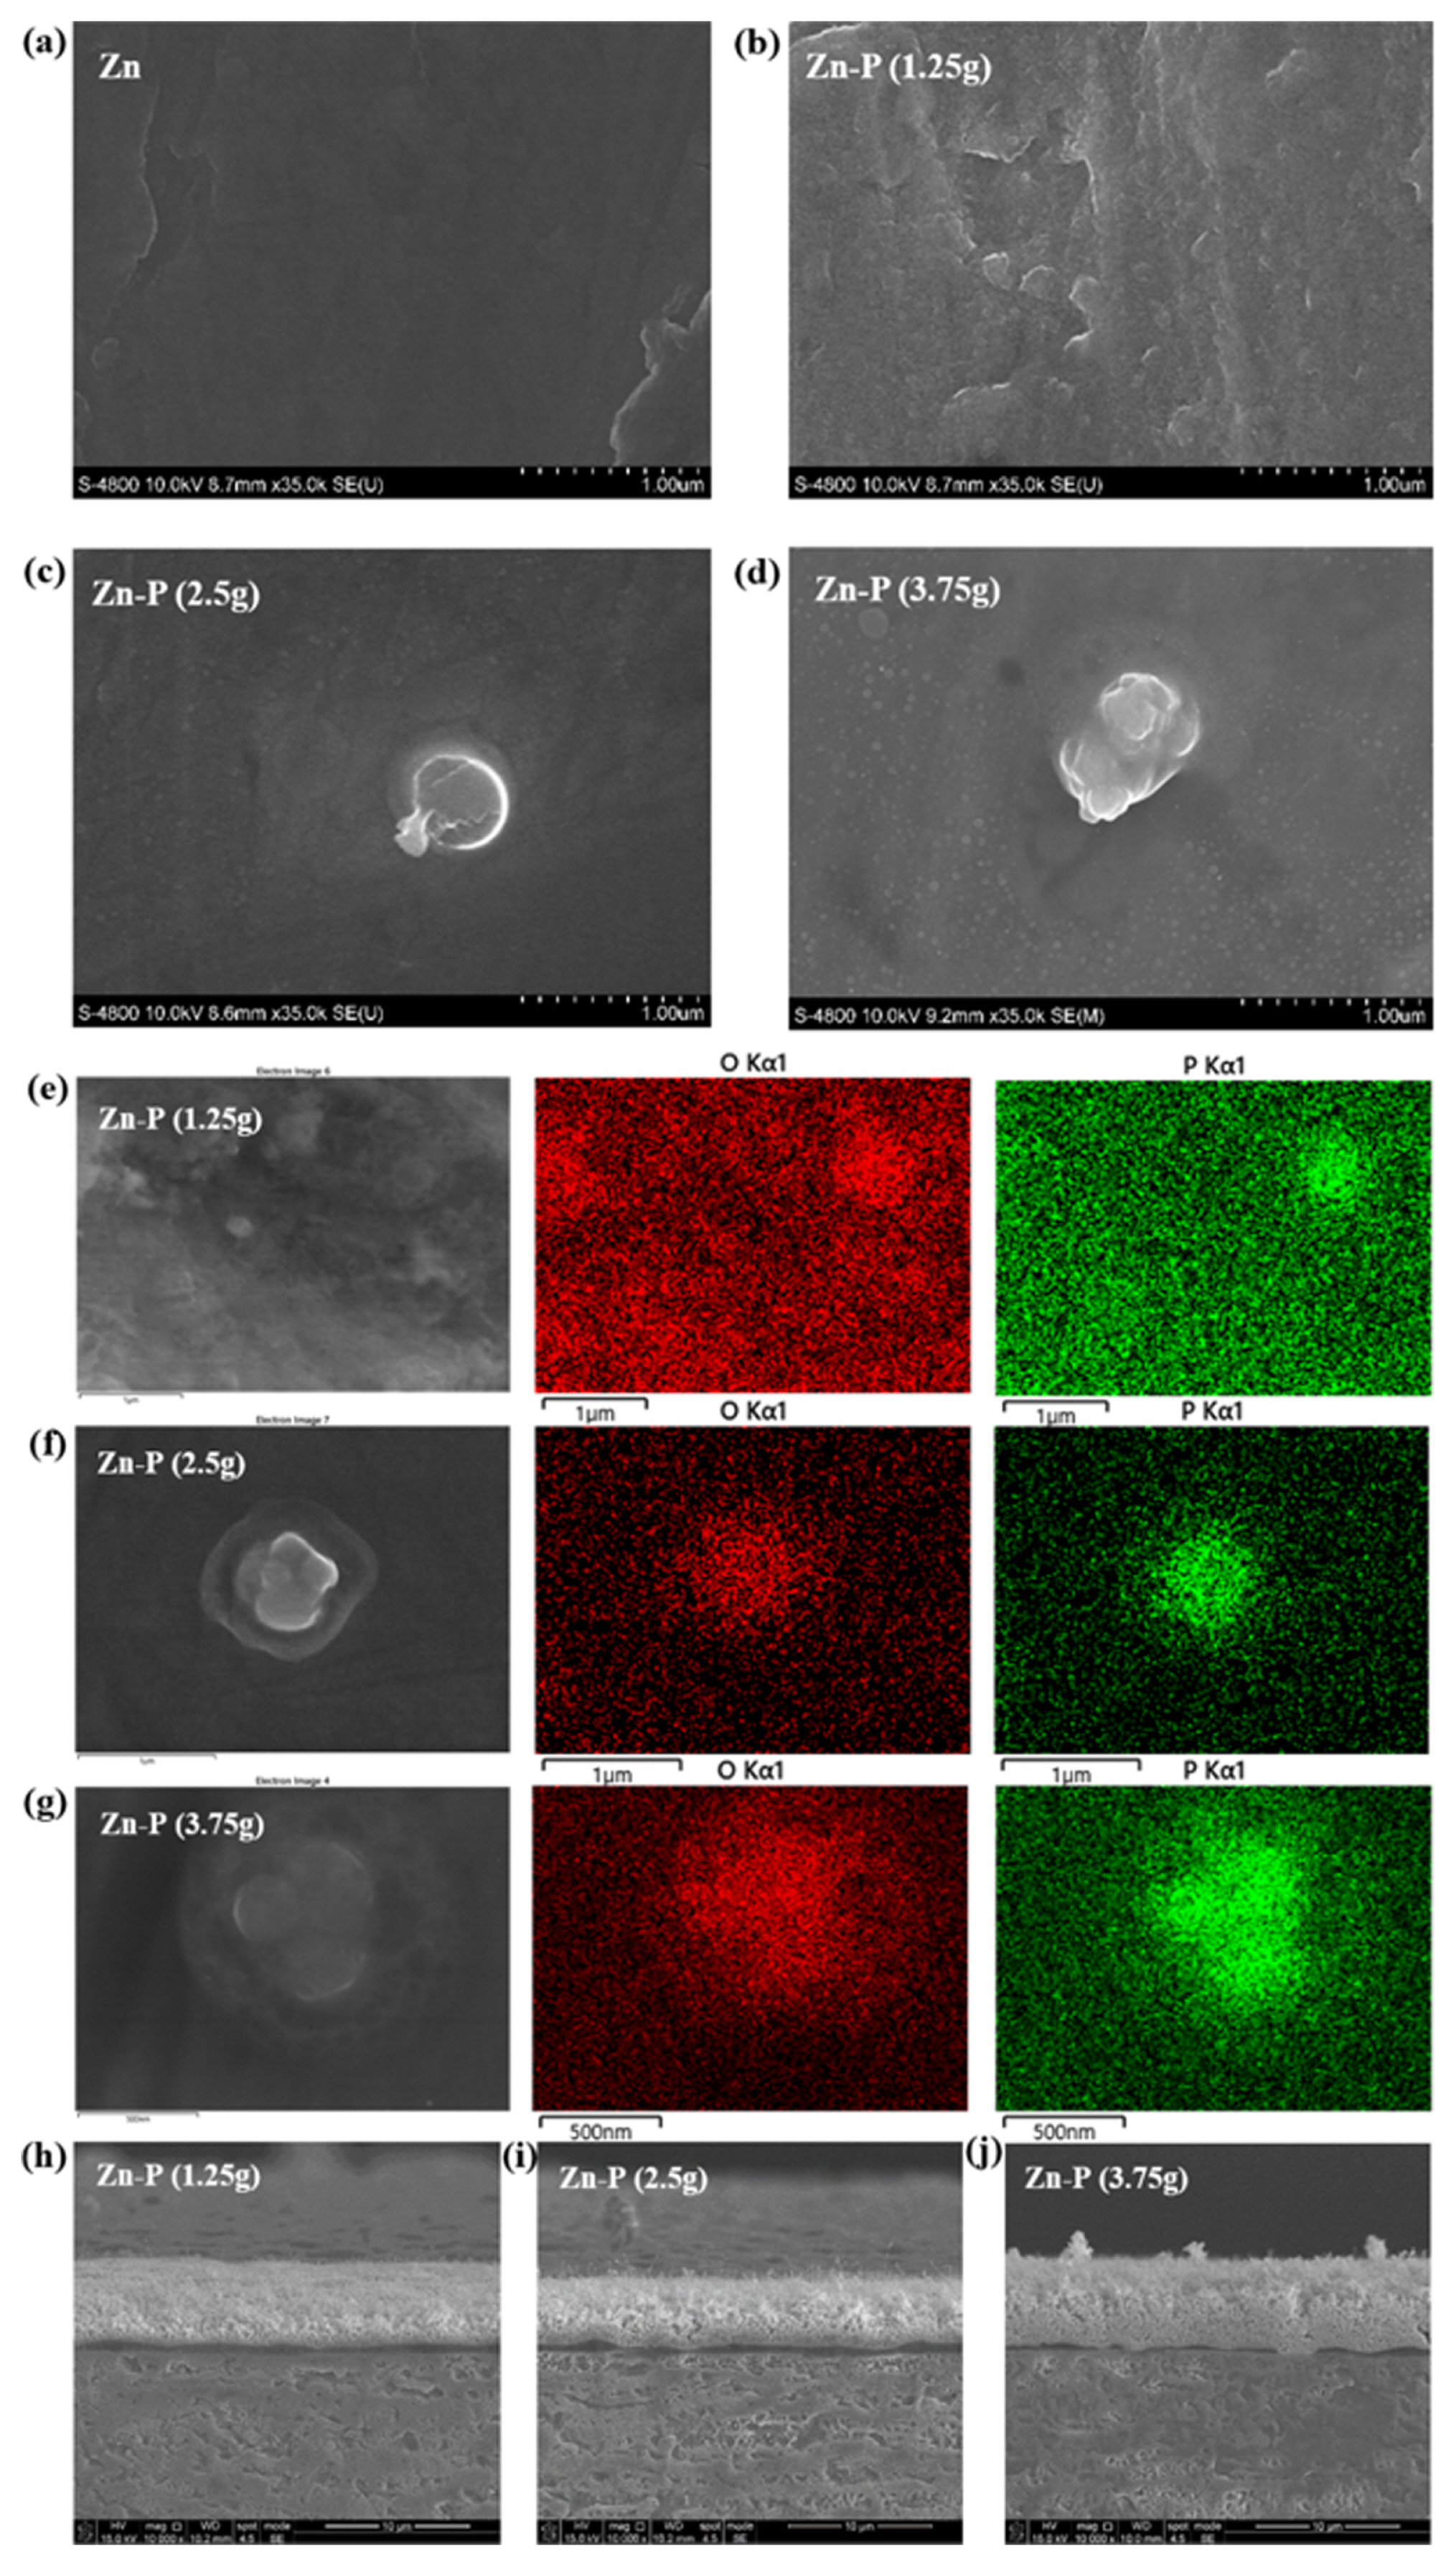
Top-view SEM images of the (a) bare Zn foil and Zn foils coated with Zn-P using (b) 1.25 g, (c) 2.5 g, and (d) 3.75 g of the P precursor. EDS elemental maps of the Zn foils coated with Zn-P using (e) 1.25 g, (f) 2.5 g, and (g) 3.75 g of the P precursor and cross-sectional SEM images of the Zn foils coated with Zn-P using (h) 1.25 g, (i) 2.5 g, and (j) 3.75 g of the P precursor.
To further investigate the phase and structure of the protective layer on the Zn foil, XPS analysis was conducted on the bare Zn foil and Zn-P 1.25 g-protected Zn foil (see Fig. 3). Fig. 3(a) shows the XPS P 2p spectra of bare Zn and Zn-P 1.25g-protected Zn foil. The deconvoluted peaks at 134.2 eV and 133.3 eV, corresponding to the Zn3(PO4)2 2p1/2 and Zn3(PO4)2 2p3/2 [37] were only observed for the Zn anode with the Zn-P protecting layer, not for the bare Zn anode. In the O 1s spectra (Fig. 3(b)), the deconvoluted peaks at 532.6 eV and 531.4 eV were corresponded to the bridging oxygen components (BO) and non-bridging oxygen components (NBO) of Zn-O bonding, respectively [38]. The bare Zn anode is comprised of weak NBO bonding and dominant BO bonding because the oxide film was thinly formed on the surface of Zn metal. On the other hands, the NBO peak for Zn anode with the Zn-P protecting layer was strongly observed because of presence of NBO structure in the Zn3(PO4)2 coating layer [29]. Zn 2p spectra exhibit ZnO 2p1/2 (1045.6 eV) and 2p3/2 (1021.5 eV) chemical bonding. The Zn anode with the Zn-P protecting layer shows increasing peak intensity in the entire spectrum, because of oxygen in the Zn-P protecting layer. In summary, the XPS analysis demonstrate that the coating layer synthesized on the Zn surface by the phosphidat ion method exists in the form of Zn3(PO4)2.

XPS profiles of the (a) P 2p, (b) O 1s, and (c) Zn 2p levels for bare Zn and Zn-P coated Zn.
Fig. 4 shows the FE-TEM images and depth profile of the Zn3(PO4)2@Zn foil representing the atomic ratios of Zn, O, and P. The protective layer of the Zn3(PO4)2@Zn anode consists of well-crystallized grains of Zn3(PO4)2 and an amorphous region consisting of residual phosphorous and other unknown compounds. The lattice spacings in the FE-TEM images of Zn3(PO4)2 were determined to be 0.248 and 0.239 nm, which are consistent with the (020) and (024) lattice plane distances of Zn3(PO4)2, respectively (Fig. 4(b,d)). Fig. 4(a) and (c) show the reciprocal lattice patterns corresponding to the (020) and (024) planes of Zn3(PO4)2, which confirm the lattice constants. Fig. 4(e) shows the depth profile of the Zn3(PO4)2@Zn anode. As the depth of the layer increased, the oxygen and phosphorus elemental ratios increased. The results indicate that Zn3(PO4)2 on the surface of the Zn anode exists as dispersed polycrystalline nanosized particles.
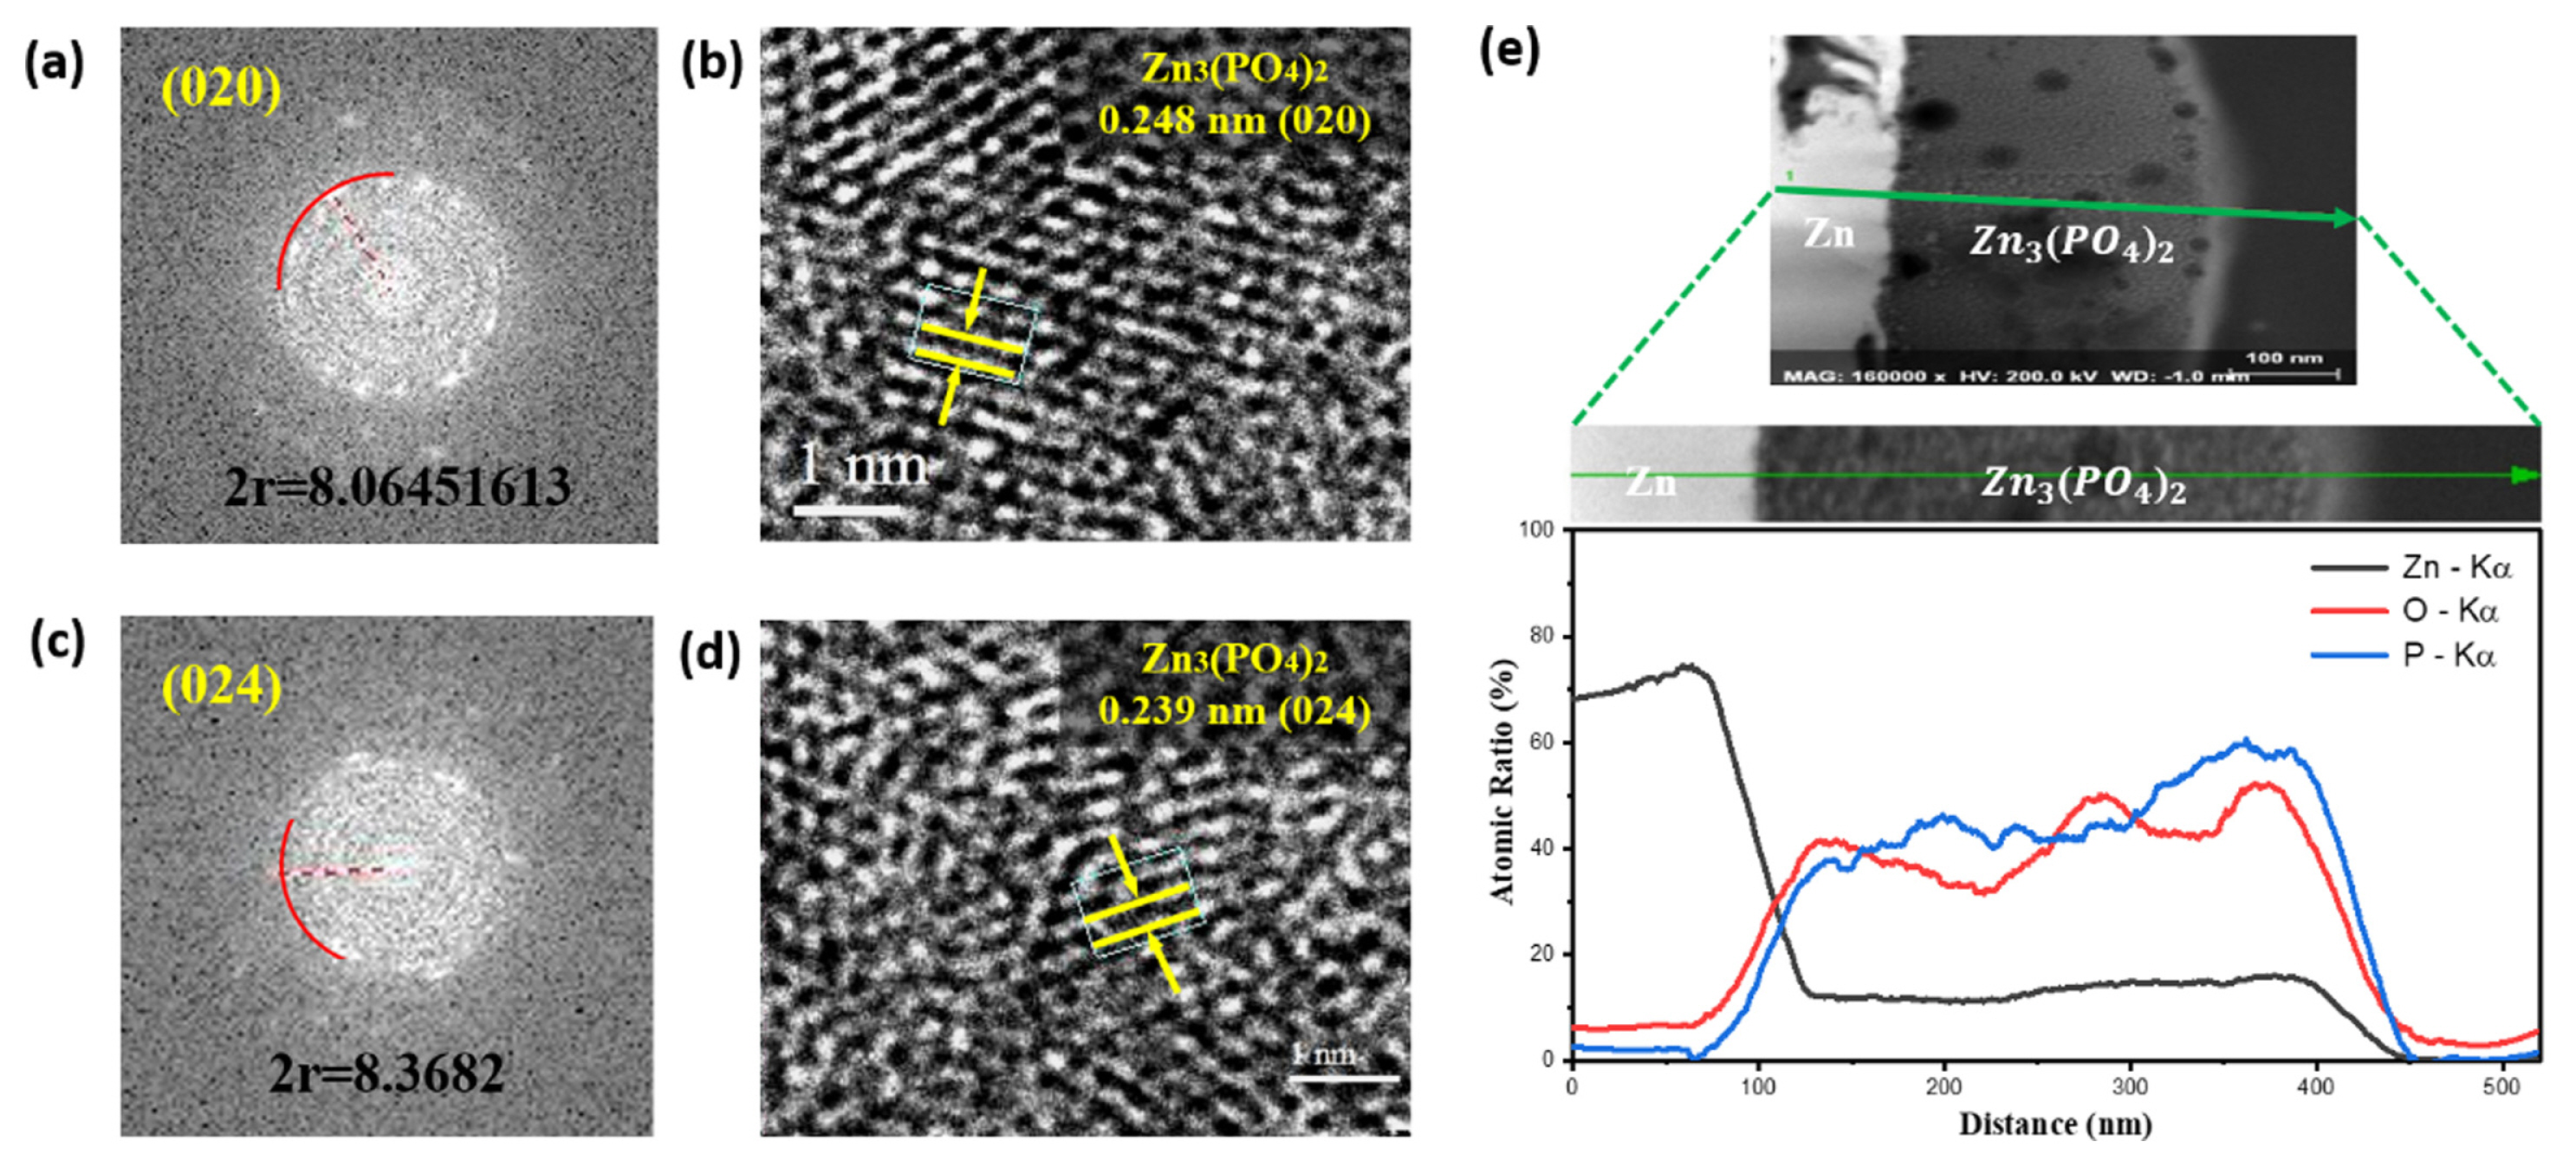
FE-TEM analysis of the Zn3(PO4)2 layer: reciprocal lattice pattern of the (a) (020) and (c) (024) planes of Zn3(PO4)2, and lattice fringes corresponding to the (b) (020) and (d) (024) planes of Zn3(PO4)2. Depth profiles of Zn with a Zn3(PO4)2 layer representing the atomic ratios of Zn, O, and P.
To evaluate the electrochemical performance of the Zn3(PO4)2@Zn anode, symmetric cells were assembled and tested at different current densities. Fig. 5 shows the typical voltage profiles of Zn || Zn and Zn3(PO4)2@Zn || Zn3(PO4)2@Zn symmetric cells recorded during Zn2+ plating/stripping processes. As shown in Fig. 5(a), the bare Zn anode exhibited stable Zn plating/stripping cycling with an average overpotential of 100 mV for 50 cycles and suffered from a rapid internal short circuit after 50 cycles because of the growth of Zn dendrites on its surface and side reactions occurring during the Zn plating/stripping processes [39]. In contrast to bare Zn, Zn3(PO4)2@Zn exhibited excellent cycling stability with an average overpotential of 40 mV for at least 500 cycles. Furthermore, it exhibited a lower voltage hysteresis (55 mV) than that of the bare Zn anode (131 mV) in the first cycle, suggesting that an appropriate protective layer on the Zn anode can significantly improve its electrochemical properties. Moreover, Zn3(PO4)2@Zn also exhibited a more stable and lower voltage hysteresis at higher current densities (Fig. 5(b)). The overpotential represents an increase in the interfacial resistance and a decrease in the ionic conductivity between the electrolyte and metal anode [40]. The higher polarization in the symmetric cell test indicated that the Zn2+ ions were unevenly distributed and grew into initial protuberances with a higher local current density on the surface of the Zn metal during the plating process [41]. Further, the Zn2+ ions agglomerated around the tips of the protuberances on the surface of the Zn anode, which further accelerated the Zn dendrite growth, resulting in an internal short circuit. These results indicate that a Zn3(PO4)2 protective layer on Zn anodes can effectively suppress Zn dendrite formation and enhance the Zn anode performance.
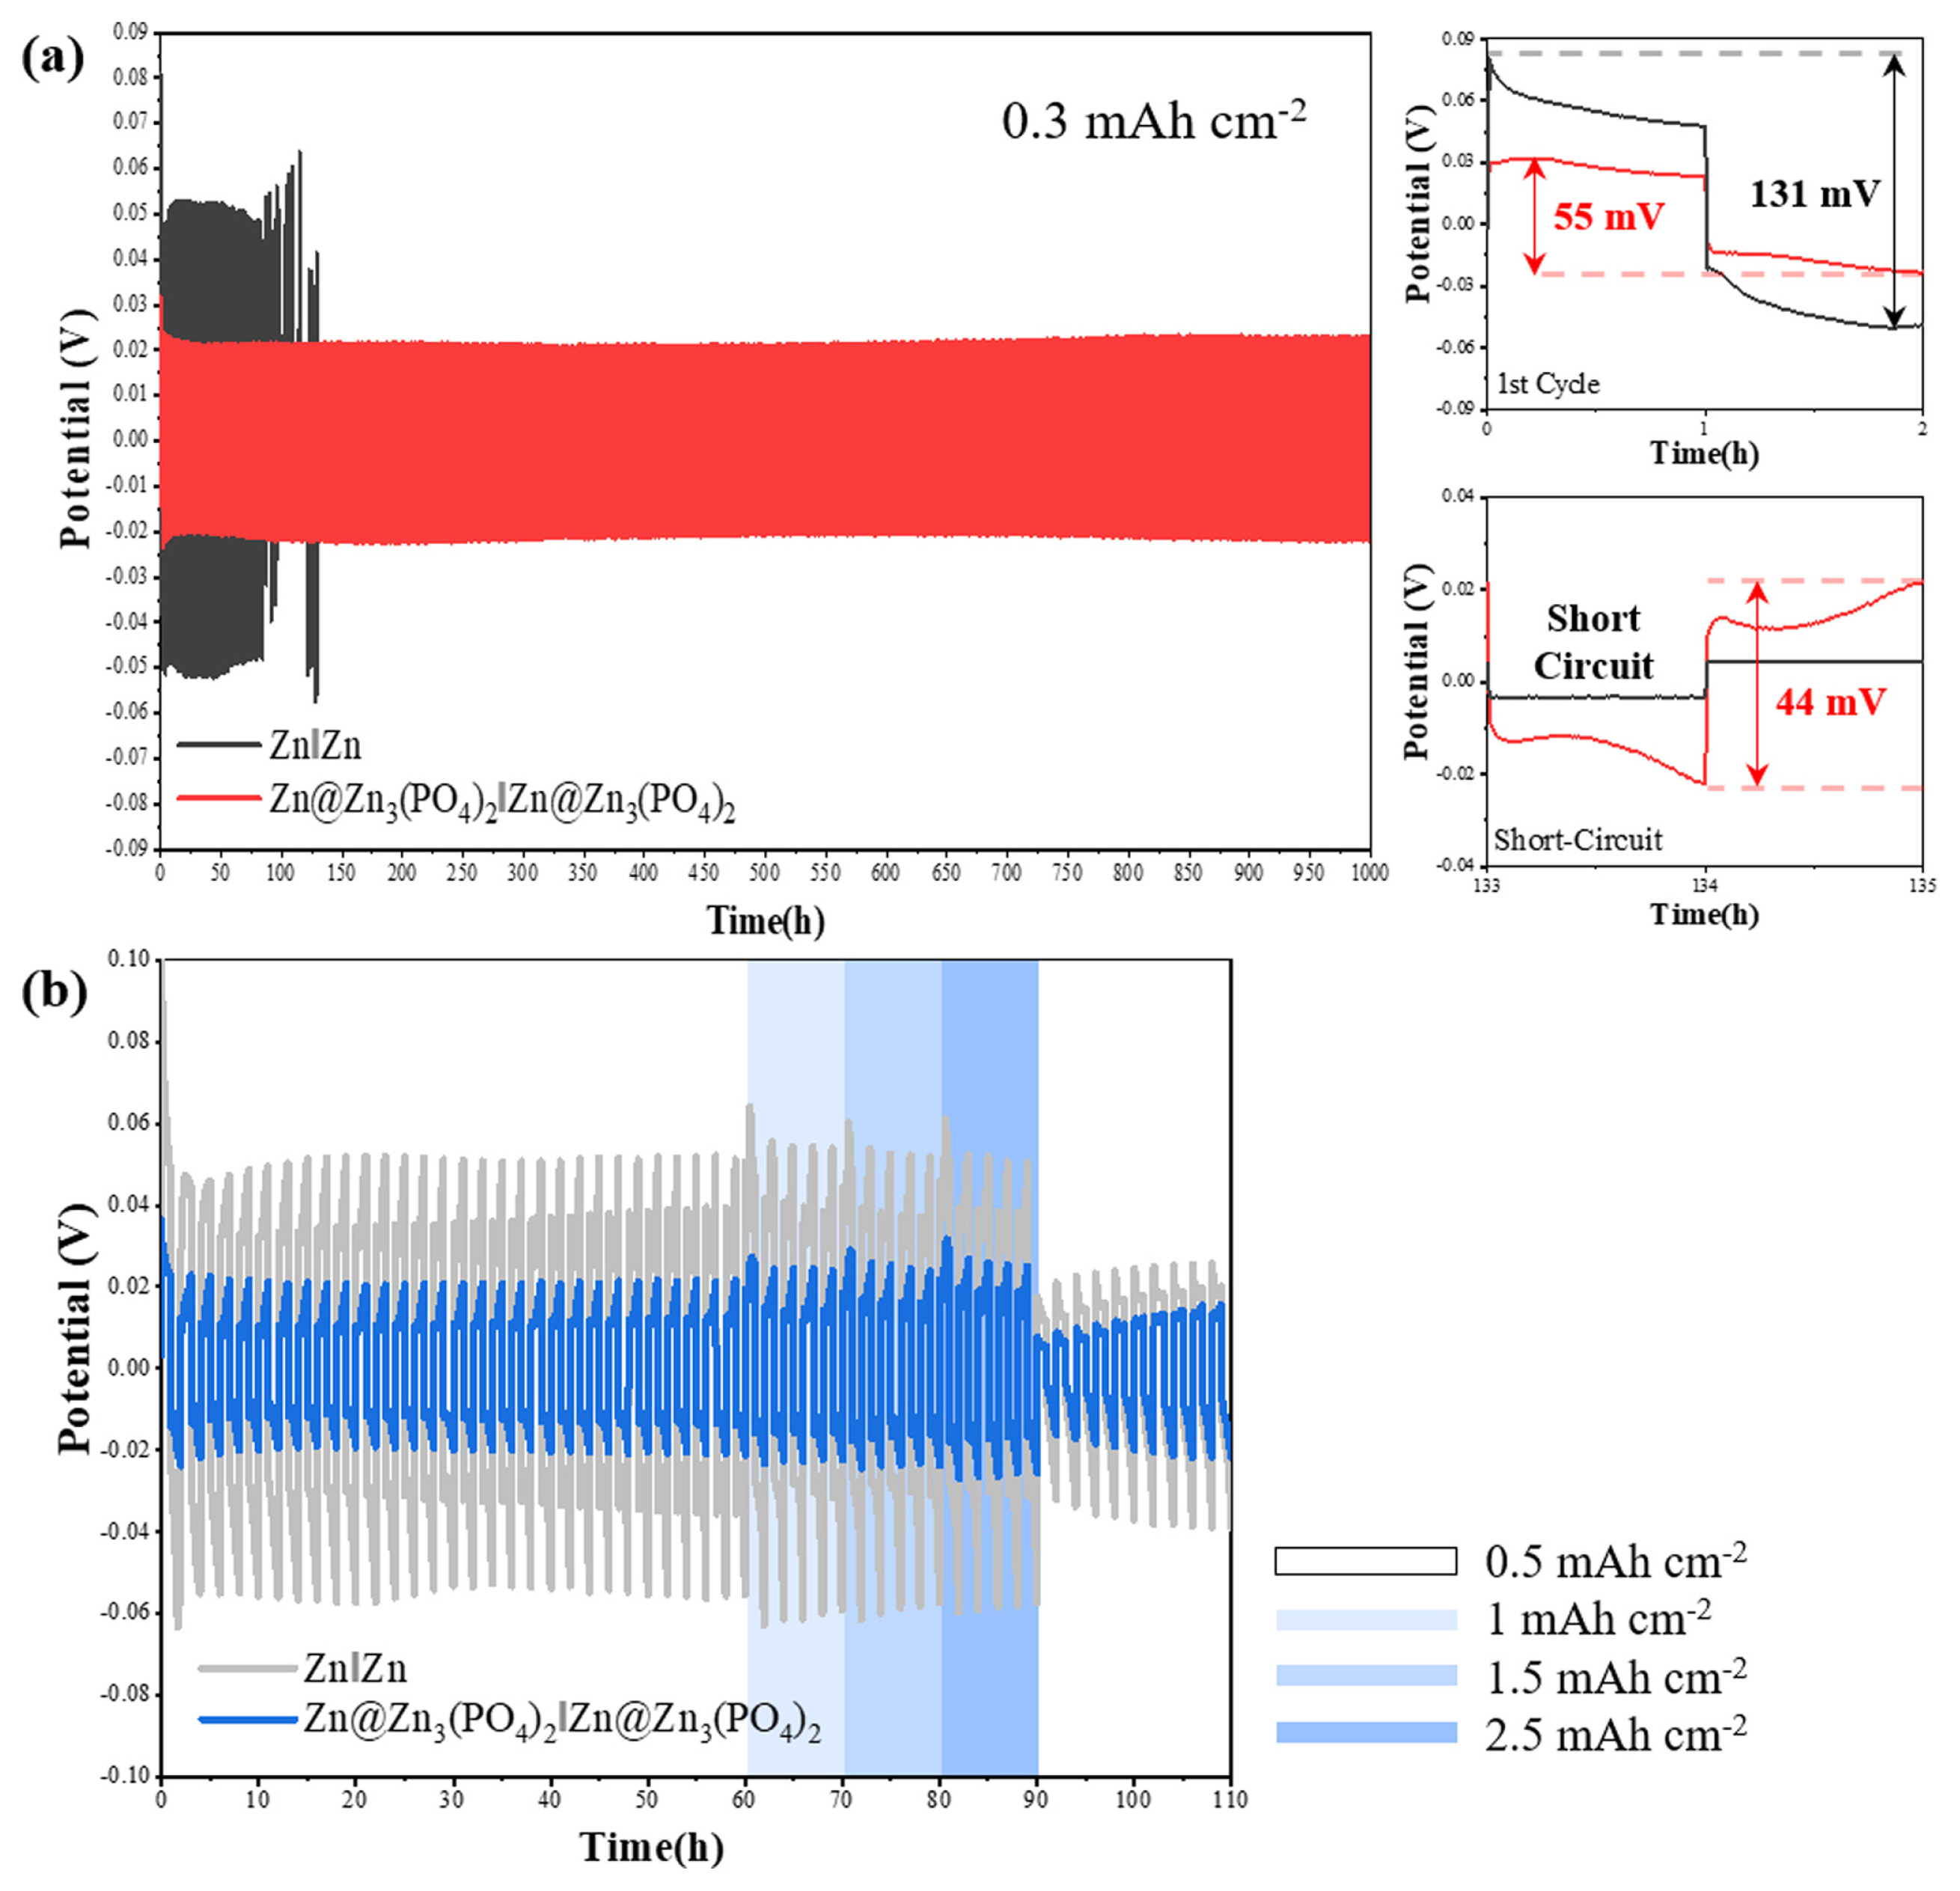
Galvanostatic cycling voltage profiles for Zn Zn, Zn3(PO4)2@Zn Zn3(PO4)2@Zn symmetric cells at a current density of (a) 0.3 mA cm−2 and at different current densities of (b) 0.5, 1, 1.5, and 2.5 mA cm−2.
To evaluate the electrochemical stability of the Zn3(PO4)2@Zn anode from the perspective of the protective layer, the corrosion and hydrogen generation reaction (HER) were investigated by linear polarization measurements. Corrosion is the result of HER caused by the surface oxidation of a metal anode in an aqueous electrolyte. The OH− produced by the HER can disturb the reduction of Zn2+ to Zn in the electrolyte, causing irreversible loss of the active material from the Zn anode [22,24]. Fig. 6 shows the linear polarization curves of the Zn anode with and without the Zn3(PO4)2 protective layer. The voltage value of polarization curve involves the corrosion probability, the current value implies the corrosion rate [42]. The corrosion potential of the Zn anode with the Zn3(PO4)2 protective layer exhibited a positive shift from −8 to −6.6 mV, and the corrosion current decreased from −3.75 to −3.9 A cm−2. The higher corrosion potential of the Zn anode with the Zn3(PO4)2 protective layer compared with those of the bare Zn means delaying the onset of corrosion reaction, and the lower current of the Zn anode with the Zn3(PO4)2 protective layer represent decrease in the corrosion rate in the aqueous electrolyte [43]. Thus, the Zn anode with the Zn3(PO4)2 protective layer can reduced corrosion reaction in the aqueous electrolyte. Additionally, the Zn foil was soaked in an aqueous electrolyte (2 M ZnSO4 + 0.1 M MnSO4 in water) to confirm the interfacial side reactions. In general, Zn foil can easily form Zn compounds (i.e., Zn4SO4(OH)6·5H2O) even when it comes in contact with an aqueous electrolyte for a short time [44]. When the bare Zn foil was immersed in the electrolyte for 1 day, hexagonal Zn dendrites grew on its surface (Fig. 7(a)). On the other hand, the surface of the Zn3(PO4)2@Zn anode soaked in the electrolyte maintained a uniform protective layer without dendrite growth (Fig. 7b). According to the polarization curve and immersion test results, the Zn3(PO4)2 protective layer can suppress the interfacial corrosion reaction and improve the electrochemical stability of the Zn anode by preventing direct contact between the electrolyte and active sites of Zn.
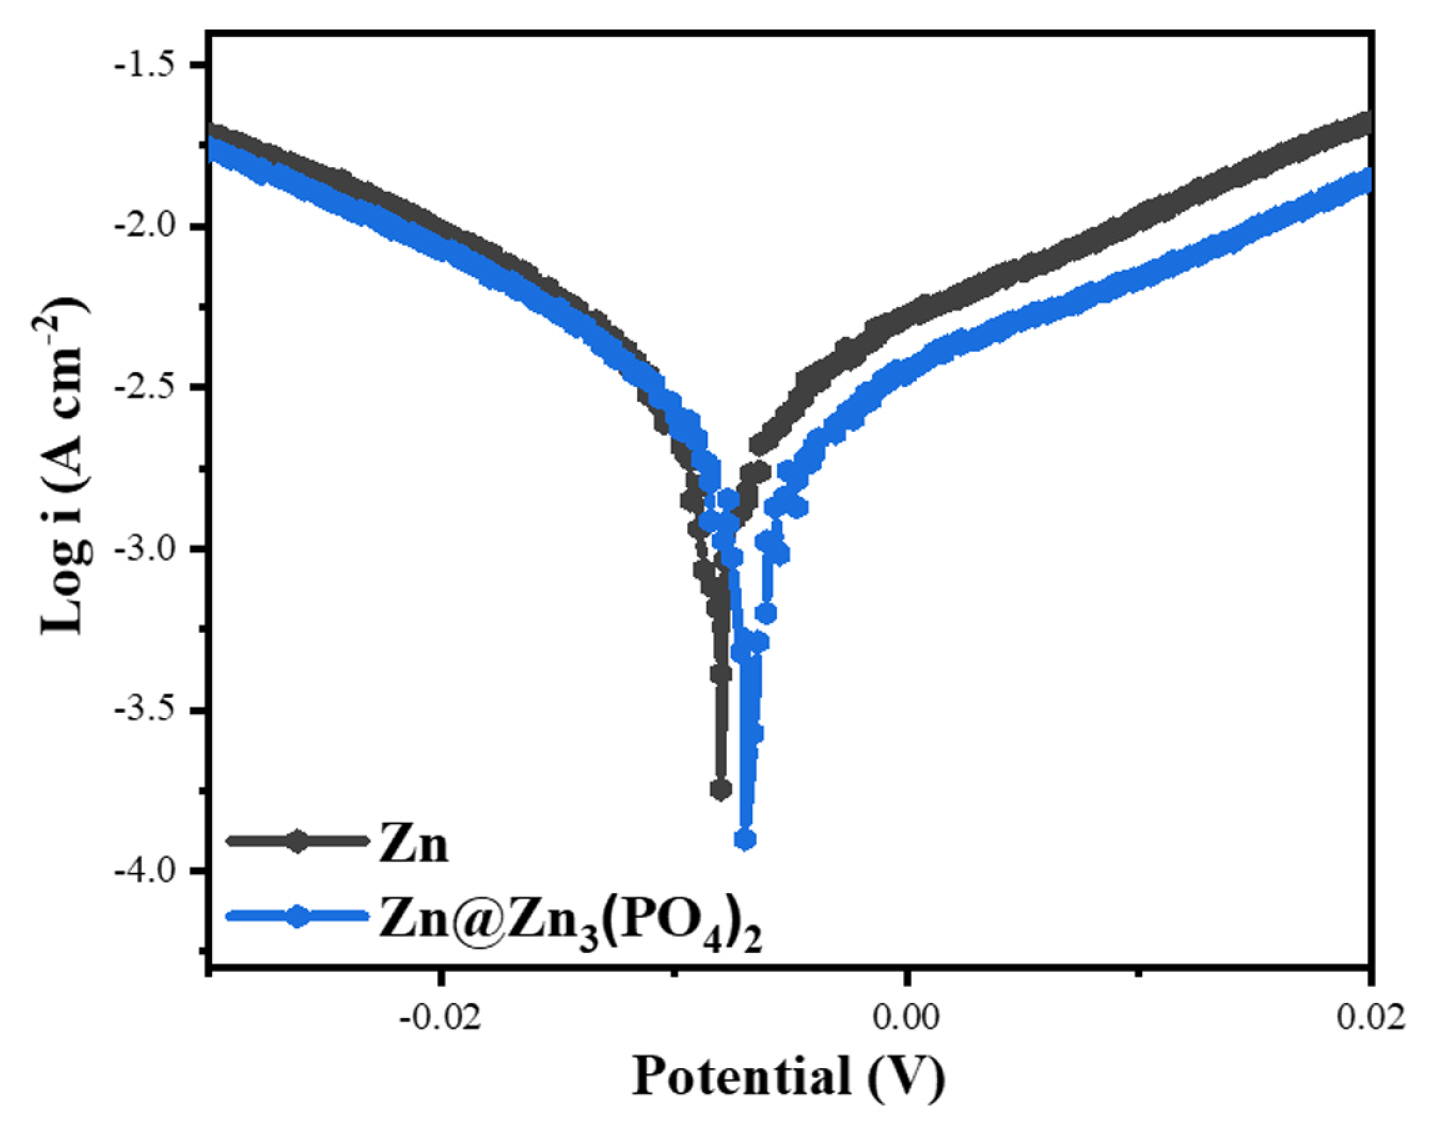
Linear polarization curves of bare Zn and Zn3(PO4)2@Zn anodes.

SEM images of (a) bare Zn and (b) Zn3(PO4)2@Zn anodes after immersion in the electrolyte for 1 day.
Zn || MnO2 and Zn3(PO4)2@Zn || MnO2 full cells with an aqueous electrolyte consisting of 2 M ZnSO4 and 0.1 M MnSO4 were constructed to further study the effect of the Zn3(PO4)2 protective layer on the performance of the Zn anode. The galvanostatic charge/discharge profiles of the Zn || MnO2 and Zn3(PO4)2@Zn || MnO2 full cells are shown in Fig. 8. Fig. 8(a) and (b) show the charge/discharge voltage and cycle profiles at 1C rate. The initial capacity of the bare Zn || MnO2 cell was 177.3 mAh g−1 with a Coulombic efficiency (CE) of 92.4 %, and the capacity decreased rapidly to 36.9 mAh g−1 after 500 cycles. The Zn3(PO4)2@Zn || MnO2 full cell had a higher initial capacity of 203.1 mAh g−1 with a CE of 92.6% and exhibited a remarkable improvement in capacity retention after 500 cycles; it maintained a capacity of 193.0 mAh g−1, which corresponds to 93.9% of the initial capacity (203.1 mAh g−1). When the charge/discharge rate was increased to 3C, the capacity of the Zn3(PO4)2@Zn || MnO2 cell was stably maintained up to 5000 cycles with capacity retention of 44.8% compared to initial capacity (138.5 mAh g−1), whereas the Zn || MnO2 cell suffered from internal short circuit over 500 cycles (Fig. 8(c,d)). That is, the Zn3(PO4)2@Zn || MnO2 cell realized a notable long-term performance (~5000 cycles). The results of the full-cell performance suggests that the Zn3(PO4)2 protective layer as a corrosion inhibitor and ion conductor improved the reversible capacity and prevented the internal short circuit caused by Zn dendrite growth.
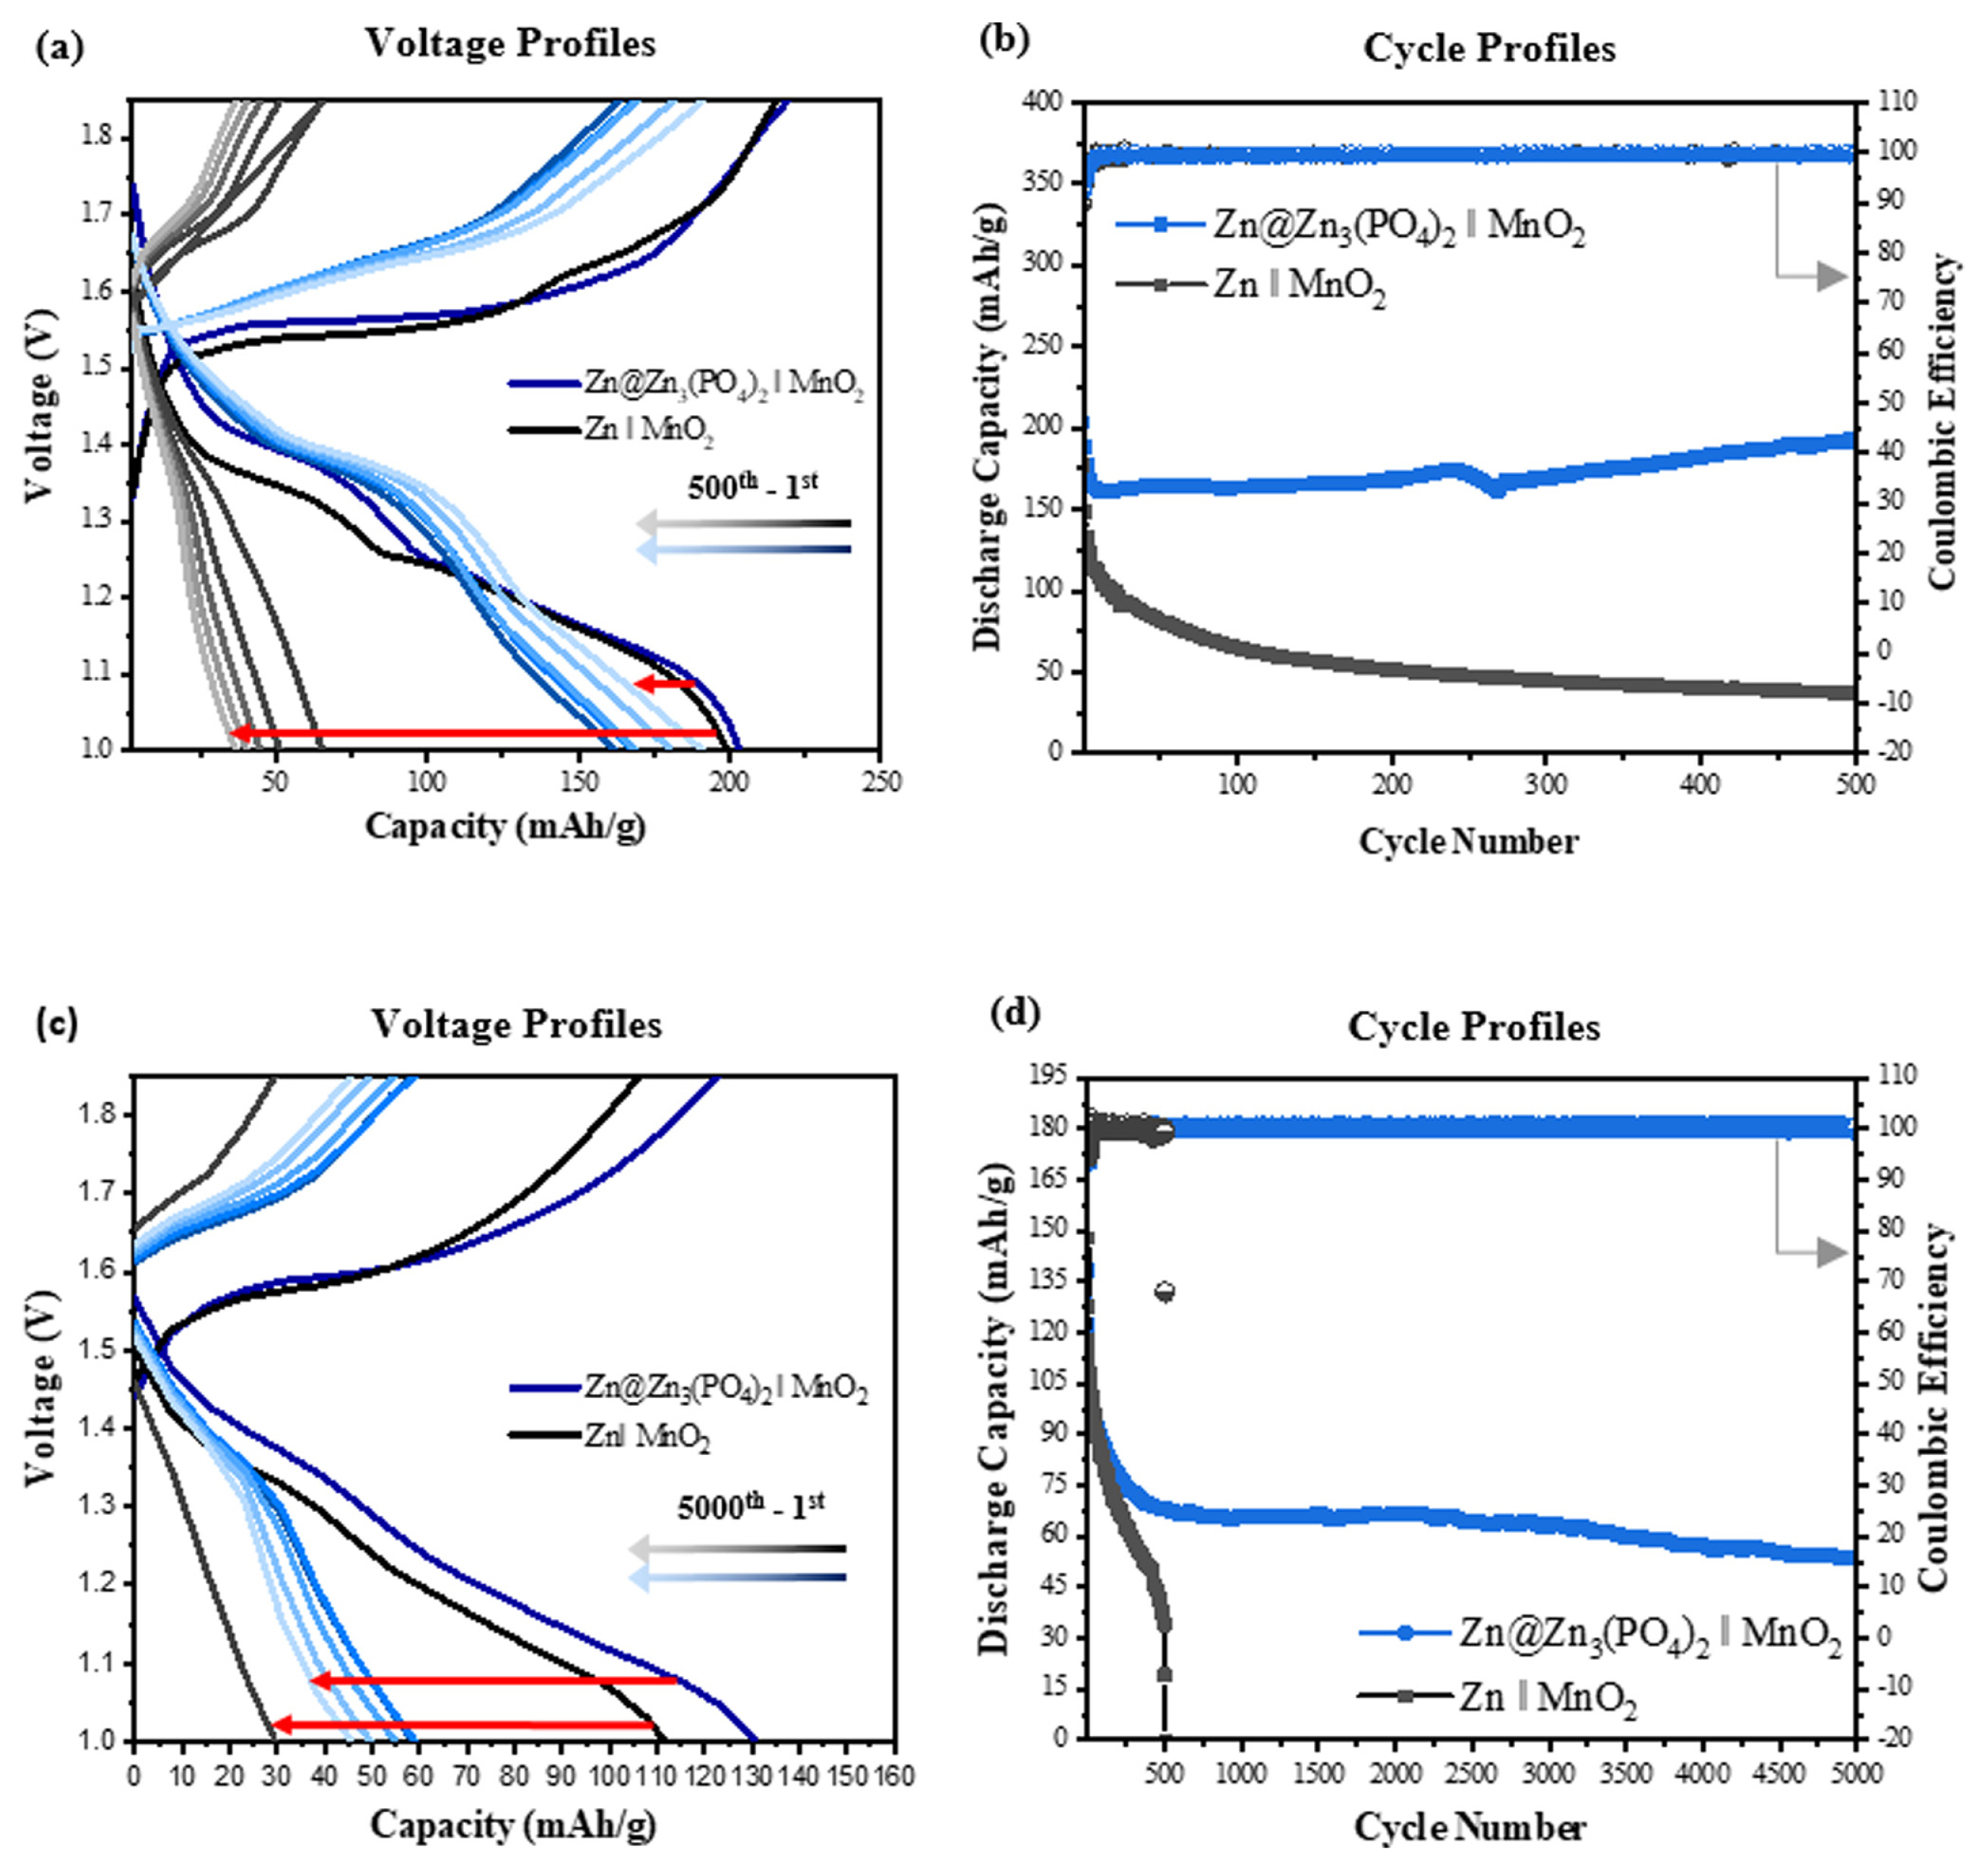
Electrochemical performance of the MnO2 full cells with bare Zn and Zn3(PO4)2@Zn anodes. Voltage profiles (a) at 1C for the 1st, 200th, 300th, 400th, and 500th cycle and (c) at 3C for the 1st, 2000th, 3000th, 4000th, and 5000th cycle. Cycle profiles at (b) 1C and (d) 3C.
To investigate the morphology of the bare Zn and Zn3(PO4)2@Zn electrodes after the Zn plating/stripping processes, ex situ SEM images were obtained. Fig. 9(a,b) and (c,d) show the top-view and cross-sectional images obtained after 10 cycles of the Zn || MnO2 and Zn3(PO4)2@Zn || MnO2 full cells, respectively. The bare Zn surface was covered with Zn dendrites (Fig. 9(a)). In comparison, the particles in the Zn3(PO4)2 protective layer merged to form a more continuous layer during the initial cycles (~10 cycles) and the growth of zinc dendrites was inhibited (Fig. 9(c)). The cross-sectional images show distinct differences between the two anodes. The Zn3(PO4)2 protective layer transitioned from a nanoparticle layer to a porous layer that restrained dendrite growth (Fig. 9(d)), whereas the bare Zn surface contained vertically grown dendrites (Fig. 9(b)).

Ex situ SEM images obtained after 10 cycles: (a,c) top view and (b,d) cross-sectional view of the bare Zn and Zn3(PO4)2@Zn anodes, respectively. Ex situ SEM images obtained after 100 cycles: (e,g) top view and (f,h) cross-sectional view of the bare Zn and Zn3(PO4)2@Zn anodes, respectively.
Fig. 9(e,f) and (g,h) show top-view and cross-sectional images obtained after 100 cycles of the Zn || MnO2 and Zn3(PO4)2@Zn || MnO2 full cells, respectively. As shown in Fig. 9(e) and (f), Zn particles were progressively deposited on the surface of the Zn electrode as the cycling progressed, and the surface of the Zn electrode was already covered nonuniformly with irregular Zn nanoparticles. It is expected that Zn ions gradually deposit on the anode to form dendrites, resulting in the internal short circuit of the Zn || MnO2 cell. Unlike in the Zn electrode, the Zn ions in the Zn3(PO4)2@Zn || MnO2 electrode were deposited under the guidance of the Zn3(PO4)2 layer formed in earlier cycles, and no protruding structures were observed even after 100 cycles (Fig. 9(g,h)) These results confirm that the Zn3(PO4)2 protective layer on the Zn foil can significantly suppress dendrite growth by preventing the 2D diffusion of Zn2+ ions and induce Zn plating under the protective layer. Furthermore, it suppresses the side reactions that occur on the anode surface in an aqueous electrolyte.
4. Conclusions
In this study, the suppression of Zn dendrite growth on Zn anodes coated with a protective layer was comprehensively investigated. The Zn3(PO4)2 protective layer on Zn could be easily formed through a phosphidation process and the layer thickness could be controlled by adjusting the amount of the P precursor. The designed Zn3(PO4)2 protective layer suppressed the growth of Zn dendrites and side reactions in aqueous electrolytes, leading to a significantly enhanced cycle life. A full cell with the Zn3(PO4)2@Zn anode exhibited an excellent capacity retention rate of 93.9% for 500 cycles at 1C rate. It also ensured a stable long-term performance at 3C up to 5000 cycles, while the Zn anode suffered from internal short circuit in as low as 500 cycles. The particles in the protective layer merged to form a layer in contact with the electrolyte and advanced in shape to a stable porous layer during the initial cycles. The advanced porous layer effectively inhibited vertical dendrite growth by inducing the uniform plating of Zn2+ ions. In addition, the Zn3(PO4)2 protective layer facilitated the transport of Zn2+ ions by lowering the surface resistance. Furthermore, the corrosion-inhibiting properties of the Zn3(PO4 ) 2 protective layer contributed to the reduction in the loss of the active material of the anode. Thus, the limitations of Zn anodes can be overcome using Zn3(PO4)2 as an anode protective layer.
Acknowledgments
This work was supported by the projects of Korea Electric Power Corporation (R21Ta20).