1. Introduction
An organic inhibitor is one of the types of corrosion inhibitors used as a strategy for preventing and controlling corrosion. Organic inhibitors that contain heteroatoms such as nitrogen, sulphur, and oxygen could be excellent materials as corrosion inhibitors. The efficiency of organic inhibitors is influenced by (i) adsorption of the molecules or its ions on mild steel surface, (ii) increase in cathodic and/or anodic over voltage, and (iii) the formation of a protective barrier film [1ŌĆō3].
In recent years, thiosemicarbazones have been widely studied by many researchers on their ability as corrosion inhibitors in which they have shown good inhibition properties. In addition, metal complexes compounds such as organotin were reported to give high corrosion inhibition efficiency compared to free ligands [4ŌĆō5]. This has led to research interest in organotin and its corrosion inhibition efficiency in the hopes of discovering a new corrosion inhibitor. Organotin has attracted a lot of attention since it is recognised for its biocidal behaviour, friction and wear reducing properties, as well as corrosion-inhibiting characteristics [6ŌĆō8].
The novelty of the present work was the synthesis of a new thiosemicarbazone derivative ligand and its tin(IV) complex as an organic corrosion inhibitor. The aim of the present work was to evaluate and compare the corrosion inhibition performance of a synthesised thiosemicarbazone derivative ligand and its tin(IV) complex on mild steel in 1 M HCl solution by using weight loss method, potentiodynamic polarisation, electrochemical impedance spectroscopy (EIS), and scanning electron microscopy (SEM).
2. Experimental
2.1 Material
Mild steel specimens with the chemical composition of C - 0.34%, Mn - 0.76%, P - 0.02%, Si - 0.3%, and the balance Fe were used for the experiments. Prior to measurements, the specimens were polished with a series of silica carbide paper from 320 to 1,200 grades and washed with distilled water followed by degreasing with acetone. All electrolytes were freshly prepared for each experiment. The acid solution of 1 M HCl was prepared from an analytical grade of 37% HCl.
2.2 Inhibitors
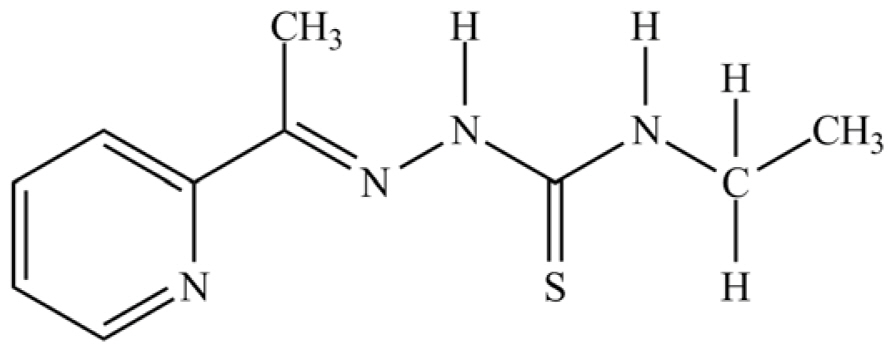
The ligand, HAcETSc was prepared by mixing an ethanoic solution of 2-acetylpyridine and an ethanoic solution of 4-ethyl-3-thiosemicarbazide. A few drops of acetic acid were then added to the mixture. The reaction mixture was refluxed for two hours at 60ŌĆō70┬░C with constant stirring. After two hours, the solution was cooled at room temperature. The crystalline product was obtained by slow evaporation at room temperature. Then, the crystalline product was filtered and washed with cold ethanol and dried over anhydrous silica gel.
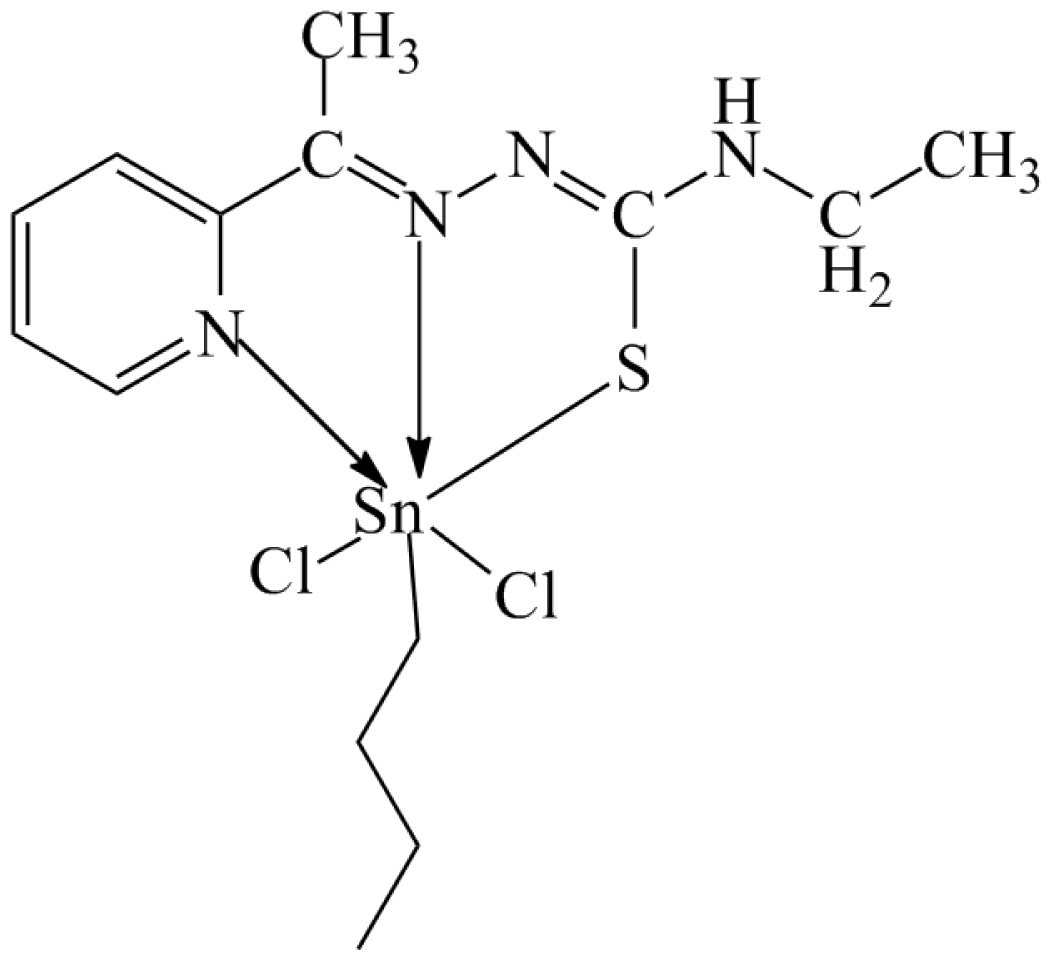
The organotin complex, Sn(HAcETSc)BuCl2 was prepared by dissolving the synthesised ligand in ethanol, and the metal salt, butyltin(IV) trichloride was dissolved in distilled water with a molar ratio of 1:1 (ligand: metal salt). The metal salt was added dropwise to the ethanoic solution of ligand with constant stirring. The reaction mixture was continuously stirred for four hours. The product was then filtered and washed with cold ethanol. The precipitate formed was left to dry over silica gel. The inhibitors under investigation are presented in Table 1.
2.3 Weight Loss Method
Mild steel coupons with size of 2 cm ├Ś 2 cm ├Ś 0.05 cm were used for the weight loss experiment for both inhibitors. The preparation of mild steel was done as mentioned in the material section. The mild steel specimen was fully immersed for 24 hours at room temperature in acidic solution with and without inhibitors. The experiment was conducted in triplicate and the average inhibition efficiency was calculated.
2.4 Electrochemical Experiments
For polarisation and EIS studies, the traditional three-electrode cell was used. A platinum rod was used as the counter electrode, the silver-silver chloride (Ag/AgCl) as the reference electrode, and mild steel as the working electrode. The working electrode was prepared by embedding the mild steel in epoxy resin with exposed surface area of 0.1 cm2.
The electrochemical measurements were carried out using Autolab Potentiostat (Aut302 FRA 2) where personal computer was controlled with NOVA software. EIS experiments were recorded at corrosion potential (Ecorr) at a frequency range from 10 kHz to 0.1 Hz using peak-to-peak amplitude of 0.01 V at an open circuit potential [9]. Potentiodynamic polarisation measurements were immediately performed after the EIS measurement on the same electrode without any additional surface treatment [10]. The potentials were scanned in a potential range of ┬▒100 mV versus corrosion potential at a scan rate of 0.001 VsŌłÆ1 [11]. Measurements of corrosion rate were started after immersing the working electrode in the test environment for ten minutes to provide a steady state open circuit potential (EOCP). All experiments were performed unstirred at room temperature.
2.5 Scanning Electron Microscopy Examination
Morphological studies of the mild steel surface were examined through scanning electron microscope images from a Hitachi TM3030Plus. The examination was conducted on a mild steel after exposure to 1 M HCl solution with and without 2 mM of inhibitors for 24 hours.
3. Results and Discussion
3.1 Weight Loss Results
The inhibition efficiency by weight loss (IEWL) method was calculated by using the following equation [12]:
Where ΔW is weight loss (i.e.: the weight of mild steel specimens before and after immersion). S is the surface area of the specimen (cm2), t is the immersion time (h),
C R W o
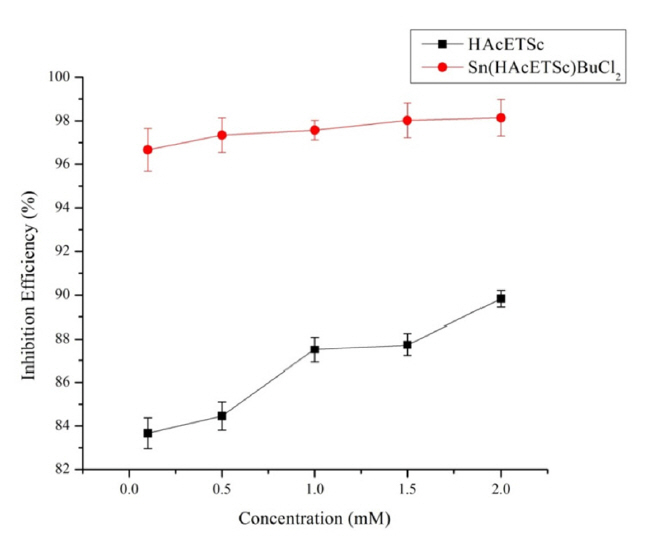
Fig. 1 shows the results of inhibition efficiencies (in %) for both inhibitors. The results show that the inhibition efficiency increased with inhibitor concentration and show similar trends as reported by other researchers [13]. Table 2 demonstrates the values obtained from the weight loss experiment for both inhibitors, HAcETSc and Sn(HAcETSc)BuCl2 at various concentrations.
3.2 Potentiodynamic Polarisation Results
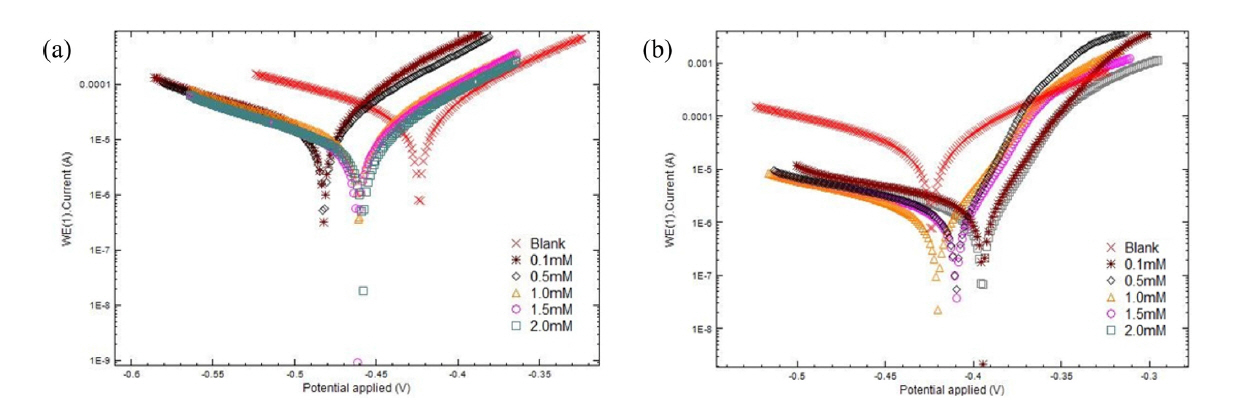
Potentiodynamic polarisation parameters for mild steel in 1 M HCl with and without inhibitors are presented in Table 3. Tafel plots for mild steel in 1 M HCl solution in the absence and presence of various concentrations of the inhibitor HAcETSc and Sn(HAcETSc)BuCl2 are shown in Fig. 2. The inhibition efficiency (IEpol) was quantified as follows [14]:
where,
i c o r r o
The inhibition efficiency at highest inhibitor concentration obtained from polarisation measurement is as follows: Sn(HAcETSc)BuCl2 [97.87%] > HAc-ETSc [71.31%]. The increase in inhibitor concentration which caused the inhibition efficiency to increase may have resulted from higher inhibitor molecules being adsorbed on the metal surface and provided wider surface coverage. It was found that the two inhibitors did not behave the same way. The presence of HAcETsc inhibited the cathodic reaction of mild steel faster than anodic reaction as indicate by the shift of Ecorr to more negative potential as shown in Fig. 2(a). However, the presence of Sn(HAc-ETSc)BuCl2 has shifted the Ecorr values to more positive potentials as shown in Fig. 2(b) indicating more inhibitor of anodic reaction of mild steel than be classified as mixed type inhibitors since the shifting of corrosion potential (Ecorr) for inhibited specimen with respect to Ecorr of blank was less than 85 mV [15ŌĆō16]. It show that both anodic and cathodic reactions on mild steel were simultaneously inhibited by the inhibitors that reduced the anodic dissolution and also retarded the hydrogen evolution reaction [17]. There were two mechanisms involved during the anodic reaction: firstly, the inhibitors adsorbed on the mild steel surface then formed a film which blocked the available reaction site from the attack of corrosive media and thus reducing the metal dissolution [18]. On the other hand, in the cathodic reaction, the formation of a film by the adsorption of the inhibitor on the mild steel reduced the transfer of H+ ions to the cathodic sites of mild steel surfaces and thereby decreasing the rate of hydrogen evolution.
3.3 Electrochemical Impedance Spectroscopy Results
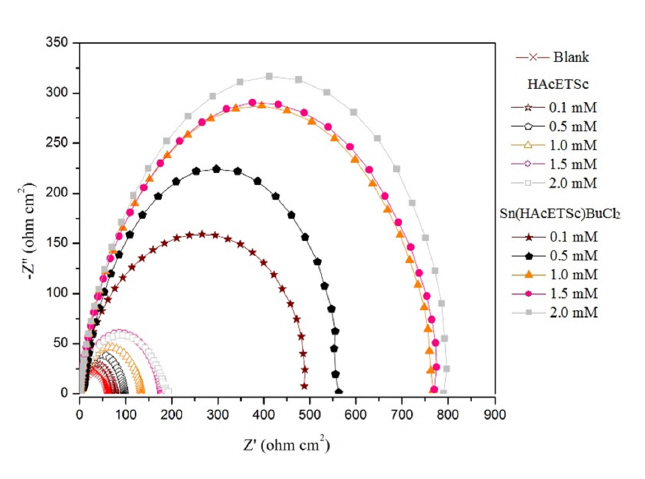
Fig. 3 shows the Nyquist diagrams of different concent rations of HAcETSc and Sn(HAc-ETSc)BuCl2 in 1 M HCl. All the impedance spectra show that the semicircle and the diameters increased as the concentrations of each inhibitor increased. These results indicate that the adsorption of inhibitors on the mild steel surface will cause the corrosion inhibition of the mild surface to increase. The impedance parameter values are presented in Table 4. The inhibitor efficiency (IEEIS) can be calculated from the following relation [19]:
Where, Rpo and Rp are the polarisation resistances with and without the inhibitor, respectively.
The Nyquist plots show that the pattern of impedance curves did not change even with the absence or presence of inhibitors [20]. Referring to Table 4, as the concentration of inhibitor increased, the Rp increased from 63.00 to 796.00 ohm cm2 while the constant phase element (CPE) parameters, Y0 and n values show no particular trend. The increasing trend of Rp values signified that at higher concentration, more inhibitor molecules were adsorbed at the metal/electrolyte interfaces. This indicate that the most effective inhibitor was Sn(HAcETSc)BuCl2 at 2 mM. The percentage inhibition efficiency from impedance measurement of Sn(HAcETSc)BuCl2 was 92.08%.
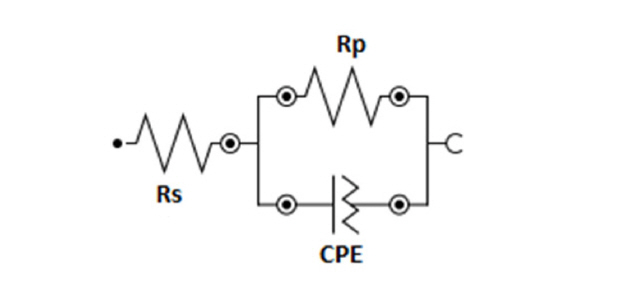
Fig. 4 demonstrates the electric equivalent circuit (EEC) model that was used to determine the physical processes that had occurred at the mild steel/solution interface. The EEC model consists of solution resistance (Rs), polarisation resistance (Rp), and constant phase element (CPE).
3.4 Scanning Electron Microscopy Results
The SEM analysis gave a clear picture of the mild steel surface in the absence and presence of inhibitors. Fig. 5(a) shows the micrograph for the mild steel surface that had been immersed in 1 M HCl in the absence of inhibitors (blank), while Fig. 5(b) shows the mild steel surface inhibited with HAcETSc, and Fig. 5(c) shows the mild steel surface inhibited with Sn(HAcETSc)BuCl2. The uninhibited mild steel surface was damaged due to the dissolution of metal in aggressive solution where deep holes were observed on a certain surface of the mild steel. The presence of holes on the mild steel surface often associated as the occurrence of pitting corrosion [21]. Nevertheless, the inhibited mild steel surface show smoother surfaces due to the dissolution rate that was reduced by inhibitors as well as the formation of a protective film on the mild steel surface. These results proved that the inhibitor, Sn(HAcETSc)BuCl2 was the most inhibited, which was in agreement with the polarisation and impedance measurement results.
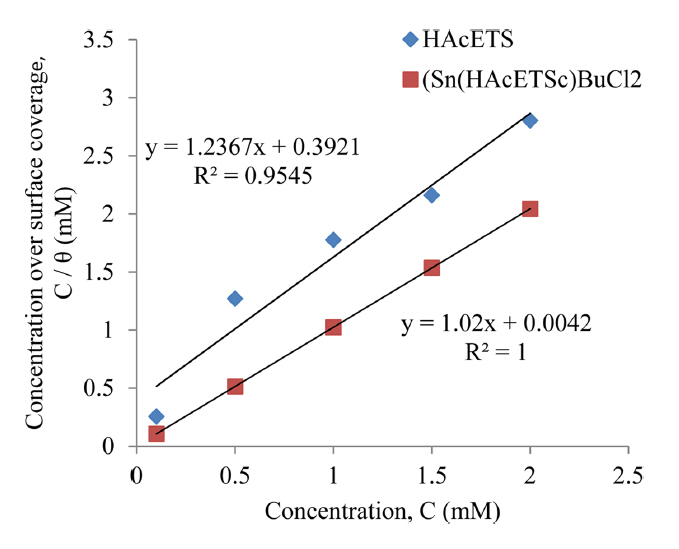
3.5 Adsorption Isotherm
The plot show in Fig. 6 represents the Langmuir isotherm plots by using polarisation values that investigated the type of adsorption mechanism of HAcETSc and Sn(HAcETSc)BuCl2 on the mild steel. The straight line give R2=0.954 for HAcETSc and R2=1 for Sn(HAcETSc)BuCl2 which confirmed the suitability of this isotherm for corrosion inhibition study. These results indicate that the inhibitors were adsorbed on the mild steel surface by monolayer and through a physical mechanism. According to the Langmuir isotherm model, it is assumed that the mild steel surface can hold one adsorbed species per adsorption site since the adsorption site only occupies a fixed number of adsorption species and there are no interactions with other adsorbed species [22]. The thermodynamic study can support the physical adsorption mechanism by calculating the standard free energy of adsorption (ΔGads) [23]. ΔGads on mild steel surface with the following equation [24]:
where ╬öGads is the free energy of adsorption, R is the universal gas constant, T is the temperature in unit Kelvin, the factor 55.5 is the molar concentration of water (mol/L), and Kads is the equilibrium constant that is calculated from the reciprocal of the intercept straight line. In general, if the energy value of ╬öGads lies around ŌłÆ20 kJ molŌłÆ1 or less negative, the adsorption is in accordance with the electrostatic interaction between the charged inhibitor molecules and the charged metal surface (physisorption), whereas if those ranging ŌłÆ40 kJ molŌłÆ1 or more negative, the adsorption is in accordance with the charge sharing or transfer from the inhibitor molecules to the metal surface to form a coordinate type of bond (Chemisorption) [25]. The ╬öGads values from the experiment were around ŌłÆ3.766 kJ molŌłÆ1 and ŌłÆ7.707 kJ molŌłÆ1 for HAc-ETSc and Sn(HAcETSc)BuCl2, respectively. The analysis proved that the adsorption of both inhibitors on the mild steel surface had occurred by physisorption mechanism.
4. Conclusions
In this paper, electrochemical studies were carried out to investigate the ability of the synthesised ligand and complex to inhibit corrosion of mild steel in 1 M HCl solution. From the analysis, it can be concluded that the complex had a better efficiency than the ligand. The inhibition efficiency increased by increasing the inhibitor concentration. The results obtained from the weight loss were verified by the electrochemical measurements. The polarisation curves indicate that the inhibitors successfully inhibited the cathodic hydrogen evolution and anodic metal dissolution reactions. Both inhibitors acted as mixed-type inhibitors. The impedance plots of inhibitors indicate that the polarisation resistance increases with an increase in the inhibitor concentration. The adsorption of these inhibitors on the mild steel surface in 1 M HCl solution obeys the LangmuirŌĆÖs adsorption isotherm and kinetic model. The negative sign of ╬öGo ads indicates that the adsorption process is spontaneous. The increase in activation energy after the addition of inhibitors to the 1 M HCl solution indicates that the physisorption is more predominant than chemisorption. The SEM results supported the weight loss method and all the electrochemical measurements.