


1. Introduction
Mild steel is the most flexible, least expensive and broadly used engineering material which has found widespread application in various industries. However, mild steel degradation has always been a concern due to its high corrosion rate in aggressive and hostile atmospheres and solutions. Mild steel is commonly used for many low and moderate temperature applications. However, because of its poor resistance to corrosion its applications are restricted. Methods such as electroplating [1-3] spray and plasma coatings [4-5] have been used to protect mild steel surface or other materials that are less-corrosion resistant. However, poor boundaries to the substrate, micro cracks, residual porosity and rough surface are the main limitations of these techniques [6]. Therefore, an alternative process of enhancing mild steel is by forming a surface alloy that is corrosion resistant which shields the materials permanently from corroding.
Zinc coatings are widely used for the corrosion protection of ferrous materials, acting both as a physical barrier from the surrounding corrosive environment and as a self sacrificial anodic protective layer [7]. Alloying zinc coating with different metals enhances the hardness, wear and corrosion resistance [8]. Alloys such as Zn-Fe, Zn-Co, and Zn-Ni have greatly gained a wider range of applications in both manufacturing and marine industries as a substitute for ordinary zinc coating [9,10]. However, Zn-Sn alloys are attractive because they combine the barrier property of Sn with the cathodic protection offered by Zinc. Zn-Sn alloys proffer high corrosion protection for steel, good frictional properties, ductility and good solderability. They also have low electrical resistance and are not subject to bimetallic corrosion [11-14]. Because of such advantages, Zn-Sn has been anticipated as substitute for other industrial coatings, such as those of toxic cadmium and allergenic nickel [15-17]. Literature on Zn-Sn alloy coatings by laser surface alloying (LSA) technique is very limited.
LSA modifies the surface morphology and near surface structure of components and its alloys with perfect adhesion to the interface of the bulk steel and the distinctive advantages of the LSA technique for surface modification include the refinement of the grain size because of rapid quench rates and the generation of meta-stable structures with novel properties that are not feasible by competing methods [18-19]. With optimum laser processing parameters, a reliable coating that is free of cracks and pores can be produced on the matrix. LSA can rapidly provide a thick and crack-free layer in all instances with metallurgical bonds at the interface between the alloyed layer and the substrate. Powders surfaced on new or worn working surfaces of components by LSA provides specific properties such as high abrasive wear resistance, erosion resistance, corrosion resistance, heat resistance and combinations of these properties. Consequently, improvements in machinery performance and safety in aerospace, automotive, can be realized by the method [20].
In the present study, laser surface alloying of UNS G10150 was carried out with aim of improving its surface property by forming metal matrix composites and intermetallic compounds unto the surface layer using Zinc (Zn) and Tin (Sn) as alloying powders. The laser processing parameters were optimized and influences of Zn and Sn combined reinforcements on the microstructure, hardness and corrosion properties of UNS G10150 were investigated. The surface characterization of the laser alloyed area was studied using optical microscope, x-ray diffraction (XRD) and scanning electron microscopy (SEM).
2. Experimental
2.1 Materials
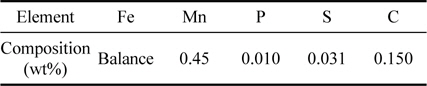
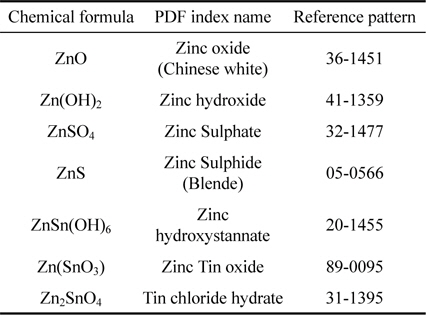
The chemical composition of the UNSG10150 mild steel substrate is given in Table 1. The substrate was cut, machined into dimensions 100 mm ├Ś 100 mm ├Ś 5 mm; and sandblasted to clean the surface, minimize reflection of radiation during laser processing and enable the absorption of the laser energy. Zinc and Tin metallic powders used as alloying powders were mixed in 25:75(A1), 50:50(B1) and 75:25(C1) ratios respectively in a Turbular shaker mixer T2F model for 12 hours. The particle shape of the powder used was spherical with 45-90 ┬Ąm particle sizes.
The SEM micrograph of the substrate is shown in Fig. 1 with clearly prepared surface appearance. EDS analysis also confirmed the chemical composition with Fe being the predominant element present.

The phase observed from x-ray diffractograph indicates specifically the presence of Fe as predominant metal as shown in Fig. 2. The large peak emerges at 2╬Ė angles of 40-50┬░ at 5000 count series. This shows that the as-received sample contains primarily Fe.

2.2 Laser surface alloying
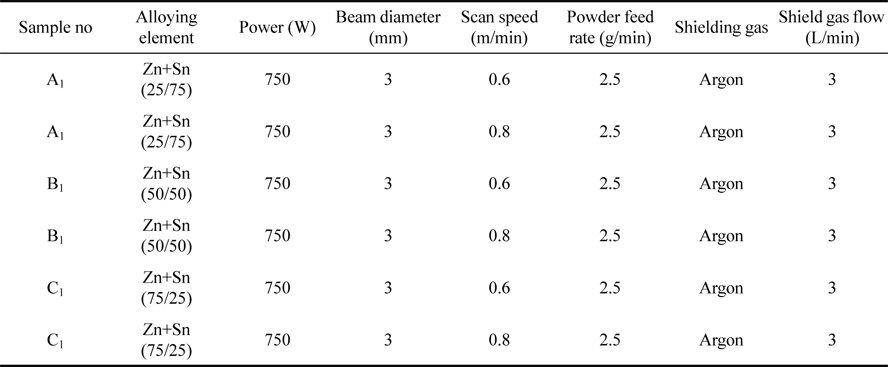
Laser surface alloying was performed using a Rofin Sinar continuous wave Nd:YAG laser. The metallic powder was fed through the off-axes nozzle fitted onto the Nd:YAG laser and it was injected simultaneously into a melt pool formed during scanning of the UNSG10150 substrate by the laser beam. An argon gas flowing at a rate of 3 L/min was used as a shielding gas to prevent oxidation of the sample during LSA. Overlapping tracks were obtained by overlapping of melt tracks at 50%. The laser processing parameters used was power of 750 W, a beam diameter of 3 mm, powder flow rate of 2.5 g/min and scanning speeds of 0.6 m/min and 0.8 m/min respectively. The laser scanning speeds and constant laser power were varied in order to get the optimum laser processing parameters as shown in Table 2.
2.3 Sample preparation
Prior to the characterization of the laser surface alloyed materials, samples were prepared by cutting to rectangles of 15 mm ├Ś 15 mm, and cold mounted in clear thermosetting Bakelite resin for optical micrographs and black conductive thermosetting resin for SEM and EDS analysis. Cold mounted samples were mechanically ground on 1000 and 1200 grade SiC papers. To obtain a mirror like surface, samples were polished using 3 ┬Ąm cloths with diamond paste. For electrochemical analysis, the samples were sectioned to 1 cm2 and cold mounted exposing the laser alloyed surface.
2.4 Microhardness test
The micro-hardness measurement of the alloyed samples was performed on the cross section of the alloyed layers. The Vickers hardness test of the polished specimens was determined using a Vickers micro-hardness tester model FM700. An indenting load of 100 gf, 100-150 ┬Ąm spacing between the corresponding indentations and a 10 second dwell time was used. The average micro-hardness of all the samples was calculated using five representative indent values from the obtained results.
2.5 Microstructure and phase analyses
A detailed microstructural characterization was performed using an Optic Nikon Optical microscope (OPM) and a scanning electron microscopy (SEM) equipped with energy-dispersive spectroscope (EDS)(Model: VEGA 3 TESCAN). X-ray diffraction analyses were carried out utilizing use XŌĆÖPert Pro model diffractometer to identify the phases present on the resulted alloyed layer. A Cu K╬▒ radiation source on the XŌĆÖPert Pro diffractometer set at 40 kV and 20 mA was used to scan in a range between 10┬░ and 80┬░ two theta (2╬Ė) with a step size of 0.02┬░ .
2.6 Potentiodynamic polarization test
For electrochemical analysis, the samples were sectioned to 1 cm2 and cold mounted exposing the laser alloyed surface. Potentiodynamic polarization test was carried out on both alloyed and unalloyed samples. Measurements were conducted using an Autolab potentiostat (PGSTAT30) which is computer controlled with the general purpose Electro-chemical Software (GPES) package version 4.9. Sulphuric acid solution was used to study the corrosion behaviour of the samples at 30Ōäā. An electro-chemical cell with 0.5 M H2SO4 as electrolyte, consisted of three electrodes, the working electrode (sample), counter electrode (graphite rod) and silver/silver chloride electrode was used as a reference electrode (SCE). The corrosion potential (Ecorr), polarization resistance (Rp ) and corrosion rate were determined by scanning at the rate of 0.0012 V sŌłÆ1 from a potential of ŌłÆ1.5 V to 1.5 V.
3. Results and discussion
3.1 Characterization of the starting materials


3.2 Potentiodynamic polarization test results
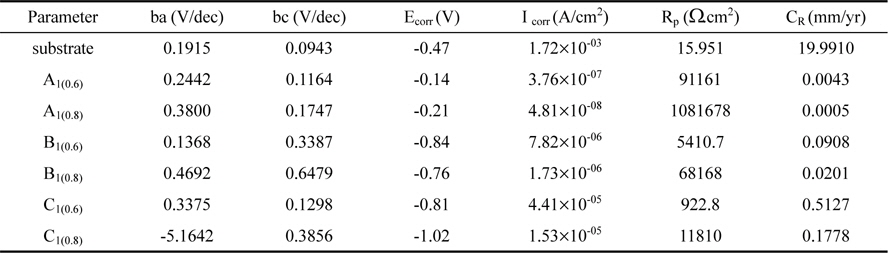
The susceptibility of mild steel (control sample) to corrosion deterioration in 0.5 M H2SO4 medium was examined using linear potentiodynamic polarization technique. From the experimental analysis, a huge corrosion degradation of 19.9910 mm/yr was ascertained as a result of lack of protection. Fig. 4 shows the linear polarization curve of the UNSG10150 mild steel substrate. The potentiodynamic polarization data from Tafel plot were presented in Table 3. The as-received mild steel used exhibited a very high current density of about 1.72├Ś10ŌłÆ03 A/cm2. The corrosion potential of the sample is ŌłÆ0.47 V with severe pits and cracks distributed at the substrate interface as presented by OPM micrograph in Fig. 4.
From observation, the catastrophic destruction of the as-received metal by aggressive sulphate (SO42ŌłÆ) ion occurs uniformly. Moreover, the substrate has less passive film formed on its surface resulting into intensive corrosion attack from the sulphuric solution with high corrosion rate of about 19.9910 mm/yr. This high rate of deterioration however, was expected; reason being that lack of surface protection has been attested to engender severe deterioration [21]. When mild steel corrodes, there is usually a loss of the metal to a solution in some form, by a product-favoured oxidation-reduction reaction. Under common operating conditions an oxide film forms on the iron surface. This oxide film mostly presents a hematite (╬▒-Fe2O3) structure. The summarized polarization data of the control sample and samples A1, B1, C1, is shown in Table 3 below with graphical representation in Fig. 5.
Fig.┬Ā5.
Linear polarization curves of Zn-Sn alloyed UNS G10150 in sulphuric acid with laser power of 750W; 0.6 m/min, and 0.8 m/min scan speeds.
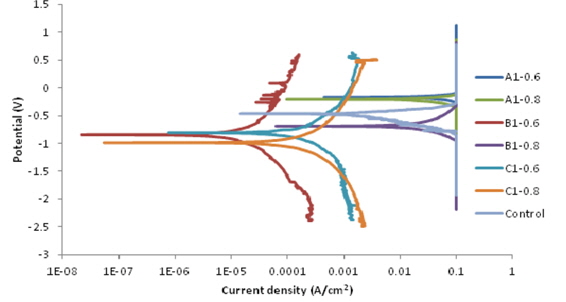
Table 3 shows the corrosion current density (Icorr), corrosion rate (Cr) and polarization resistance (Rp) values of each sample. Sample C1 at scanning speed of 0.6 m/min exhibited polarization resistance Rp (922.8 Ōä” cm2), corrosion current density icorr (4.41├Ś10ŌłÆ5 A/cm2), lower corrosion potential Ecorr (ŌłÆ0.81 V) and higher corrosion rate Cr (0.5127 mm/year) as compared to the substrate UNSG10150. The uncoated UNS10150 exhibited an active-passive behaviour with the lowest polarization resistance Rp (15.951 Ōä” cm2), highest corrosion current density icorr (1.72├Ś10ŌłÆ3 A/cm2), highest corrosion potential Ecorr (ŌłÆ0.47 V) and highest corrosion rate Cr (19.991 mm/year) in sulphuric acid (0.5M H2SO4) as shown in Table 3 and Fig. 5.
Metal exposed to sulphuric acid (0.5M H2SO4) without coating shows the presence of C, O, Fe suggesting the formation of a compound including iron oxide/hydroxide and carbon. Iron oxide (rust) developed on the surface which is not protective because it doesnŌĆÖt form a continuous, adherent film. Instead, it spalls, exposing fresh iron to the atmosphere which, in turn, allows more corrosion to occur. It can be seen that sample C1 with scanning speed of 0.8 m/min exhibited a polarization resistance Rp (11810 Ōä” cm2), which is 13-times the polarization resistance Rp (922.8 cm2) of sample C1 (at 0.6 m/min scanning speed) and 740-times the polarization resistance of the substrate, UNSG10150. Similar outcomes can be seen from the corrosion rate and corrosion current density results. Samples C1 with scanning speeds of 0.6 and 0.8 m/min have slight differences in corrosion current density (icorr), corrosion potential (Ecorr), and corrosion rate (Cr). Increased scanning speed from 0.6 m/min to 0.8 m/min caused decrease in corrosion rate, decrease in current density, and decrease in corrosion potential and increase in polarization resistance of samples C1. The corrosion potential (Ecorr) was highly negative with increased scanning speed. Increase in corrosion rate of samples C1 (0.6, 0.8) compared to other alloyed samples is attributed to the formation of zinc sulphate (ZnSO4) which dissolves the protective zinc hydroxide layers (ZnOH2) as shown in Fig. 6.

Samples C1 coatings in sulphuric acid (0.5M H2SO4) could not perform to expectation due to rust and porosity found in the coatings as observed in the SEM micrographs of Fig. 4. Increase in porosity increases corrosion rate and consequently more consumption of zinc in the coating which will cut short the actual service life of the coating as reported by Japtal et al. [22]. With increased concentration of Zn in the coatings, the corrosion potential was highly negative, thus large anodic areas were accessible to the electrolyte (0.5M H2SO4) leading to small current density being drawn from the zinc as also reported by Japtal et al. [22]. Passivation of Sn in alloys containing over 70% of Zn occurred at more negative potentials. This is due to the formation of a non-equilibrium surface layer enriched in Sn and structural defects as a result of selective dissolution of Zn as also reported by Korobov et al. [23].
Samples B1 at scanning speed of 0.6 m/min displayed a polarization resistance Rp (5410.7 Ōä”), but lower corrosion current density icorr (7.82├Ś10ŌłÆ6 A/cm2), lower corrosion potential Ecorr (ŌłÆ0.84 V) and low corrosion rate Cr (0.0908 mm/year) as compared to samples C1 at 0.6 m/min scanning speed.
The polarization resistance of sample B1 at scanning speed of 0.8 m/min is 13-times that of the same sample at scanning speed of 0.6 m/min and 4274-times that of UNSG10150 substrate. This leads to decrease of 99.11% in corrosion rate (0.0201) of sample B1 at 0.8 m/min scanning speed. The corrosion current density icorr (1.73├Ś10ŌłÆ6 A/cm2) of sample B1 at 0.8 m/min scanning speed decreased by order of 3 and 1 in magnitudes respectively as compared to the substrate and samples C1 at scanning speed of 0.6 m/min.
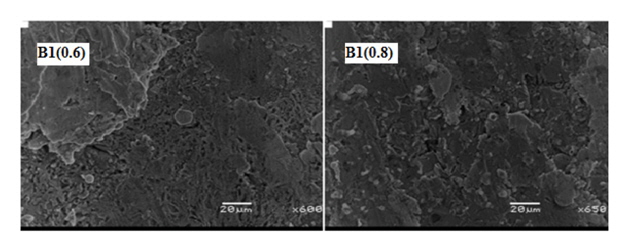
Sample A1 at scanning speed of 0.6 m/min displayed higher polarization resistance Rp (91161 Ōä” cm2), lower corrosion current density icorr (3.76├Ś10ŌłÆ7 A/cm2), highest corrosion potential Ecorr (ŌłÆ0.14 V) and lower corrosion rate Cr (0.0043 mm/year) as compared to the substrate UNSG10150. At scanning speed of 0.8 m/min, sample A1 exhibited the highest polarization resistance Rp (1081678Ōä”cm2), lowest corrosion current density icorr (4.81├Ś10ŌłÆ8 A/cm2), higher corrosion potential Ecorr (ŌłÆ0.21 V) and lowest corrosion rate Cr (0.0005 mm/year) in sulphuric acid (0.5 M H2SO4) solution. The polarization resistance Rp (1081678 Ōä”cm2) is 67,813-times the polarization of the UNSG10150 substrate, 99.9972% reduction in the corrosion rate as compared to substrate and reduction of 5 magnitudes in the corrosion current density icorr (3.76├Ś10ŌłÆ8 A/cm2). The polarization resistance values are related to the resistance of the coating to dissolution. Higher value of polarization resistance indicates enhanced corrosion resistance. The polarization resistances in all cases were generally high and higher for coatings of high Sn content. The decrease in corrosion current densities in samples A1 indicates the formation of protective films on metal surfaces. This result shows that 25Zn:75Sn inhibit the anodic reaction by acting as a barrier layer between the surface and sulphuric environment. Similar observation was also reported by Dubent et al. [24]. Sample A1 at 0.8 m/min scanning speed acts is more effective barrier, more stable and corrosion protective in sulphuric acid. There was formation of dense, crack free, compact and non-porous microstructure with an excellent metallurgical bonding to the substrate as shown in Fig. 8. According to Dubent et al. [24], the surface of Zn-Sn deposits becomes more compact when the Sn content increases. In view of the SEM results however (Fig. 8.), the Zn-Sn alloy coating seems to form an intimate and homogeneous mixture.

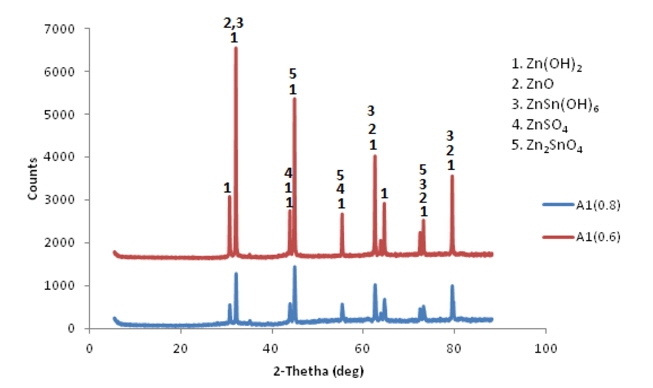
One interesting observation is the reactivity of the percentage of Sn as it relates to corrosion rate and corrosion potential. It is observed from Fig. 5 and Table 3 that corrosion rate of all Zn-Sn alloys coatings decrease with increase in the percentage content of Sn. Moreover, the Zn-Sn corrosion potential, Ecorr, generally becomes more negative with increase in Zn content, and this can be attributed to the higher activity of Zn in comparison with Sn as also reported by Fashu et al. [25]. In addendum, the corrosion current density increases as the Zn content in the alloy increases. This is expected because Zn is less noble than Sn and will corrode faster. The general overview is that Zn-Sn coatings could not suffer horrible corrosion attack from sulphate ion when compared with great degradation done on mild steel substrate. According to electrochemical principles, the corrosion rate is proportional to the corrosion current density; and reduced rate in corrosion current density will enhance passivity of the sample as also reported by Popoola et al. [26]. Excellent improvement in the corrosion resistance of the alloyed sample A1 at 0.8 m/min scanning speed could be due to homogeneous oxide films and stable coating formed as shown by the XRD in Fig. 9. The passivation behaviour is also due to the formation of adherent corrosion products, certainly consisting of very stable oxides and hydroxides of Zinc. A good decrease in corrosion current density may also be due to the formation of zinc oxide (ZnO) and zinc hydroxide (Zn(OH)2) films which retarded the ingress of sulphate ions into the coated region and down to the substrate. The phases, zinc hydroxide, zinc oxide, zinc hydroxystannate and zinc stannate (Zn(OH)2, ZnO, ZnSn(OH)6, Zn2SnO4) in 25Zn:75Sn coatings led to the formation of a more densely packed corrosion product layer on coating surface, which enhanced the corrosion resistance. According to Praveen et al. [27], the enhancement in the resistance is due to the physical barriers produced by combined metallic additive to the corrosion process by filling crevices, gaps and micro holes on the surface of the coatings. In addendum, Dubent et al. [23] suggested that Zn-Sn deposits with best comprehensive properties was achieved when the concentration of Zn was kept at its low level which corroborate with the present results using laser alloying technique. Zinc oxide is the initial film which is formed in the presence of moisture or water. It helps in reducing the corrosion risk on the steel surface. Zinc oxide (Zincite) is surplus in the XRD of Fig. 9. Zinc oxide (ZnO) acts as an inhibitor in an aggressive environment by sealing the pores in order to improve the barriers properties [28,29]. The (ZnOH2) found in the corrosion products may have different structures depending on the conditions, but â-(ZnOH2) is found to occur most frequently. Zinc stannate (Zn2SnO4) is a ternary metal oxide film with a spinel structure. This compound is dielectric, but is characterized by a high corrosion resistance to various corrosive media [30,31]. Ternary metal oxide like zinc stannate (Zn2SnO4) exhibit better corrosion resistance than do binary metal oxides as reported by Hwang et al. [32].
According to Fayomi et al. and Rahman et al. [33,34], coating composition is a factor for structural evolution and better adhesion characteristics. An increase or decrease in applied potential or current regulates the uniform arrangement of crystals and hence results in the fine grained deposits [35,36].
3.3 Microhardness results
Table 5 shows the average microhardness values obtained for Zn-Sn coatings. The average hardness value of the alloyed samples was calculated from five representative indent values from the obtained results. With all laser alloyed samples A1, B1 and C1, a maximum hardness value of 147 HV0.1 was achieved when a power of 750 W and scan speed of 0.8 m/min was used. It can be seen from Fig. 10 that hardness increased for all the Zn-Sn coatings ranging from approximately 55 HV0.1 for the mild steel substrate to approximately 147 HV0.1 for the highest value obtained for the coatings. From the results, sample A1 (0.8) exhibited highest microhardness value followed by B1 (0.8). This enhancement in hardness is attributed to the formation of adhesive mechanism of the coating on the working sample. However the increase in hardness was dependent on the laser processing parameters. The microhardness of the Zn-Sn coatings under different laser processing parameters was carefully studied. Experimental results showed that the microhardness property of the Zn-Sn alloyed samples depend on the scan speed. Previous work by Popoola et al. [37], had affirmed that the microstructure evolved in coating depends on the processing parameters and such metallurgical parameter influence the grain size which is paramount to the buildup of surface hardness that were seen from the improved Zn-Sn coatings. The microhardness of the Zn-Sn coated samples increases with increasing scanning speed. With the increase of the scanning speed, the cooling rate of the molten pool increased. The grain sized became smaller with increasing scanning speed, which is also a result of the increasing of cooling rate as reported by Sun et al. [38].

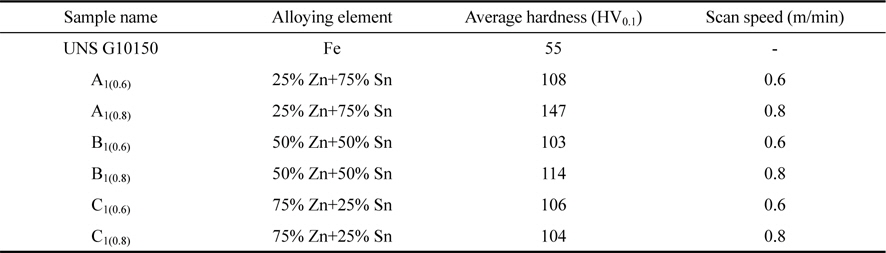
Since the microhardness value of the substrate is 55 HV0.1, then it can be inferred that laser surface alloying led to an improvement in micro-hardness no matter what scan speed was used. An improvement of 2.7 times the hardness of the steel substrate was achieved in A1(0.8) as compared to the substrate. The optimum processing parameters that led to an increase of the surface hardness were 750 W laser power, powder flow rate of 2.5 g/min and scan speed of 0.8 m/min. All the Zn-Sn samples had a higher microhardness than the substrate, which may be mainly attributed to the formation martensite hard phases in the coatings as well as the solid solution strengthening in the supersaturated ╬│-Fe solid solution.
The hardness of the coatings also increased with increased scanning speed, which may be attributed to the fine microstructure, dislocations and the high degree of saturation of solid solution brought by the high scanning speed as reported by Sun et al. [38].
4. Conclusion
The results confirm that sample A1 (25Zn:75Sn) at scanning speed of 0.8m/min produces the best anti-corrosion performance in 0.5M H2SO4 solution with lowest corrosion current density icorr (4.81├Ś10ŌłÆ8├ŚA/cm2), lowest corrosion rate (0.0005 mm/year) and highest polarization resistance Rp (1081678 Ōä” cm2). The polarization resistance Rp (1081678 Ōä” cm2) is 67,813-times the polarization of the UNSG10150 substrate and 99.9972% reduction in corrosion rate was achieved in acidic environment (0.5M H2SO4) when compared with the substrate.
The corrosion potential in alloys containing 75% of Sn addition shifted to the right at (ŌłÆ0.21 V). The magnitude of corrosion potential decreases while corrosion current density increases as the zinc content in the alloy increases. This is due to selective dissolution of zinc which leads to higher thermodynamic activity of zinc.
An enhancement of 2.7-times the hardness of the steel substrate was achieved in sample A1 (25Zn:75Sn) at scanning speed of 0.8 m/min which may be attributed to the fine microstructure, dislocations and the high degree of saturation of solid solution brought by the high scanning speed. Such metallurgical parameter influences the grain size which is paramount to the buildup of surface hardness that was seen from the improved hardness of Zn-Sn coatings.


