1. Introduction
Chromium and its alloys are one of the very important and widely used coatings in industry with the purpose of enhancing corrosion resistance “especially at high temperature”, hardness, abrasion and wear resistance, lubricity, and decorative characteristics such as surface texture and brightness [1,2]. It is usually applied to the various metallic substrates via electrochemical deposition. Cr coatings are of two types: one of them is decorative with (< 1.5 μm) thickness which is usually applied over another under-layer coatings such as copper and nickel. The other one is hard with (2.5–500 μm) or greater thickness and with (850–1200 HV) hardness which is usually applied on the base metal directly [1].
Indeed, chromium has many oxidation states; however, hexavalent chromium (Cr6+) salts are the most widely used for Cr electrodepositing from aqueous solutions. These Cr6+ aqueous baths have several drawbacks that necessitate a significant improvement in Cr electrodeposion technology. Some of the drawbacks are of technical type such as the concomitant hydrogen evolution reaction resulting in a low cathodic reaction efficiency (7–15%) [3], deposit embrittlement, and wasteful energy usage. Others relate to environmental and health issues, where Cr6+is categorized world widely as highly toxic and carcinogenic agent and it has come under legal restriction by organizations around the world [4].
The need for safe and capable alternative bath technology for Cr electrodeposition becomes more rising. One of such alternatives which still under research and improvement is trivalent chromium (Cr3+) based electrolytes [5–7]. It is less toxic and eco-friendly. Although the aqueous type of Cr3+ electrolytes has already been used in industry for many years, it results in lower deposit properties such as crystallinity [8], hardness, and thickness (< 100 μm) [9], especially for the hard Cr type, than the traditional Cr6+ aqueous electrolytes. Furthermore, Cr3+ is barely reduced in aqueous electrolytes due to the formation of stable inner-complex [Cr(H2O)6]3+ which is only reduced at potential more negative than that of water reduction leading to intense hydrogen evolution and higher pH value near the cathode [10]. Cr3+ions are easily oxidized to Cr6+ at inert anodes during the electrodeposition process resulting in corruption of the electrolyte chemistry. It was reported that the addition of organic complexants to Cr3+ aqueous electrolytes with low (Cr3+/Ligand) ratio facilitates Cr3+ reduction resulting in thicker deposits and this was explained by the formation of other less stable Cr3+ complexes [11–13]. Certainly, the final Cr layer deposited from these electrolytes has high carbon content coming from organic additives reduction resulting in a weak deposit performance [14].
Recently, Non-aqueous electrolytes have arisen as an alternative technology for metals electrodeposition [15]. Non-aqueous electrolytes from which Cr has been electrodeposited include broad family composed of underlying categories such as molten salts-based electrolytes [16], traditional organic solvents-based electrolytes [17], and ionic liquids-based electrolytes [18].
In the last two decades, Ionic liquids attract researchers as solvents for Cr electrodeposition due to their wider potential window, good electrical conductivity, low volatility, and low hydrogen evolution compared to aqueous electrolytes [19,20]. Low chemical stability, high cost, and moderate toxicity of ionic liquids push researchers to try using a new class of green solvents known as deep eutectic solvents (DESs) [21]. DESs have the advantages of wider potential window, low toxicity, low environmental bad impact, low cost, and high chemical stability. DESs were reported to be classified into four types [22]. Abbott et al is considered as one of the pioneers in using DESs in purpose of Cr electrodeposition [23,24]. DESs based on choline chloride (ChCl)/hydrogen bond donor (HBD) combinations “known as DES of type III” have been used in the present work as promising solvents for Cr electrodeposition. Ethylene glycol (EG) and urea (U) have been used as HBDs with ChCl to obtain their relevant DES used to electrodeposit Cr from. Seldom reports have explored the mechanism and kinetics of Cr electrodepostion from these solvents [25,26], which are very important to get the knowledge about the optimum conditions for the desired performance.
For the first time, a disposable pencil graphite electrode (PGE) has been used in this work to study the mechanism and kinetics of Cr electrodepostion. PGE is appropriate to investigate the nucleation and growth processes occurring at high negative potentials with lower contribution from the hydrogen evolution. Moreover, commercial availability, low cost, and low background current give PGE a greater advantage over the widely used glassy carbon or pyrolytic graphite electrodes [27]. Cu and Pd nucleation and growth mechanisms were studied using PGE by R. Majidi M and Rezaei M, respectively [28,29].
In this work the electrochemical behavior of Cr3+/DES on PGE surface under different conditions has been studied using cyclic voltammetry (CV) technique. Factors affecting nucleation also have been studied from current density transients obtained under different conditions using chronoamperometry (CA) technique. The deposition on a foreign substrate is well known to occur through three dimensional (3D) nucleation process [30]. Several theoretical models have been reported to predict the behavior of nucleation mechanism. In this work a two suitable theoretical models were used to get qualitative and quantitative information about the Cr nucleation and growth process happened during Cr electrodeposition on PGE surface: one of these models was proposed by Sharifker and Hills (SH) which is based on two limiting cases of 3D-instantaneous (3D-IN) and progressive (3D-PN) nucleation and growth [31]. SH-model has been used just for qualitative estimation. The other model based on the idea of Palomar-Pardavé et al which indicates that the deviation of experimental transients from theoretical ones predicted by SH-model is due to the fact of presence of concurrent electrochemical processes other than nucleation and growth processes during electrodeposition process [32]. Non-linear fitting of a model considering the other individual contributions was used to get quantitative data about the factors affecting nucleation and growth of Cr on PGE. Deconvolution method has been used to get information about the current density transients’ individual contributions.
2. Experimental
2.1 Electrolyte preparation
Choline chloride/ethylene glycol (EG-DES) and choline chloride/urea (U-DES) deep eutectic solvents were prepared by mixing ethylene glycol (El-Nasr pharmaceutical chemicals co., +99%) and Urea (BDH Chemicals Ltd., +99.5%) with choline chloride (LobaChemie Pvt. Ltd., +98%) in a 2:1 molar ratio, respectively at 80°C and stirring till a clear colorless liquids were obtained. Various Cr3+ electrolytes were obtained by dissolving different moles of chromium chloride hexahydrate salt (CrCl3.6H2O) (LobaChemie Pvt. Ltd., +93%) into DESs at 80°C and stirring till clear homogeneous solutions were obtained. To prevent the moisture effect as possible, all the electrolytes were put directly after preparation in tightly-closed vials under N2 gaseous atmosphere and put in a desiccator till measurements.
2.2 Electrochemical experiments
A 10 ml-cell containing three electrodes was used to investigate Cr electrodeposition. Platinum and silver wires were used as counter electrode and quasi reference electrode (QRE), respectively. HB-type pencil lead (PGE) (KOH-I-NOOR, Czech Republic) of 2 mm diameter was used as the working electrode. Based on the elemental analysis reported by Skrzypczyńska K. et al. [33], PGE is chemically composed of C, O, Si, and Al as major elements and K, Ca, Mg, Ti, and Fe as minor elements.
For each experiment the electrochemical measurements were conducted using a computer controlled potentiostat /galvanostat model 273 A from Princeton Applied Research, Oak Ridge, TN, USA with software of 270/250-PAR.
PGE was treated as follows: wet-polished with 1500 grade emery paper, rinsed with double distilled water, and then treated by immersion in concentrated HCl for 1 min, rinsed with double distilled water, ultrasonically cleaned with ethanol, rinsed with double distilled water, and finally mirror-polished with a butter paper. The electroactive surface area of PGE has been determined experimentally using Randles-Sevick equation at 25°C:
Where Ip is peak current (A), n indicates the number of electrons transferred (n=1 for K4[Fe(CN)6]), A is the surface area of the electrode (cm2), D is the diffusion coefficient (D = 6.3 × 10⁻⁶ cm2 s−1 for K4[Fe(CN)6]), co is the concentration of electroactive species (mol cm−3), and ν is the scan rate (V s−1).
By recording CVs at different scan rates for 0.01 mol dm−3 potassium ferrocyanide solution and estimating the slope of Ip vs. ν1/2plot, the electrode surface area was estimated to be 0.0362 cm2.
Cyclic voltammetry experiments were performed in order to assess the electrochemical behavior. Nucleation and growth processes were studied by the chronoamperometry technique.
All the electrochemical experiments were implemented under N2 gaseous atmosphere. The cell temperature was controlled with the aid of a thermostated hot plate and a thermometer immersed in the sample during each experiment. The solvent current density background was subtracted from all recorded current density transients in this work. Furthermore, the potential error resulting from the uncompensated resistance was considered and the corrected potential scale was used for all experiments. All figures were constructed using OriginPro 2018 software.
3. Results and Discussion
3.1 Cyclic voltammetry study
The influences of potential scan rate, temperature, HBD type used in DES preparation and Cr3+ concentration on cyclic voltammogram of Cr3+ in DES at the PGE surface were assessed.
3.1.1 Effect of potential scan rate
As shown in Fig. 1 only two well-defined cathodic peaks, peak (I) at range (−0.8 to −1.0 V) which can be attributed to reduction of Cr3+ to Cr2+, and peak (II) at range (−1.5 to −1.8 V) can be attributed to reduction of Cr2+ to Cr0, implying a well-known two-step mechanism of reduction [11]:
No anodic peaks appear. It can be assumed that the chromium electrodeposition shows totally irreversible reduction process.
Fig. 1 presents the effect of increasing potential scanning rate (ν) from 0.02 to 0.4 Vs−1 on behavior of the cathodic peaks (I, II) using 0.1 mol dm−3 Cr3+/EG-DES on PGE at 30°C. For Peaks (I, II) the peak potential (Ep) shifts negatively and the peak current density (jp) increases, with the increase of ν. As shown in Fig. 2a, jp values of peak (I) varies linearly versus ν1/2 with the best fit [R2 = 0.98874] implying that reduction of Cr3+ to Cr2+ (Peak I) is a typical diffusion-controlled process. Although jp values of peak (II) varies linearly versus ν1/2 [R2 = 0.97544], the resulting line is not the best fit with data points as that of peak (I). Further inspection was done by plotting jp values of peak (II) versus ν as displaced in Fig. 2b and the resulting fitting line suggests that jp values of peak (II) varies linearly versus ν with the best fit [R2 = 0.99684]. Thus one can conclude that reduction of Cr2+ to Cr0 (peak II) may be not pure diffusion-controlled process. The diffusionless behavior is often attributed to presence of an accompanying adsorption process and equation 2 can be used to justify Fig. 2b:
Where Γ* (mol cm−2) is the surface coverage of the adsorbed species, R (8.314 J mol−1 K−1) is the ideal gas constant, n is the electron transfer number, T (K) is the absolute temperature, F (96487 C mol−1) is the Faraday constant, and jp (A cm−2) is the peak current density. The value of Γ* calculated from equation 2 is 6.302 × 10⁻⁹ mol cm−2.
So that, one can assume that the whole process of chromium electrodeposition is totally irreversible diffusion-controlled process with adsorption contribution. Moreover, using the Laviron’s equation 3 [34] the transfer coefficient (α) and the standard rate constant (ks) of the second Cr reduction step corresponding to Peak II were estimated:
Where Ep (V) is the cathodic peak potential, E0′ (V) is the formal potential, α is the transfer coefficient, ks (cm s−1) is the standard rate constant of the surface reaction.
Using Fig. 1 the value of E0′ = −1.53 V was estimated from the intercept of Ep vs. ν plot on the ordinate by extrapolating the line to ν = 0 and from the plot of Ep vs. ln ν, the values of α = 0.12 and ks=0.3 cm s−1 were obtained from the slope and intercept, respectively.
Since, (peak I) represnts a pure diffusion-controlled irreversible step of Cr3+ to Cr2+ reduction process equations 4 and 5 can be used to calculate the transfer and diffusion coefficients of Cr3+ based on data obtained from Fig. 1 and 2a [35]:
Where jp (A cm−2) is the cathode peak current density, co (mol cm−3) is the concentration of metal ions, D (cm2 s−1) is the diffusion coefficient.
The values of α = 0.19 and D = 8.5 ×10⁻⁷ cm2 s−1 were obtained from the slopes of Ep vs. ln ν and jp vs. ν1/2 plots, respectively. The value of D is slightly lower than the reported value 3.5×10⁻⁶ cm2 s−1 obtained in 0.05 mol dm−3 Cr3+/EG-DES at 70°C [26] and this result is logical due to lower temperature (30°C) and high viscosity of electrolyte used here in our experiment.
3.1.2 Effect of Temperature
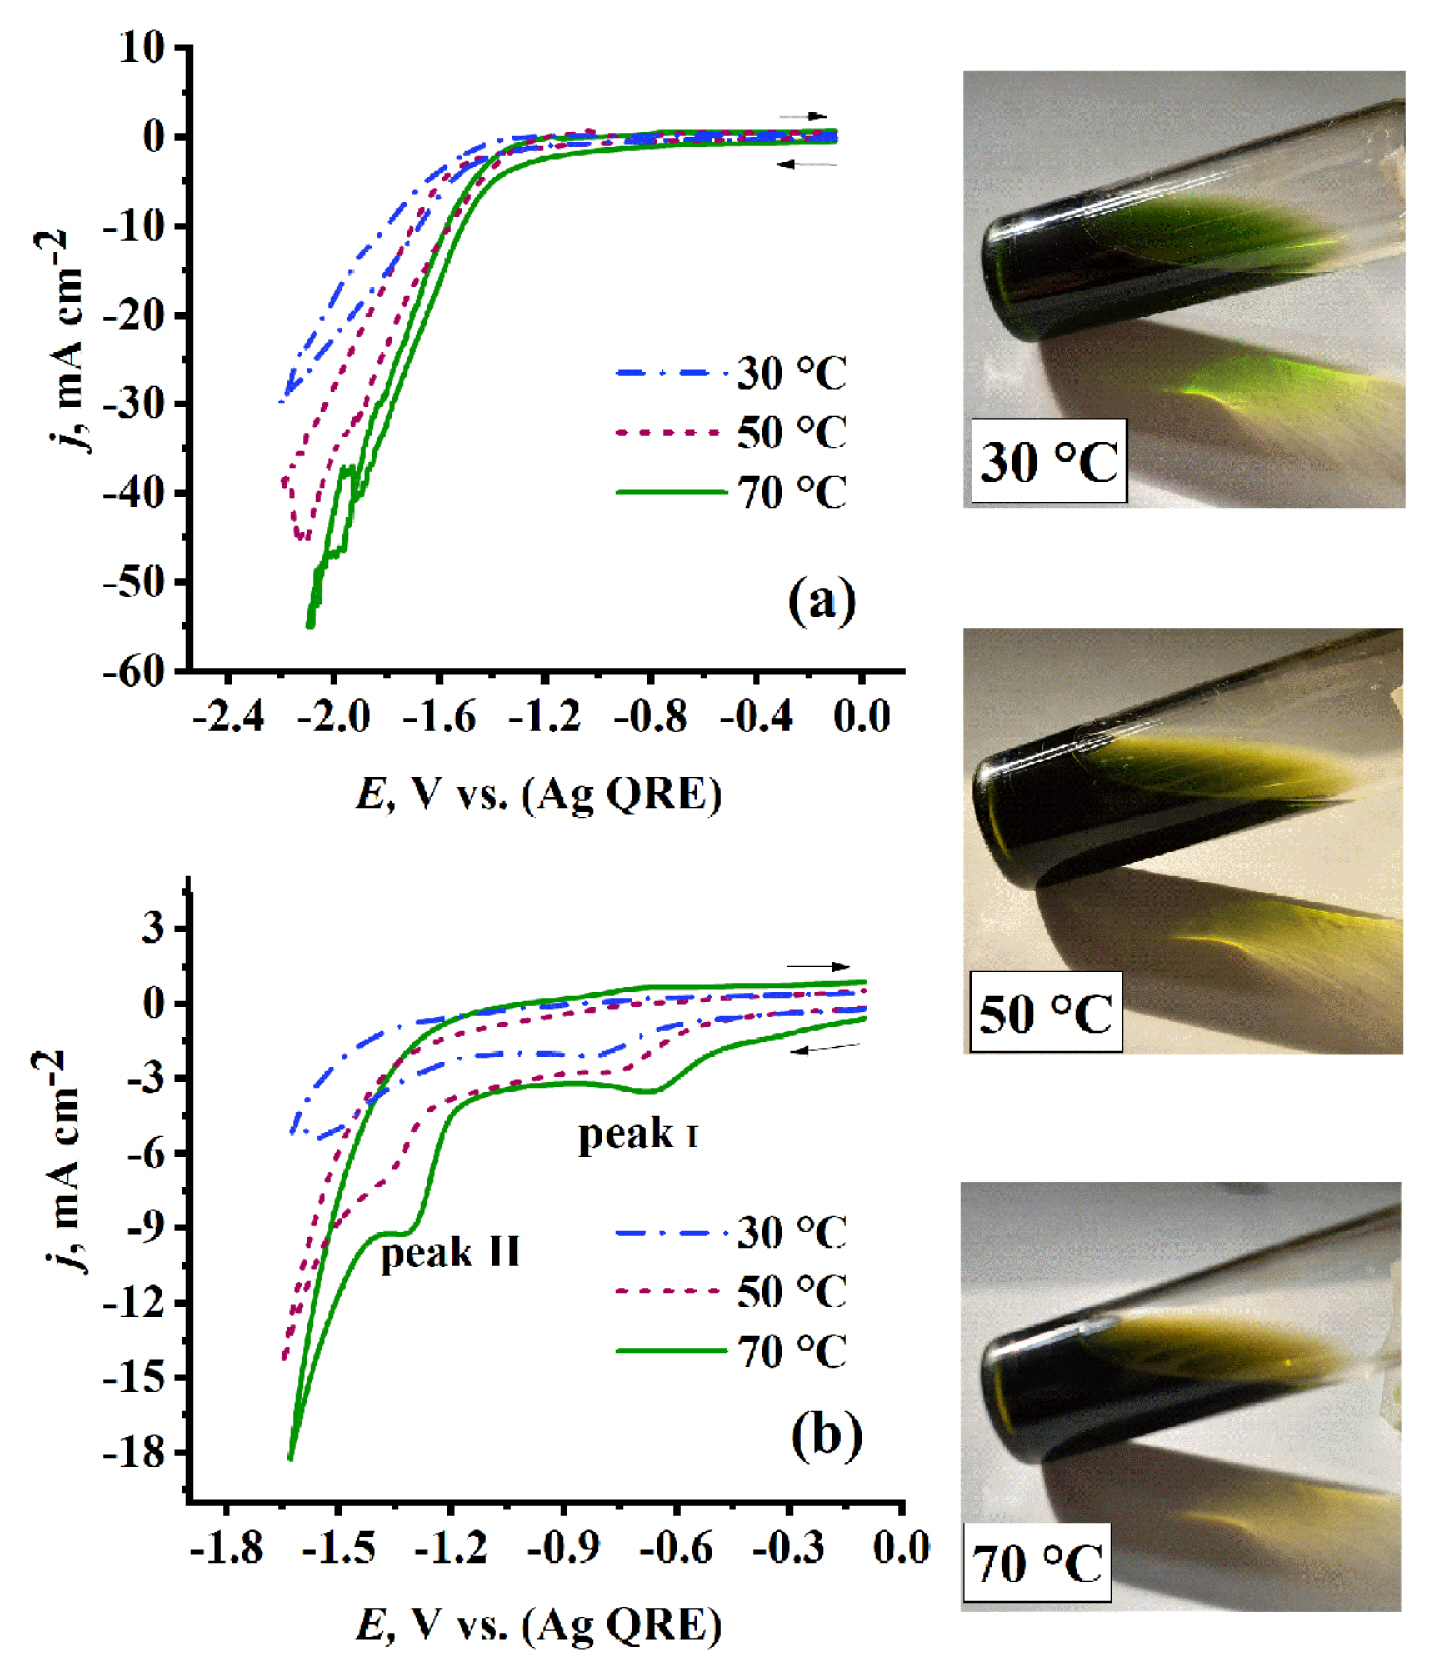
The recorded CVs for neat EG-DES vs. the EG-DES containing Cr3+ show a clear difference. On one hand, the CVs of the EG-DES in Fig. 3a show no peaks in both polarization directions. The current density is constant from starting point of recording (−0.1 V) to about (−1.2 V), then the current density start to increase rapidly due to choline cation decomposition followed by hydrogen evolution [36,37]. Raising the temperature causes noticeable increase in current density in cathodic direction after (−1.2 V). This is due to the enhancement of choline cation decomposition and hydrogen evolution by thermal energy.
On the other hand, the CVs of 0.1 mol dm−3 Cr3+/EG-DES electrolyte in Fig. 3b show two well-defined cathodic peaks. One can notice that raising the temperature results in a gradual increase in jp values for cathodic peaks (I, II). This behavior is due to the increase of mass transfer rate [38]. Also, a shift to more positive potentials for both cathodic peaks is observed. This may be attributed to the decrease in energy barrier required for chromium reduction as a result of change in structure of Cr species formed in DES which accompanying the temperature changes [23,39]. This conclusion is supported by the change in color of Cr3+/EG DES electrolytes as shown in Fig. 3.
By calculating DCr3+ at different temperatures (30, 50, and 70°C) based on data from Fig. 3b and equation 5, the activation energy of Cr3+ species diffusion (ED) of value 4.3 kJ mol−1 and the pre-exponential factor (AD) of value 1.7 cm2 s−1 were deduced using equation 6 [38] from slope and intercept of ln (DCr3+) vs.T−1 plot, respectively.
3.1.3 Effect of hydrogen bond donor type used in DES preparation
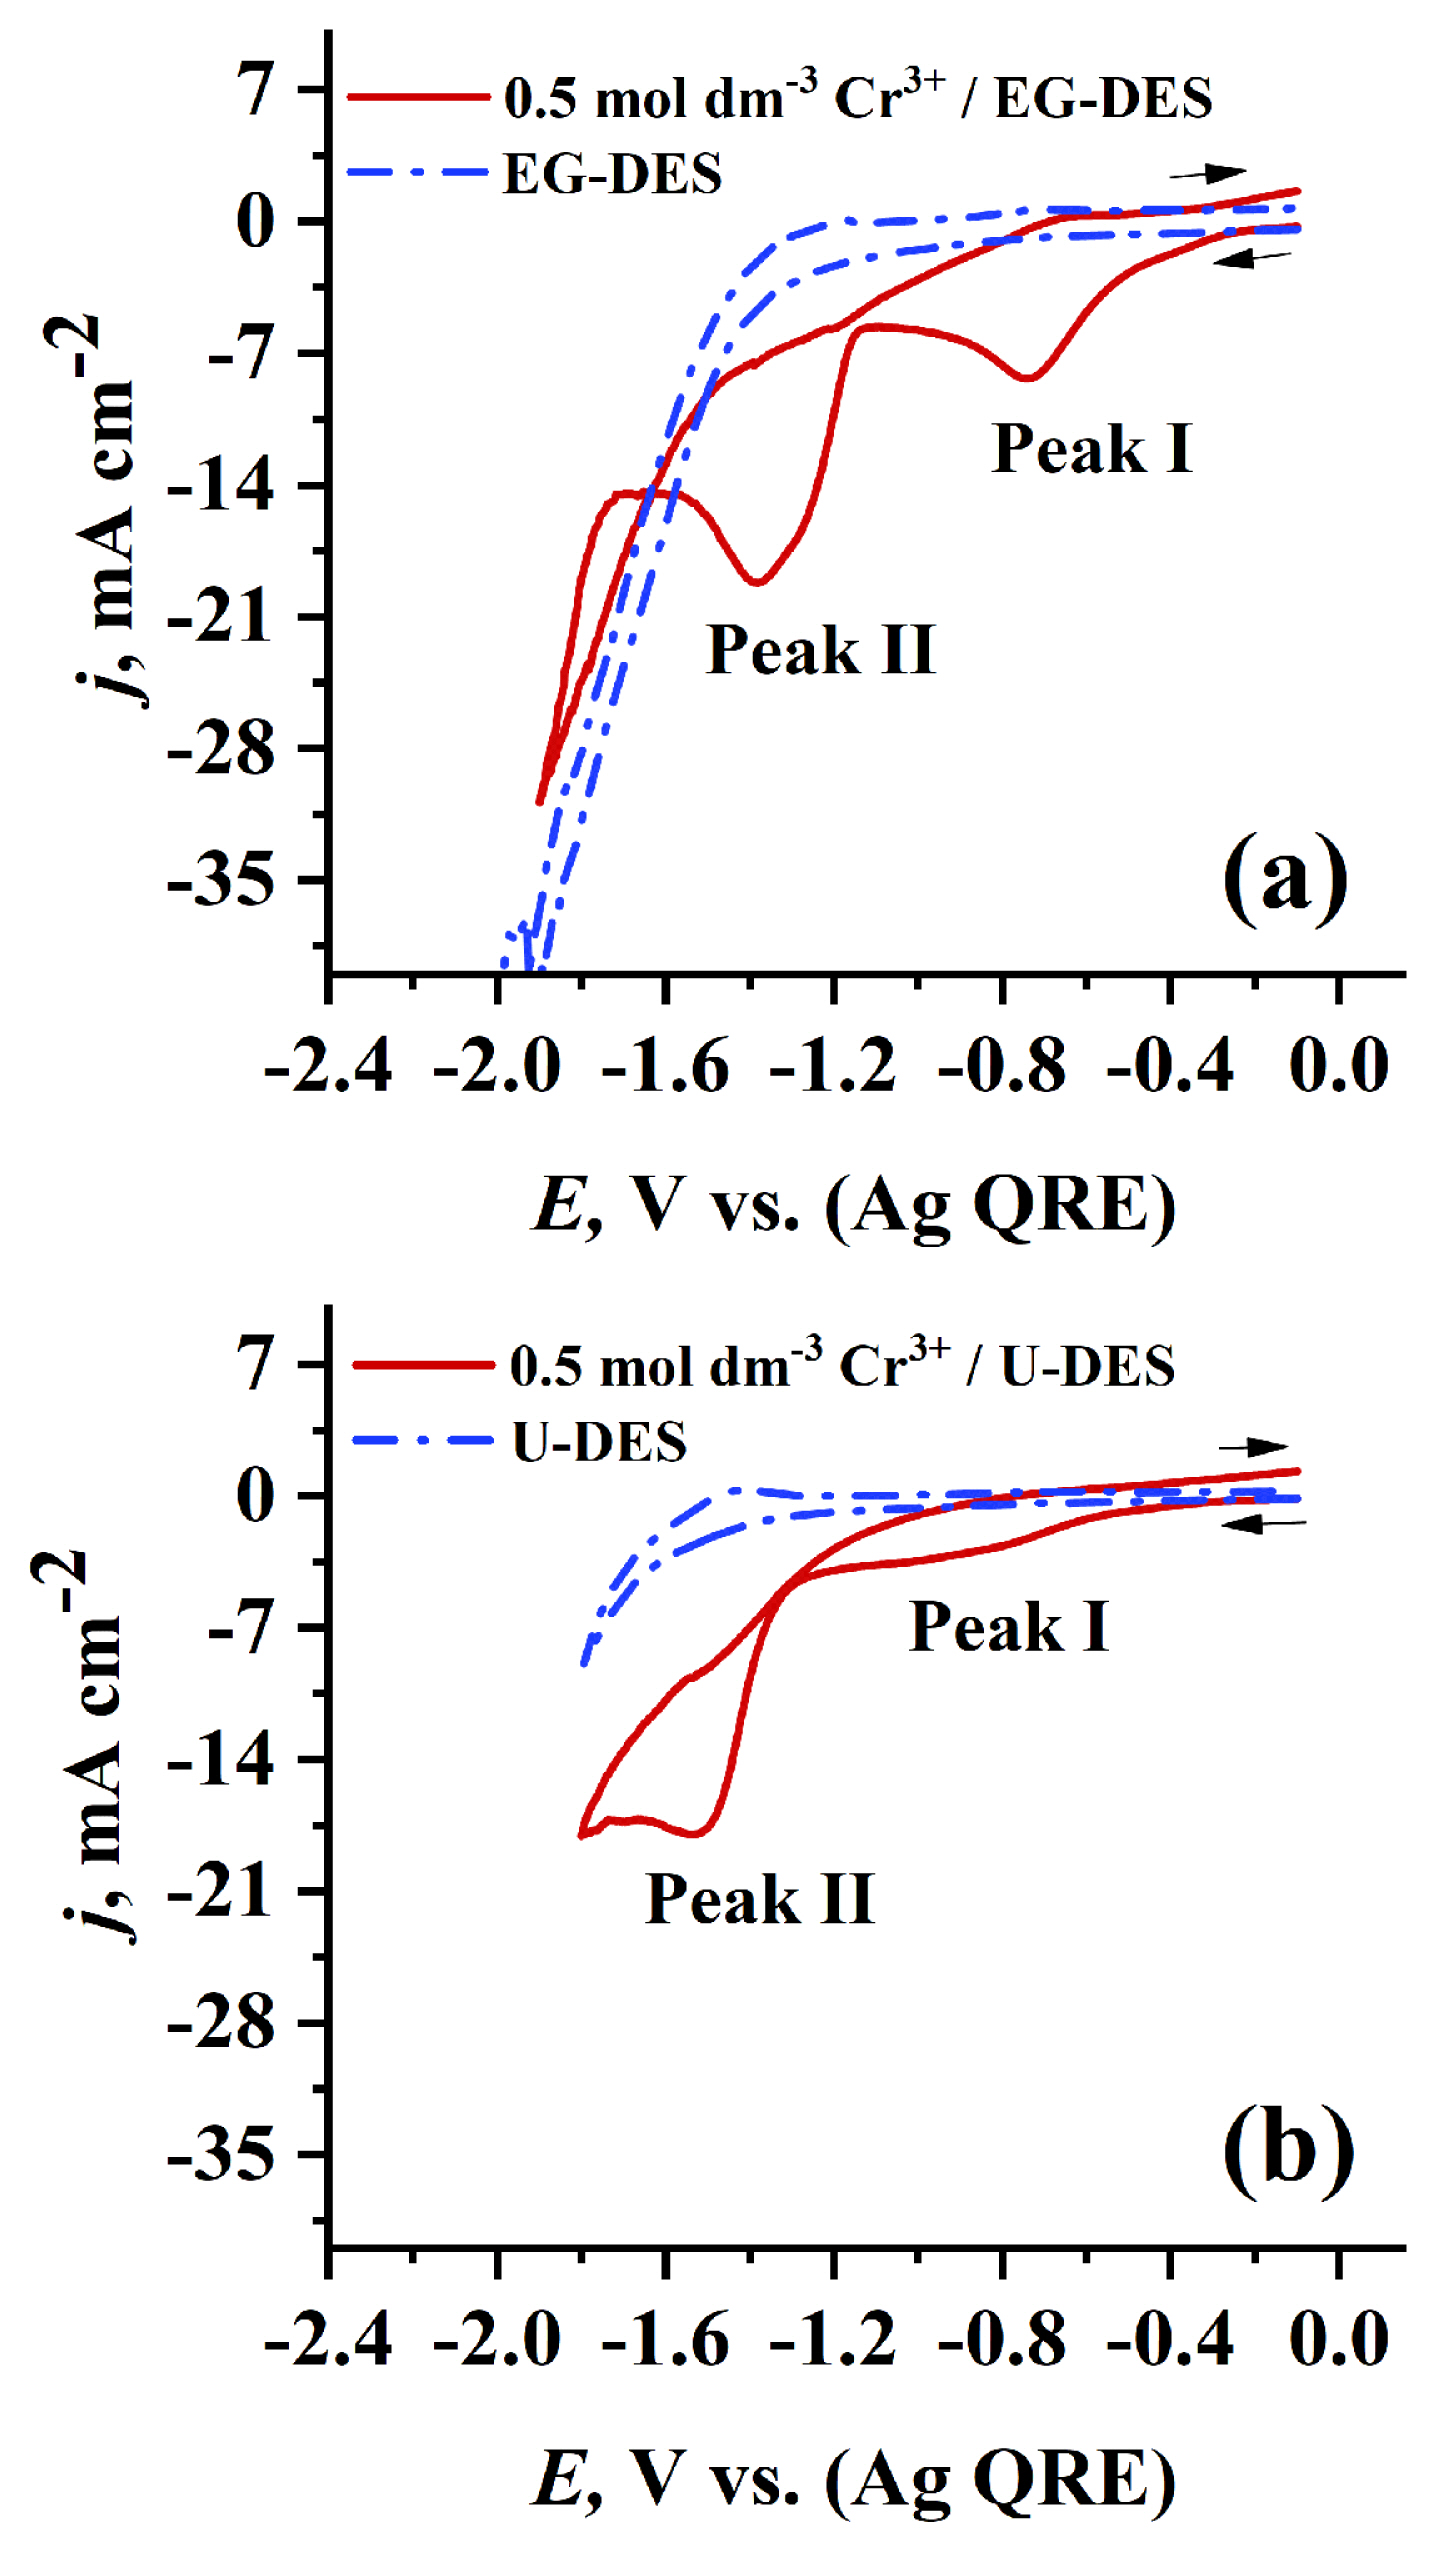
The type of HBD used in DES preparation strongly affects physical properties of the resulting DES such as viscosity and conductivity which further affects mass transport and electrochemical behavior. Cyclic voltammograms were recorded at 70°C on PGE at scan rate 0.05 V s−1 for 0.7 mol dm−3 Cr3+ dissolved in EG-DES (see Fig. 4a) and in U-DES (see Fig. 4b). It was found, as shown in Fig. 4, that the characteristic cathodic peaks (I, II) of Cr3+ reduction in EG-DES that appear at −0.75 V and −1.384 V, respectively, are more sharp and higher in jp values than those obtained in U-DES which appear at −0.9 and −1.53 V, respectively. This can be attributed to the lower viscosity and higher mass transport of EG-DES than that of U-DES at the same temperature (70°C). Thus, one can conclude that EG-DES can be a promising solvent for Cr electrodeposition.
3.1.4 Effect of Cr3+ concentration
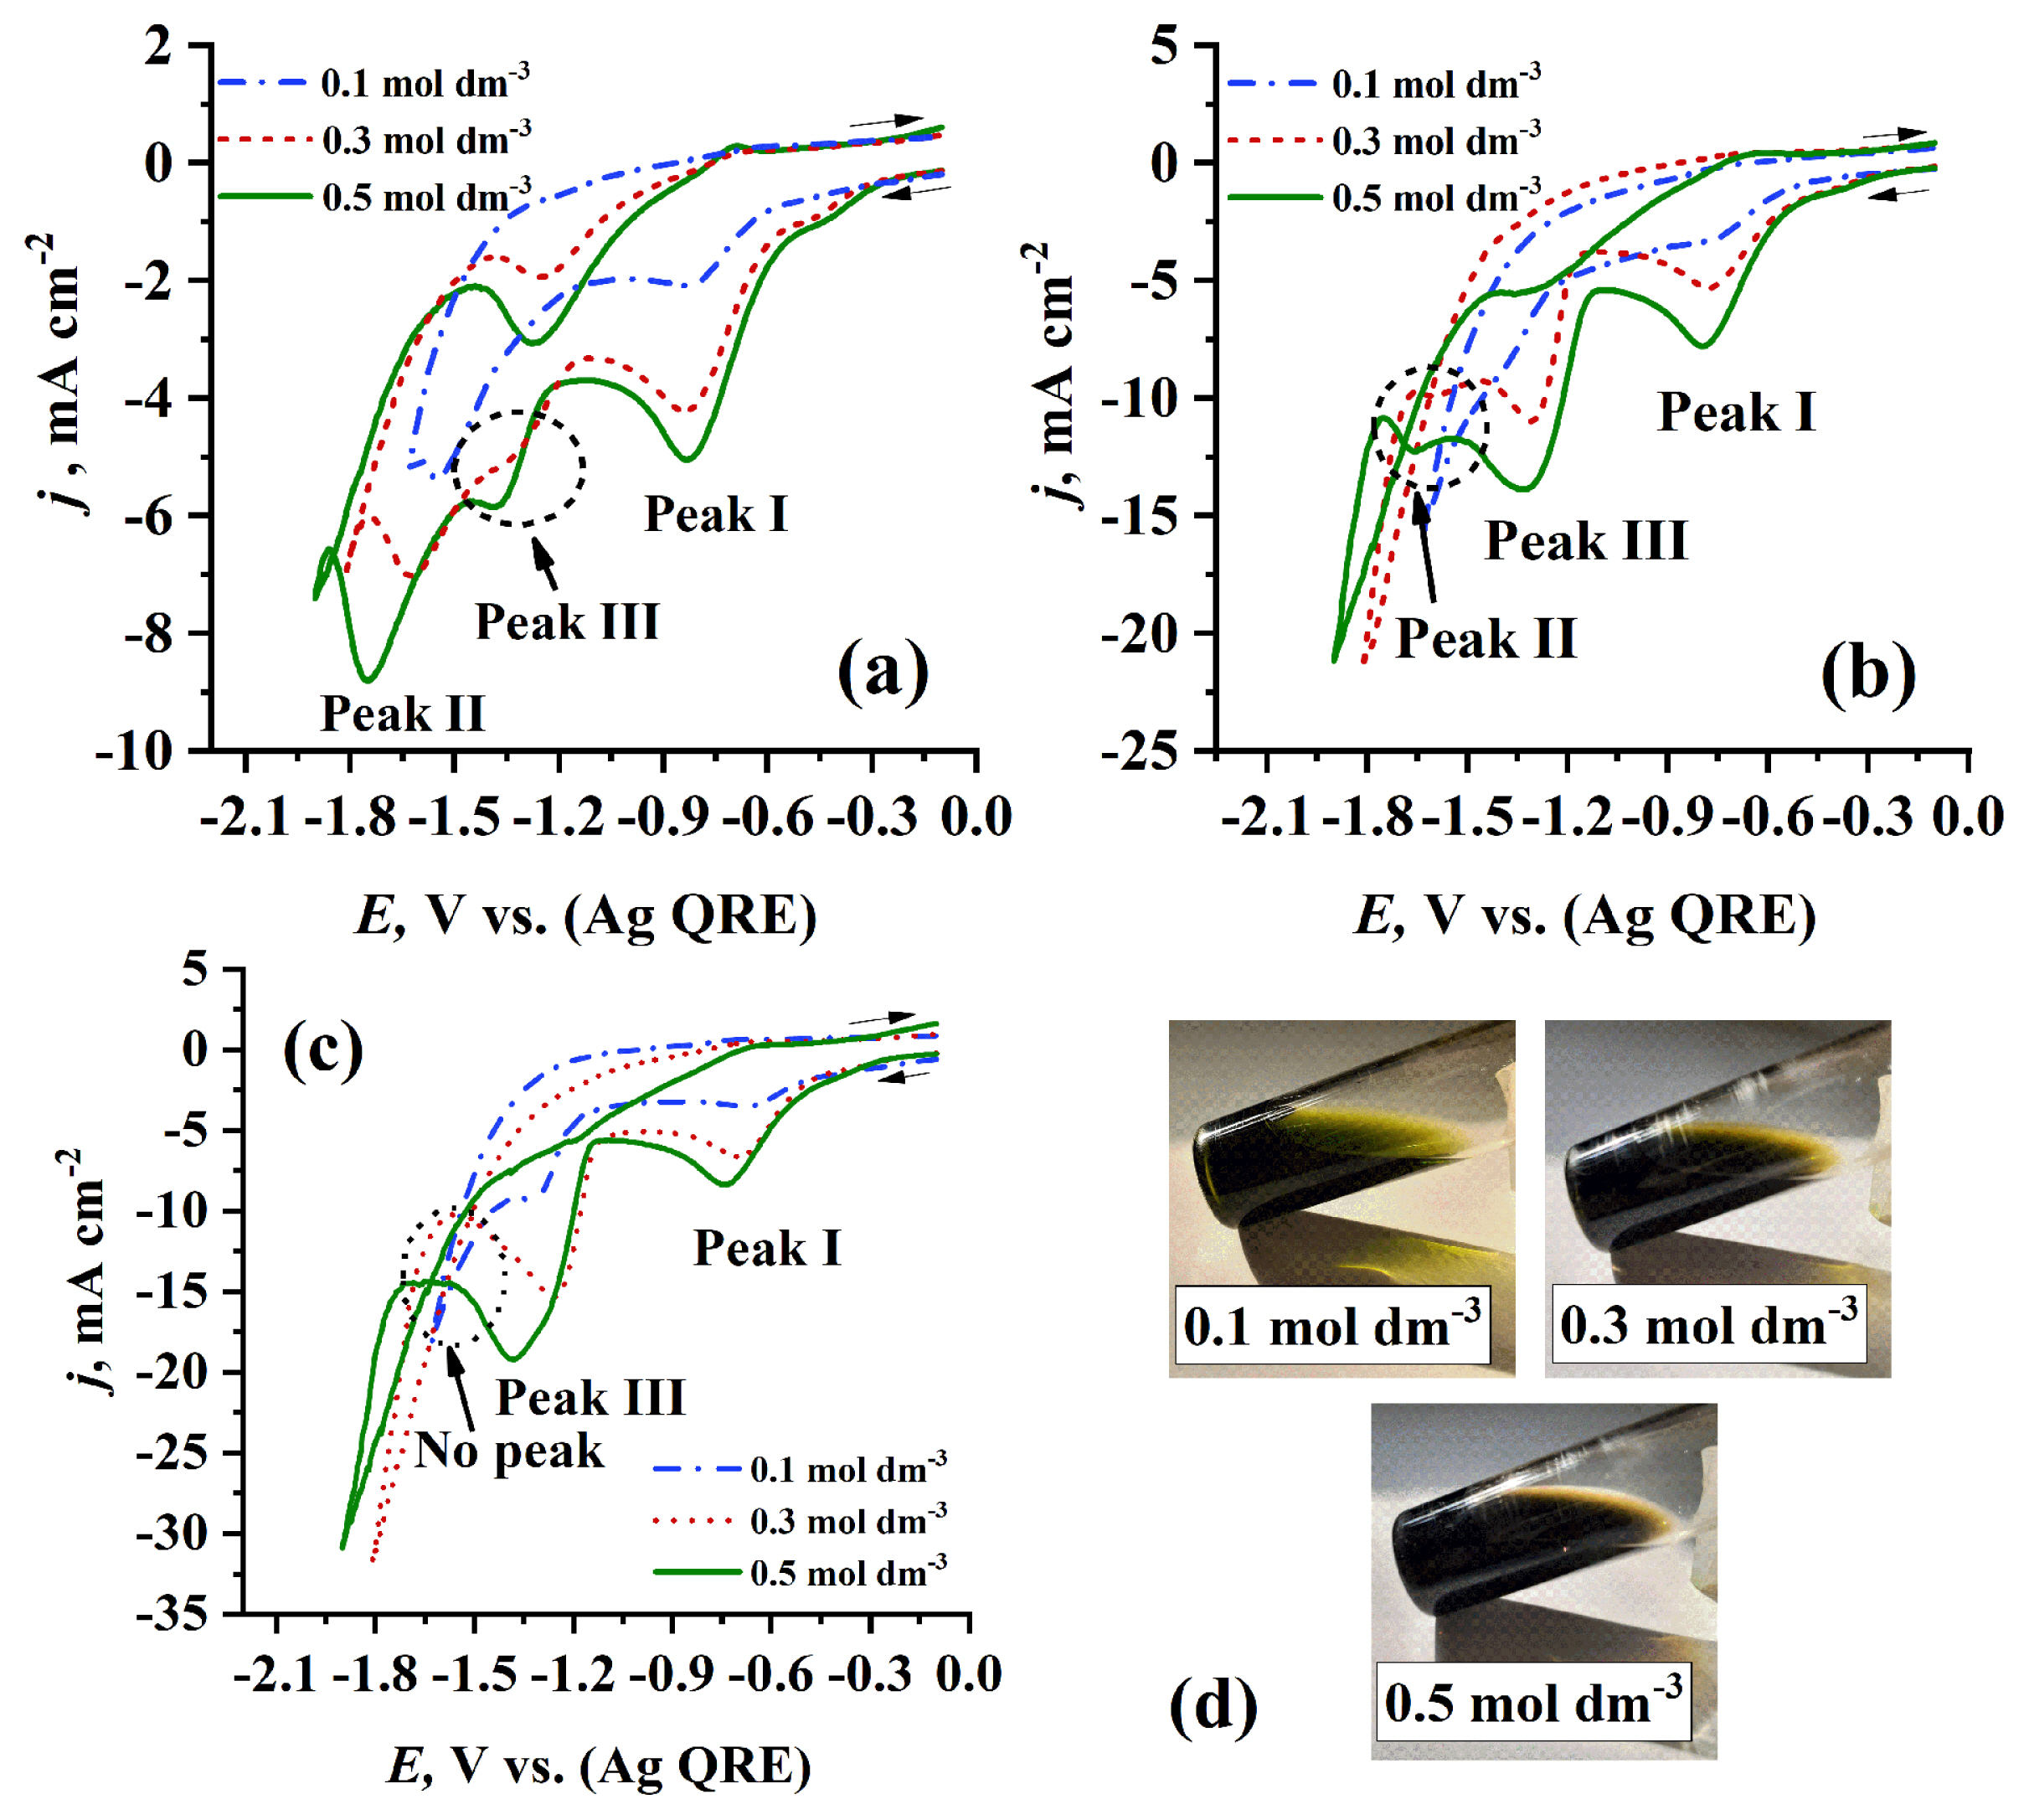
To the best of our knowledge, the effect of using higher concentrations on electrochemical behavior of Cr3+/EG-DES electrolyte is investigated for first time in our work. Fig. 5 shows the effect of increasing concentration of Cr3+ in EG-DES at different temperatures. It is obvious that at the same temperature, the peak potential (EP) and the peak current density (jP) of all cathodic peaks shift to negative and to higher values, respectively, with raising Cr3+ concentration. Occasionally, a new cathodic peak (III) at range (−1.30 to −1.39 V) was appeared at concentrations higher than 0.1 mol dm−3 at the same temperature (30°C), and this can be explained by the change in coordination sphere surrounding Cr3+ centers [23] resulting in new Cr2+ species having lower reduction potential. This concenration effect was indicated by the color change of Cr3+/EG-DES with the change in Cr3+ concenration under the same temperature as in Fig. 5d. At higher temperatures (50°C), jPII of Peak (II) begins to diminish, and Peak (III) becomes more sharp and greater in the peak current density (jPIII) value as presented in Fig. 5b. This may be justified by the conversion of the hardly reduced Cr2+ species corresponding to Peak (II) to the easily reduced Cr2+ species corresponding to Peak (III) with increasing temperature. At 70°C, Peak (II) disappears completely, and Peak (III) becomes more sharp and higher in jPIII value as introduced in Fig. 5c. Thus, it can be concluded that there are many species of Cr3+ formed in EG-DES solvents and the coordination sphere surrounding Cr3+ centers can be modified according to the concentration of Cr3+ and the temperature of electrolyte.
3.2 Chronoamperometry study
The influences of step potentials, HBD type used in DES preparation, temperature, and Cr3+ concentration on Cr nucleation and growth were investigated using the recorded current density transient curves. Chronoamperomery experiments were executed by stepping the potential of the working electrode from the value (−0.2 V) at which no reduction of Cr3+ occurs to potentials sufficiently negative to initiate reduction which corresponds to peak (III) as shown in Fig. 5c.
3.2.1 Qualitative estimation using the dimensionless SH-model
3.2.1.1 Effect of temperature
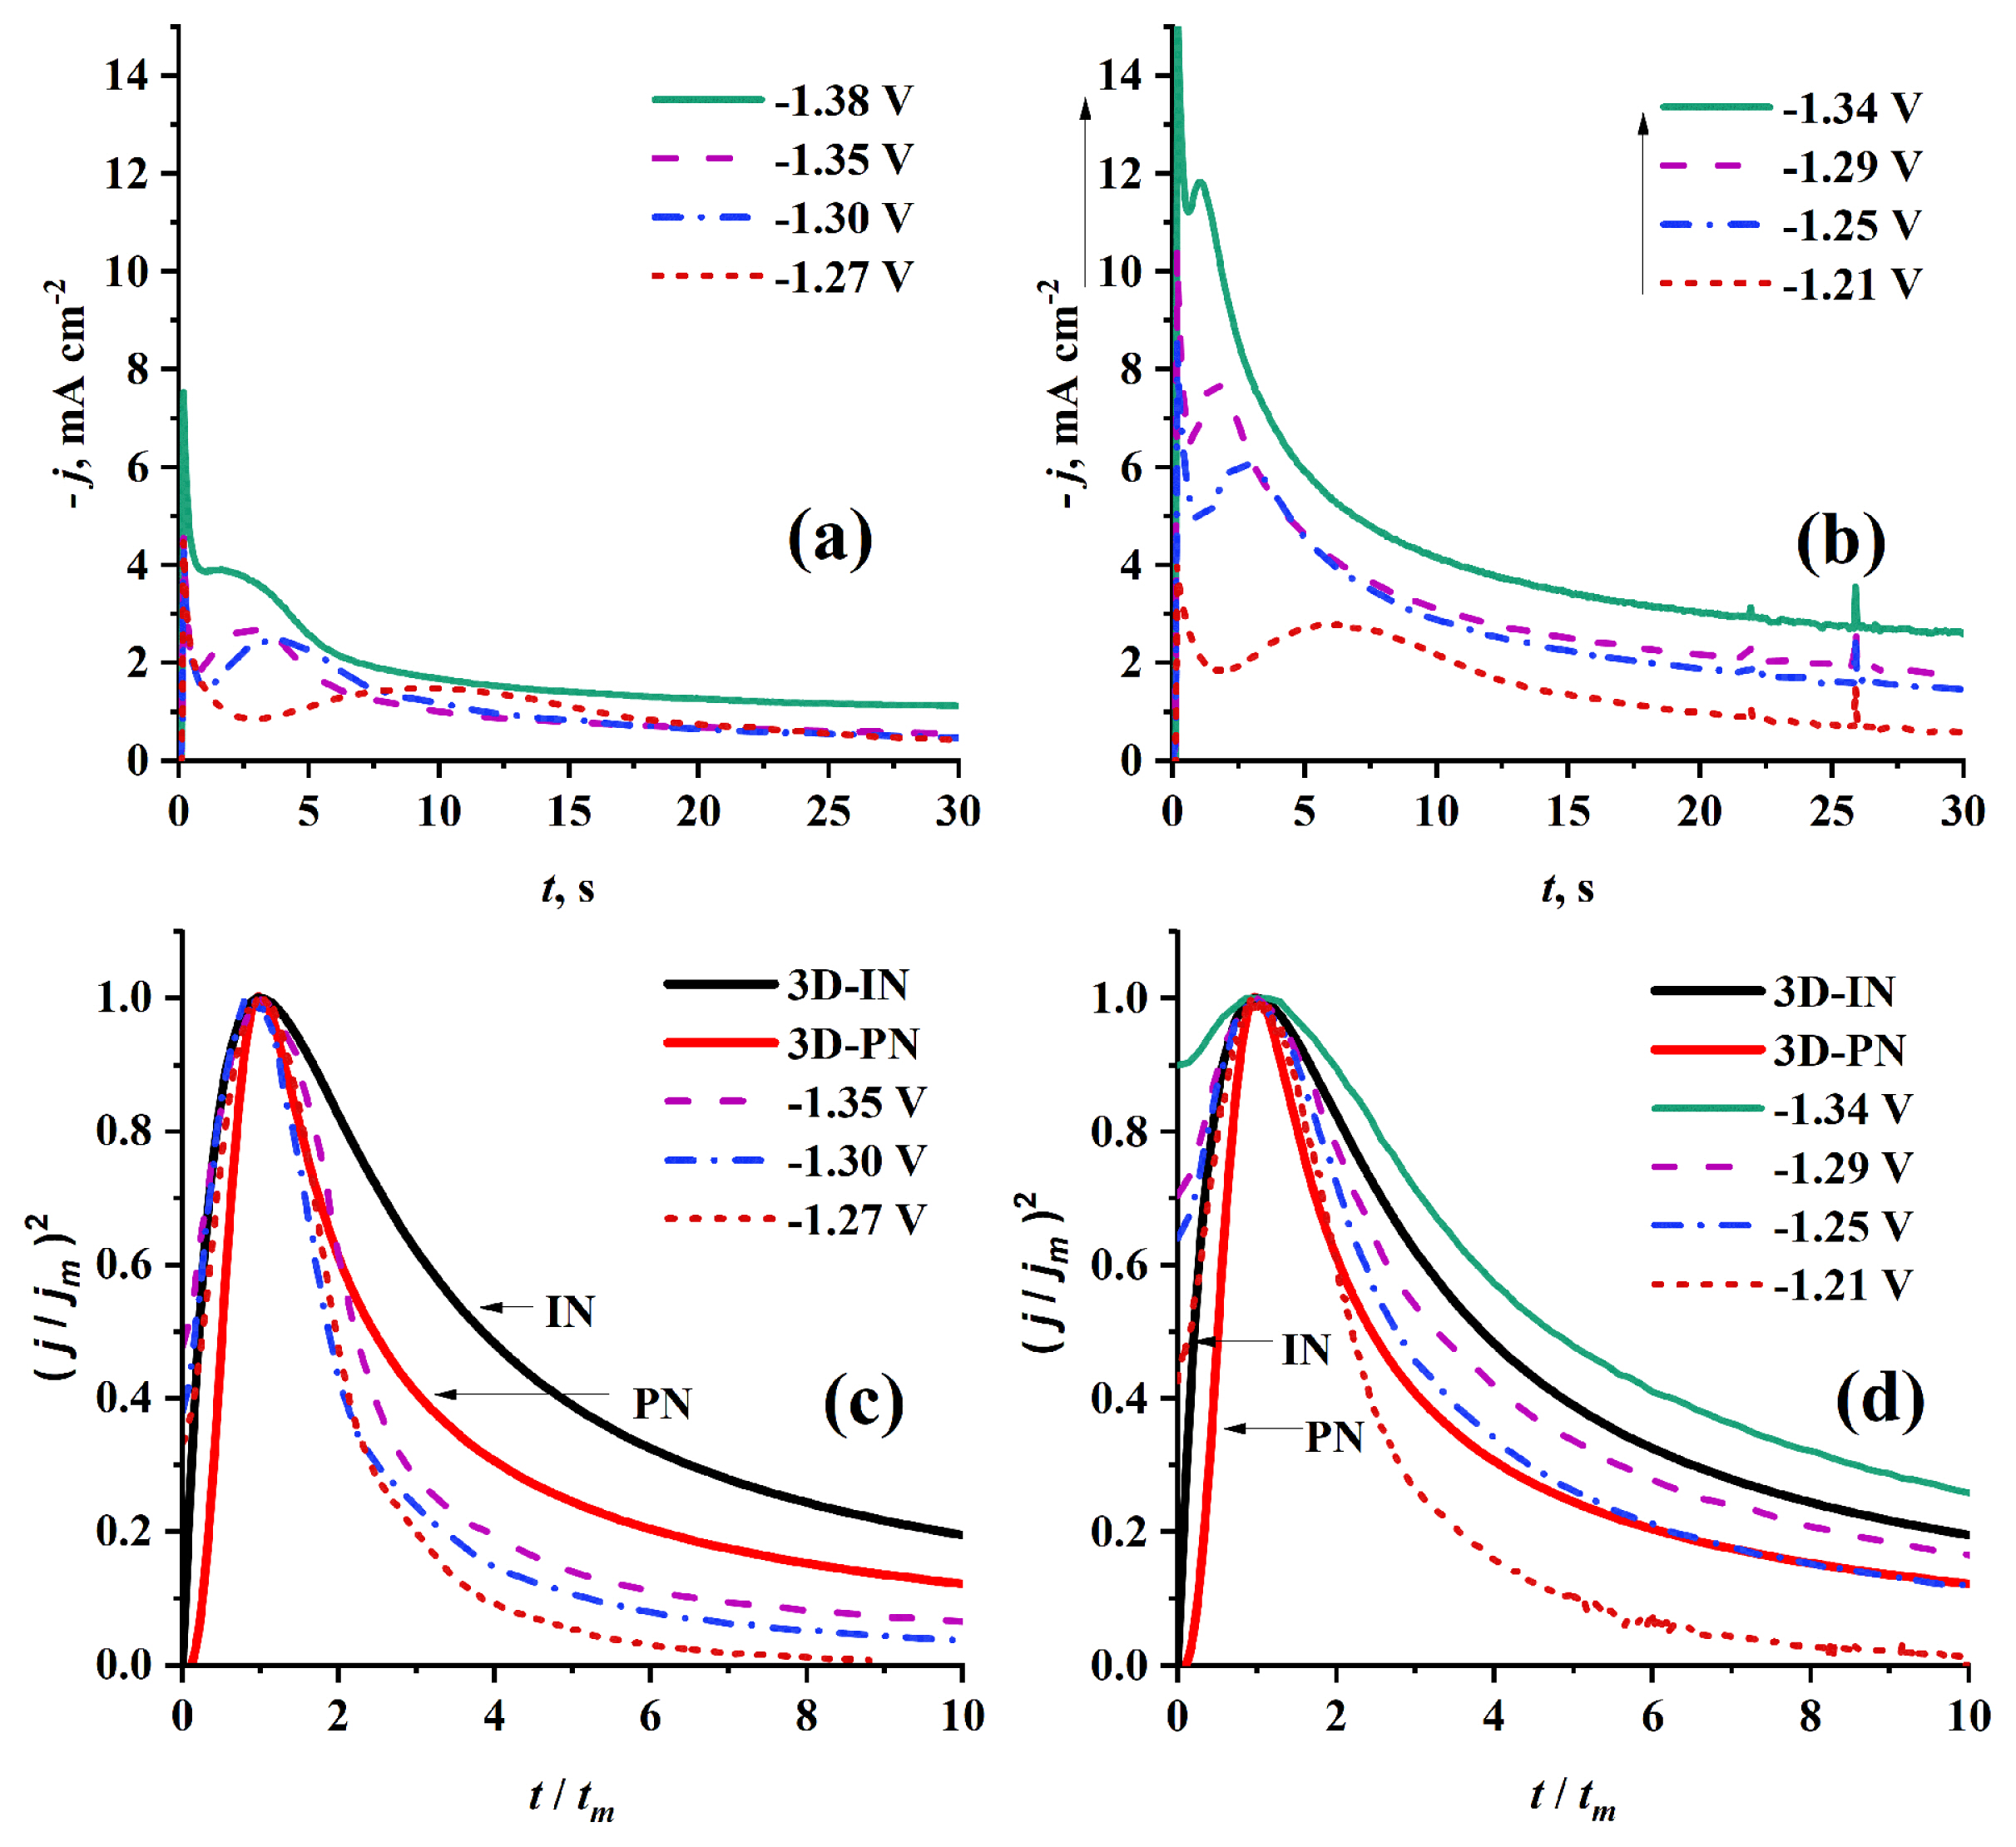
The effect of temperature on the mechanism of nucleation and growth of Cr on HB-PGE was investigated by performing CA experiments at two different temperatures (50 and 70°C) using 0.1 mol dm−3 Cr3+/EG-DES as shown in Fig. 6. The resulting current transients are typical of nucleation and growth process, in which at very short times the first current density decay can be attributed to charge-discharge equilibrium of double layer, adsorption-desorption equilibrium, and/or Cotterellian processes specially in multi step reduction process as in our case. Then, the current density increases to the maximum (jm) which corresponds to (tm), then the current decreases exponentially tending to a plateau.
As introduced in Fig. 6, as the applied potential becomes more negative, the values of jm increases and those of tm decreases. Also, it was found that increasing electrolyte temperature from 50 to 70°C leads to an increase in current of nucleation and growth of Cr on HB-PGE.
The effect of temperature on type of nucleation and growth of Cr on PGE was studied qualitatively by building dimensionless plots using jm and tm obtained from current density transients shown in Fig. 6 and comparing it with the dimensionless SH-model. Its two limiting cases of instantaneous (IN) and progressive (PN) can be expressed by two equations 7 and 8:
To apply SH-model, the assumption that nucleation starts at (t = 0) must be taken into account. To fulfill this requirement the induction time value (t0) which precede the current density rising to maxima was subtracted from the (t) value.
Figs. 6c and 6d show the dimensionless plots which are built by plotting j2/jm2 versus t/tm corresponding to current density transients in Fig. 6a and 6b. Although it was found that for (t/tm < 1) at both temperatures (50 and 70°C), the experimental curves fit well with the theoretical 3D-IN curve. However, from (t/tm = 1) to (t/tm < 2) at 50°C (see Fig. 6c) the experimental curves are well-fitted with the theoretical 3D-PN curve. For (t/tm > 2), the experimental curves significantly deviate to lower values of j2/jm2. At 70°C (see Fig. 6d), the experimental curves are also well-fitted with the theoretical 3D-IN curve for (t/tm < 1). For (t/tm > 1) the nucleation and growth mechanism is gradually shifted from 3D-PN to 3D-IN type with increasing potential step value. Thus, one can assume that 3D-IN mechanism is favored by increasing temperature and step potential values.
3.2.1.2 Effect of hydrogen bond donor used in DES preparation
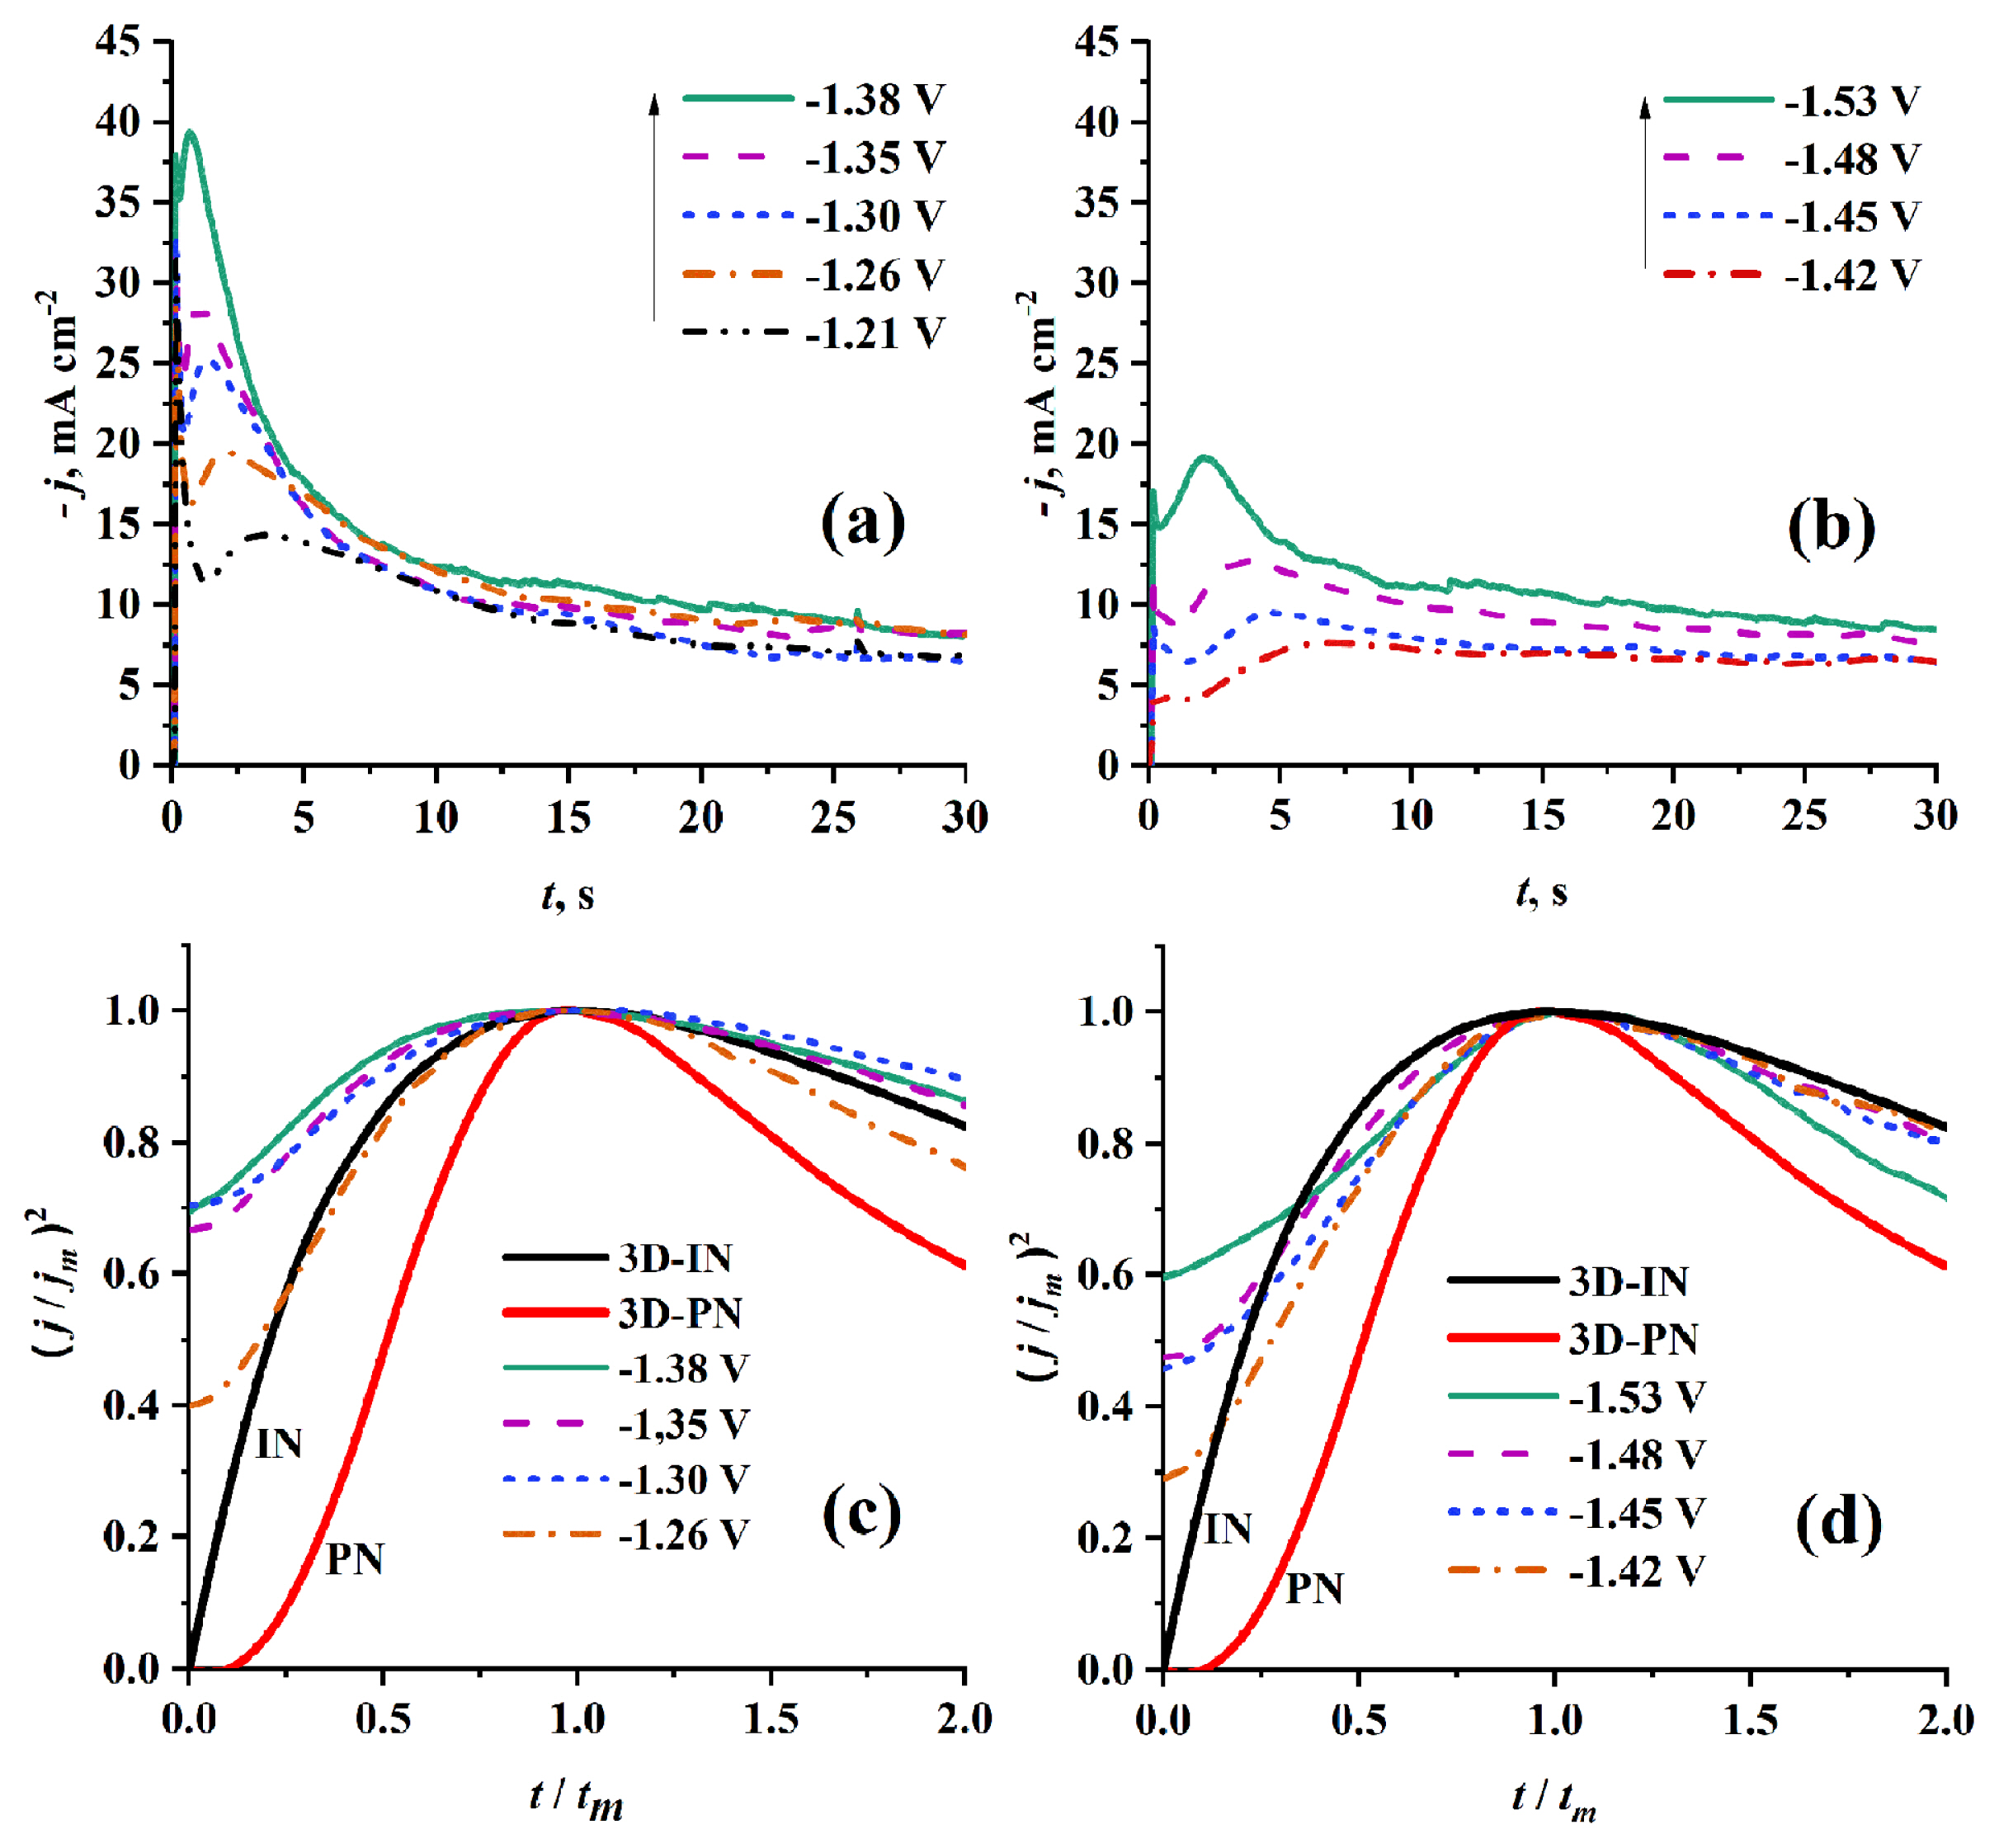
Figs. 7a and 7b show the effect of using different HBD on the Cr nucleation and growth at the same Cr3+ concentration (0.5 mol dm−3) and temperature (70°C). It was found that when EG-DES was used the current densities of the corresponding transients are higher than that when U-DES was used. And this is previously reported due to the difference in viscosity and conductivity between the two solvents. Further, tm values of current density transients corresponding to EG-DES based electrolytes are less than those corresponding to U-DES based electrolytes. This behavior can be explained by the faster nucleation and growth kinetics incase of EG-DES based electrolytes than incase of U-DES based electrolytes. By comparison of the dimensionless experimental current transients with the theoretical ones of SH-model, it was found as shown in Fig. 7c and 7d that the Cr nucleation is of 3D-IN type in both solvents.
3.2.1.3 Effect of Cr3+ concentration
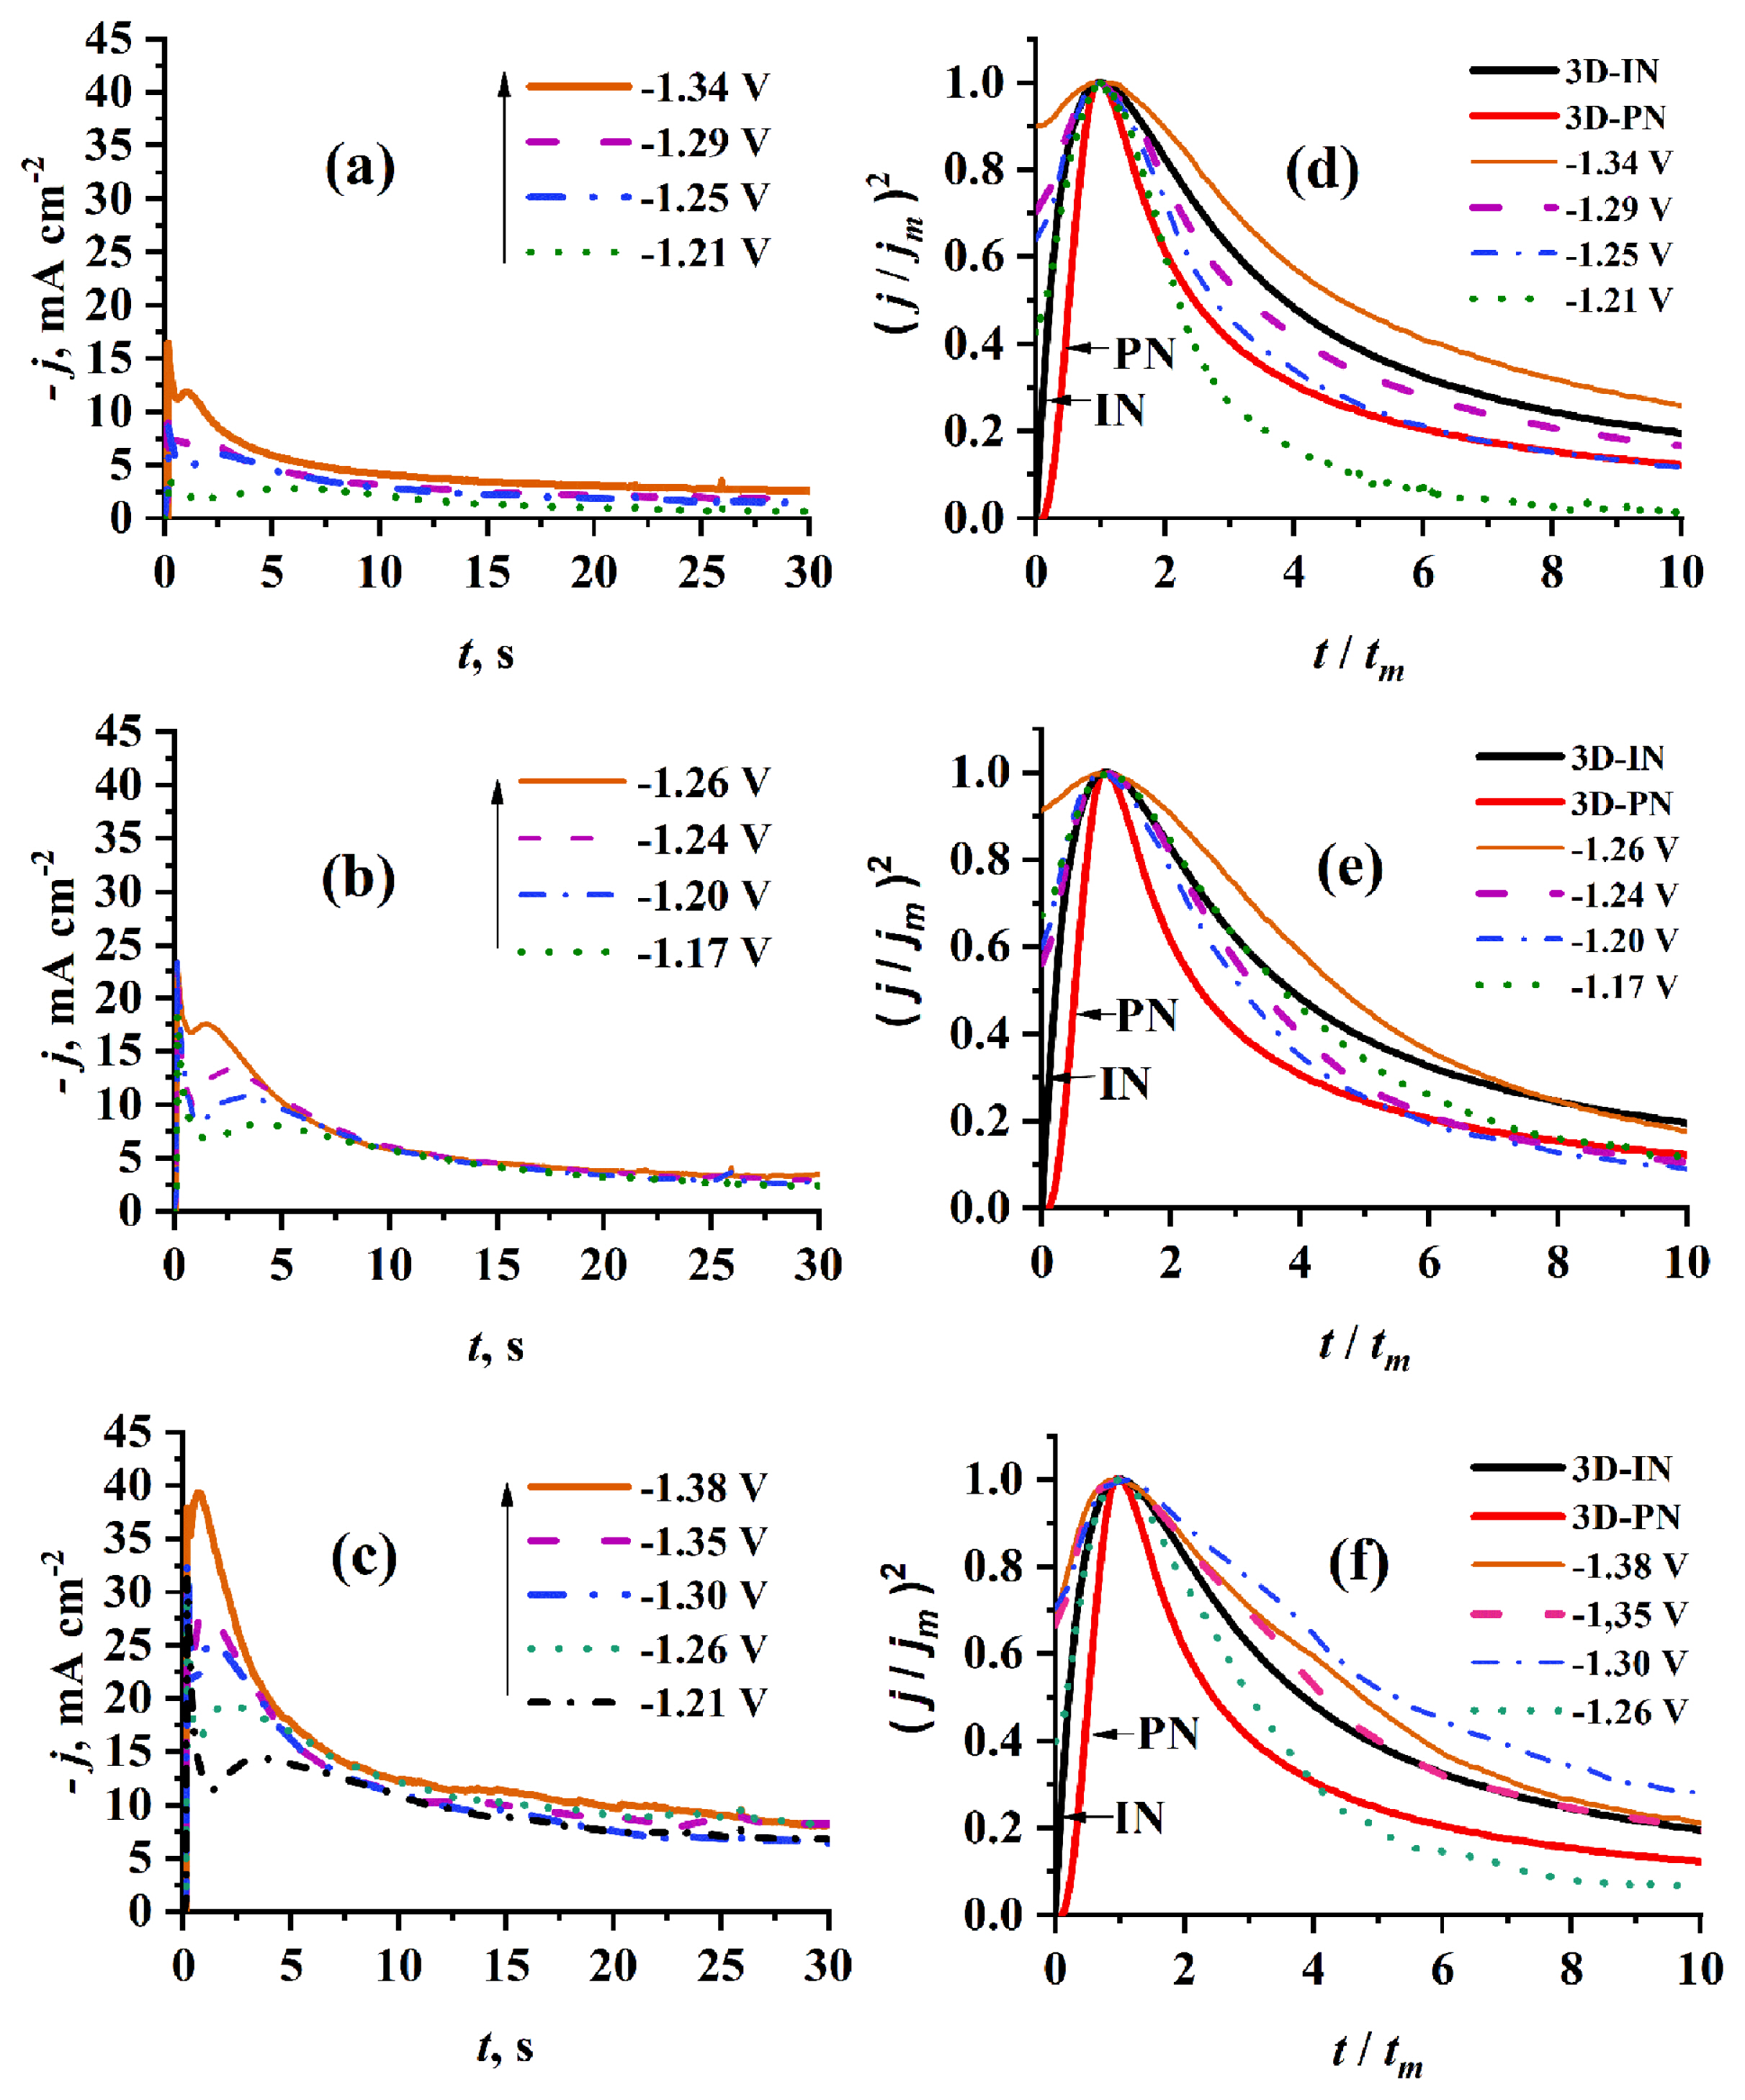
The effect of Cr3+ concentration used to make the electrolyte on nucleation and growth during Cr electrodeposition on PGE at 70°C was investigated as shown in Fig. 8. In the current density transients presented in Figs. 8a, 8b, and 8c, there is an increase in current density as Cr3+ concentration increases. To get more information about nucleation and growth type a comparison between the experimental current density transients and theoretical 3D nucleation model. One can conclude, as in Figs. 8d, 8e, and 8f, that at the same temperature (70°C) and potential step, as the concentration increases, the nucleation and growth mechanisms shift from 3D-PN to 3D-IN type for (t/tm > 1), the experimental curves is well coincided with the theoretical 3D-IN one for (t/tm < 1) at all Cr3+ concentrations.
3.2.2 Quantitative estimation using a nonlinear fitting and deconvolution method
As shown in the previous section, Comparisons between dimensionless experimental current density transients and theoretical ones of SH-model, suggest that this model cannot adequately describe the nucleation and growth mechanism due to the complexity of real mechanism which incorporate many contributions other than the pure limiting IN and PN mechanisms. The early stages (the first current decay) of experimental current density transients may have many contributions from charge-discharge equilibrium of electrical double layer, adsorption-desorption equilibrium on electrode surface, and/or Cotterellian processes especially in multi-step reduction process as previously stated. The stage after tm may also have contributions from proton reduction and/or 2D-IN processes. All these contributions can combine to give the experimental current density transients. Thus, based on the idea of Palomar-pardavé et al.[32], a non-linear fitting technique is used to get the typical equation which can properly describe the experimental current density transients. The resulting equation parameters can be used to calculate important kinetic parameters such as nucleation rate constant (A), the number density of active sites (N0), the product (AN0), and the diffusion coefficient (D) of the electroactive species.
The fitted model can be deconvoluted into its individual contributions which can give information about processes occurring in parallel with the nucleation and growth process. taking into account the present case of two-step reduction mechanism, the cotterellian process jCott (t) of Cr3+ reduction to Cr2+, Langmiur type of adsorption-desorption process jAds (t) and proton reduction jPR (t) were suggested to be considered beside the 3D nucleation and growth j3D (t). So that the overall current density can be described by:
This model can be expressed in a parameterized format as follows:
For all previous equations, E (V) is the applied potential, Rs (VA−1cm2) is the electrolyte’s resistance, C (V−1 Acm−2s) is the double layer capacitance, zF (C) is the molar charge transferred during the process, DCr3+ and DCr2+ are the diffusion coefficients for Cr3+ and Cr2+ species respectively, co is the bulk concentration of active species, M (gmol−1) and ρ (gcm−3) are the atomic mass and density of Cr0, N0 (cm−2) is the number density of active sites, A (s−1) is the nucleation rate constant.
3.2.2.1 Effect of step potential
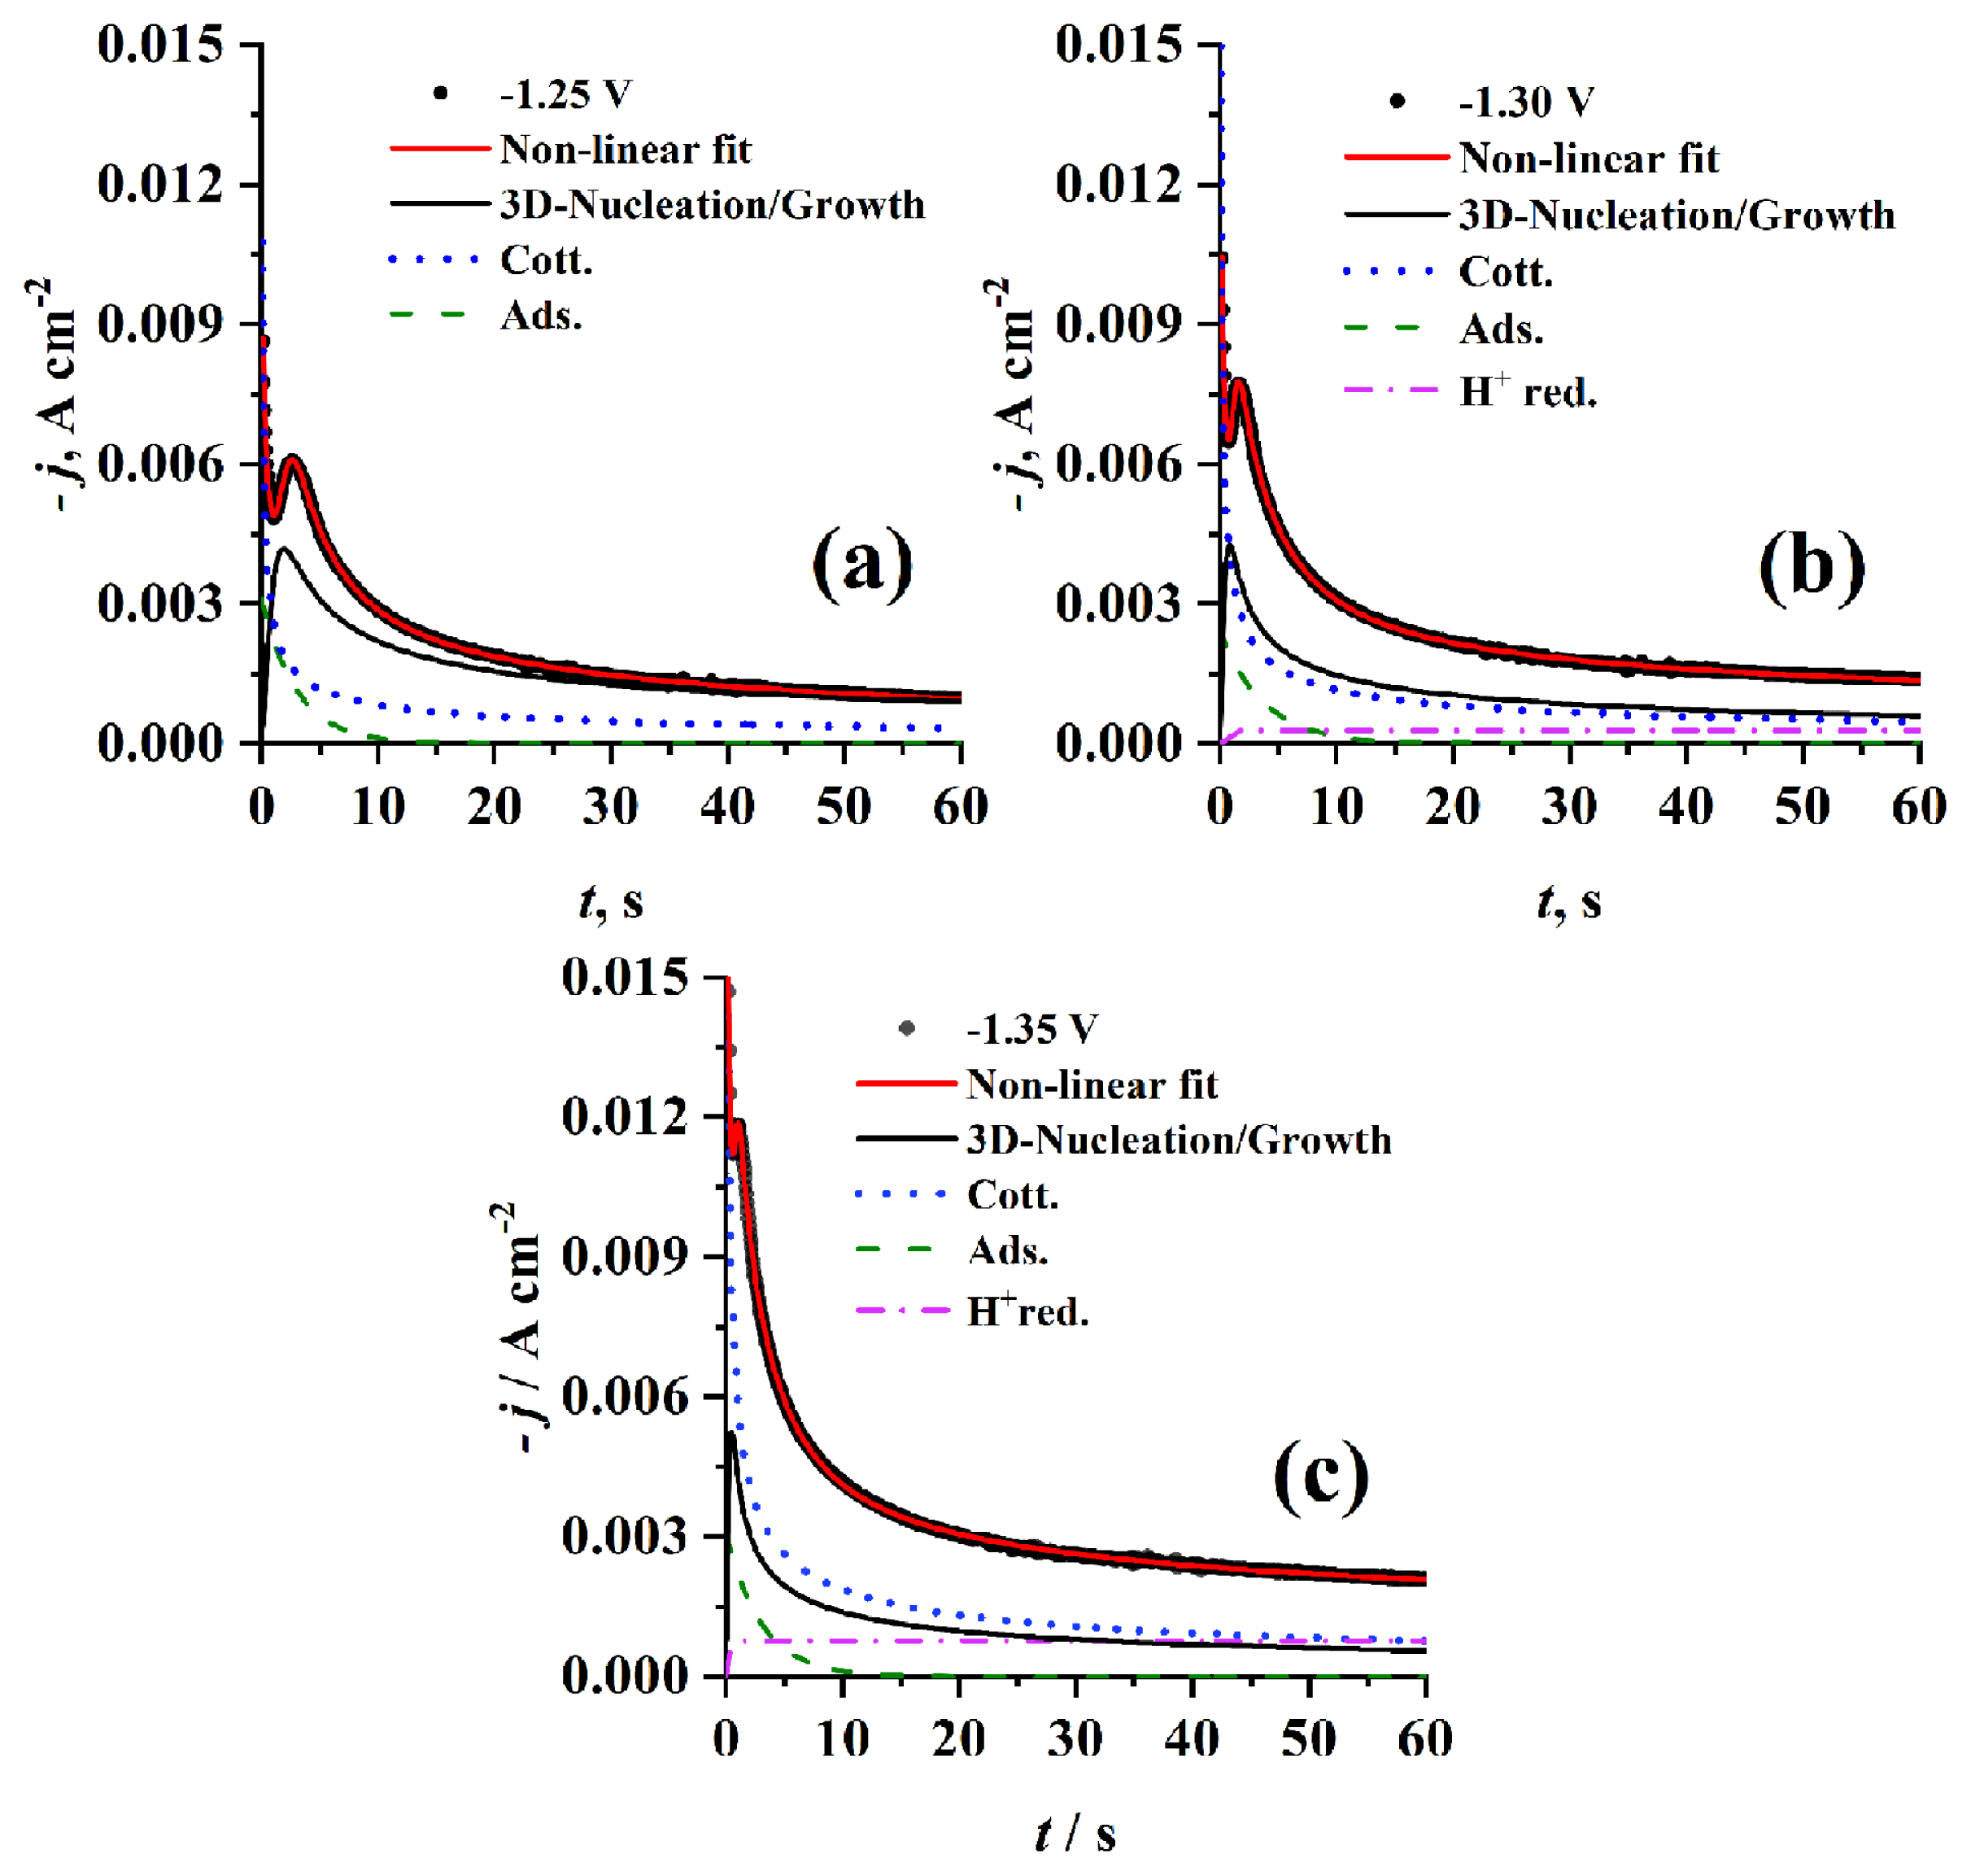
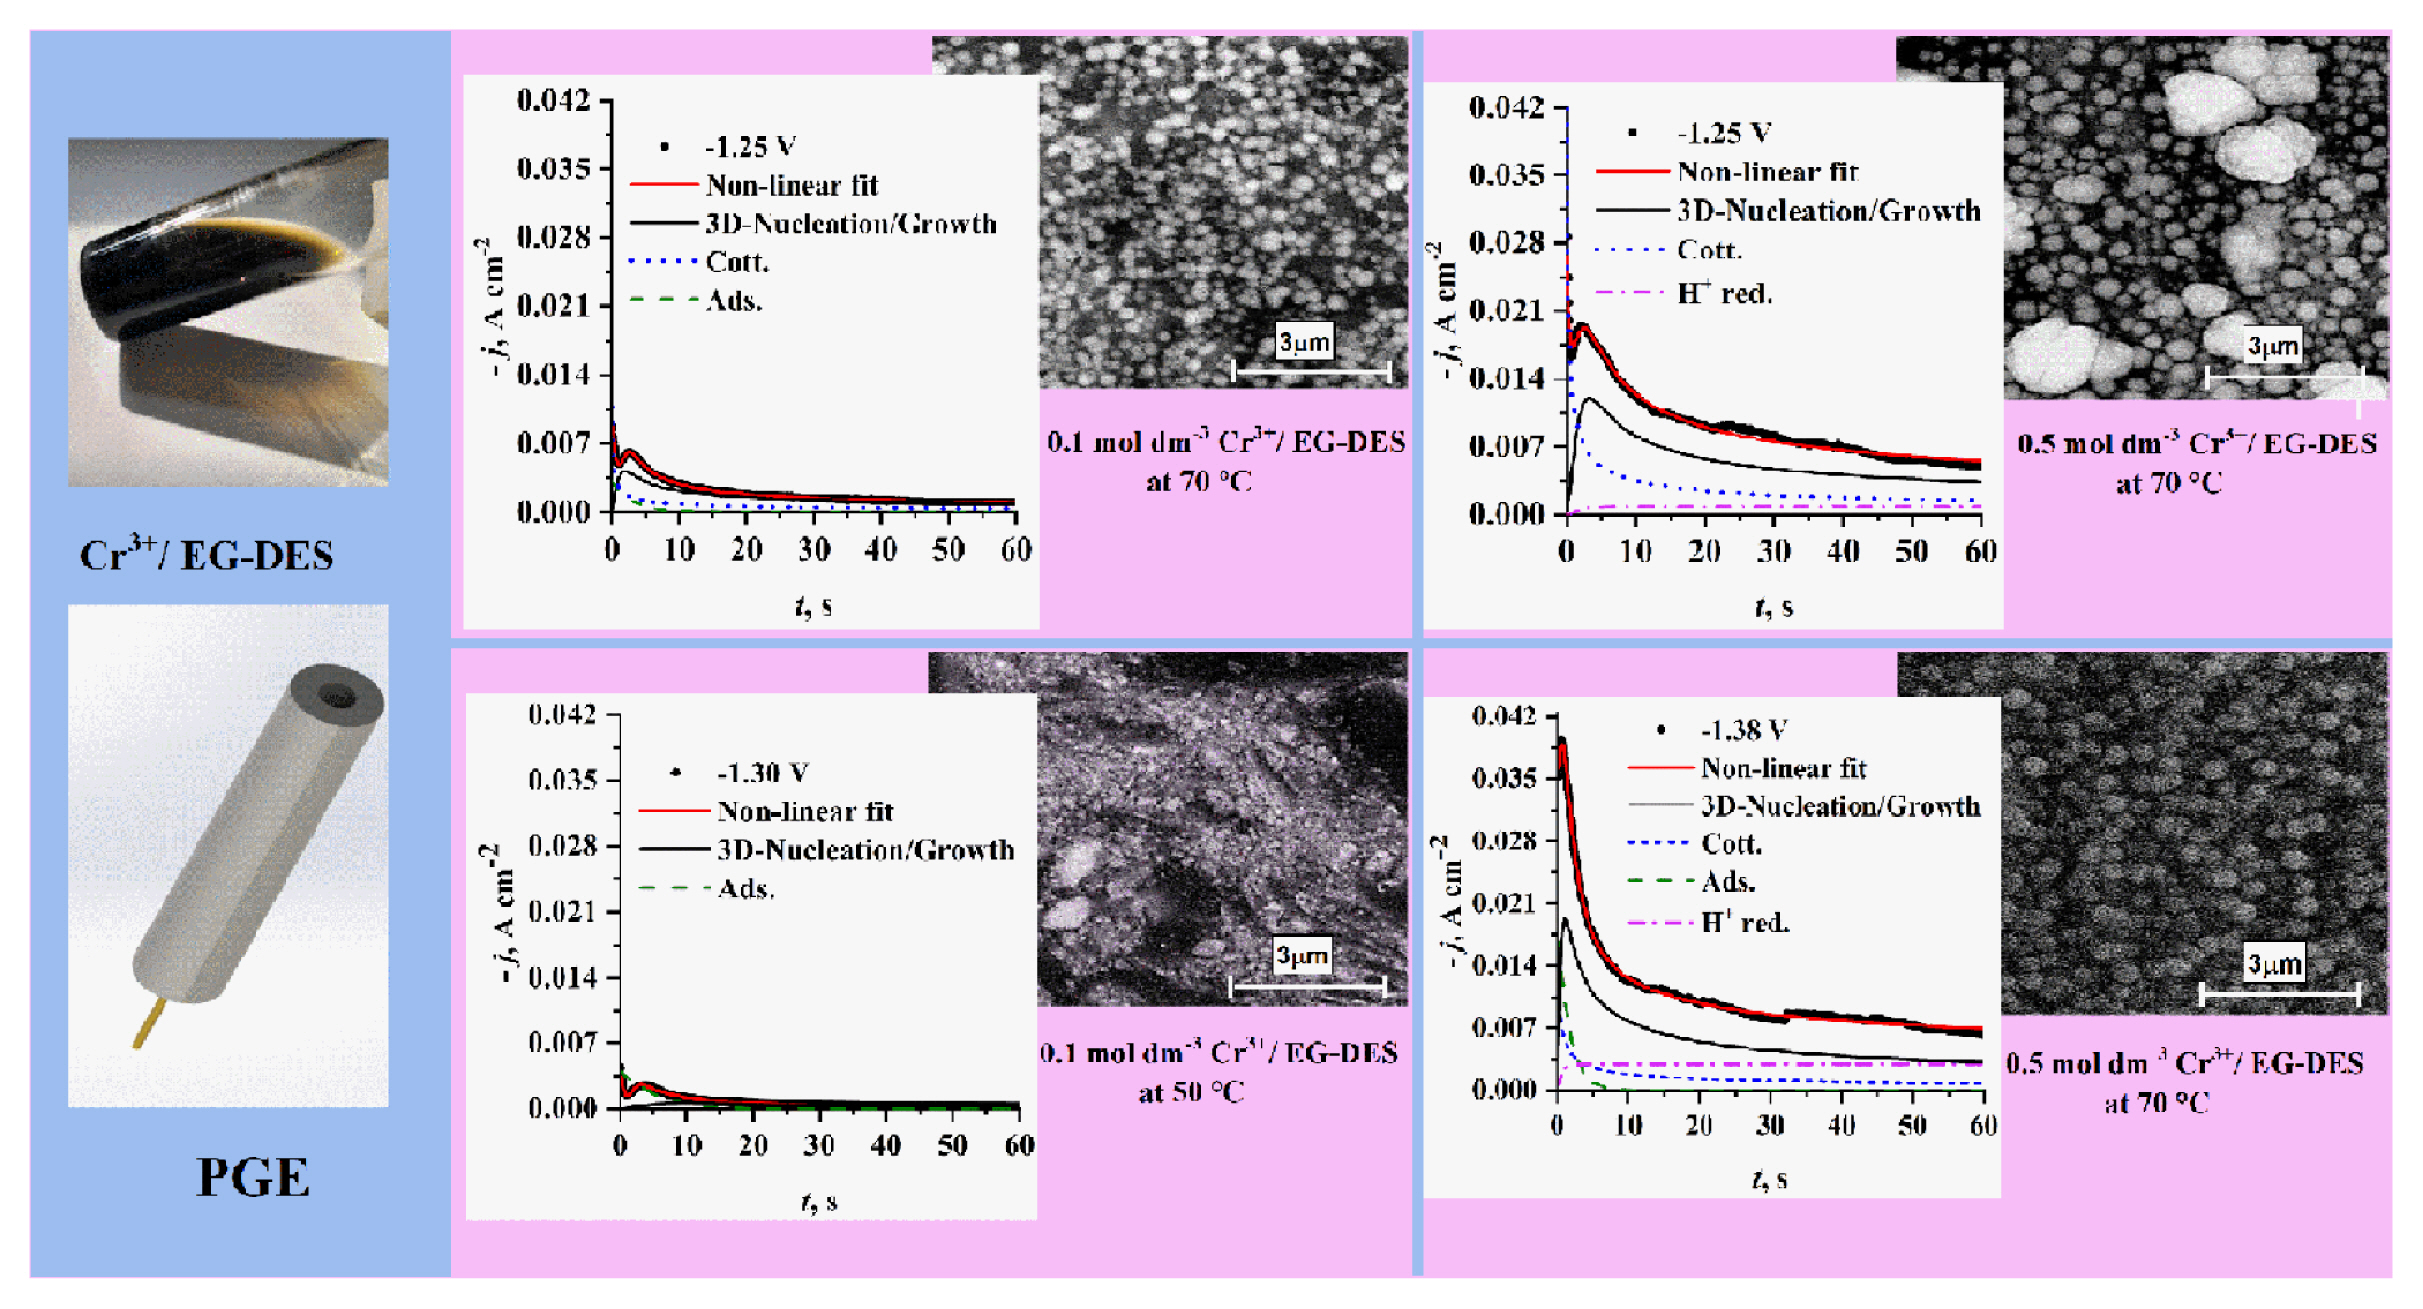
Fig. 9 shows a comparison of experimental current density transients recorded on PGE using 0.1 mol dm−3 Cr3+/EG-DES at the same temperature (70°C) but at different step potentials and with those got by the non-linear fitting of the parametric equation 10 to the experimental data. It is noticed that at any potential used, the resulted curve is well fitted to the experimental current density transient overall the time (t) range. It is worth noting that there is a difference in the individual contributions obtained by the deconvolution of the fitted curve, with the increase of step potential used. At the lowest potential used (−1.25 V) proton reduction contribution jPR (t) is negligible, and then it begins to appear and increase with the rise in potential values. Contributions due to Cotterellian jCott (t) adsorption jAds (t) and 3D-nucleation and growth j3D (t) concurrent processes are observed for all different potentials. The tm3D and jm3D corresponding to the maxima of current density transient contributions of 3D nucleation and growth are shifted to lower and higher values, respectively, with increasing the step potential. The estimated constants of equation 10 by fitting the experimental transients through applying the proposed model 9 are presented in Table 1a. The kinetic parameters, DCr3+ DCr2+, A, N0 and AN0 are also calculated based on these constants. As presented in Table 1a, the average diffusion coefficient of Cr3+ is 5.7 ×10⁻⁷ cm2s−1 and that of Cr2+ is 2.515×10⁻⁷ cm2s−1 which is slightly lower than the results reported by Mejía-Caballero I et al. [26].
It has been found that the values of nucleation kinetic parameters A, N0 and AN0 significantly increase with increasing the applied step potential, indicating that the kinetics of nucleation during Cr electrodeposition is greatly affected by the applied step potential.
3.2.2.2 Effect of hydrogen bond donor used in DES preparation
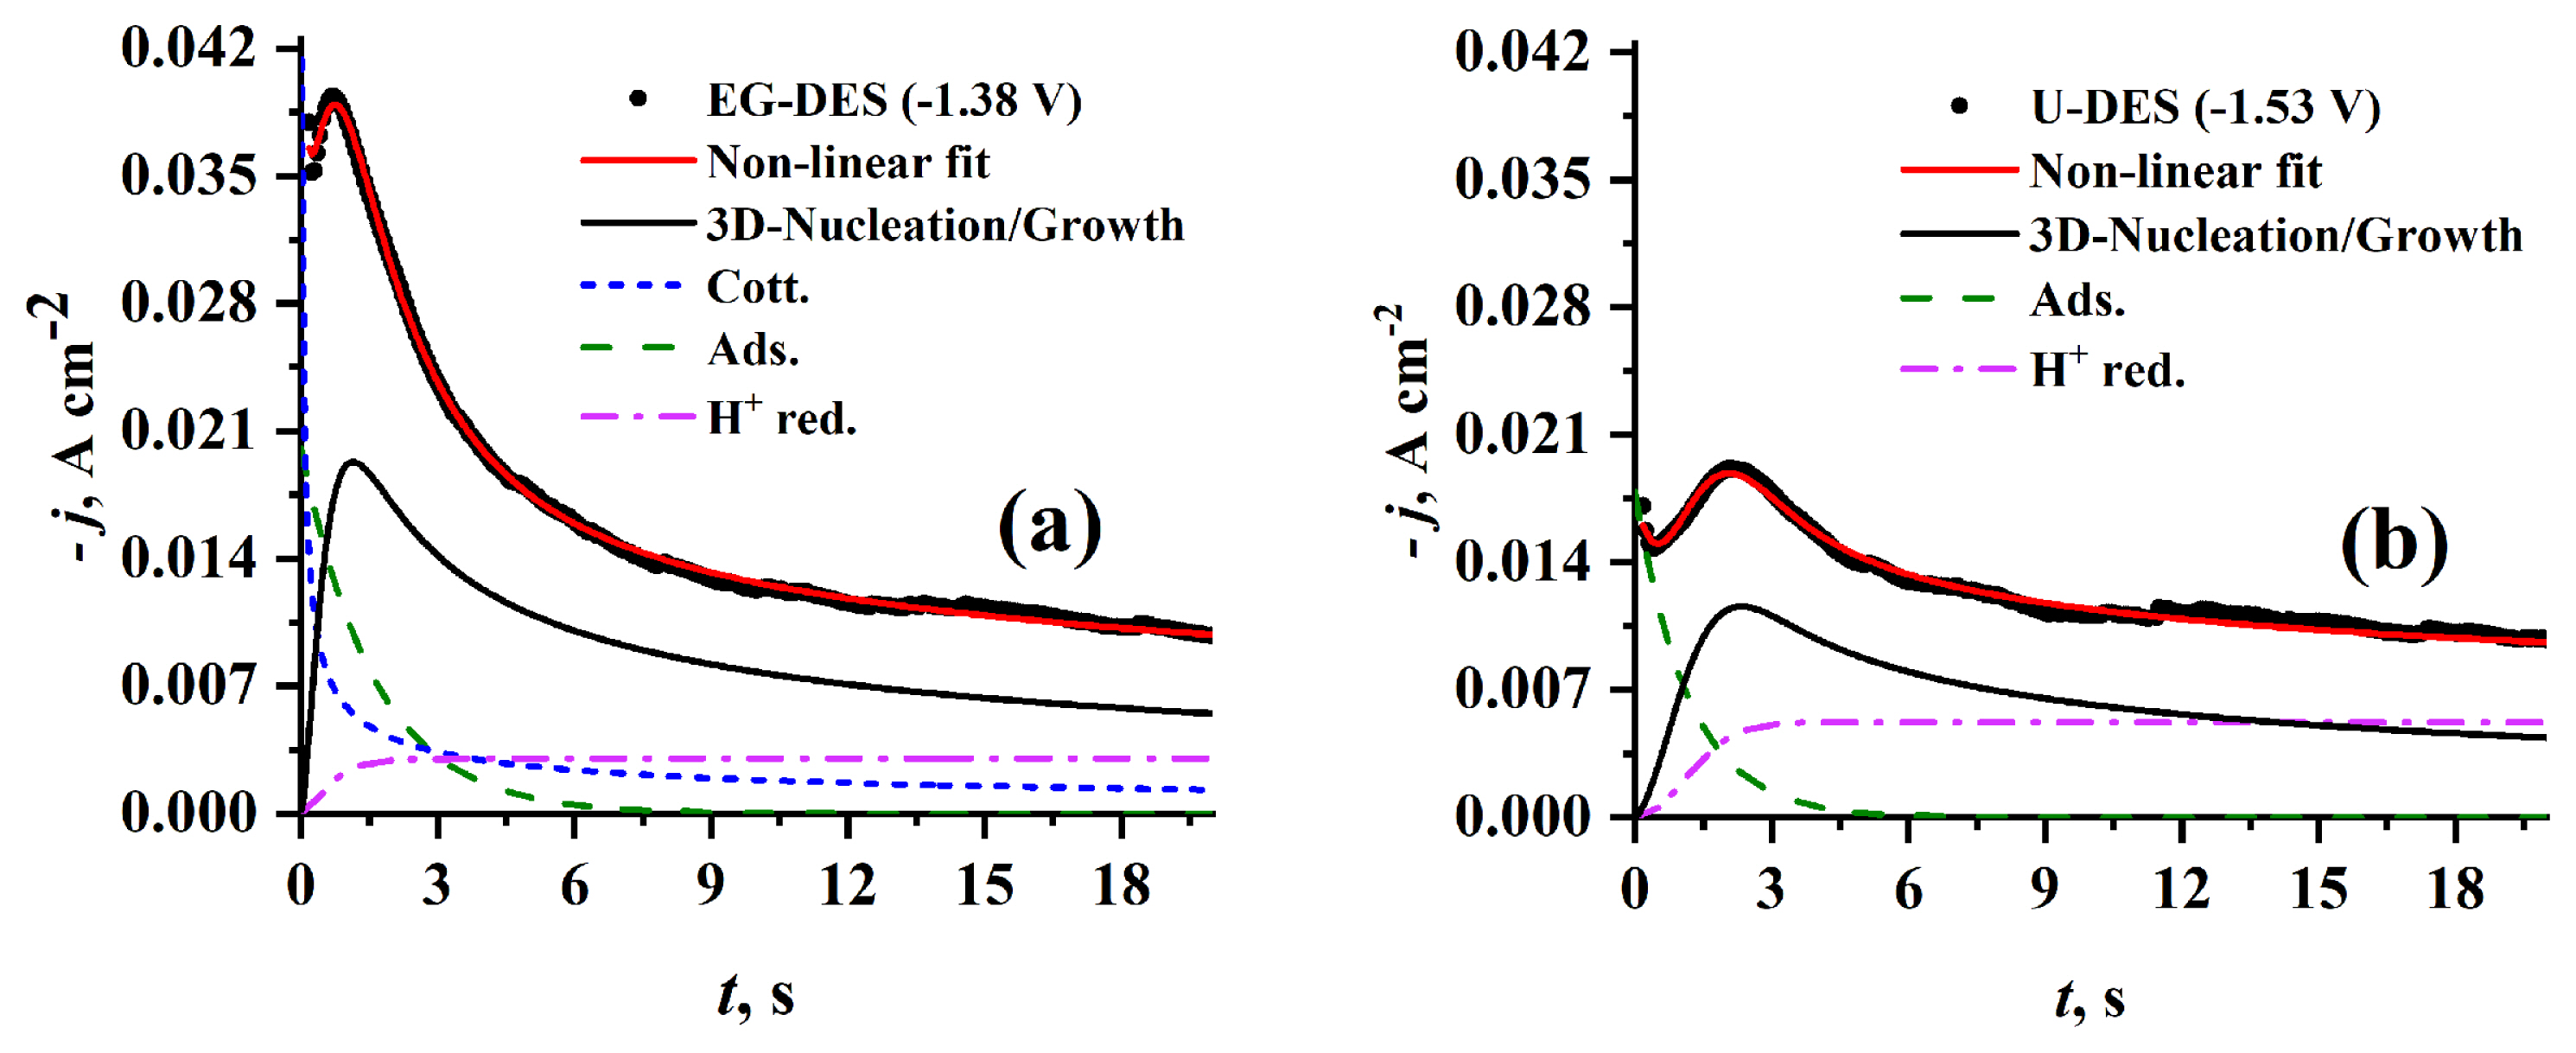
Fig. 10 presents experimental current density transients obtained at the same Cr3+ concentration (0.5 mol dm−3) and the same temperature (70°C) but at different HBDs namely EG (see Fig. 10a) and U (see Fig. 10b) using step potentials (−1.38 and −1.53 V), respectively. One can observe larger tm and lower jm when U is used instead of EG as HBD. This behavior can be attributed to lower nucleation kinetics which are indicated by the kinetic parameters A and AN0 (see Table 1b) obtained from the well-fitted theoretical transients. The greater value of N0 parameter in case of U-HBD than that in case of EG-HBD as presented in Table 1b, can be attributed to the higher potential (−1.53 V) used for recording current transients in case of U-DES than the potential (−1.38 V) used in recording current transients in case of EG-DES. This behavior is agreed with the fact of strong dependence of N0 on applied potential, where the former increases with increasing the later. As shown in Fig. 10, when EG is used as HBD the well-fitted theoretical current density transient are deconvoluted into four curves representing the contributions from Cotterellian process of Cr3+ reduction to Cr2+, adsorption process, proton reduction process and 3D nucleation and growth. While, when U is used as HBD the well-fitted theoretical current density transient is deconvoluted into only three curves representing the contributions from adsorption process, proton reduction process and 3D nucleation and growth. The absence of cotterellian contribution of Cr3+ reduction to Cr2+ can be attributed to passivation of electrode surface by the competing adsorption.
Furthermore, the high viscosity of U-DES compared to EG-DES leads to small concentration gradient and large diffusion layer thickness. This behavior is supported by the broad reduction peak I (see Fig. 4b). The proton reduction contribution in U-DES is noticed to be greater than that of EG-DES. This can be explained by the cathodic shift in the reduction potential (EP) of Cr2+ to Cr0 when U-DES instead of EG-DES is used as shown in Fig. 4, at which a concurrent proton reduction and hydrogen evolution process occurs.
3.2.2.3 Effect of Cr3+ concentration
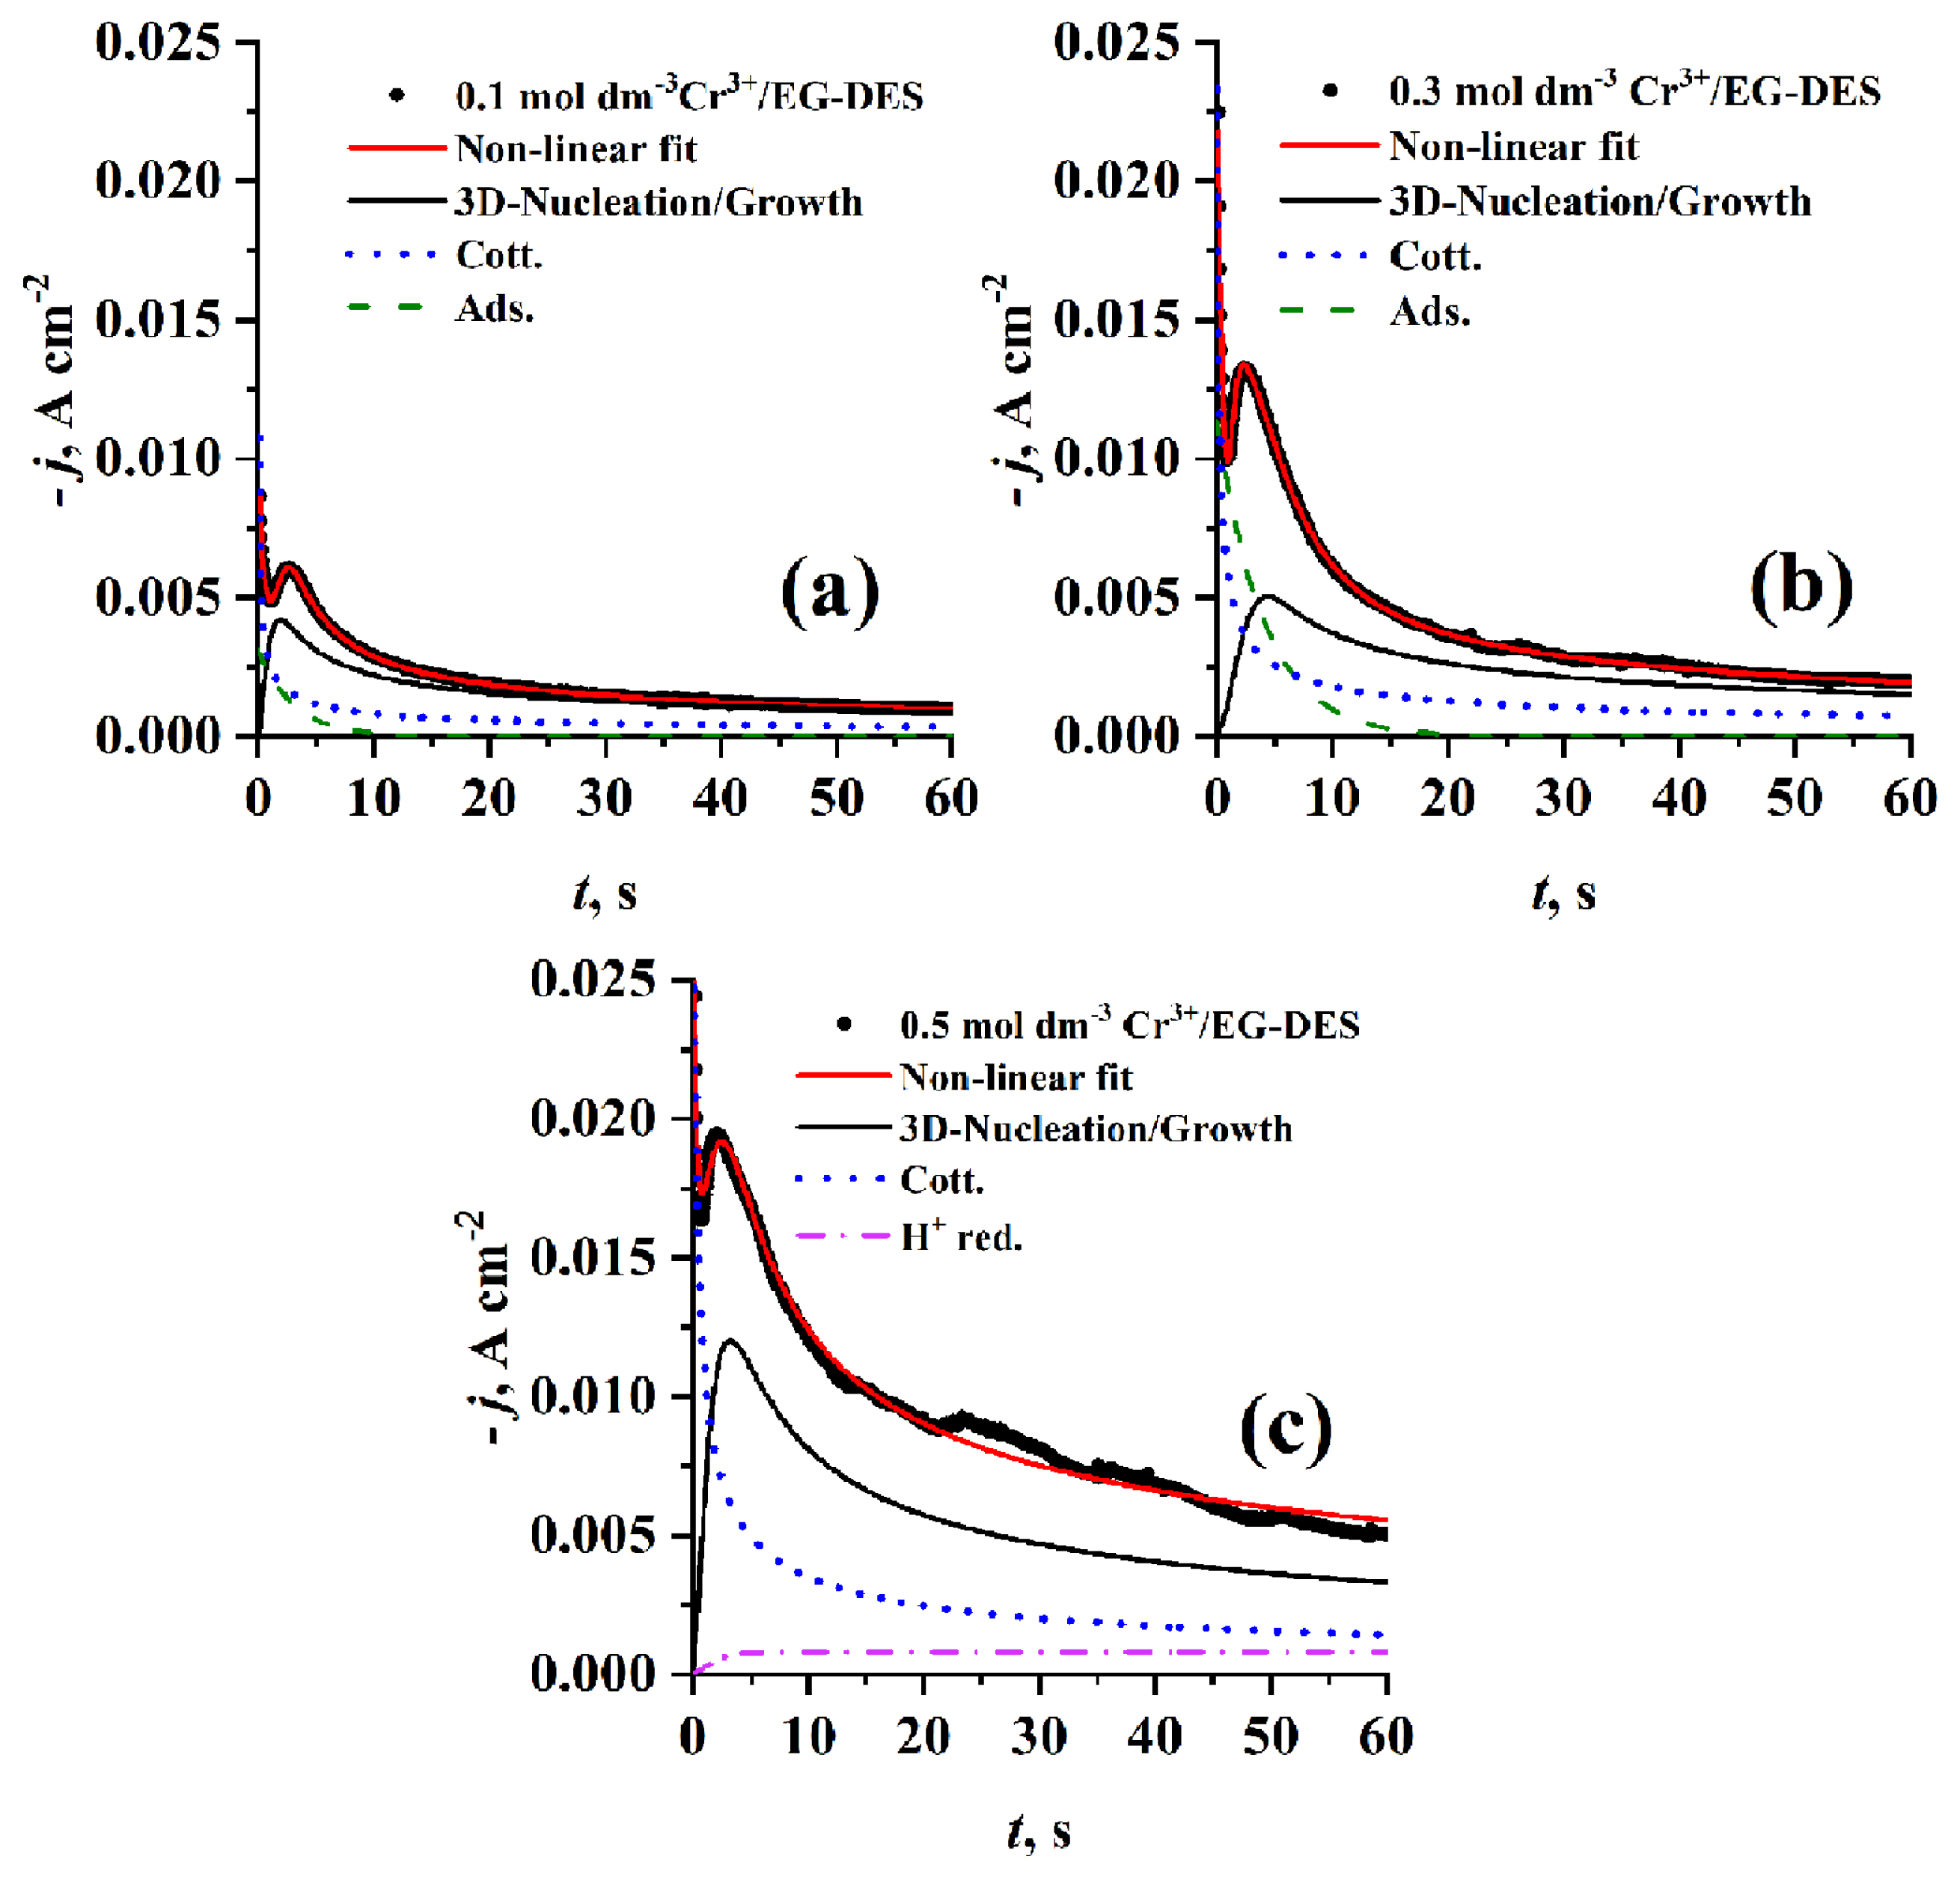
By comparing the experimental current density transients (see Fig. 11) obtained at different concentrations using PGE at the same step potential (−1.25 V) and temperature (70°C), it was observed that however jm increases with increasing concentration, tm has almost the same value. Deconvolution of the well fitted theoretical transients resulted in individual contributions of adsorption process and cotterellian process beside the main 3D nucleation and growth process for Cr3+ concentration of 0.1 and 0.3 mol dm−3, but at 0.5 mol dm−3 the adsorption contribution disappears and instead a proton reduction contribution appears. As introduced in Table 1c A increases while N0 decreases with increasing concentration from 0.1 to 0.3 mol dm−3 due to the increase of electrode surface covered by adsorbed species then the effect is reversed for both A and N0 at 0.5 mol dm−3 which may attributed to the change in contribution percentage of other concurrent processes. But, AN0 markedly decreases with increasing the Cr3+ i.e. the rate of nucleation is decreased with increasing Cr3+ concentration and then tends to stability due to the competition with other processes which have high effect on the exposed active centers.
3.2.2.4 Effect of temperature
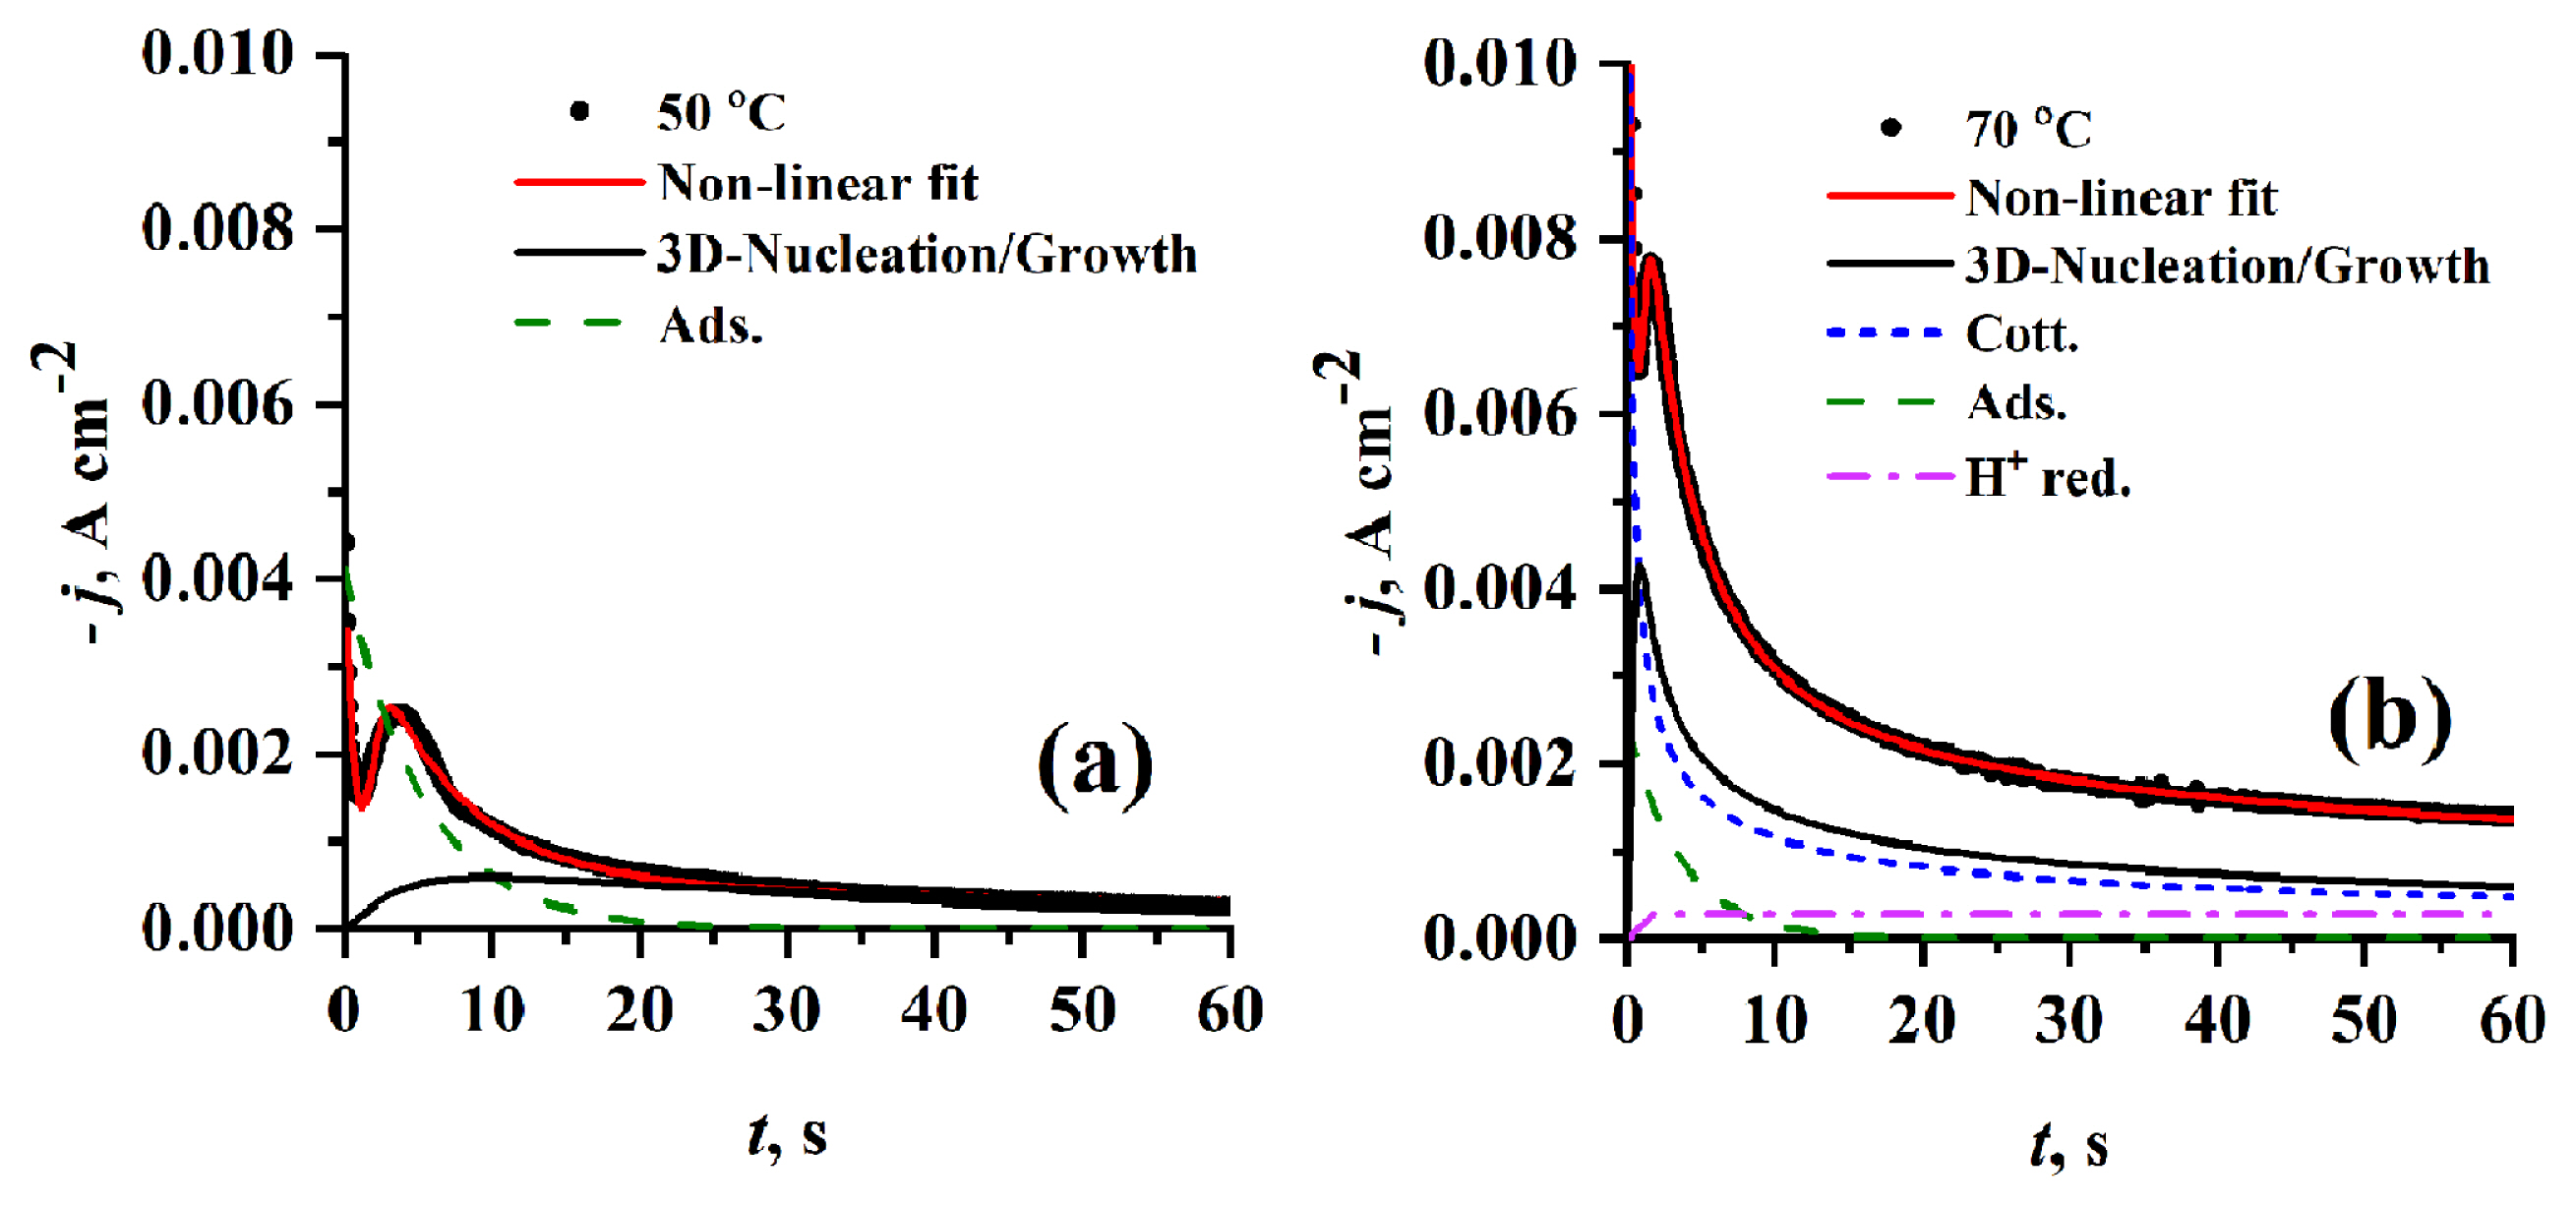
It has been found that the electrolyte temperature has a marked effect on nucleation and growth mechanism as introduced in Fig. 12. tm and jm are shifted towards lower and higher values, respectively. With the temperature rise from 50 to 70°C. At lower temperature (50°C) the theoretical 3D nucleation and growth contribution curve has no characteristic sharp nucleation peak i.e. lower nucleation rate, which is supported by data in Table 1d. It is also noticed that at lower temperatures (50°C) the adsorption process is greatly favored but at high temperature (70°C) the proton reduction and cotterellian process of Cr3+ reduction into Cr2+ are favored over adsorption. As shown in Table 1d A, N0 and AN0 significantly increase with increasing the temperature.
3.3 Morphology and elemental composition
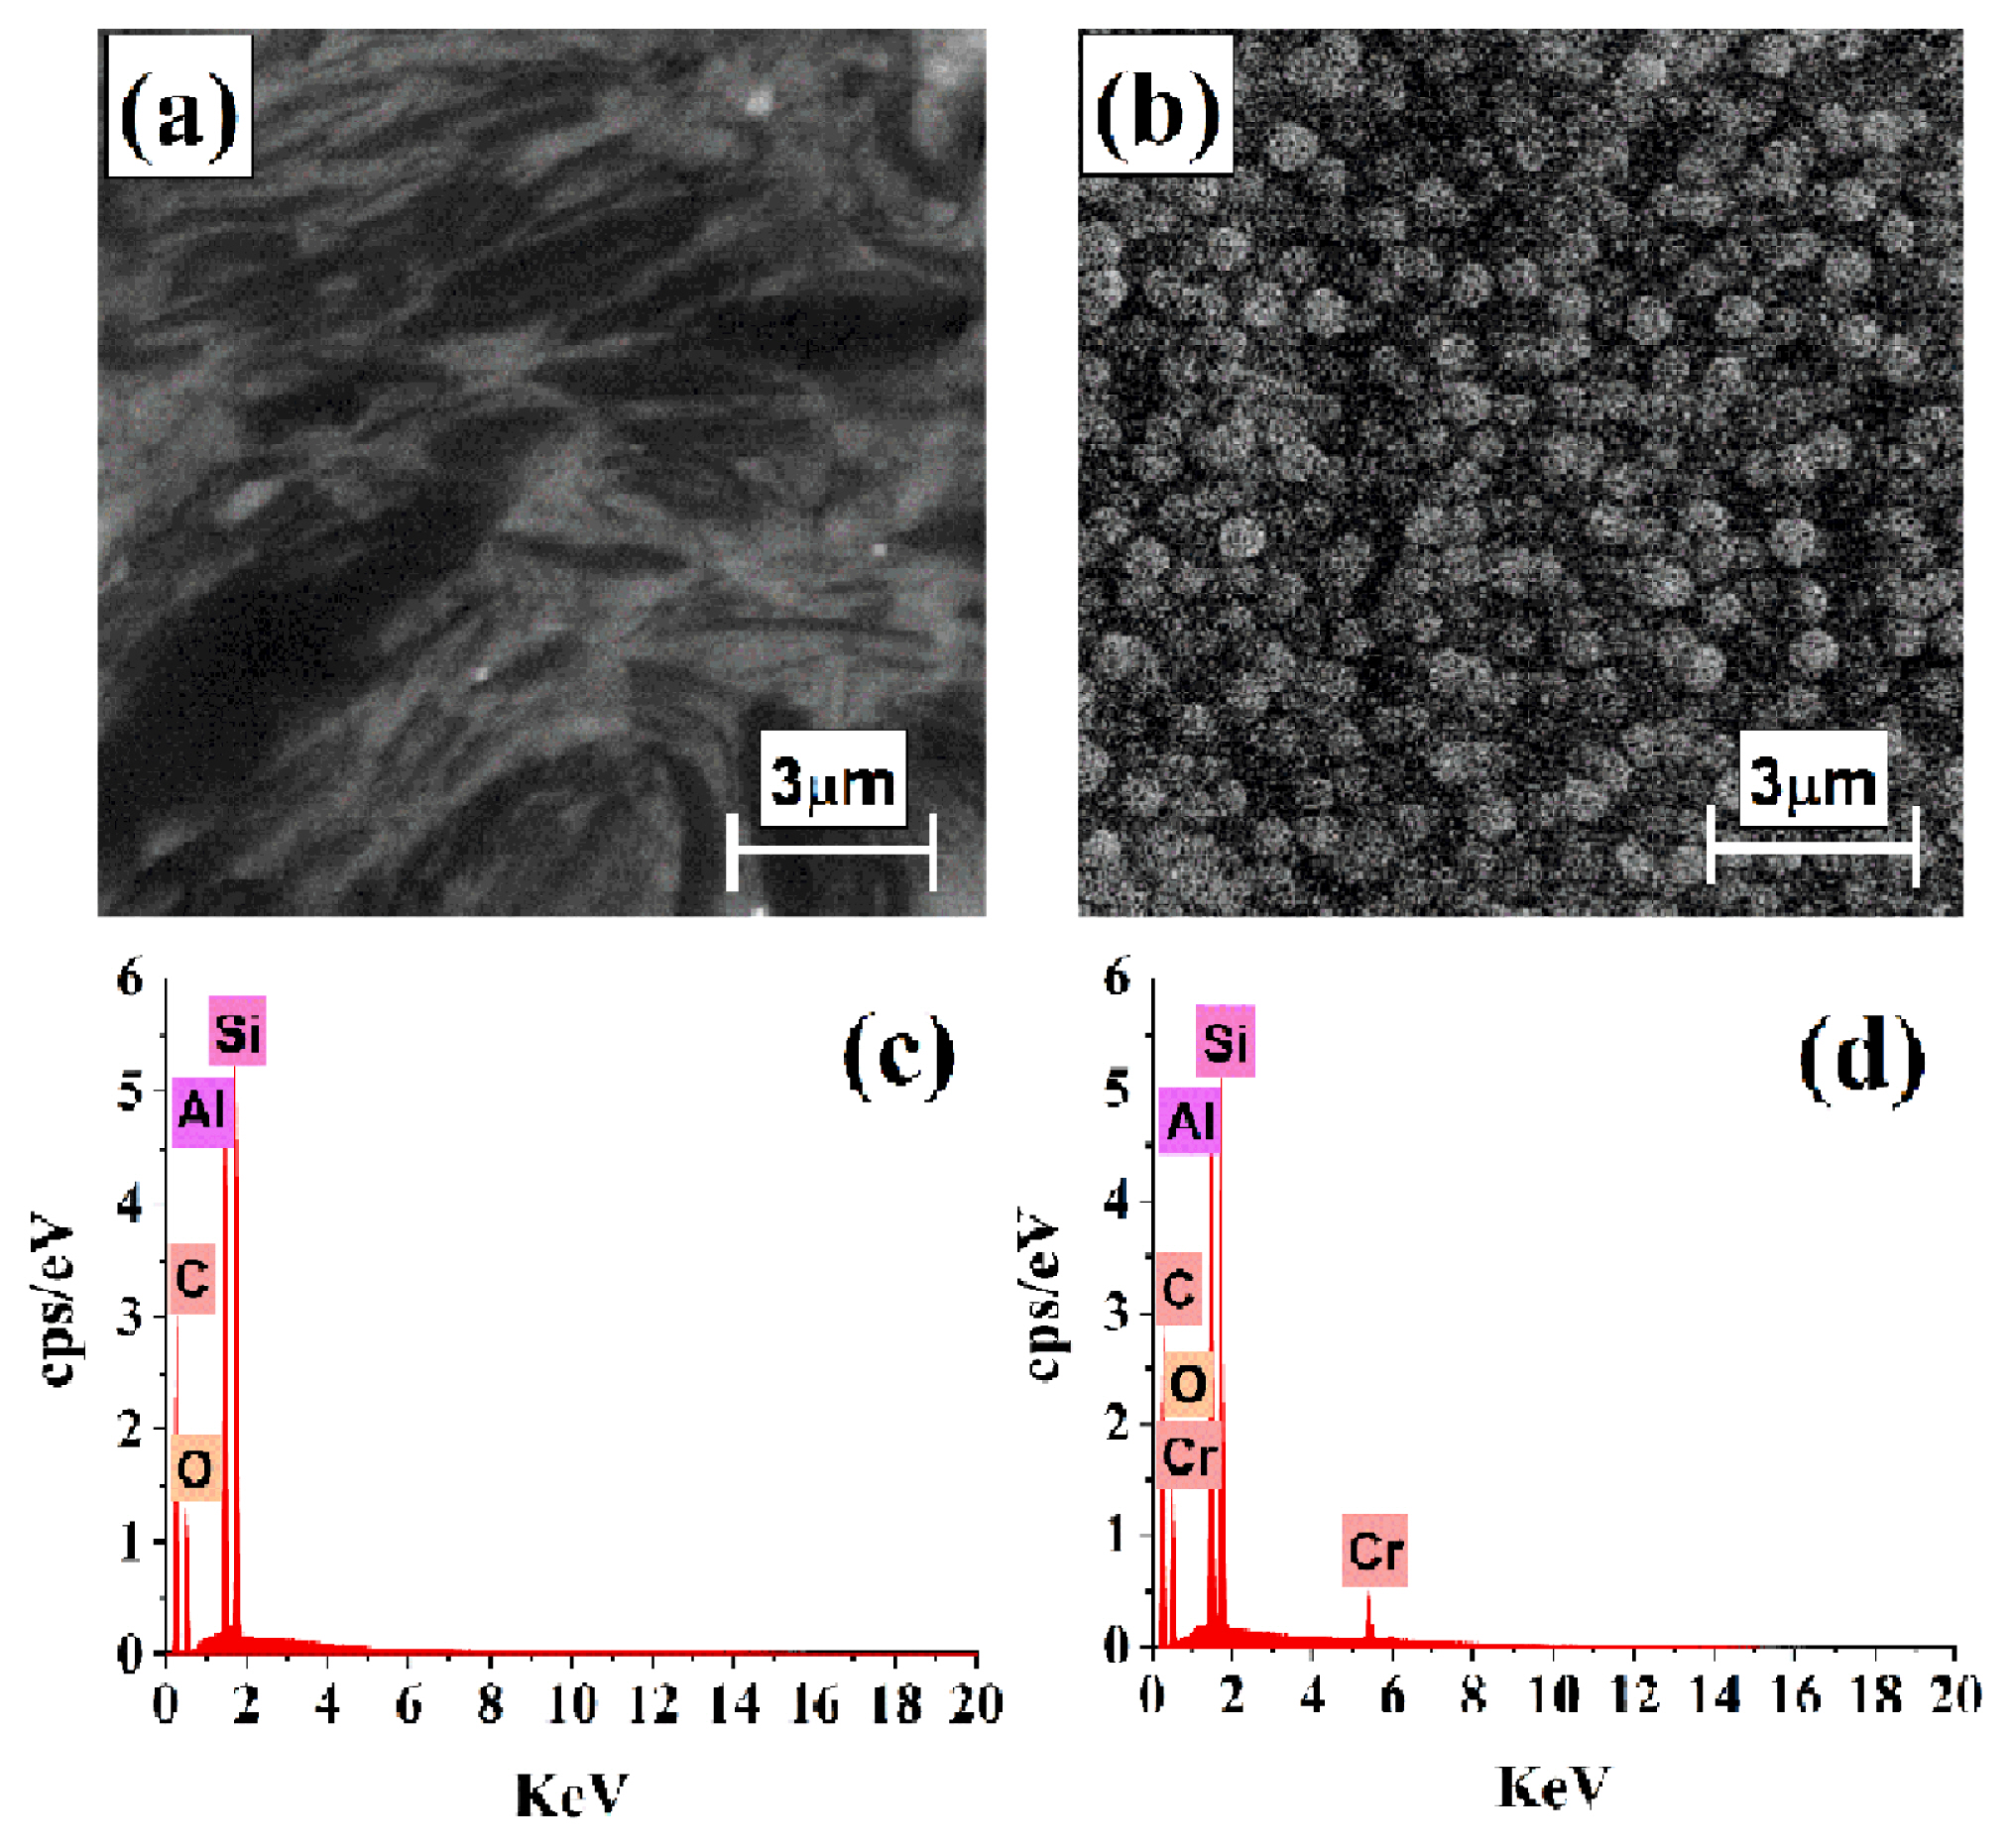
The surface of PGE was investigated by SEM and EDS techniques before and after electrochemical nuclation and growth of Cr from a quiescent Cr3+/EG-DES. The neat PGE surface in Fig. 13a has the well-known layer structure of graphite. EDS analysis proved the aforementioned composition of HB-type of PGE. It is composed of Si, Al and O beside C as major elements (see Fig. 13c). When chronoamperomery experiment executed by stepping the potential of PGE to more negative value (−1.38 V) was done for 60 sec, Cr nuclei were born instantenously and grown in a 3D mode as shown in Fig. 13b. The appearance of characteristic Cr peaks in EDS analysis in Fig. 13d proves that the obtained deposits are mainly Cr. Peaks of Si, Al, O and C elements belonging to the substrate (neat PGE) appear because the layer of Cr nuclei are very thin and X-ray used in EDS is highly penetrating.
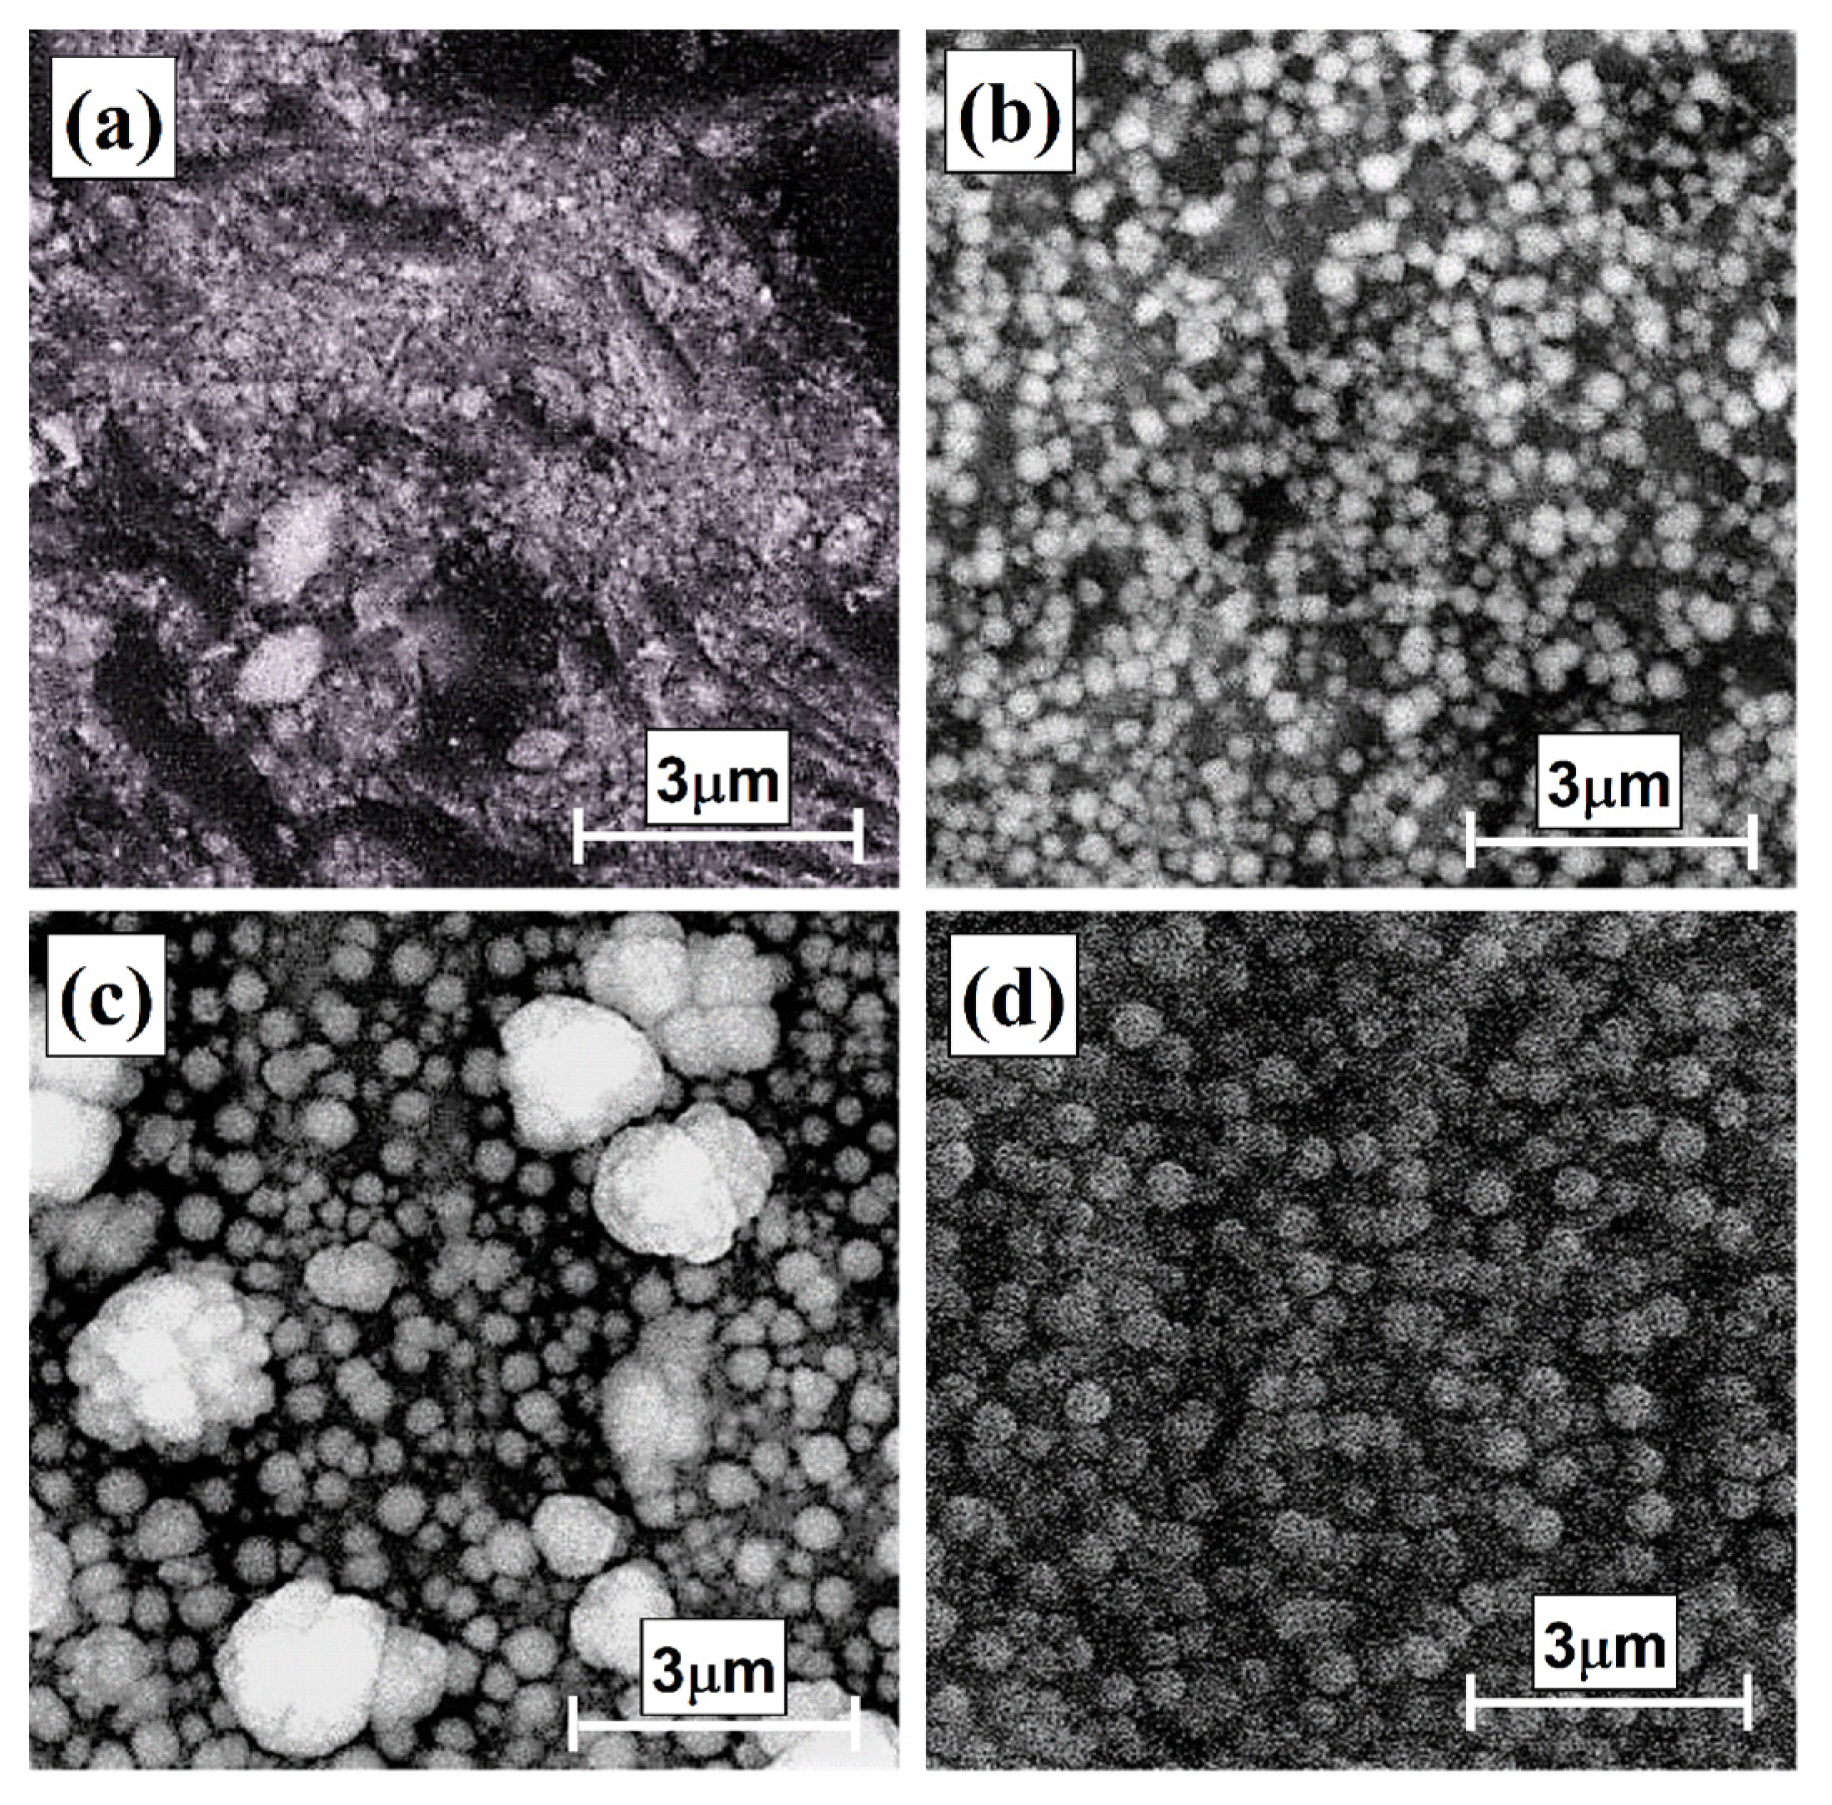
Morphology of Cr nuclei formed in the initial stages of electrodeposition process is crucial to determine nucleation and growth type under different conditions. Effect of temperature on Cr nucleation and growth as shown in Figs. 14a and 14b was obtained at 50°C and 70°C from Cr3+/EG-DES under same other conditions. At low temperature (Fig. 14a), Cr nuclei are of irregular shapes and inhomogeneous size distribution compared to that of greater spherical ones of homogeneous size distribution obtained at higher temperature (Fig. 14b). At lower temperature the deposits are patchy and compact. Further, at higher temperature number density of Cr nuclei is greater. These results agree with the obtained electrochemical and theoretical results where A, N0 and AN0 significantly increase with increasing the temperature.
The effect of Cr3+ concentration on Cr deposits morphology obtained from Cr3+/EG-DES also was studied. In general, one can notice that at higher Cr3+ concentrations (Figs. 14c and 14d) the born Cr nuclei are of greater sizes and lower number density compared to those obtained at lower Cr3+ concentration (Fig. 14b). However, in Fig. 14c, inhomogeneity in nuclei size distribution and presence of some mature nuclei of greater sizes suggesting PN mechanism at lower negative potentials (−1.25 V), almost all nuclei in Fig. 14d are of nearly same size at higher negative potentials (−1.38 V) in accordance with the IN mechanism. Further, the results show formation of more fine nuclei with great number density at high negative potentials. These results are in agreement with the previous electrochemical results where A, N0 and AN0 significantly increase with more negative step potential values. Fig 14 shows that growth of Cr nuclei is following Volmer-Weber mechanism (i.e. 3D-islands are growing in all directions) [30].
4. Conclusions
Cyclic voltammetry study of Cr3+ reduction on PGE showed that it occurs through totally irreversible two-step mechanism. The first step includes reduction of Cr3+ to Cr2+ under diffusion control, while the second step includes reduction of Cr2+ to Cr0 under impure diffusion process accompanied by adsorption where the estimated coverage value was 6.302×10⁻⁹ mol cm−2 for 0.1 mol dm−3 Cr3+/EG-DES at 30°C. CVs showed that Cr3+ reduction mechanism was significantly affected by the electrolyte temperature, Cr3+ concentration and type of HBD used to prepare DES. The appearance of new reduction peak corresponding to reduction of Cr2+ to Cr0 at lower cathodic value range (−1.30 to −1.39 V) when higher concentrations of Cr 3+ are used, suggests the formation of new Cr complexes and exchange of coordination sphere. Further, increasing the temperature resulted in enhancing this new peak and diminishing the old peak appeared at range (−1.7 to −1.4 V) till disappearance. This is implying that Cr3+ species concentration and temperature are important to control the type of Cr complex species present in DESs and consequently the electrochemical behaviour and deposition processes of Cr.
Chronoamperometry was used as valuable tool to get important information about the kinetics of Cr nucleation and growth. Although the dimensionless SH-model was not well fitted with all the resulting experimental current transients due to presence of other parallel processes accompanying Cr nucleation and growth processes, it was used as aqualitative tool to elucidate the Cr nucleation type under different conditions. Nucleation of Cr on PGE using either EG or U as HBD was found to be of 3D-IN type. However, kinetics was better incase of EG-DES than incase of U-DES. Cr nucleation was tending to be instantaneous at higher electrolyte temperature, potential, Cr3+ concentration. It was concluded that experimental current transients of Cr on PGE does not represent nucleation and growth processes only, but they include many contributions from other concomitant processes including the cotterellian one corresponding to first reduction step of Cr3+ to Cr2+, adsorption/desorption equilibrium process, proton reduction process. In combination with the deconvolution method a more general and adequate model was suggested based on Palomar-Pardavé methodology. In this suggested model all possible processes which could accompany the Cr nucleation and growth processes were considered. The contributions from these parallel processes and the kinetics of Cr nucleation were estimated quantitatively under different conditions
Nucleation kinetics of Cr on PGE is mainly controlled by applied potential, temperature, HBD type. The Cr3+ concentration does not mainly affect nucleation process, but may greatly affect growth step. Proton reduction process contribution was enhanced in case of using U-DES, higher potential values, higher Cr3+ concentrations and higher temperatures. For 0.1 mol dm−3 Cr3+/EG-DES at 30°C, the diffusion coefficient for Cr3+ species was estimated via CV and CA techniques and they have been found to be 8.5 ×10⁻⁷ and 5.7 ×10⁻⁷ cm2s−1, respectively. while, the calculated diffusion coefficient of Cr2+ using CA technique has been found to be 2.515×10⁻⁷ cm2s−1. SEM images show that at higher temperature and potential values, Cr nuclei elctrodeposited from EG-DES has high number density of fine spherical nuclei of almost same sizes. Also, nuclei growth is following Volmer-Weber mechanism (i.e.3D-islands are growing in all directions). EDS analysis confirms that high-purity metallic Cr deposits were obtained.
Chronoamperometric technique in combination with the suggested comprehensive theoretical model and the deconvolution method can be a powerful tool for better understanding of the real nucleation and growth processes at the microscopic level which directly control the physical properties of the electrodeposited metal layer. So that, future studies concerning the effect of controlling Cr nucleation and growth on the physical properties of the electrodeposited layer from EG-DES can be suggested.