1. Introduction
Owing to limited resources of fossil fuels with high demand is the major cause for researchers to develop environment-friendly power generating devices [1]. The fuel cell device produces energy without any toxic emissions to the environment and it has a wide variety of applications such as a power source for mobile applications and stationary devices [2,3]. Microfluidic fuel cells (MFCs) are one of the most recently developed and investigated micro fuel cell device which has created interest among the researchers these days for further studies due to its possible potential uses in portable electronic devices. In MFC, the electrodes are fixed in a microchannel with a distance of less than 1 mm without any membrane electrolyte [4,5]. The interface between fuel and oxidant stream act as a membrane electrolyte similar to the conventional proton exchange membrane (PEM) for ion exchange. Thus, the crossover of fuel, ohmic drop, anode dry out and cathode flooding issues related with the membrane could have been eliminated in MFC which also reduces the cost of the MFC compared to PEM based fuel cell, making the MFC technology economically more viable [6,7]. MFCs can also be used for those devices which consume less power like camcorder, cell phone, laptop, glucose sensor, and pacemaker etc. [8].
There are many aliphatic alcohols like methanol [9], ethanol [10], ethylene glycol [11] and glycerol [12] etc. so far tested in MFC. Among all aliphatic alcohols methanol is low molecular weight compound, simplest alcohol without having any C-C bond in its molecular structure and thus, easy to breakdown using the present Pt based electrocatalyst resulting in very high current and power density in comparison to any other alcohols. However, methanol is not primarily alcohol and it is produced via complex route of Fischer-Tropsch reaction [13]. Moreover, it is neuro-toxic and low boiling point alcohol [14]. On the other side, glycerol has drawn much attention at the present time due to its several advantages over methanol like glycerol is non-volatile, non-toxic as well as non-flammable, which makes it favorable to use as eco-friendly fuel in MFC device [15ŌĆō17]. Glycerol also shows comparable energy density (5.0 kwh kgŌłÆ1) to that of methanol (6.1 kwh kgŌłÆ1) [18] and it is a byproduct of biodiesel manufacturing via transesterification of valuable oils [19]. Thus, glycerol was selected as most promising fuel for the present study in a specially design MFC.
It is well known that electrocatalyst plays an important role in the electrochemical dissociation of any anode fuels. Most of the electrooxidation of alcohols have been focused on platinum or palladium based electrocatalysts, probably due to their excellent electrocatalytic behavior [20]. Thorough literature survey shows that palladium is the most active metal electrocatalyst for glycerol electrooxidation over any other noble metal electrocatalyst [21,22]. The electrooxidation of alcohols reactions are carried out either in acidic or alkaline medium [23]. However, palladium-based electrocatalysts are most active for electrooxidation of alcohols in alkaline medium [24]. It should be noted that glycerol molecule has more than two C-C bond in the molecular structure which is quiet difficult breakdown using present Pt based electrocatalysts. Although, Pd is suitable and electrochemically active electrocatalyst, Pd based electrocatalysts are not available commercially in the open market. Thus, there is a necessity to synthesis bimetallic Pd-M (where M is Pt, Au, Ni etc.) electrocatalysts to improve the electrooxidation kinetics and activity via a suitable reaction pathway which allows to split the C-C bond of glycerol at low activation energy [25].
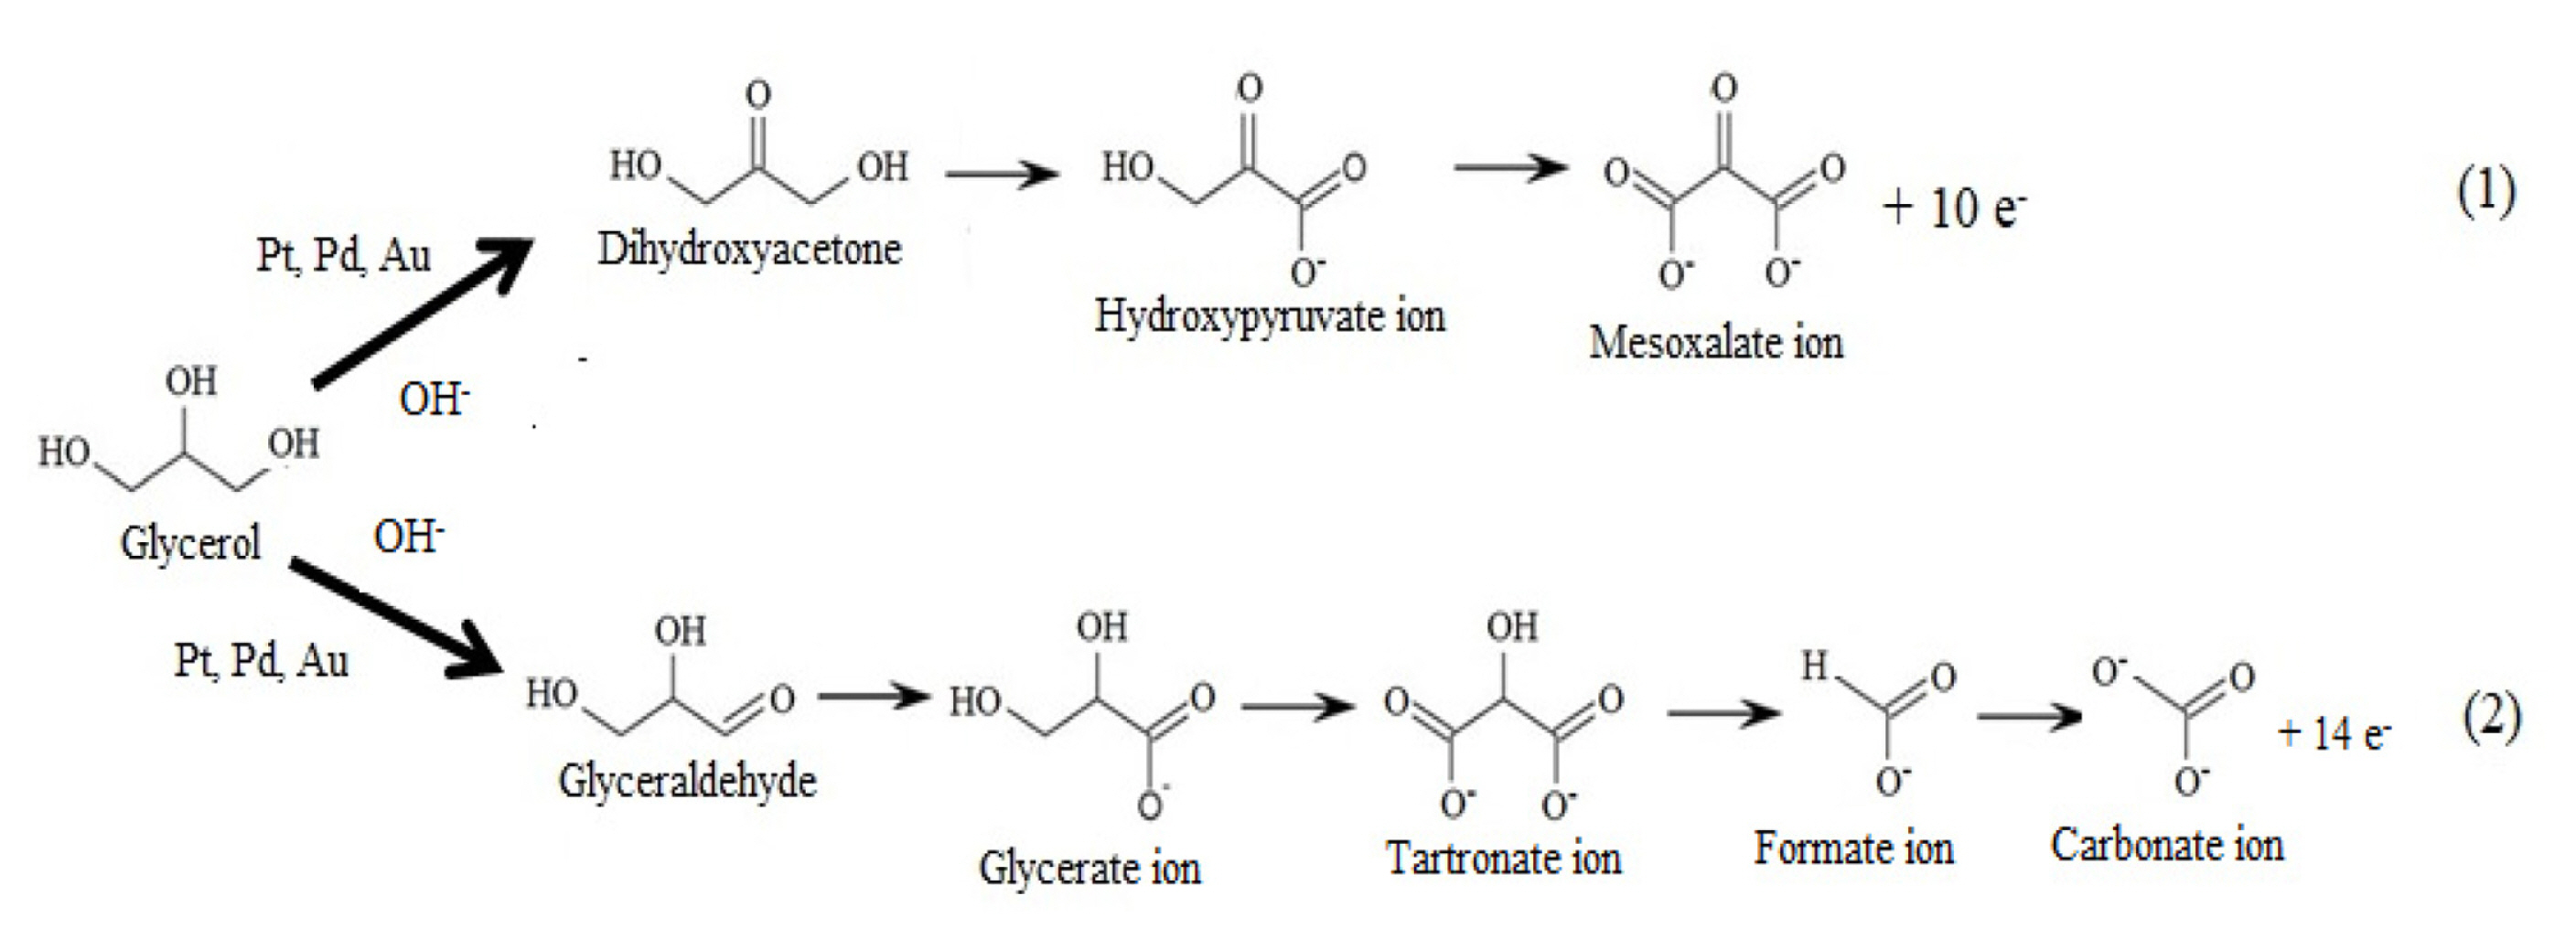
As per the available literature, electrooxidation of glycerol on Pd/C, Pt/C and Au/C proceeds through a complex series of reactions as shown in Fig. 1 [21]. In the following reaction scheme it shows that many intermediate species are formed during the electrooxidation glycerol such as glyceraldehyde, tartronate ion, glycerate ion, hydroxypyruvate ion, and mesoxalate ion etc (Fig. 1). The partial electrooxidation of glycerol gives 10 electrons and forms mesoxalate, whereas complete electrooxidation gives 14 electrons and forms carbonate (Eqs. (1) and (2)).
So far many research work have been carried out and reported on glycerol electrooxidation using Pd/C [12,26,27], Pd/MWCNT [12], Pt/C [28], PtRu/C [29], Au/C [30], PdAu/C [31], PdNi/C [32], CuPd/C [33] and CuPt/C [34] electrocatalyst either in half cell or in single cell configuration. Mostly, the electrocatalysts were synthesized to study the performance of glycerol electrooxidation, except a few researchers who have reported the use of commercial electrocatalyst in their study [12,33]. Thus, synthesis of most active and suitable electrocatalysts is essential for glycerol electrooxidation in the single MFC and stack as well. It should also be noted that very scanty literature is available on MFC using glycerol as a fuel.
Dector et al. [12] used synthesized Pd/C and Pd/MWCNT as anode electrocatalyst and commercial Pt/C as cathode electrocatalyst for electrooxidation of glycerol in a Y-shaped MFC. The length of the MFC channel was 45 mm and 1 mm depth with an active electrode area of 0.45 cm2. The electrocatalyst ink was deposited on the wall of the channel by spray technique. The maximum power density of 0.70 mW/cm2 and 0.51 mW/cm2 was obtained using Pd/MWCNT and Pd/C electrocatalysts, respectively. Maya et al. [33] synthesized CuPt/C and CuPd/C anode electrocatalyst for electrooxidation of crude and analytical glycerol in air breathing nanofluidic fuel cell. The electrocatalyst CuPd/C and Pt/C of 1 mg was impregnated in carbon nanofoam (Marketech International, Inc) as substrate for each anode and cathode, respectively. The dimension of the electrode in the cell was 20 mm, 3 mm width and 0.1 mm height with active area of 0.02 cm2. The maximum power density using CuPd/C was 17.6 mW/cm2 and 17.4 mW/cm2 for crude and analytical glycerol, respectively. Similarly, CuPt/C produced maximum power density of 21.8 mW/cm2 and 23 mW/cm2 for crude and analytical glycerol at 25┬░C, respectively. Yi Jie et al. [35] worked on glycerol based membraneless fuel Cell using gold plated surface as anode and MnO2 as cathode. The OCV of 0.704 V and maximum power density of 1.27 mW/cm2 (at 0.2 V) was achieved using 1.4 M glycerol and 8.0 M KOH. Gomes et al. [36] studied glycerol electrooxidation in cyclic voltammetry using Au and Pt nanoparticles supported with glassy carbon in alkaline medium. They observed that glassy carbon as support material enhances the activity of glycerol electrooxidation due to the formation of active oxygenated species on the glassy carbon which oxidizes the glycerol residue on electrocatalytic surface. Sim├Ąes et al. [21] synthesized carbon supported Pt, Pd and Au electrocatalyst and bimetallic PdAu and PdNi with different compositions for oxidation of glycerol in alkaline medium. The onset potential of all PdxMe1ŌłÆx/C (M= metal) electrocatalysts shows lower than Au/C and Pd/C, but greater than Pt/C. For bimetallic electrocatalysts, the order of activity at low potentials is: Pd0.3Au0.7/C>Pd0.5Au0.5/C>Pd0.5Ni0.5/C. There are several advantages of using air breathing cathode in MFC e.g., cathode electrocatalysts sites get exposed to the higher concentration of oxygen via air breathing cathode in comparison to that of oxygen dissolved in aqueous solution due to low solubility of oxygen. It also improves the mass transfer performance as the diffusivity of oxygen from atmospheric air is 10,000 times higher diffusivity than oxygen in the dissolved solution [33].
The literature review shows that no detailed study on T-shape air breathing microfluidic fuel cell using glycerol as fuel on synthesized Pd-Pt/C has been reported till date. In this context, present work is focused on the synthesis of Pd/C and Pd-Pt/C bimetallic anode electrocatalyst for glycerol electrooxidation in an air-breathing microfluidic fuel cell. The low cost anode electrocatalyst, Pd(20 wt. %)/C and Pd-Pt/C in different weight ratios of Pd to Pt i.e., 16:4, 10:10, 4:16 were synthesized and characterized for the electrooxidation of glycerol. The important cell parameters like type of electrocatalyst, glycerol concentration, electrolyte concentration, electrocatalyst loading and cell temperature were studied to obtain maximum cell performance in terms of current density and power density. The influencing dimensionless numbers such as Reynolds number, Peclet number and Schmidt number are also calculated to confirm the laminar flow behaviour of the anolyte and catholyte streams in the T-shape MFC device. The cyclic voltammetry (CV) experiments were also carried out to check the electrochemical activity of the synthesized electrocatalyst for glycerol electrooxidation and validate with single MFC results.
2. Experimental
2.1 Materials
The metal precursors for palladium and platinum were PdCl2 (Alfa Aesar, USA) and H2PtCl6.6H2O (Alfa Aesar, USA), respectively. Acetylene black carbon (SBET = 75 m2/g, Alfa Aesar, USA) was used as support material for the synthesis of electrocatalyst. The commercial Pt (40 wt. %)/CHSA (Alfa Aesar, USA) was used to prepare the cathode electrode in MFC. Nafion® D-520 (5 wt. %, Alfa Aesar, USA) solution and polytetrafluoroethylene (PTFE) dispersion (60 wt. %, Sigma Aldrich, USA) were used as ionomer and binder, respectively. Isopropanol (Fisher Scientific, India) was used as a solvent. A gas diffusion layer (GDL), TGP-H-60, was procured from (Alfa Aesar, USA) to prepare electrodes for half-cell and MFC studies. A thin layer of Nickel mesh was used as a current collector. Glycerol (Fisher Scientific, India) was used as fuel and KOH as the electrolyte. The ambient oxygen diffuses through the air breathing cathode act as an oxidant.
2.2 Method
2.2.1 Electrocatalyst synthesis
Carbon supported Pd (20% by wt.) and bi-metallic Pd-Pt with varying Pd to Pt weight ratio of 16:4, 10:10, 4:16 electrocatalysts with low metal loading of 20 wt. % on 80 wt. % acetylene black support material were prepared by the impregnation reduction method as reported by Tayal et al. (2011) [37]. The calculated amount of metal precursors PdCl2 and H2PtCl6.6H2O were dissolved in isopropanol separately by ultrasonic treatment for 30 min. After sonication, acetylene black carbon support material preheated at 110┬░C was poured into the warm precursor solution and continuously stirred till smooth and thick slurry was formed. Then it was kept overnight for drying at room temperature. Further, the slurry was dried at 110┬░C and ground into powder by an agate mortar. The ground electrocatalyst powder was reduced in a continuous hydrogen supply tube furnace at 120┬░C for 2 hours and further it was cooled to room temperature to get the final form of the synthesized electrocatalyst Pd(20 wt.%)/C, Pd-Pt (16 wt. %: 4 wt. %)/C, Pd-Pt (10 wt. %: 10 wt. %)/C and Pd-Pt (4 wt. %: 16 wt. %)/C, respectively. The synthesized Pd (20 wt.%)/C, Pd-Pt (16 wt. %: 4 wt. %)/C, Pd-Pt (10 wt. %: 10 wt. %)/C and Pd-Pt (4 wt. %: 16 wt. %)/C were designated as Pd/C, Pd-Pt(16:4)/C, Pd-Pt (10:10)/C and Pd-Pt (4:16)/C, respectively.
2.2.2 Physical characterization of electrocatalyst
The analysis of surface morphology and surface concentration of synthesized electrocatalysts were done using SEM-EDX (Nova Nano SEM 450, FEI Company of USA (S.E.A.) PTE, LTD). The crystallographic analysis was done using X-ray diffraction (XRD, Rigaku Ultima IV diffractometer) within the range of 20┬░ŌĆō90┬░ diffraction angle and scan rate 10┬░ minŌłÆ1 with Cu-K╬▒ irradiation. The particle size of electrocatalyst was analyzed by TEM (Tecnai G2 20 TWIN, FEI Company of USA (S.E.A.) PTE, LTD).
2.2.3 Electrode preparation
The synthesized electrocatalysts were used for anode preparation, and the commercial Pt (40 wt. %)/CHSA was used as the cathode electrocatalyst. The electrocatalyst slurry was made by taking the desired amount of electrocatalyst, acetylene black carbon with a few drops of Nafion® and PTFE dispersion in isopropanol as a solvent followed by ultrasonication for 30 min. Hydrophilic Nafion® ionomer used in electrocatalyst slurry enhances the ionic conductivity and PTFE dispersion restricts the flooding on the electrode surface. The anode and cathode electrocatalyst ink composition were similar, except the electrocatalyst used at anode and cathode as mentioned above. It should be noted that anode was made of three layers and cathode of four layers composite, respectively. To make three layers anode, the GDL and Ni-mesh was hot pressed at a temperature of 70°C and 10 kg/cm2 of pressure for 1 min followed by anode electrocatalyst ink painting using a paint brush uniformly over the GDL. The electrocatalyst layer was dried in an oven for 1 h at a temperature of 80°C. The dried three layer anode was sintered at a temperature of 280°C for 3 h. The four layer cathode was made by hot pressing using same condition as used for anode keeping the Ni-mesh in between GDL and an air diffusion PTFE layer. The cathode electrocatalyst ink was painted over the GDL followed by drying and sintering the four layers composite at same conditions of anode manufacturing.
2.3 Experimental setup
2.3.1 Half-cell studies
Half-cell study of the synthesized electrocatalysts was performed for glycerol electrooxidation using cyclic voltammetry (PGSTAT 204, Autolab Netherland) in a three electrode cell assembly as described in our previous study elsewhere [38]. The GDL strip was used as a working electrode applying electrocatalyst slurry at one end of the GDL and the other end was attached to PGSTAT circuit, Pt wire was used as counter electrode and Ag/AgCl as reference electrode. The anode electrocatalyst used were synthesized Pd/C and Pd-Pt/C of varying ratios i.e., 16:4, 10:10, 4:16 of 1 mg/cm2 of each electrocatalysts. The fuel used was 1 M glycerol mixed with 1 M KOH solution.
2.3.2 Single-cell studies
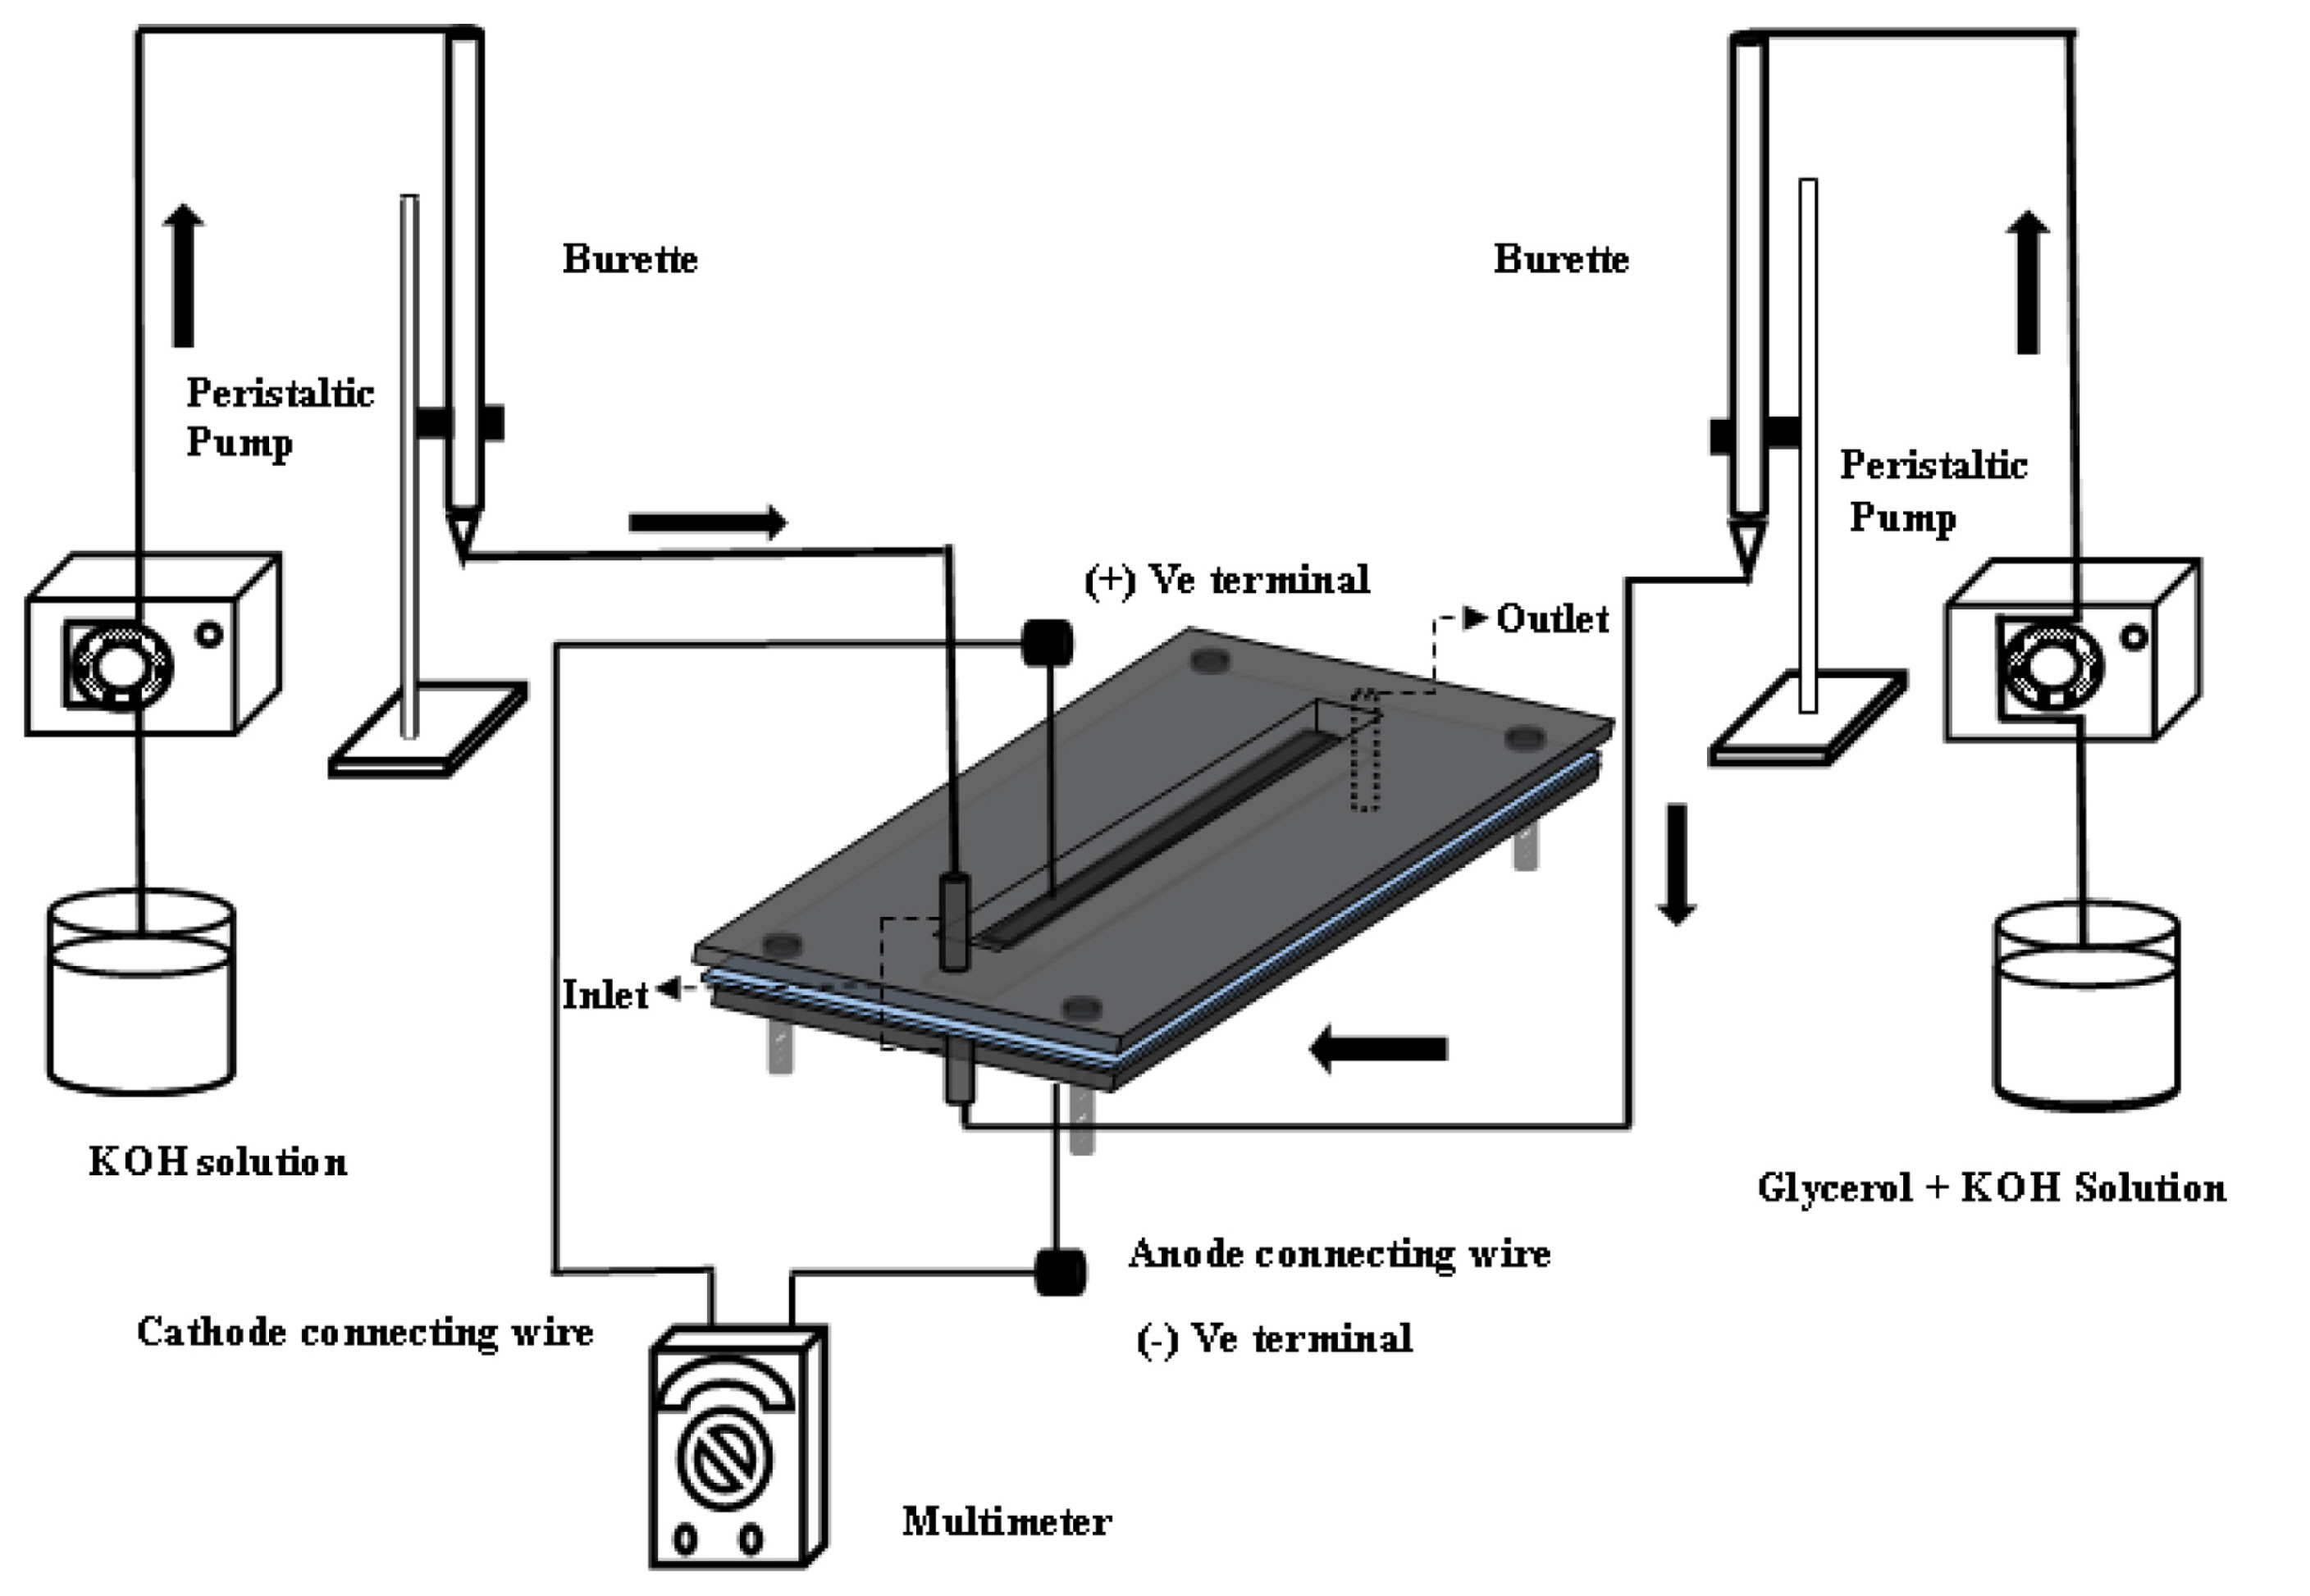
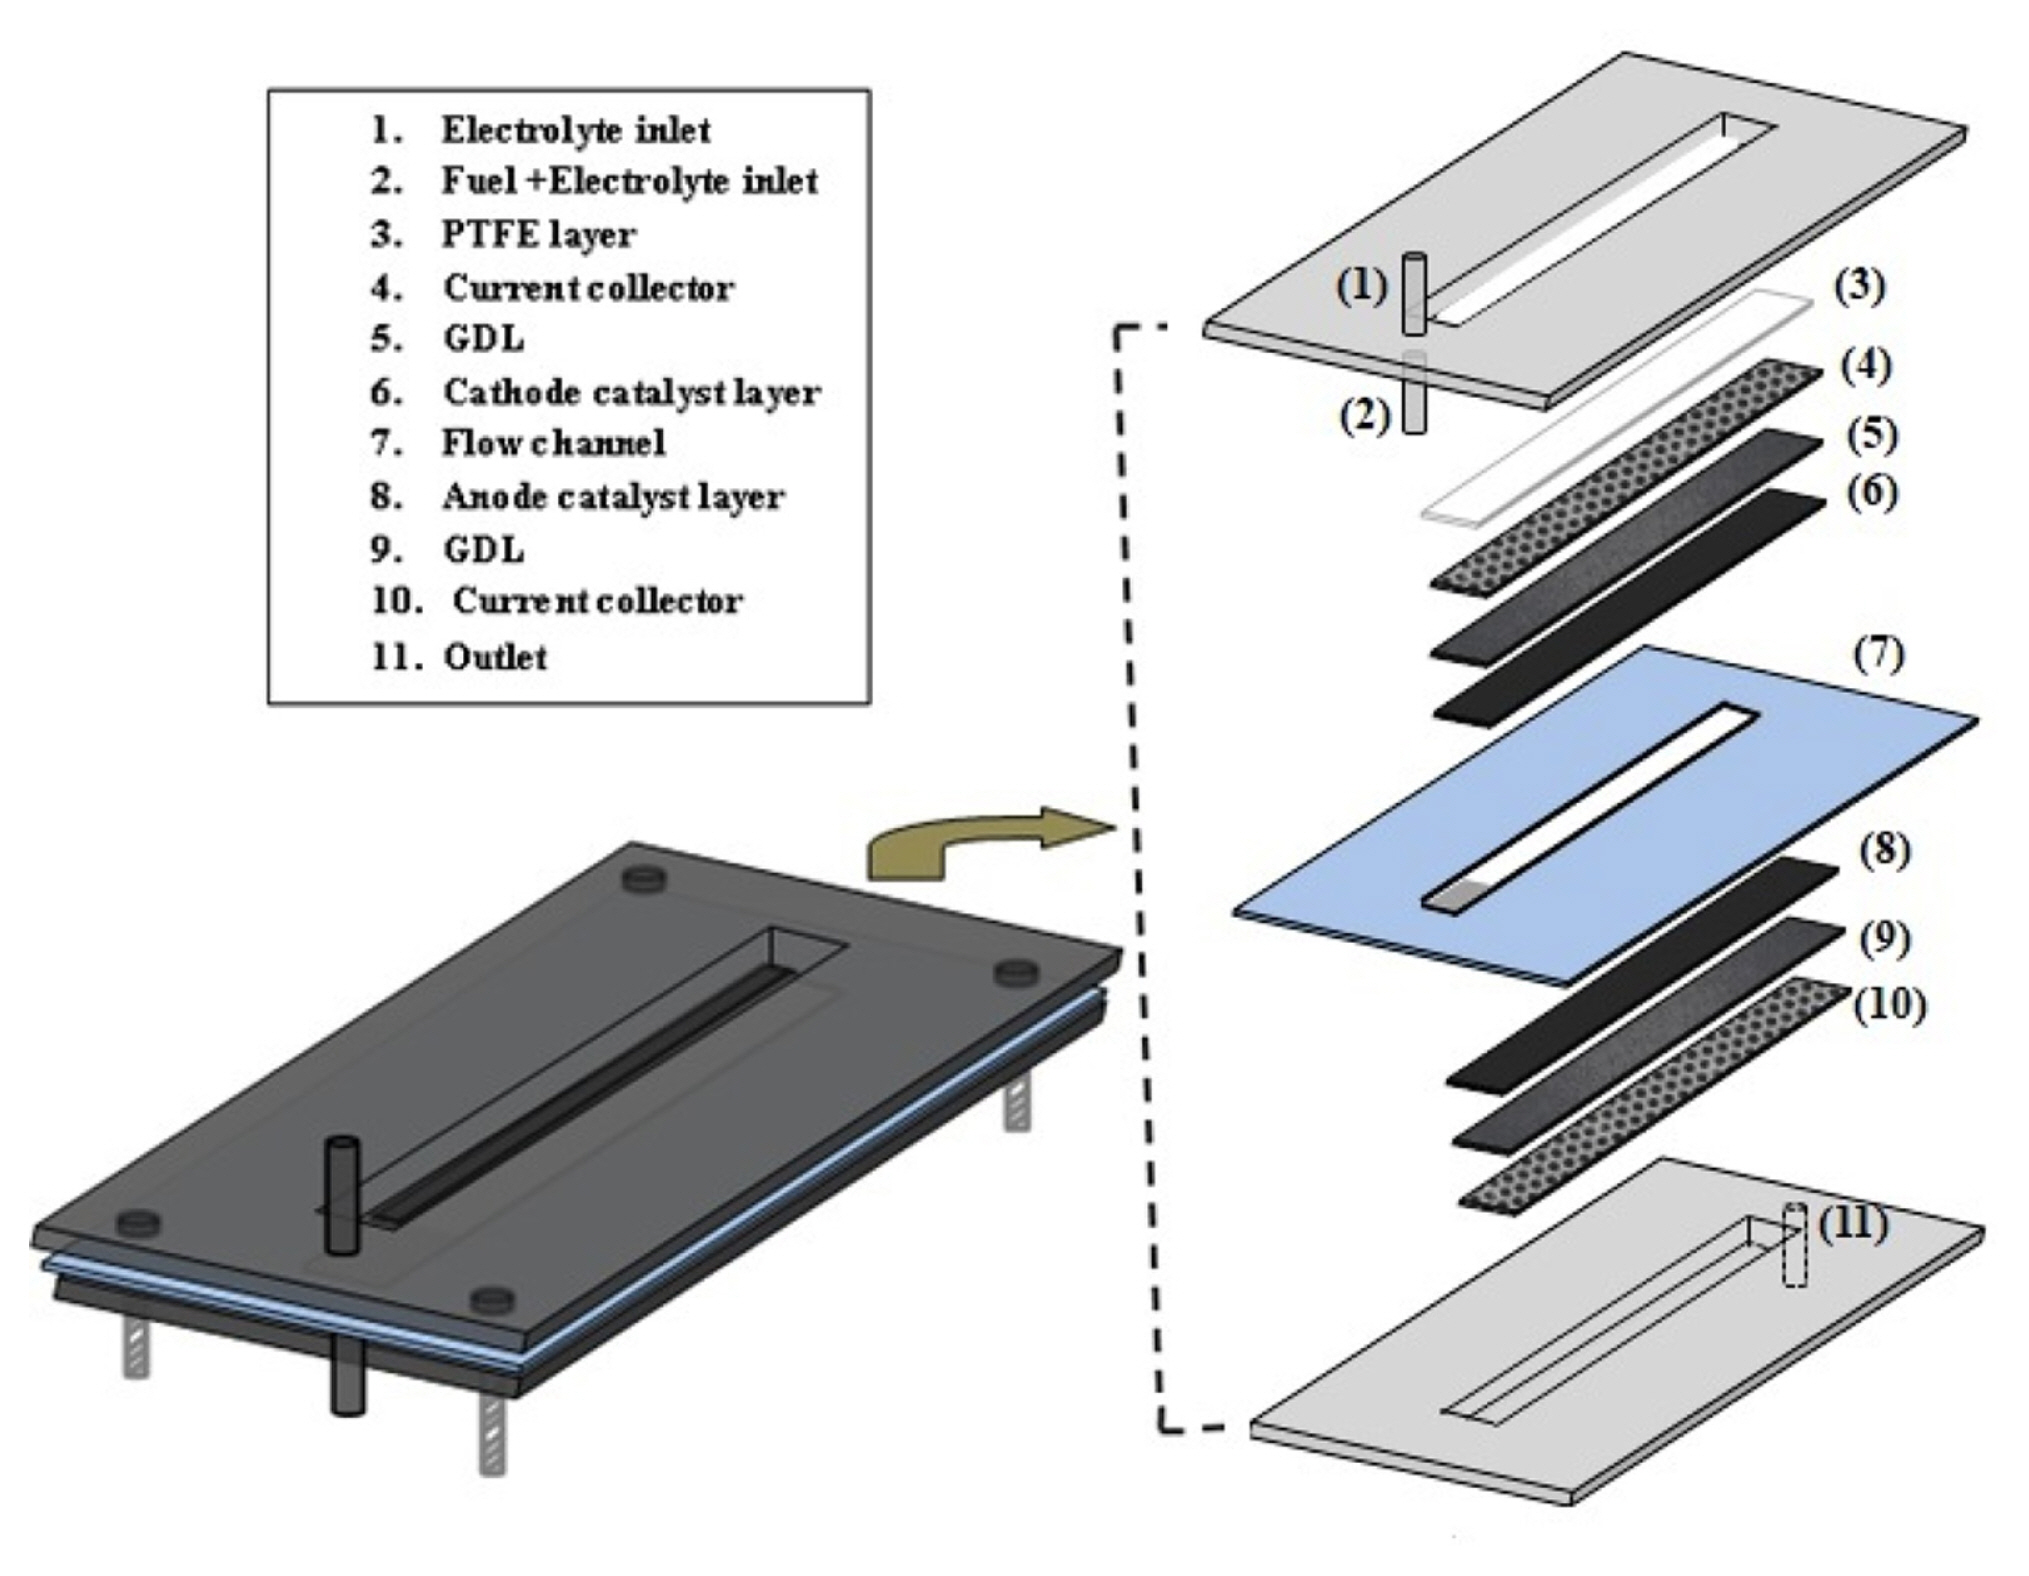
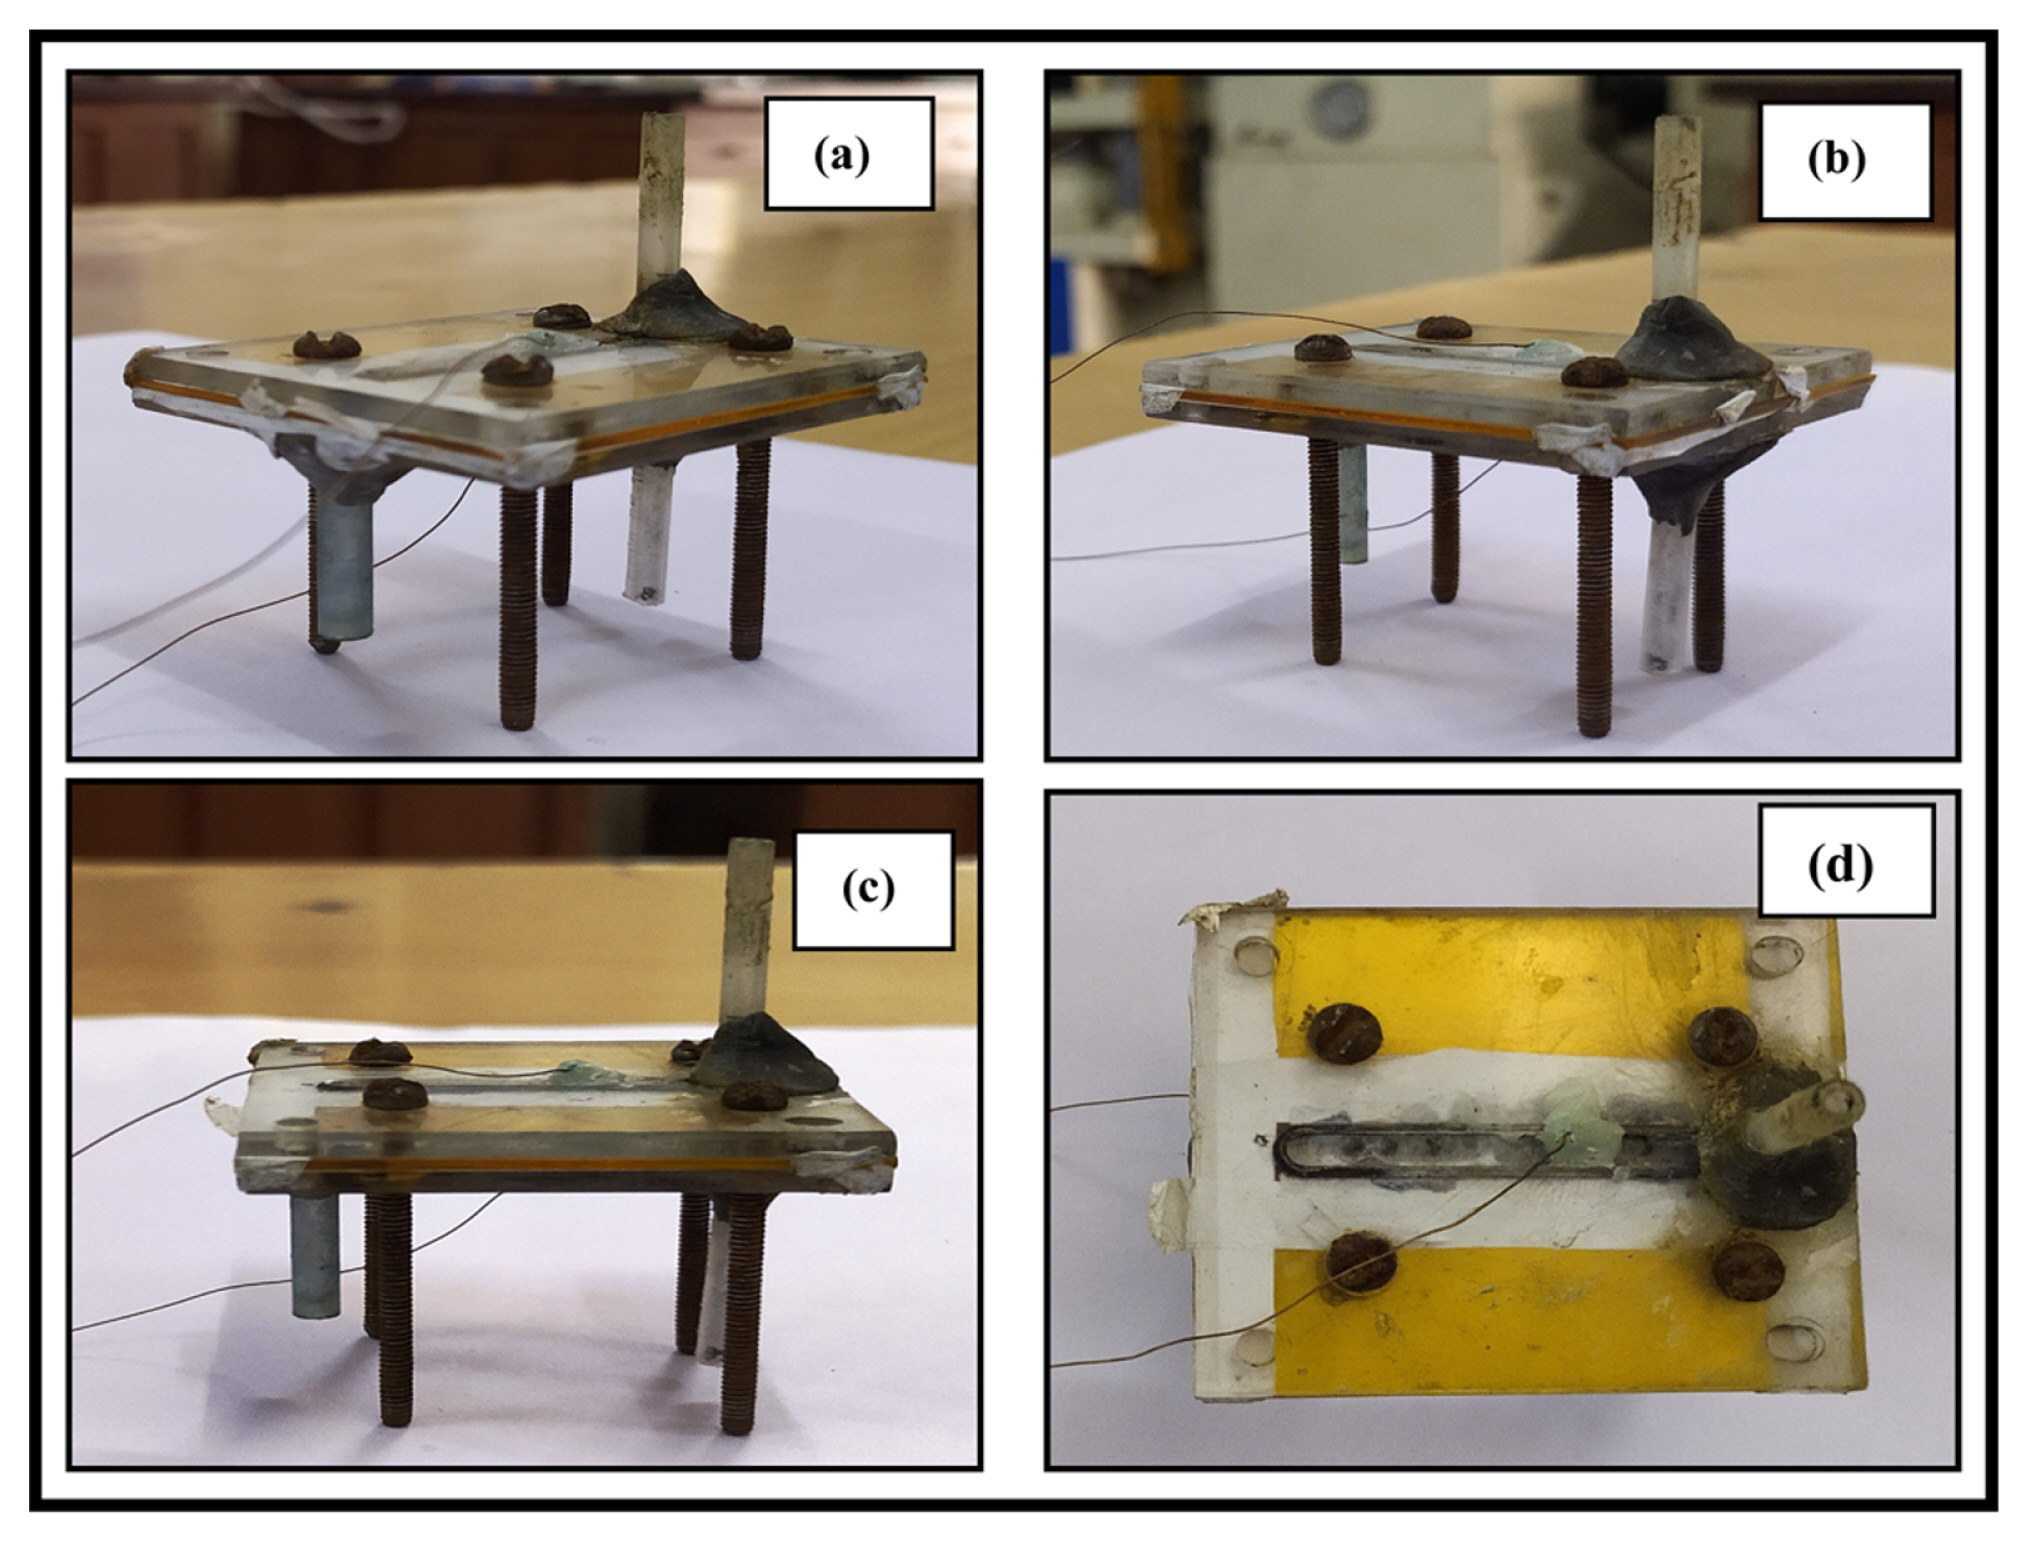
Single cell test was performed in a T-shape air breathing MFC setup as shown in Fig. 2a. As reported in literature, the orientation is one of the problem in Y-shaped MFC which can operate only in the horizontal direction. The change in orientation can alter the interface between two streams that can be eliminated by changing the MFC design from Y-shape to T-shape MFC. Moreover, installation of air breathing cathode is easier in T-shape design than in Y-shape design. Leakage problem in Y-shape air breathing MFC is also more due to installation of air breathing cathode at the side of horizontal microchannel. On the other side, air breathing cathode is fixed to the window made of perspex sheet as shown in Fig. 2b. Thus, the T-shape air breathing MFC was fabricated in the laboratory (IIT-BHU), India. The PMMA/perspex (poly methyl methacrylate) sheets purchased from Varanasi (India) was used to fabricate the T-shaped air breathing MFC. The grooves and microchannel was made using CNC mill production with simulator (EMCO Concept MILL 260, EMCO Maier) machine at IIT (BHU). The T-shaped MFC device was made by the assembly of perspex sheet layers/windows as shown in Fig. 2b. The upper and lower layer is for anode and cathode electrodes and the middle one is the flow channel. The upper and lower perspex sheets of 45 mm ├Ś 30 mm ├Ś 3 mm (length ├Ś width├Ś height) dimension was taken for the fabrication of anode and cathode electrode holder. At first, a 32 mm ├Ś 5 mm channel was dissect in the middle of the perspex sheet of above mentioned dimension, then a groove of 1 mm ├Ś 1 mm was fabricated inside the 32 mm ├Ś 5 mm channel for the proper fitting of electrode and current collector (Ni mesh) for the upper perspex sheet. Two holes of 1 mm diameter were drilled in the both width side of 32 mm ├Ś 5 mm channel for inlet and one hole at the other end for outlet stream, respectively. The two inlet tubes vertical to channel was attached; one inlet arm for anolyte and other one for catholyte stream. The outlet tube was attached at the end of the main channel for the discharge of reaction products. The middle PMMA sheets/spacer of 45 mm ├Ś 30 mm ├Ś 0.9 mm (length ├Ś width├Ś height) dimension was taken for the flow channel fabrication of anolyte and catholyte streams. A separator of 5 mm ├Ś 3 mm dimension was fixed at the entry point of the flow channel to avoid the direct contact of anolyte and catholyte streams. Finally, all the three layers of perspex sheet were assembled by sealing with PTFE tape in between the three perspex sheets windows to prevent any short of fuel and electrolyte leakage. The three perspex sheets were clamped and tighten by four bolts of 3 mm diameter at four sides as shown in Fig. 2c.
The PTFE tape was used in between anode and cathode frame for leakage prevention. The details of the air breathing cathode i.e., four layer composite and three layer anode composite with anolyte and catholyte flow are shown in our previous publish research work elsewhere [39]. The different concentration of glycerol and KOH solution were fed to the anode at varying flow rate of 0.5 mL/min to 1.2 mL/min using a peristaltic pump (Electrolab, India). The flow rate of catholyte was same as that anode flow rate. The anode and cathode stream were fed to the channel via vertical burette to reduce fluctuation of flow in the channel and maintain constant flow rate of the stream (Fig. 2a). The voltage and current data were recorded using multimeters (Rish, India) to understand the polarization behavior of the MFC. The photographic view of the MFC experimental setup is shown in the supplementary Fig. S1.
3. Results and Discussion
3.1 XRD analysis
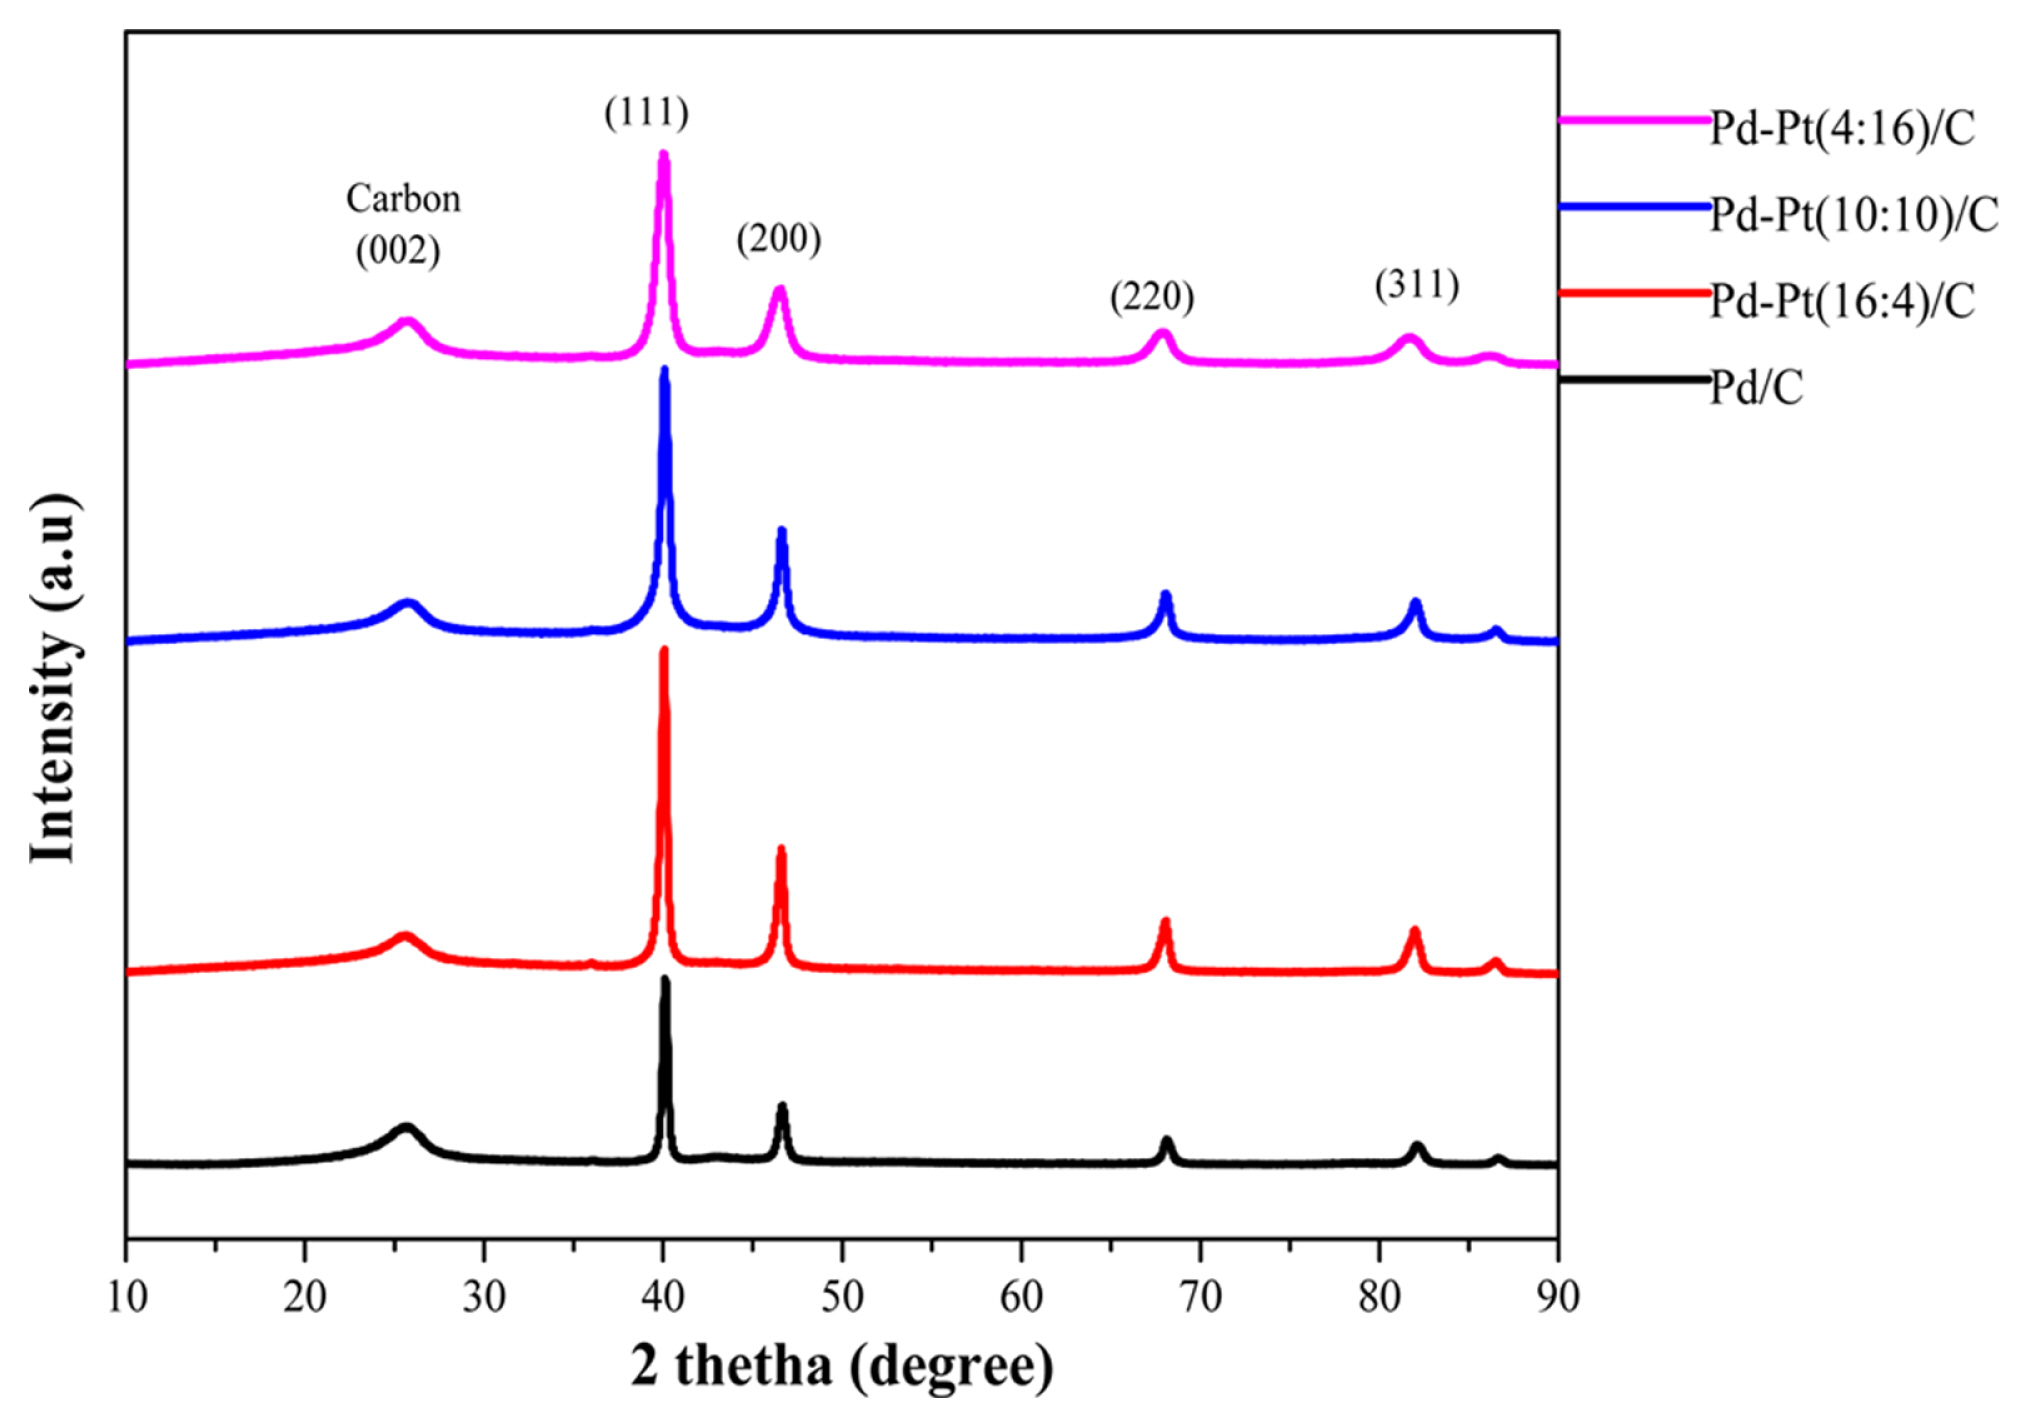
Fig. 3 shows the crystal structures of synthesized electrocatalyst Pd/C and bimetallic Pd-Pt (16:4)/C, Pd-Pt (10:10)/C, and Pd-Pt (4:16)/C of various compositions. The peak value at 2╬Ė of 25┬░ to the plane (002) of a hexagonal structure is related to the carbon support material. The diffraction patterns show the characteristics of crystalline face-centered cubic (fcc) Pd, with peaks corresponding to (111), (200), and (220) planes. The main peaks for pure Pd appear at 2╬Ė values of 40.1┬░ (111), 46.7┬░ (200) and 68.1┬░ (220) comply with the standard of JCPDS (05 0681) [39]. The main peaks (JCPDS 040802) for pure Pt appear at 2╬Ė values of 39.76┬░ (111), 46.27┬░ (200) and 67.5┬░ (220). The average crystallite sizes were determined using ScherrerŌĆÖs equation (Eq. (3)) on the diffraction peak (111) and the lattice parameter was calculated using BraggŌĆÖs equation (Eq. (4)) [40].
Where, dc is the calculated crystallite size, ╬╗ is the x-ray wavelength (1.54 ├ģ), B is the width of diffraction peaks (in radians) and ╬Ė is the angle at the peak position, n is order of diffraction and dhkl is interplanar distance between two plane of miller index (hkl). The diffraction peaks of Pd-Pt/C are shifted to lower 2╬Ė values compared to Pd/C as shown distinctly for (111) diffraction peaks depicted in Table 1. The lattice parameters of all Pd-Pt/C alloy electrocatalysts, (0.3891, 0.3892, 0.3893 and 0.3896 nm) are smaller than the value for pure Pt (0.3923 nm) but higher than that of pure Pd (0.3890 nm) [41]. It indicates the decrease in the lattice is due to the particle replacement of Pt by Pd in the structure of the Pd-Pt alloy [42,43]. The crystalline size of Pd-Pt/C was strongly affected by the addition of Pt element on the electrocatalyst [44]. In general, carbon supported metals particle size decreases in the order of Pd, Pd-Pt/C and Pt [45,46]. Garcia et al. observed that the metal particle sizes estimated from the XRD data exhibit that the sizes are smaller at higher concentrations of Pt in Pd-Pt electrocatalyst. The similar trend was also found in the present study in XRD analyses (Table 1) [40,47]. Choudhary and Pramanik [40] reported the synthesis of HNO3-functionalized acetylene black carbon supported Pt-Ru/CAB nano electrocatalysts for ethanol electrooxidation, where larger crystallite size of the Pt-Ru/CAB electrocatalysts comes up with higher degree of alloying. The alloying of Ru with Pt atom plays a very crucial role in electrooxidation of ethanol fuel. Thus, it could concluded that the higher crystallite size might results in high degree of alloying. The degree of alloying was calculated using VegardŌĆÖs law and using the relation given in Khan et al. [48] shown in Eq. (5) and Eq. (6). The Lattice parameter was calculated at (220) peak position. The value of atomic fraction of Pt (XPt) in the Pd-Pt/C was calculated by the lattice parameter and the Pt/Pd ratio was nominal atomic ratio calculated using Table 2. The K value is calculated by assumed that the lattice parameter of Pd and Pt is located in the line of lattice parameter of alloy. The calculated degree of alloying is shown in Table 1.
Due to this fact, the largest crystallite size of alloy electrocatalyst Pd-Pt (16:4)/C probably would exhibit excellent electrocatalytic property for glycerol elctrooxidation in the cyclic voltammetry (CV) studies and single MFC which are discussed in the results and discussion section. The calculated crystallite sizes are a little larger than those obtained from TEM images which are discussed in the TEM analysis section. In electrocatalyst preparation by impregnation reduction method, metal complexes agglomerate into large particles either before or during the reduction process [49, 50]. In the XRD technique, the average particle size obtained by scanning the complete sample which shows the macroscopic structure of samples than TEM results.
3.2 SEM-EDX analysis of synthesized electrocatalyst
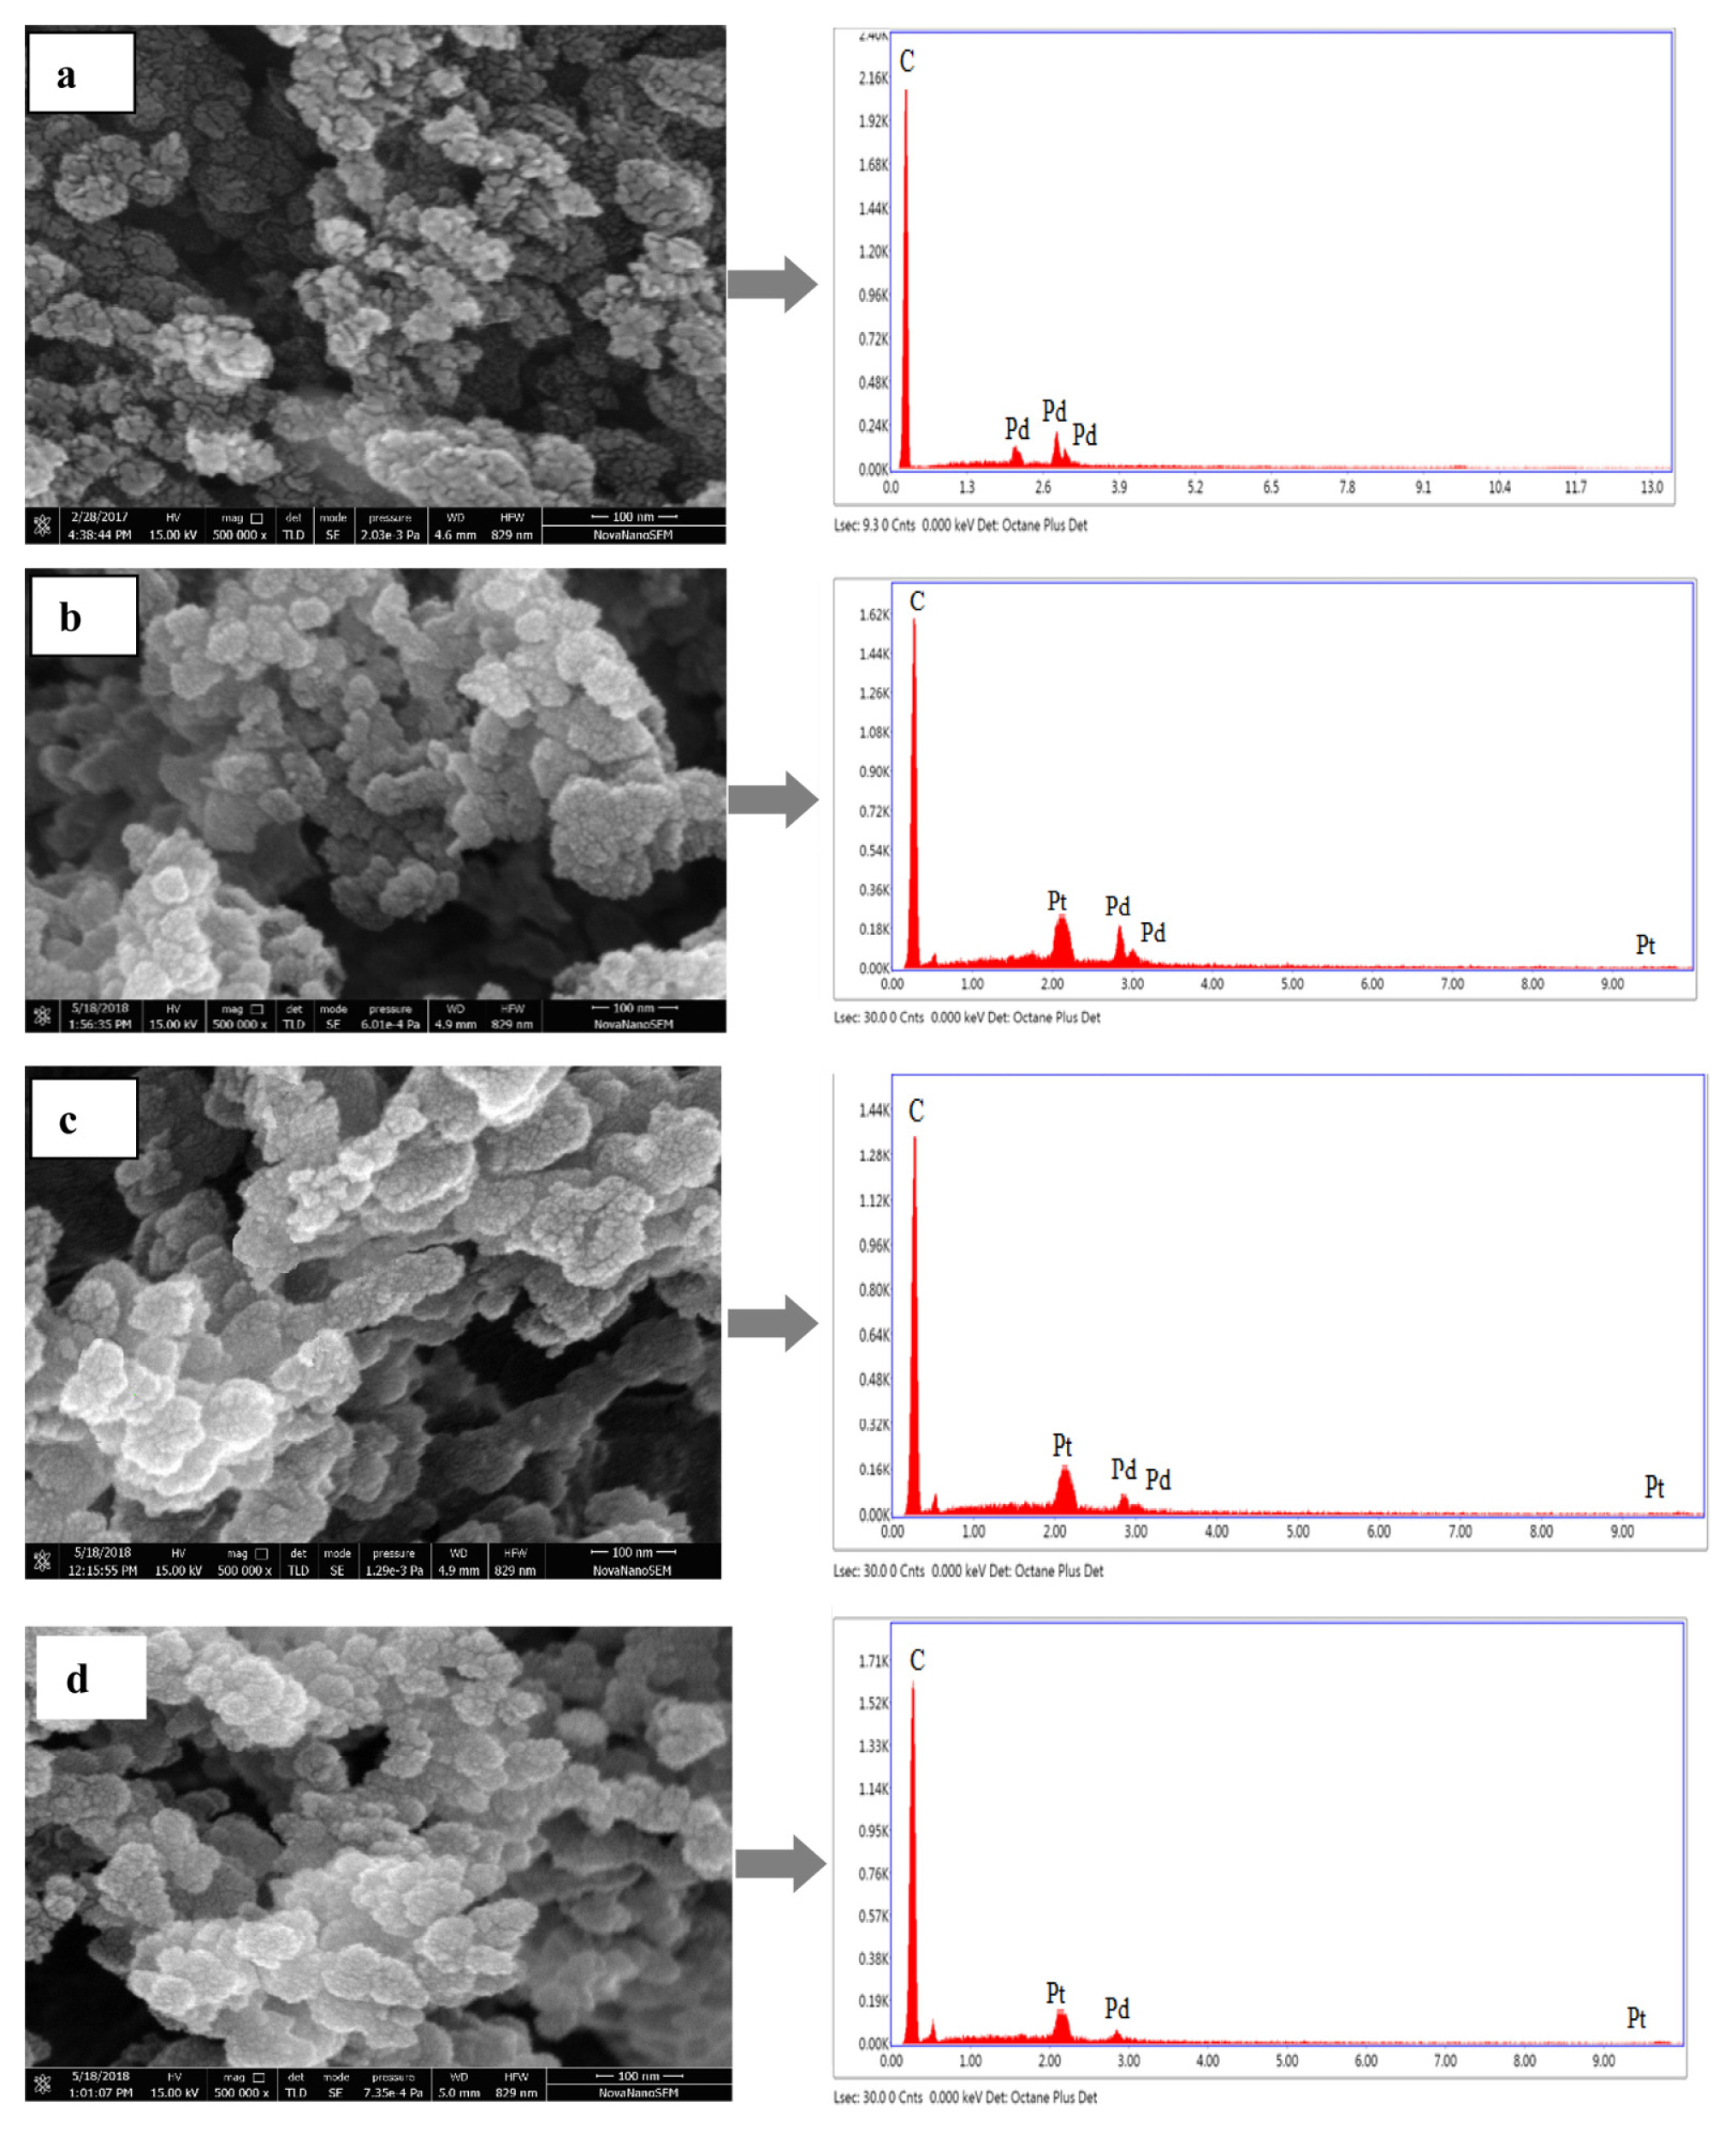
The surface morphology of the prepared electrocatalyst Pd/C, Pd-Pt (16:4)/C, Pd-Pt (10:10)/C, and Pd-Pt (4:16)/C was visualized by SEM analyses. The surface morphology of electrocatalyst shows spherical and uniform particles of nano range (Fig. 4). The EDX analysis was performed to check the surface concentration of metals and carbon support in the synthesized electrocatalyst. The EDX analysis shows the presence of all the elements i.e., Pd, Pt, and C for all the Pd-Pt/C electrocatalyst having different metal ratios. Table 2 shows the elemental compositions of prepared electrocatalyst, which are not exactly the same as that of nominal composition calculated them initially. Since the electrocatalytic surface is heterogeneous and thus, the EDX result of elemental composition varies from point to point [39].
3.3 TEM analysis
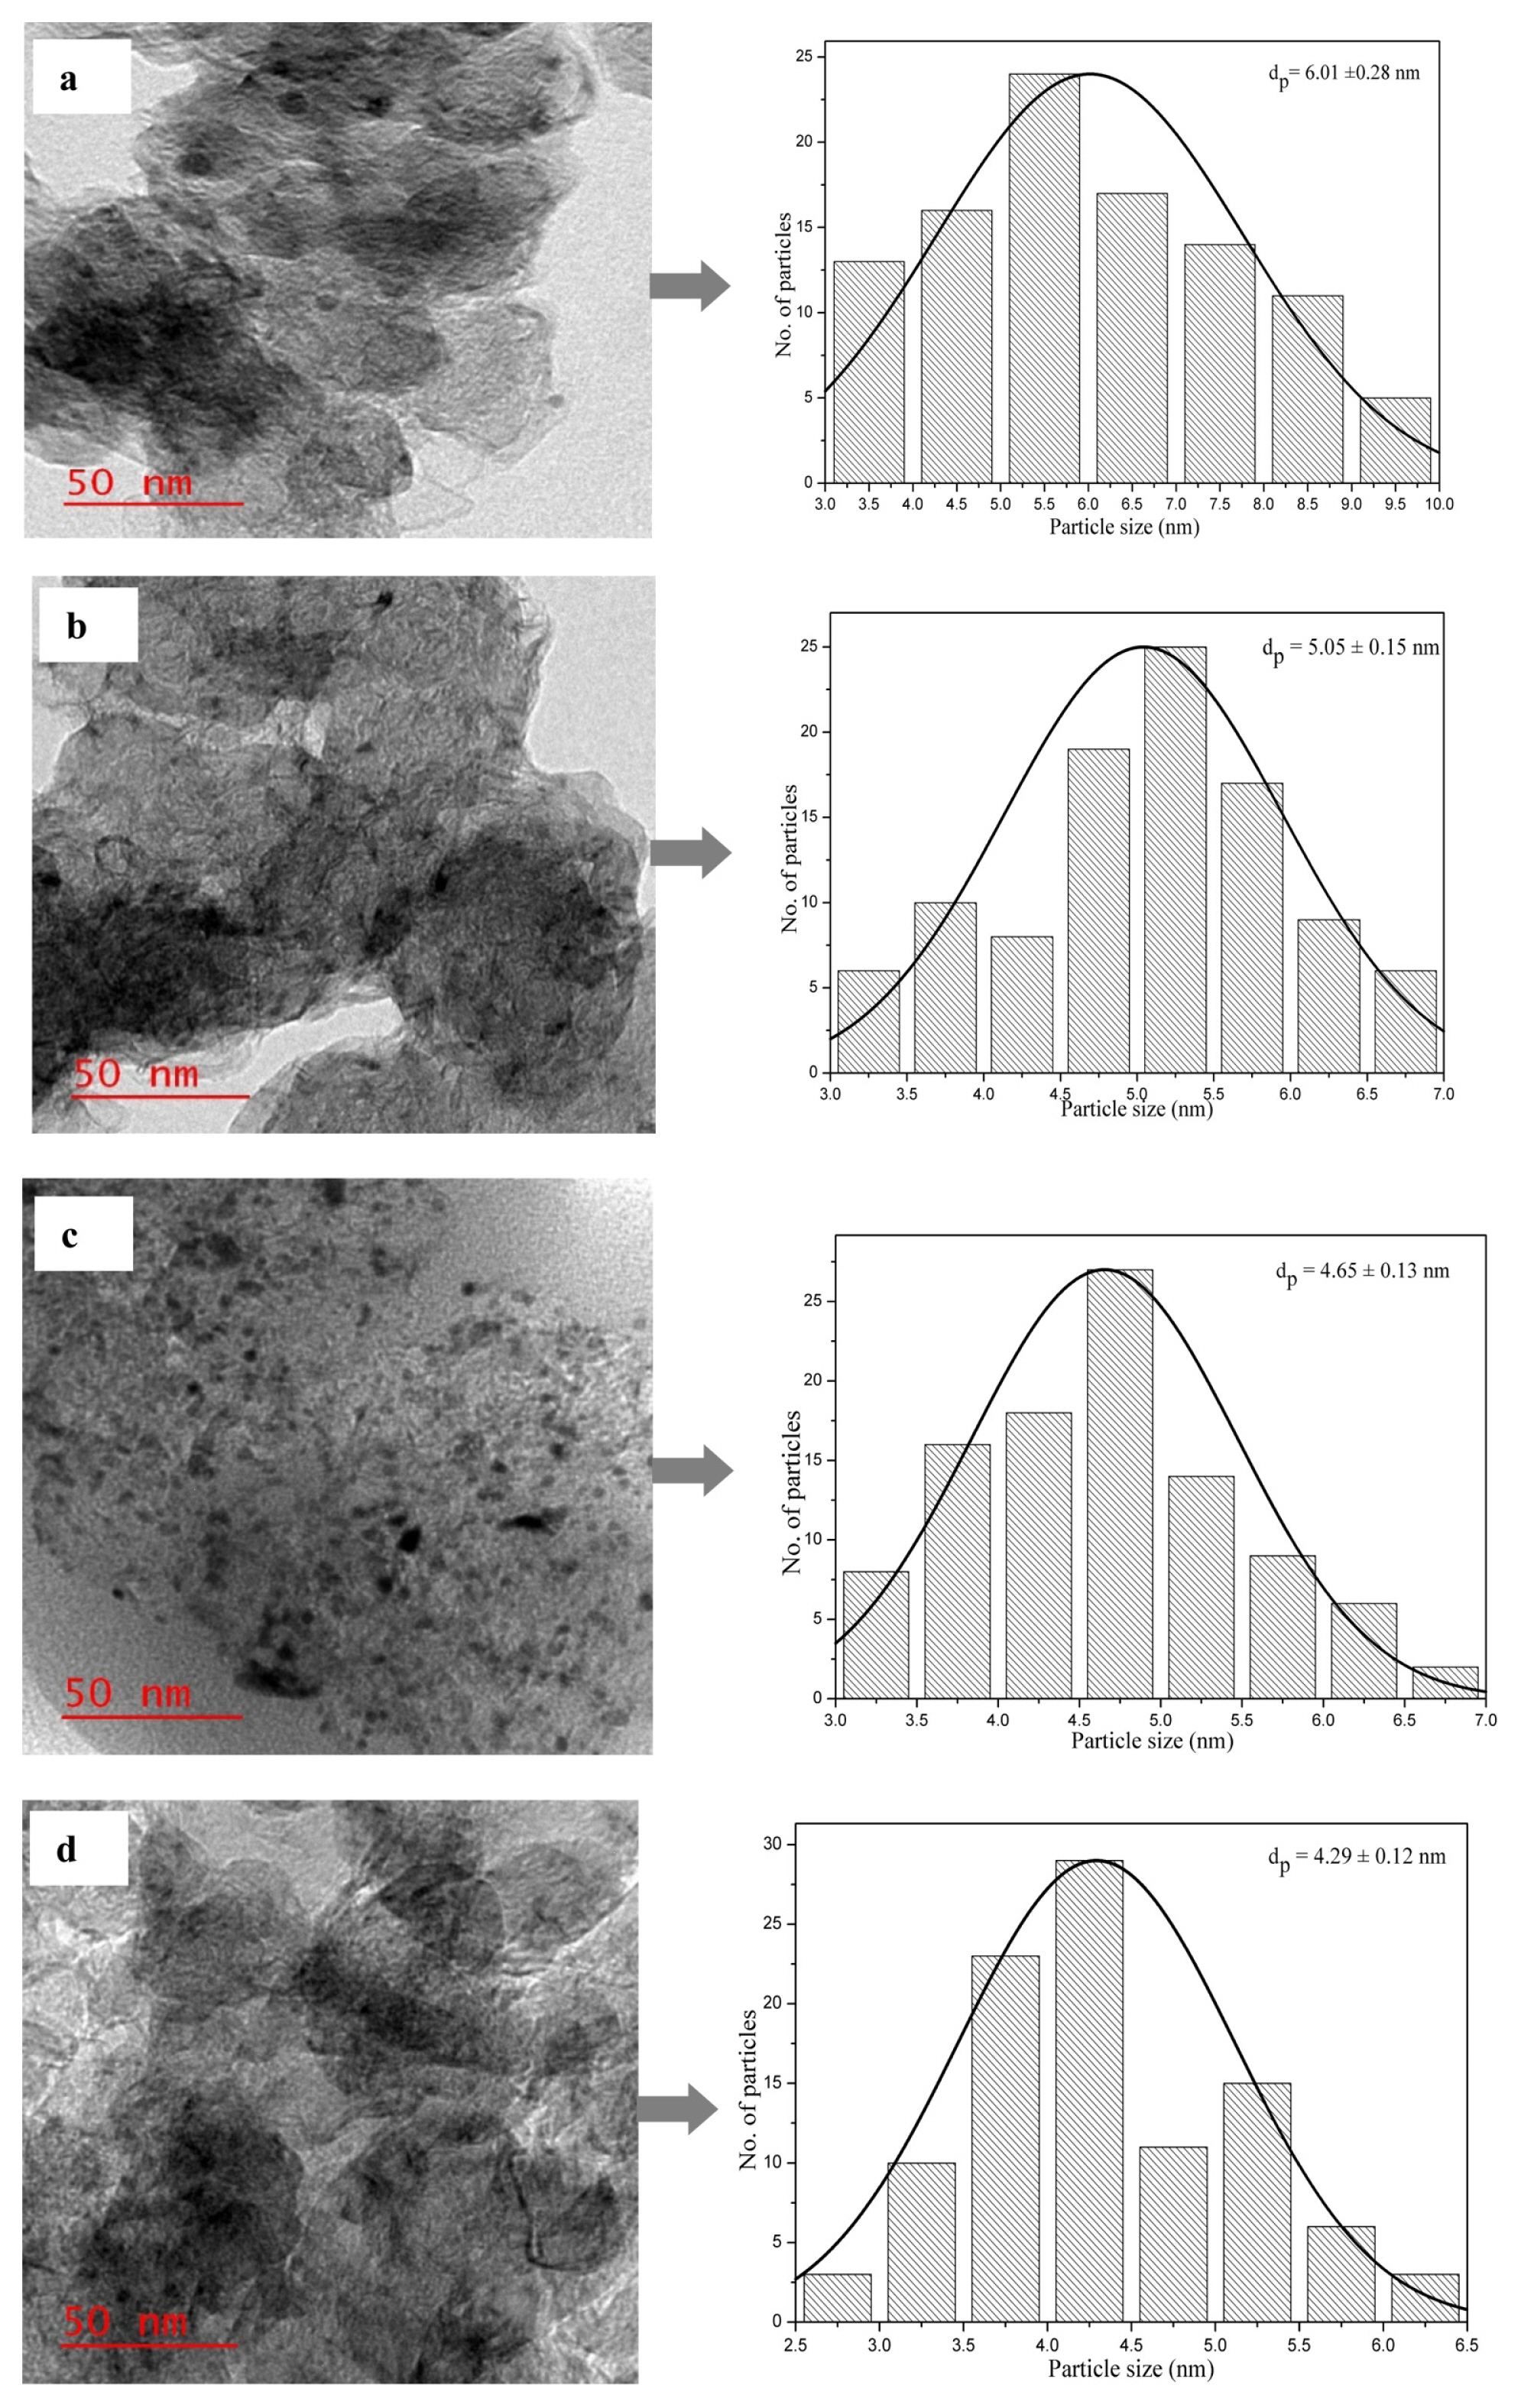
The TEM images of the Pd/C, Pd-Pt(16:4)/C, Pd-Pt (10:10)/C and Pd-Pt(4:16)/C electrocatalysts are displayed in Fig. 5aŌĆōd. The particle size distribution histogram was used to find the average particle size of all types of electrocatalyst. It is clearly seen in the TEM image that the electrocatalysts comprise of nano range size and homogeneously distributed on the support material. The electrocatalyst particles are spherical and slightly agglomerated due to the impregnation reduction method used in electrocatalyst preparation [51]. The particle size was calculated by taking 100 particles from the TEM images for estimation of particle size with the help of Image J software. The average particle sizes of electrocatalysts are were 6.01 ┬▒ 0.28 nm, 5.05 ┬▒ 0.15 nm, 4.65 ┬▒ 013 nm and 4.29 ┬▒ 0.12 nm for Pd/C, Pd-Pt(16:4)/C Pd-Pt(10:10)/C and Pd-Pt(4:16)/C, respectively. The TEM results also show a similar trend for the particle size as it was seen in the XRD analysis (Table 1). The difference between crystallite sizes obtained from XRD analysis and particle sizes obtained from the TEM analysis were observed. It may be due to the special characteristics of XRD analysis where it reflects crystalline particles, not the actual morphology of electrocatalysts. Moreover, larger size particles are selected in XRD patterns, while most small particles are counted in TEM images [37]. Although, particle size obtained by TEM analysis for all bimetallic electrocatalysts are smaller than obtained by XRD analysis, the average particle size of Pd-Pt (16:4)/C was found to be little high among all bimetallic electrocatalyst in the TEM analysis also. As already discussed in XRD section, the larger particle size might results in high degree of alloying. Due to this fact, the largest particle size of alloy electrocatalyst Pd-Pt (16:4)/C probably would exhibit excellent electrocatalytic property for glycerol elctrooxidation in the cyclic voltammetry (CV) studies and single MFC.
3.4 Cyclic voltammetry and EIS study of anode elctrocatalyst
3.4.1 Cyclic voltammetry of anode electrocatalysts
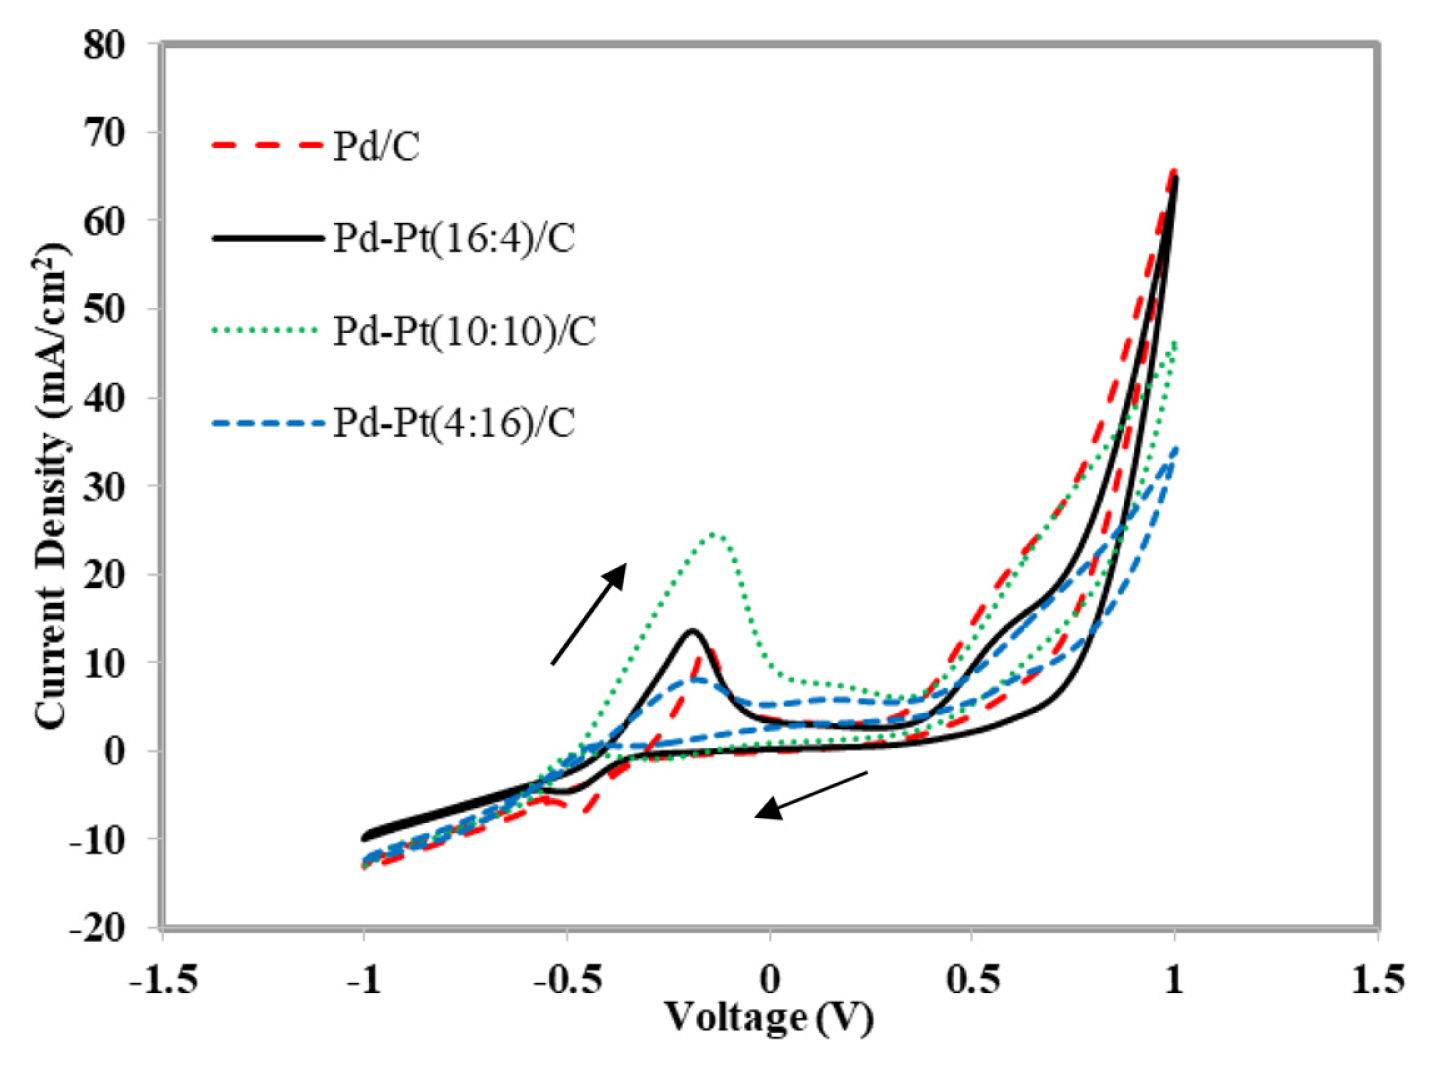
Fig. 6 represents the cyclic voltammograms for 1 M glycerol mixed with 1 M KOH using synthesized electrocatalyst Pd/C and Pd-Pt(16:4)/C, Pd-Pt(10:10)/C and Pd-Pt(4:16)/C, respectively. The applied potential was varied from ŌłÆ1.0 V to 1.0 V. The scan rate was fixed at 50 mV/sec. The peak current density of 11.97 mA/cm2 at a peak potential of ŌłÆ0.157 V (Vs Ag/AgCl) was obtained for Pd/C. The bimetallic Pd-Pt(10:10)/C showed the highest electrooxidation peak current density of 24.51 mA/cm2 at a potential of ŌłÆ0.133 V (Vs Ag/AgCl). On the other hand Pd-Pt(16:4)/C and Pd-Pt(4:16)/C produce peak current density of 13.58 mA/cm2 and 8.08 mA/cm2 at the potential of ŌłÆ0.189 V (Vs Ag/AgCl) and ŌłÆ0.179 V (Vs Ag/AgCl), respectively. Although, the peak current density of Pd-Pt(10:10)/C was high, the electrooxidation potential shifted to the less negative side by 0.056 V and 0.046 V with respect to Pd-Pt(16:4)/C and Pd-Pt (4:16)/C. It implies that the activation overpotential is very high for the synthesized bimetallic Pd-Pt (10:10)/C and expected to give poor result in MFC device. Whereas, Pd-Pt (16:4)/C comes up with moderate peak current density (13.58 mA/cm2) at very high negative potential (ŌłÆ0.189 V (Vs Ag/AgCl)). It indicates Pd-Pt (16:4)/C to be very promising bimetallic electrocatalyst for MFC using glycerol as anode fuel (Table 3). It is clearly seen from the Table 3 that peak current density increases with the increase in Pt content upto Pd to Pt ratio of 10:10 and further incrtease in Pd to Pt ratio to 4:16, the peak current density decreases. As reported in the published literature, Pt helps to split the C-C bond of the glycerol molecules and Pd atoms reduce the adsoption of CO on Pt sites and thus, Pd-Pt/C electrocatalysts show better electrocatalytic property for glycerol electrooxidaion than pure Pd or Pt. However, formation of metal alloy and better degree of alloying are essential for the bimetallic electrocatalyst to exibit excellent electroocatalytic property [40]. It is clearly seen in the XRD analysis (Table 1), highest degree of alloying (47.9 wt. %) is observed for the Pd rich in the Pd-Pt (16:4)/C bimetallic electrocatalyst and thus, it resulting in electroxidation peak at very high negative potential (ŌłÆ0.189 V (Vs Ag/AgCl)). The peak current density is moderate due to low Pt amount in the synthesized electrocatalysts of Pd-Pt (16:4)/C. Whereas, peak current density is very high for Pd-Pt (10:10)/C and it may be due to increased amount of Pt metal in this electrocatalyst in comparison to that of Pd-Pt (16:4)/C. However, peak potential was observed at relatively low negative poptential (ŌłÆ0.133 V) which might results in high overpotentials. It may be due to lower degree of alloying (18.2 wt. %). The electrocatalyst with highest amount of Pt i.e., Pd-Pt (4:16)/C produced very low peak current density as the active electerocatalyst sites were not formed due to poor alloying of 10 wt. % and poisoning of active Pt sites also take place by the formation of intermediate products due to low amount of Pd [52]. Undoubtadely, the electronic properties of Pd is improved by the addition of small amount of Pt in Pd-Pt bimetallic electrocatalyst [53]. It should be noted that lower over potential of synthesized electrocatalyst is also important for achieving high power density from the single MFC studeis [39]. From the results of CV experimets, it can be predicted that synthesized Pd-Pt (16:4)/C electrocatalysts would results in excellent cell performance and it may be due to the higher degree of alloying in comparison to other bimetallic electrocatalysts, as discussed ealier in the XRD and TEM analysis [40]. The single metal based Pd/C shows relatively low peak current density (11.97 mA/cm2) at less negative potential (ŌłÆ0.157 V (Vs Ag/AgCl)). Thus, the performance of Pd/C would be poor in a single MFC test.
3.4.2 EIS study of synthesized anode electrocatalyst
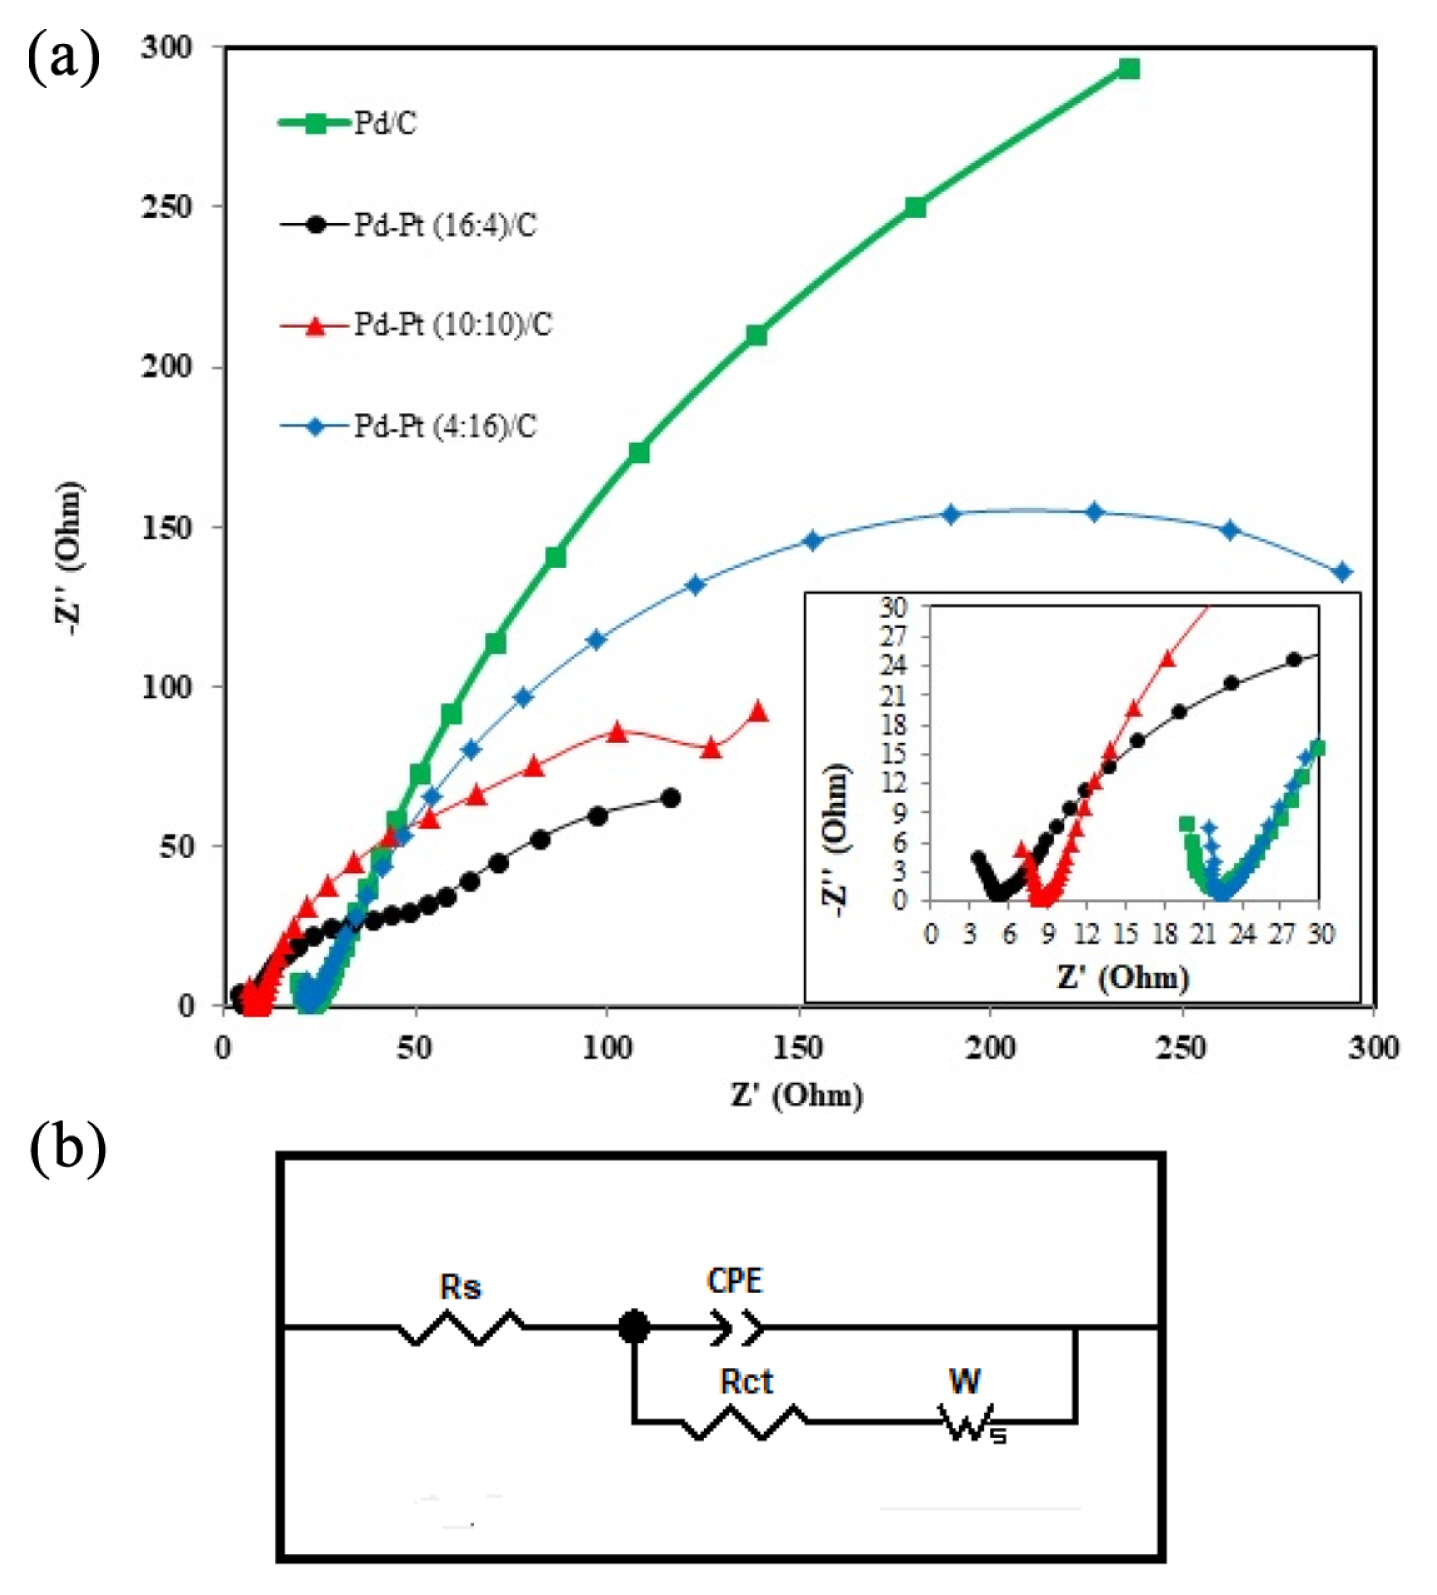
Fig. 7a illustrate the Nyquist plots of glycerol electrooxidation on the different synthesized electrodes in a solution containing 1 M glycerol and 1 M KOH. The EIS was performed at a frequency range of 100 kHz to 10 mHz with amplitude of 10 mV at the potential of ŌłÆ0.2 V (vs Ag/AgCl). The shape of the Nyquist plots of different electrocatalyst having different arcs diameter. The diameter of the arc represents the charge transfer resistance of the electrooxidation reaction [54]. The larger arc diameter of Pd/C electrocatalsyt indicates higher charge transfer resistance compared to smaller arc diameter generated by the bimetallic electrocatalysts. Even among all the bimetallic Pd-Pt/C electrocatalysts, the Pd-Pt (16:4)/C, generates smallest arc diameter compared to other bimetallic electrocatalysts. The shifting of intercept may be due to the varying electrode conductivity or electrode resistance of different types of electrocatalysts. This is the main reason for change in the cell resistance or individual electrodes resistance [11]. Also, the intercept at lower value idicates the lower electronic resistance compared with other electrocatalysts of the electrode [55].
The equivalent circuit correponds to the Nyquist plot is shown in Fig. 7 b was used to calculate the information of the Pd/C, Pd-Pt (16:4)/C, Pd-Pt (10:10)/C and Pd-Pt (4:16)/C electrocatalysts. In the equivalent circuit, the solution resistance/electrolyte resistance is represented by Rs, constant-phase element is the double-layer capacitance at the interface of electrolye and electrocatalyst represented by CPE, the charge-transfer resistance is represented by and Warburg diffusion resistance of ions in the solution is represented by W. The Rct is the mesurement of the semicircle arc diameter which is associated to the obstruction of passing of electron across the electrode area to adsorbed the species, similary from the adsorbed species to the electrode surface. The results shows that the smaller Rct indicates a faster reaction rate of glycerol electrooxidation reaction. The value of CPE or double layer capacitance is 2 mF, 2.5 mF, 5.1 mF, and 4.6 mF for Pd/C, Pd-Pt (16:4)/C, Pd-Pt (10:10)/C and Pd-Pt (4:16)/C, respectively. Similarly, the value of Rct is 2067 ╬®, 115.2 ╬®, 193.1 ╬®, and 549 ╬® for Pd/C, Pd-Pt (16:4)/C, Pd-Pt (10:10)/C and Pd-Pt (4:16)/C, respectively.
Thus, in the present EIS study, the results indiciate that Pd-Pt (16:4)/C has lowest charge transfer resistance (115.2 ╬®) than other electrocatalyst. The reason for such low charge transer resistance (115.2 ╬®) may be due to the highest degree of alloying (47.9 wt. %) for the synthesized Pd-Pt (16:4)/C. As already mentioed in CV section, higher degree of alloying resulting in low overpotential for this electrocatalyst (Pd-Pt (16:4)/C). As reported by Eshghi et al. [56], Al-Saleh et al. [57] and Habibi et al. [58] low overpotential of a electrocatalyst would results in charge transfer resistance. Although, Pt amount is high in the Pd-Pt(10:10)/ and Pd-Pt (4:16)/C, the degree of alloying is low and thus, charge transfer resistance for both the electrocatalysts are high. It is clear from the EIS analysis that the Pd-Pt (16:4)/C would obviously results in excellent electrocatalytic activity for glycerol electrooxidation.
3.5 Calculation of dimensionless numbers and pressure drop in T-shaped MFC
To know the fluid flow behavior in the microchannel of MFC, the important dimensionless numbers such as Reynolds Number (Re), Peclet Number (Pe) and Schmidt Number (Sc) were calculated and compared thses dimensionless numbers with literature reported standard data which confirms the laminer flow within the T-shape micro channel. The flow rates of anode and cathode streams were maintained at 0.5 mL/min, 0.8 mL/min, 1 mL/min, 1.2 mL/min and 1.6 mL/min to find out the optimum flow rate for maximizing the cell performance. The calculated dimensionless numbers estimate the intermixing of fuel and oxidant and stability of the liquid-liquid interface. The calculated values of all three dimensionless numbers were found within the acceptable range.
The Reynolds number,
R e = D h V Žü ╬╝
Hydraulic diameter ŌĆśDhŌĆÖ of the microchannel in the T-shaped MFC is 0.782 ├Ś 10ŌłÆ3 m, where
D h = 4 A P
The Schmidt number,
S c = ╬╝ Žü D
Similarly, the degree of mixing during laminar flow depends on the Peclet number,
P e = V D h D
The high Peclet number reduces the concentration boundary layer and enriches the concentration gradient. The value of Pe more than 104 shows thinner diffusion zones between the two streams and avoids the mixed potential at cathode due to fuel crossover in the MFC device [62]. Table 5 shows that the Peclet number Pe > 104 for the all flow rates Ōēź 1 mL/min which indicates no intermixing between two streams for the flow rates higher than 1 mL/min. Thus, cell performance is expected to be higher beyond the flow rates 1 mL/min.
3.6 Polarization curves and power density curves
3.6.1 Effect of flow rates
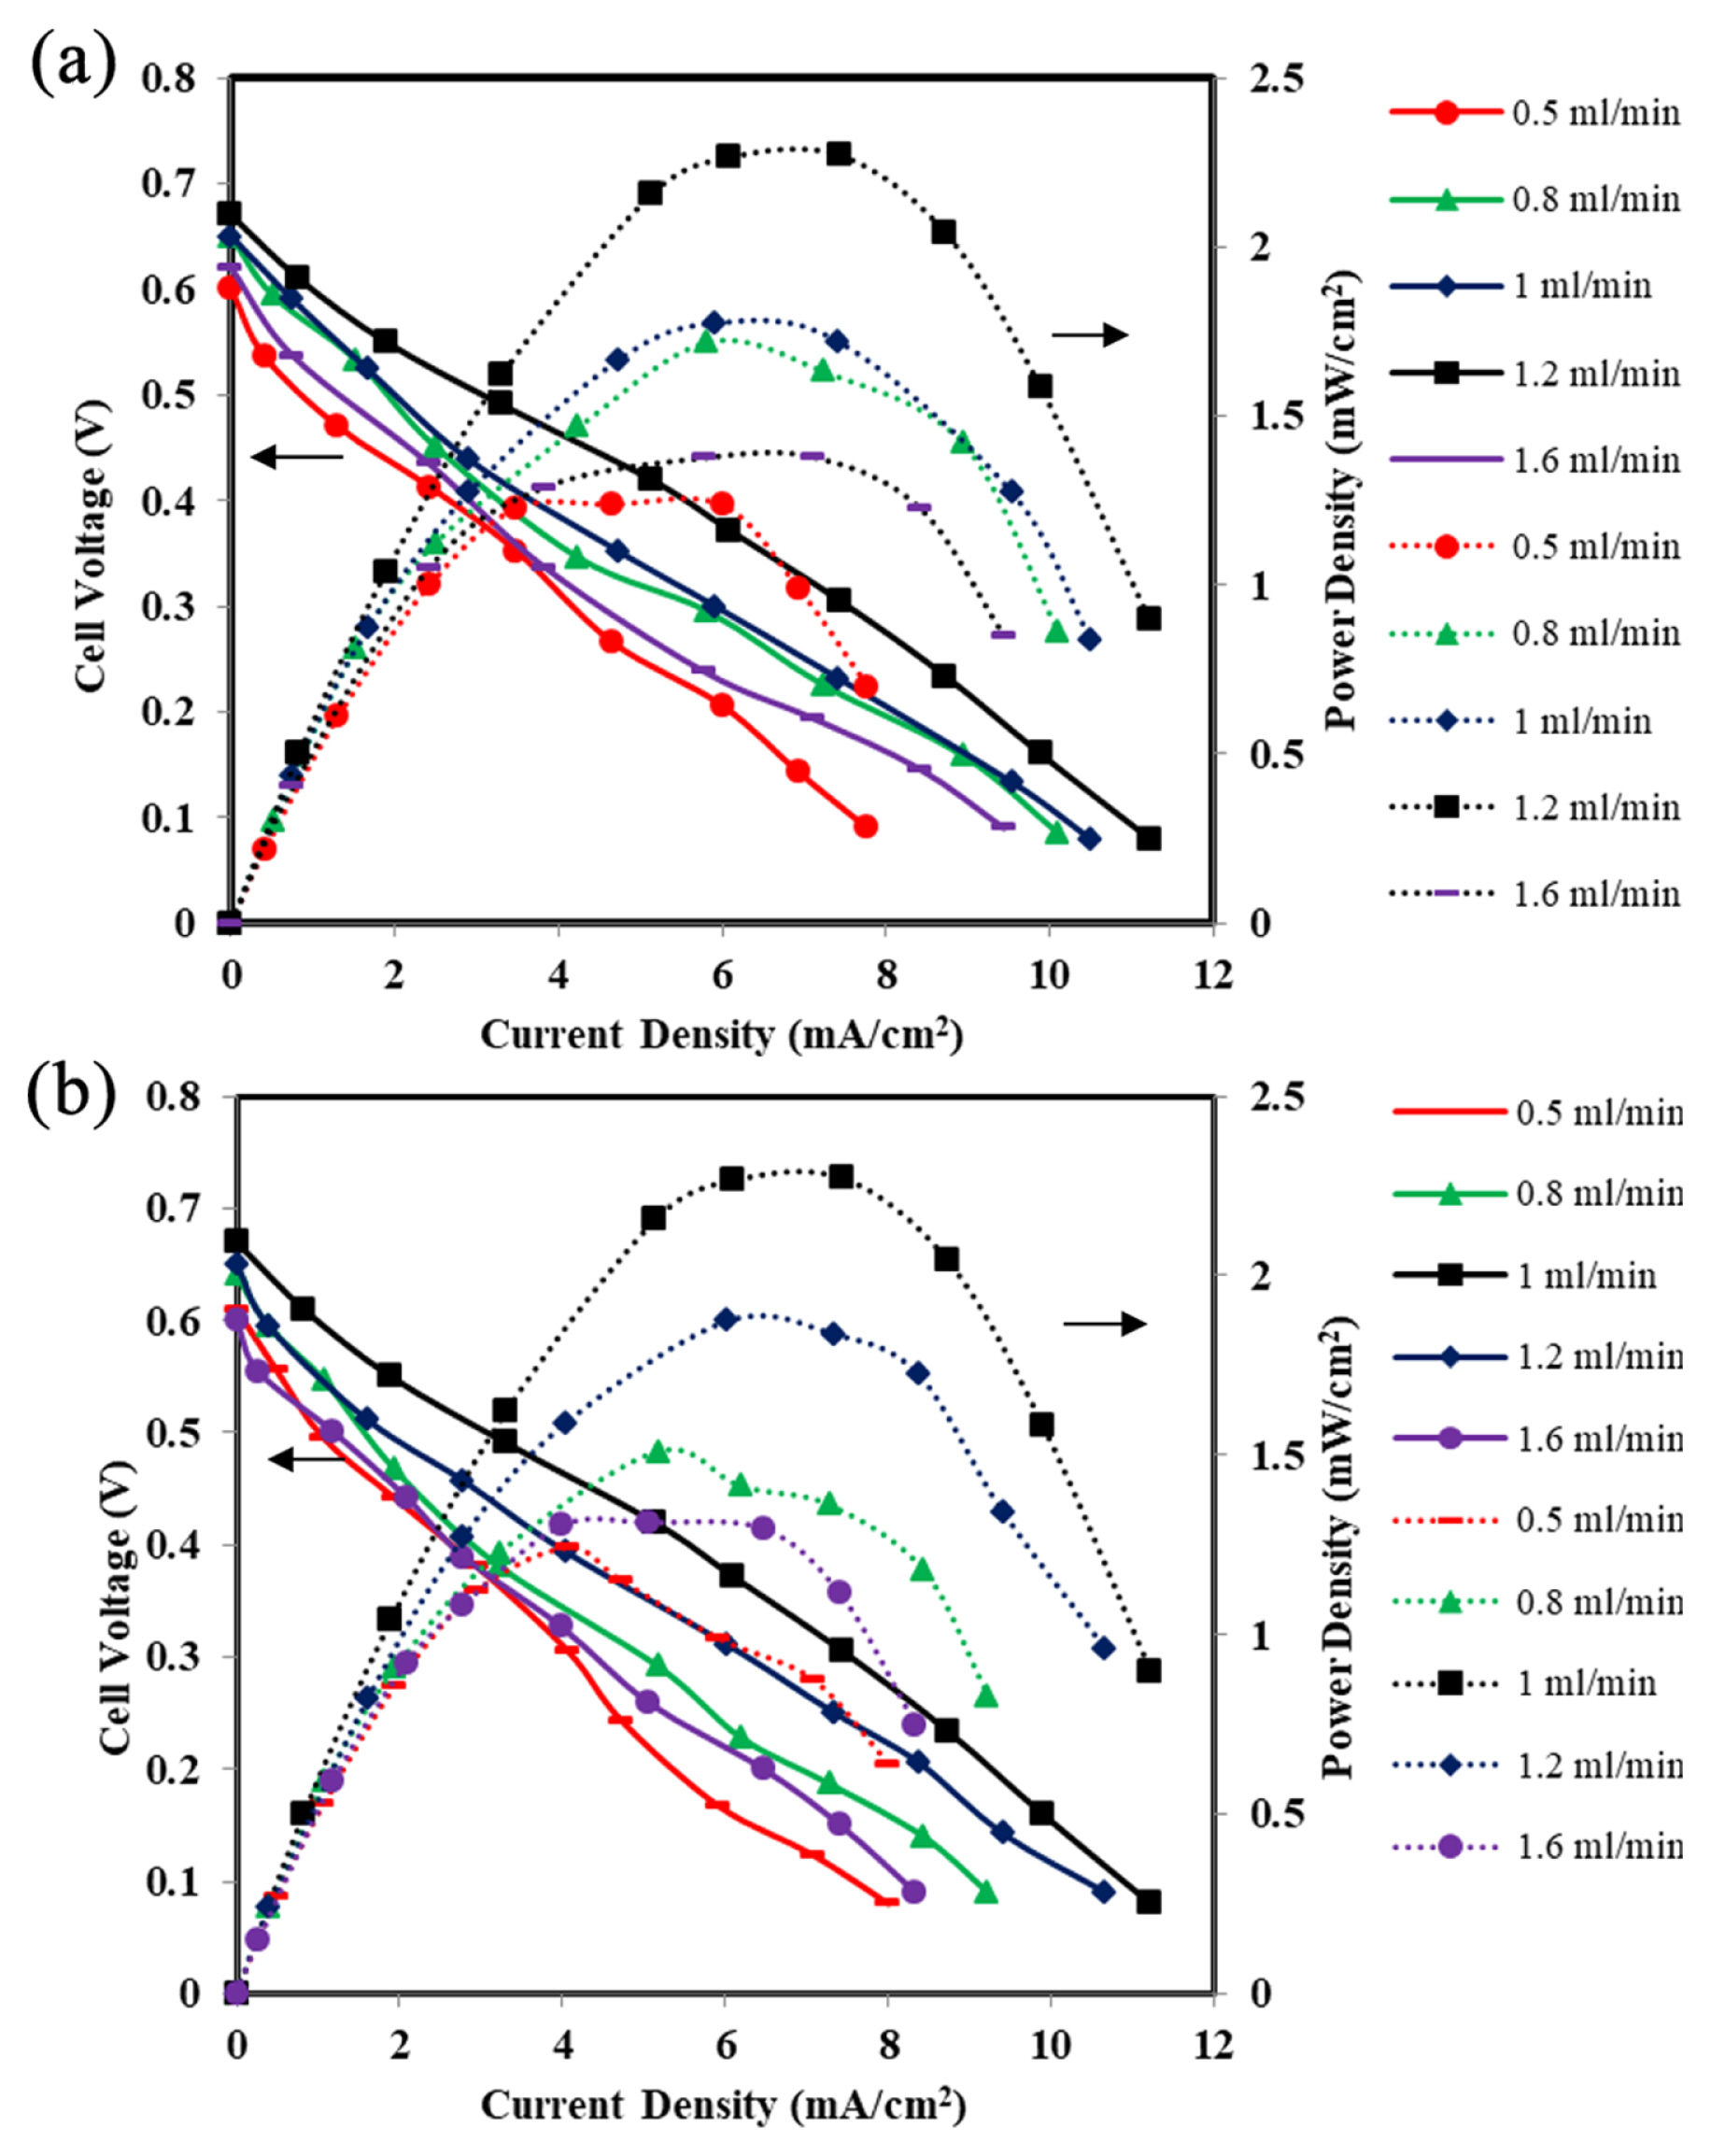
Fig. 8a, b represents the effect of the different flow rates of fuel and electrolyte streams. The cell performance in terms of OCV and power density increases with the increase in anode flow rate upto 1.2 mL/min and further increase in the flow rate beyond 1.2 mL/min, the cell performance decreases drastically (Fig. 8a).
The maximum power density of 2.27 mW/cm2 and OCV of 0.67 V were achieved at a flow rate of 1.2 mL/min at the anode side. Similarly, the cathode stream flow rates were varied from 0.5 mL/min to 1.6 mL/min keeping the anode flow rate at optimum value of 1.2 mL/min (Fig. 8b). The maximum OCV of 0.67 V and maximum power density 2.27 mW/cm2 at a current density of 7.74 mA/cm2 were obtained at cathode flow rate of 1 mL/min and anode flow rate of 1.2 mL/min (Fig. 8b). At higher flow rates of streams, small hydrodynamic instability causes the streams to oscillate which leads to disrupt the interface between two streams [63]. At a slower flow rate of streams causes fuel crossover by diffusion, which results in a mixed potential at the cathode and lowers the cell performance [61]. The fuel crossover from anode to cathode becomes easy because of the spreading of the inter-diffusion layer between the fuel and the electrolyte streams. It should be noted that the Pe is in the range for the flow rates 1 mL/min and 1.2 mL/min i.e., 10224 and 12229, respectively. As discussed earlier, Pe more than 104 shows thinner diffusion zones between the two streams and avoids the mixed potential at cathode due to fuel crossover in the MFC device [62]. The maximum cell performance was observed at an anode flow rate of 1.2 mL/min and cathode flow rate of 1 mL/min with OCV of 0.67 V and maximum power density 2.27 mW/cm2 at a current density of 7.74 mA/cm2.
3.6.2 Effect of electrocatalyst type
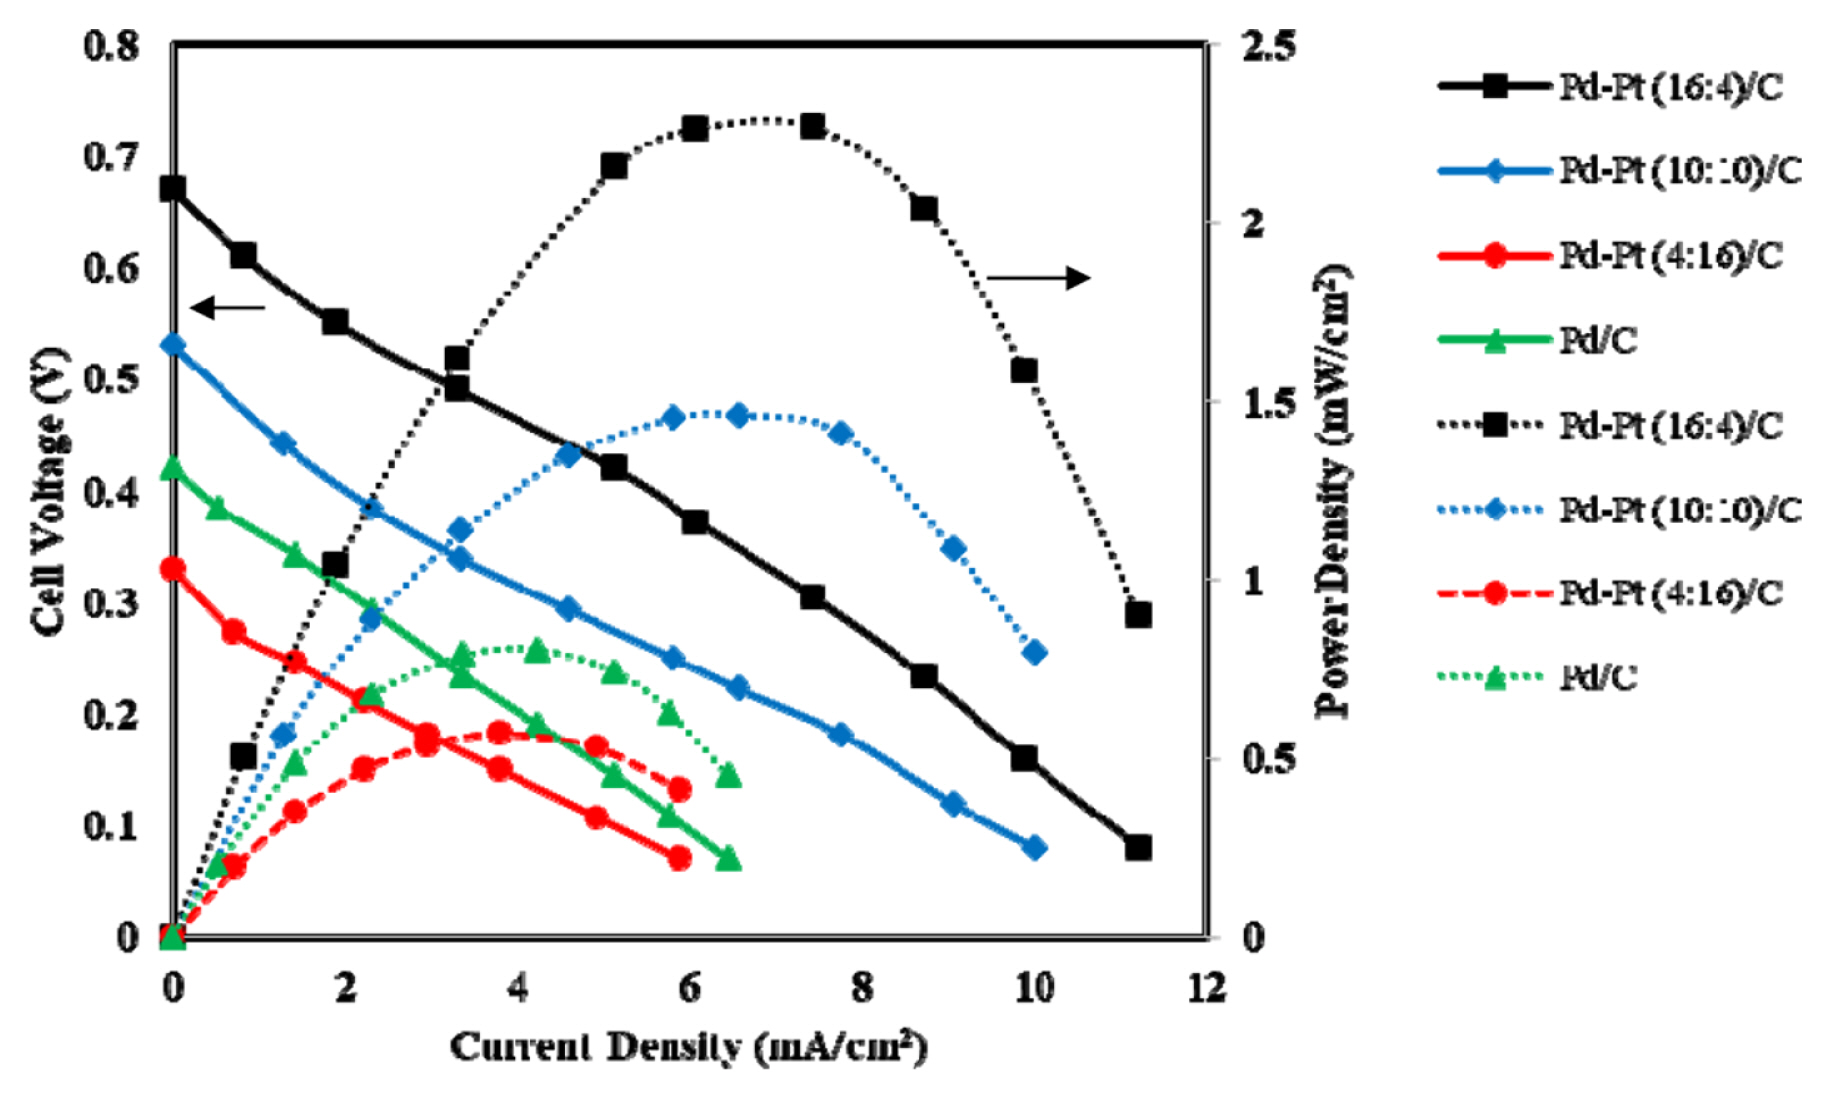
Fig. 9 shows the effect of anode electrocatalyst type i.e., synthesized Pd-Pt (16:4)/C, Pd-Pt (10:10)/C, Pd-Pt (4:16)/C and Pd/C of 1 mg/cm2 loading at each anode. The anolyte and catholyte flow rates were 1.2 mL/min and 1 mL/min, respectively. The maximum OCV of 0.67 V and maximum power density of 2.27 mW/cm2 were obtained for the electrocatalyst Pd-Pt (16:4)/C. The MFC performance in terms of OCV and power density was highest for the bimetallic electrocatalyst Pd-Pt(16:4)/C. However, the other bimetallic electrocatalyst comparatively with higher Pt content, i.e., Pd-Pt (10:10)/C and Pd-Pt (4:16)/C, produced maximum power density of 1.46 mW/cm2 and 0.57 mW/cm2 at the current density of 6.56 mA/cm2 and 3.8 mA/cm2, respectively. The OCV obtained were 0.53 V and 0.33 V for Pd-Pt(10:10)/C and Pt (4:16)/C, respectively. It is clearly seen that the increase in Pt content in the Pd-Pt alloys electrocatalyst decreased cell performance. It may be due to the poor alloying of Pd with the increase in Pt amount in the synthesized electrocatalyst. The highest OCV of 0.67 V for the bimetallic Pd-Pt(16:4)/C electrocatalyst, may be due to low overpotential for this specific electrocatalyst. The CV results (Fig. 6) also showed electrooxidation peak current density at the highest negative potential (ŌłÆ0.189 V (Vs. Ag/AgCl)) confirming better performance of Pd-Pt(16:4)/C in MFC as well. The another reason for better performance of Pd-Pt (16:4)/C electrocatalyst may be very high degree of alloying (47.9%) and this has already been discussed in CV section.
3.6.3 Effect of electrocatalyst loading at anode
As Pd-Pt(16:4)/C showed best performance amoung all Pd-based synthesized electrocatalyst in terms of OCV and power density. Thus, the Pd-Pt(16:4)/C loading was varied from .5 mg/cm2 to 2 mg/cm2 to determine the optimum loading at anode side (Fig. 10). It is seen from Fig. 10 that the cell performance increases with the increase in the electrocatalyst loading upto 1 mg/cm2 of Pd-Pt(16:4)/C and further increase in loading beyond 1 mg/cm2, the cell performance decreases. The highest power density of 2.27 mW/cm2 at a current density of 7.44 mA/cm2 was obtained at the electrocatalyst loading of 1 mg/cm2. Whereas, Pd-Pt(16:4)/C of 1.5 mg/cm2 and 2 mg/cm2 loading produced maximum power density of 1.38 mW/cm2 and 1.04 mW/cm2 at a current density of 5.11 mA/cm2 and 5.2 mA/cm2, respectively.
The highest power density at a loading of 1 mg/cm2 Pd-Pt(16:4)/C was due to optimal compromise between the available surface and particle available without any agglomeration. However, at higher electrocatalyst loading i.e., 1.5 mg/cm2 and 2 mg/cm2, more number of electrocatalyst particles have to be accommodated on the same size of electrode area (3 mm ├Ś 30 mm) and thus, it becomes more compact due to agglomeration of electrocatalyst and more contact between the electrocatalyst particles. Also, the thick electrocatalyst layer hinders the transfer of OHŌłÆ ions and glycerol at the elecctrocatayst sites resulting less cell performance compare to low electrocatalsyt loading of 1 mg/cm2 [64]. It finally results in low available surface area of active electrocatalyst and thus, less number of reactions which gives finally low current density.
3.6.4 Effect of glycerol concentration
It is seen from the Fig. 11 that the MFC performance increases with the increase in glycerol concentration upto 1 M. However, further increase in concentration, the cell performance decreases. The OCV obtained from MFC were 0.61 V, 0.67 V, 0.58 V, and 0.52 V for glycerol concentration of 0.5 M, 1 M, 1.5 M and 2 M, respectively. The maximum power density of 2.27 mW/cm2 at a current density of 7.44 mA/cm2 was obtained for 1 M of glycerol. However, the glycerol fuel of 1.5 M and 2 M produced maximum power density of 1.41 mW/cm2 and 0.64 mW/cm2 at the current density of 5.2 mA/cm2 and 2.7 mA/cm2, respectively. The reason for such dependance on fuel concentration may be due to the increased fractioned coverage of electrocatalyst by glycerol molecules. However, at very high fuel concentration, OHŌłÆ ions get replaced by glycerol which reduces the cell performance [9]. Thus, operating the cell on glycerol concentration of 1 M is more practical and economical.
3.6.5 Effect of KOH concentration at the anode
Fig. 12 shows the effect of electrolyte (KOH) concentration on MFC performance when KOH was varied from 0.5 to 2 M and mixed with fixed concentration of 1 M glycerol. The OCV obtained were 0.51 V, 0.67 V, 0.70 V, and 0.60 V for 0.5 M, 1 M, 1.5 M, 2 M KOH, respectively. As it is seen in Fig. 11, the similar dependence of MFC performance was also observed for KOH concentration at the anode. It is observed in Fig. 12, the highest power density of 2.77 mW/cm2 at a current density of 7.71 mA/cm2 was obtained for the anode KOH of 1.5 M. The KOH concentration of 2 M produced a maximum power density of 1.97 mW/cm2 at a current density of 6.76 mA/cm2, which is lower than the power density obtained at 1.5 M of KOH. As per anode reaction (Eqs. (1) and (2)), the presence of glycerol and OHŌłÆ ions both are essential at anode electrode. Thus, there is delicate balance between glycerol concentration and OHŌłÆ ion required to achieve maximum electrode performance. At high concentration of electrolyte (2M KOH) glycerol molecule get replaced by OHŌłÆ ions and thus, actual concentration of glycerol at the electrocatalyst site will below. There in a prominent change in OCV at very high concentration of electrolyte in comparison to other KOH concentrations. Moreover, electrooxidation kinetics will be slow due to lesser amount of glycerol availability at the electrocatalyst sites when very high concentration (2M) of KOH is maintained at anode. The KOH concentration of 1.5 M resulting in highest cell performance in terms of OCV and power density due to delicate balance between available OHŌłÆ ions and glycerol molecules. The optimum concentration of KOH 1.5 M at anode was considered for studying the effect of temperature on MFC performance.
3.6.6 Effect of temperature
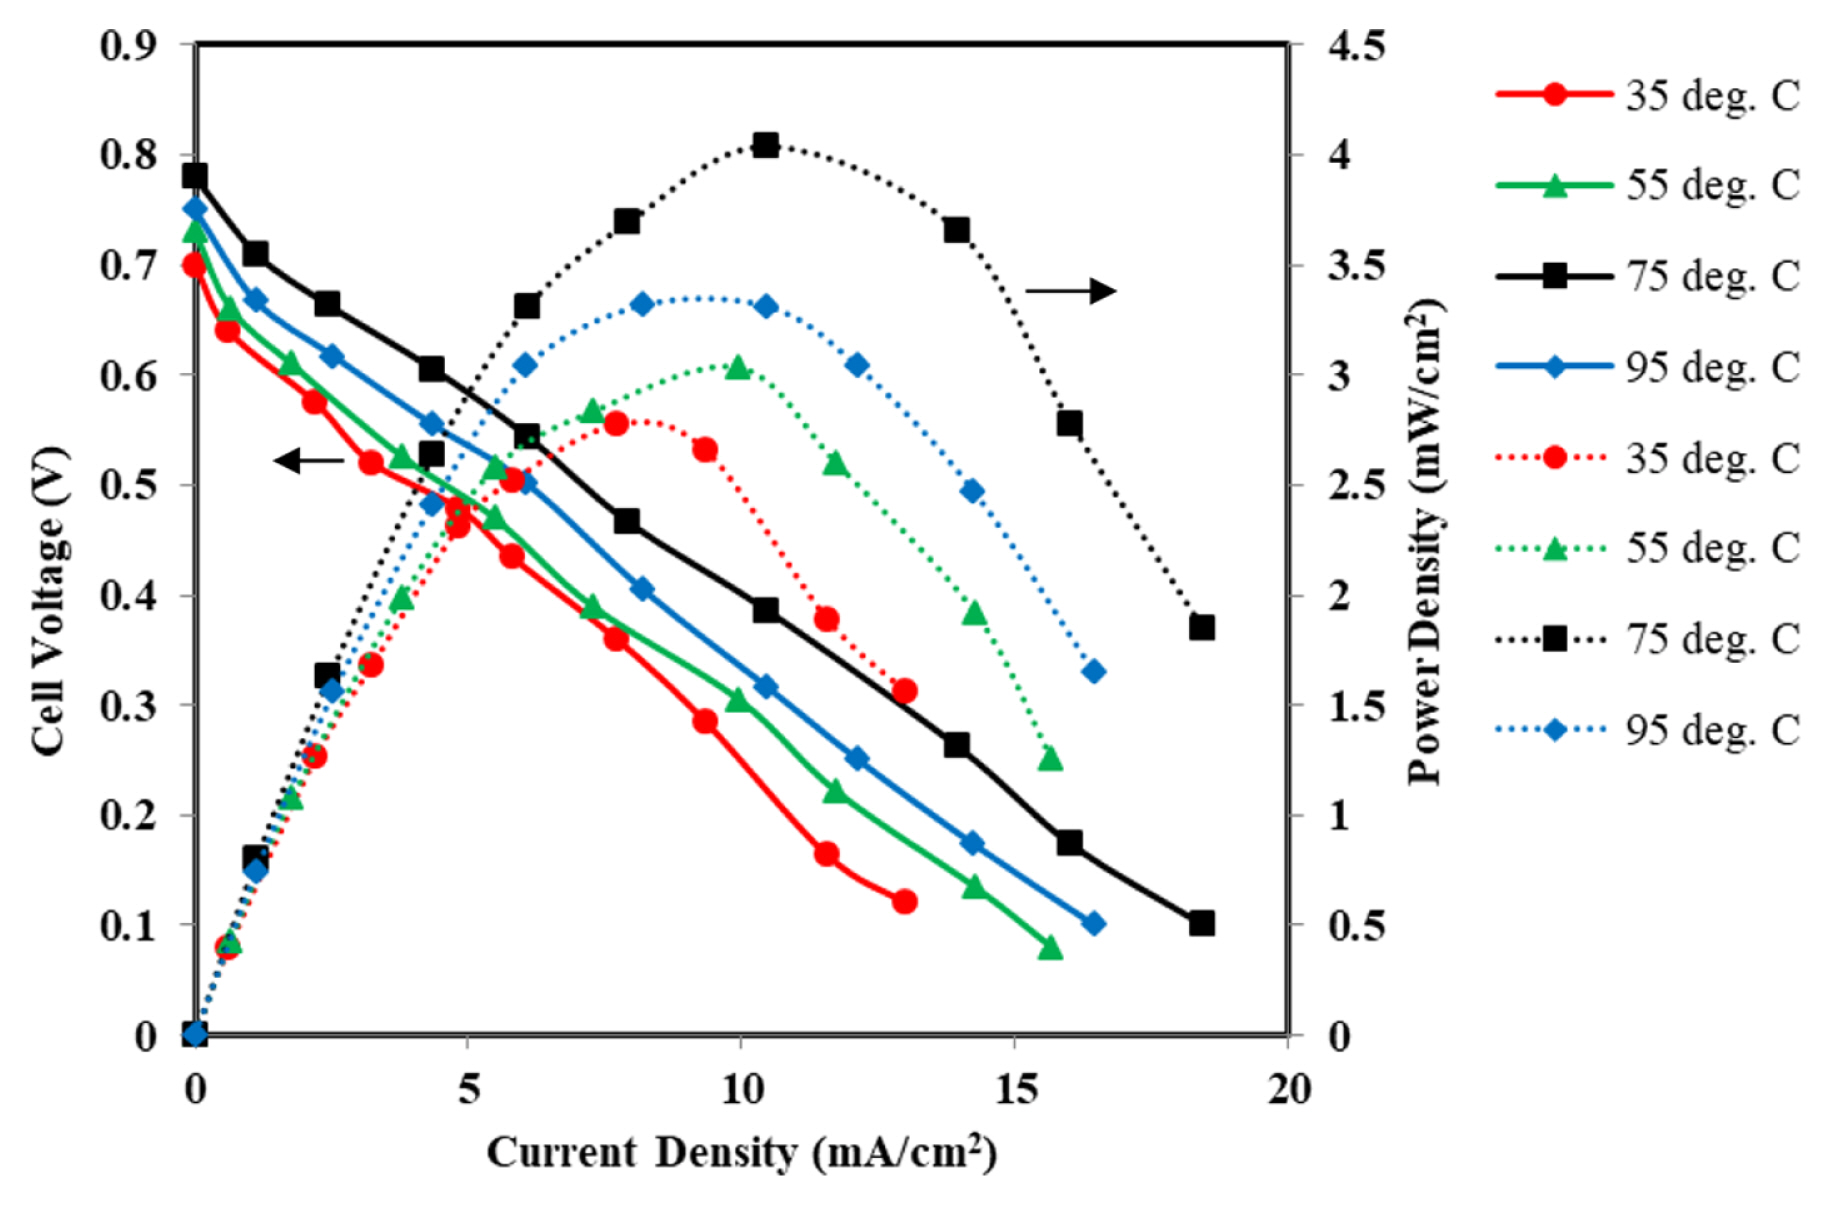
Fig. 13 shows the polarization and power density curves of MFC for the varying temperature from 35┬░C to 95┬░C. The maximum cell temperature of 95┬░C was maintained keeping in mind the boiling point (100┬░C) of water and avoid two phase flow which would hinder the flow dynamics in the microchannel. The OCV increases from 0.70 V to 0.78 V when the cell temperature is increased from 35┬░C to 75┬░C. However, the OCV get decreased to 0.75 V for the MFC temperature of 95┬░C. It may be due to an increase in water vapor partial pressure, which accelerates the vaporization process of solution, despite the boiling point of water increases by the presence of KOH [29]. The maximum power density of 4.03 mW/cm2 at a current density of 10.47 mA/cm2 was obtained from MFC. The maximum power density of MFC at room temperature (35┬░C) was little low, i.e., 2.77 mW/cm2 at a current density of 7.71 mA/cm2. The power density increased by 45.48% for the rise in cell temperature from 35┬░C to 75┬░C. The increase in temperature improves the electrooxidation rate of glycerol molecules at the electrode surface resulting in high current density due to better reaction kinetics [65]. The ionic conductivity of the electrolyte solution and its mobility also increases [66], which reduces the ohmic resistance.
4. Conclusions
Acetylene black carbon supported bi-metallic anode electrocatalysts Pd-Pt/C with varying weight ratio, namely 16:4, 10:10 and 4:16, and Pd/C are prepared by impregnation reduction method. The electrocatalyst Pd-Pt (16:4)/C resulting in highest electrocatalytic activity towards glycerol electrooxidation in alkaline medium (KOH as electrolyte). The XRD analysis shows that the lattice parameter of bimetallic electrocatalyst is in between the pure Pd (0.3890 nm) and Pt (0.3929 nm) particles. TEM analysis confirms that the electrocatalyst is in nano range. SEM analysis shows the surface morphology is uniform and EDX confirms that the electrocatalyst is reduced properly, and desire metal particles are present in the catalyst. In Half-cell and MFC studies, the effect of different parameters on electrooxidation behavior of glycerol was investigated using Pd/C and bimetallic Pd-Pt/C electrocatalyst. Pd-Pt (16:4)/C shows better electrochemical activity with reference to current density and peak potentials. Laboratory fabricated airbreathing microfluidic fuel was used to study the single cell experiments at a low-temperature 35 ┬░C. The dimensionless numbers predicted the laminar flow behavior of the anode and cathode streams both within flow channels reasonably well. The cell performance is significantly improved due to the increase in temperature from 35┬░C to 75┬░C. The fuel concentration 1.0 M and electrolyte concentration of 1.5 M was found optimum. The maximum cell performance was obtained at 75┬░C with OCV 0.78 V, power density 4.03 mW/cm2 at a current density of 10.47 mA/cm2.