1. Introduction
One of the major environmental issues faced by textile industries is the treatment of dye effluent before discharge. Textile industries use a large amount and varieties of dye characterized by a high content of aromatic compounds and carcinogenic materials [1]. The conventional methods of treating dying house effluents are becoming inadequate due to the complexity of the composition of the wastewater [2].
Various techniques such as adsorption [3],Chemical Precipitation [4], Ion Exchange [5],Reverse Osmosis [6], Photo-Fenton processes [7],Photo Catalysis [8],Electro-Oxidation[2] and Ozonation[9] have been used for the treatment of dye effluent. Chemical Precipitation is widely used among these techniques, but excessive coagulant material and a large amount of sludge formation are its disadvantages [10].To overcome these disadvantages, Electrocoagulation (EC) technique has been used because of its ease of operation, low sludge production, no use of chemicals, and no secondary pollutant formation [11–13].
In EC metallic hydroxide, flocs are generated within the wastewater by the dissolution of sacrificial anode for treatment [14].Many works have been reported for the removal of heavy metals [15],Oils [16], Phenolic compounds [17] and other contaminants from pharmaceutical effluents [18], Dairy Processing and Slaughterhouse effluent [19],Tannery wastewater[20],Pulp and Paper industry effluent[20, 21], Printing Industry effluent [22] and Textile wastewater [23, 24] using electro coagulation.
To improve the performance of EC, the number of electrodes in monopolar or bipolar configuration may be increased as more number of electrodes will result in more electrode surface area leading to the higher current through electrodes which in turn increases the release of more number of ions and hydroxyl ion flocs aiding the adsorption of dye molecule [25].
This type of configuration has been tried by very few researchers for dye removal [26,27], and also very few works have been explored in both batch and continuous modes of treatment [28,29]. Also, the use of food-grade aluminium foil as a sacrificial anode has not been reported so far. Hence in this study, the use of waste food grade aluminum foil and mild steel as a sacrificial electrode for wastewater treatment was explored. Also, the performance of monopolar and bipolar electrode configurations as a function of current density, pH, and operating time on COD and Color removal from Reactive Red 111 was carried out in both batch and continuous modes. Further, energy and electrode consumption was also calculated.
2. Materials and Methods
2.1 Experimental setup
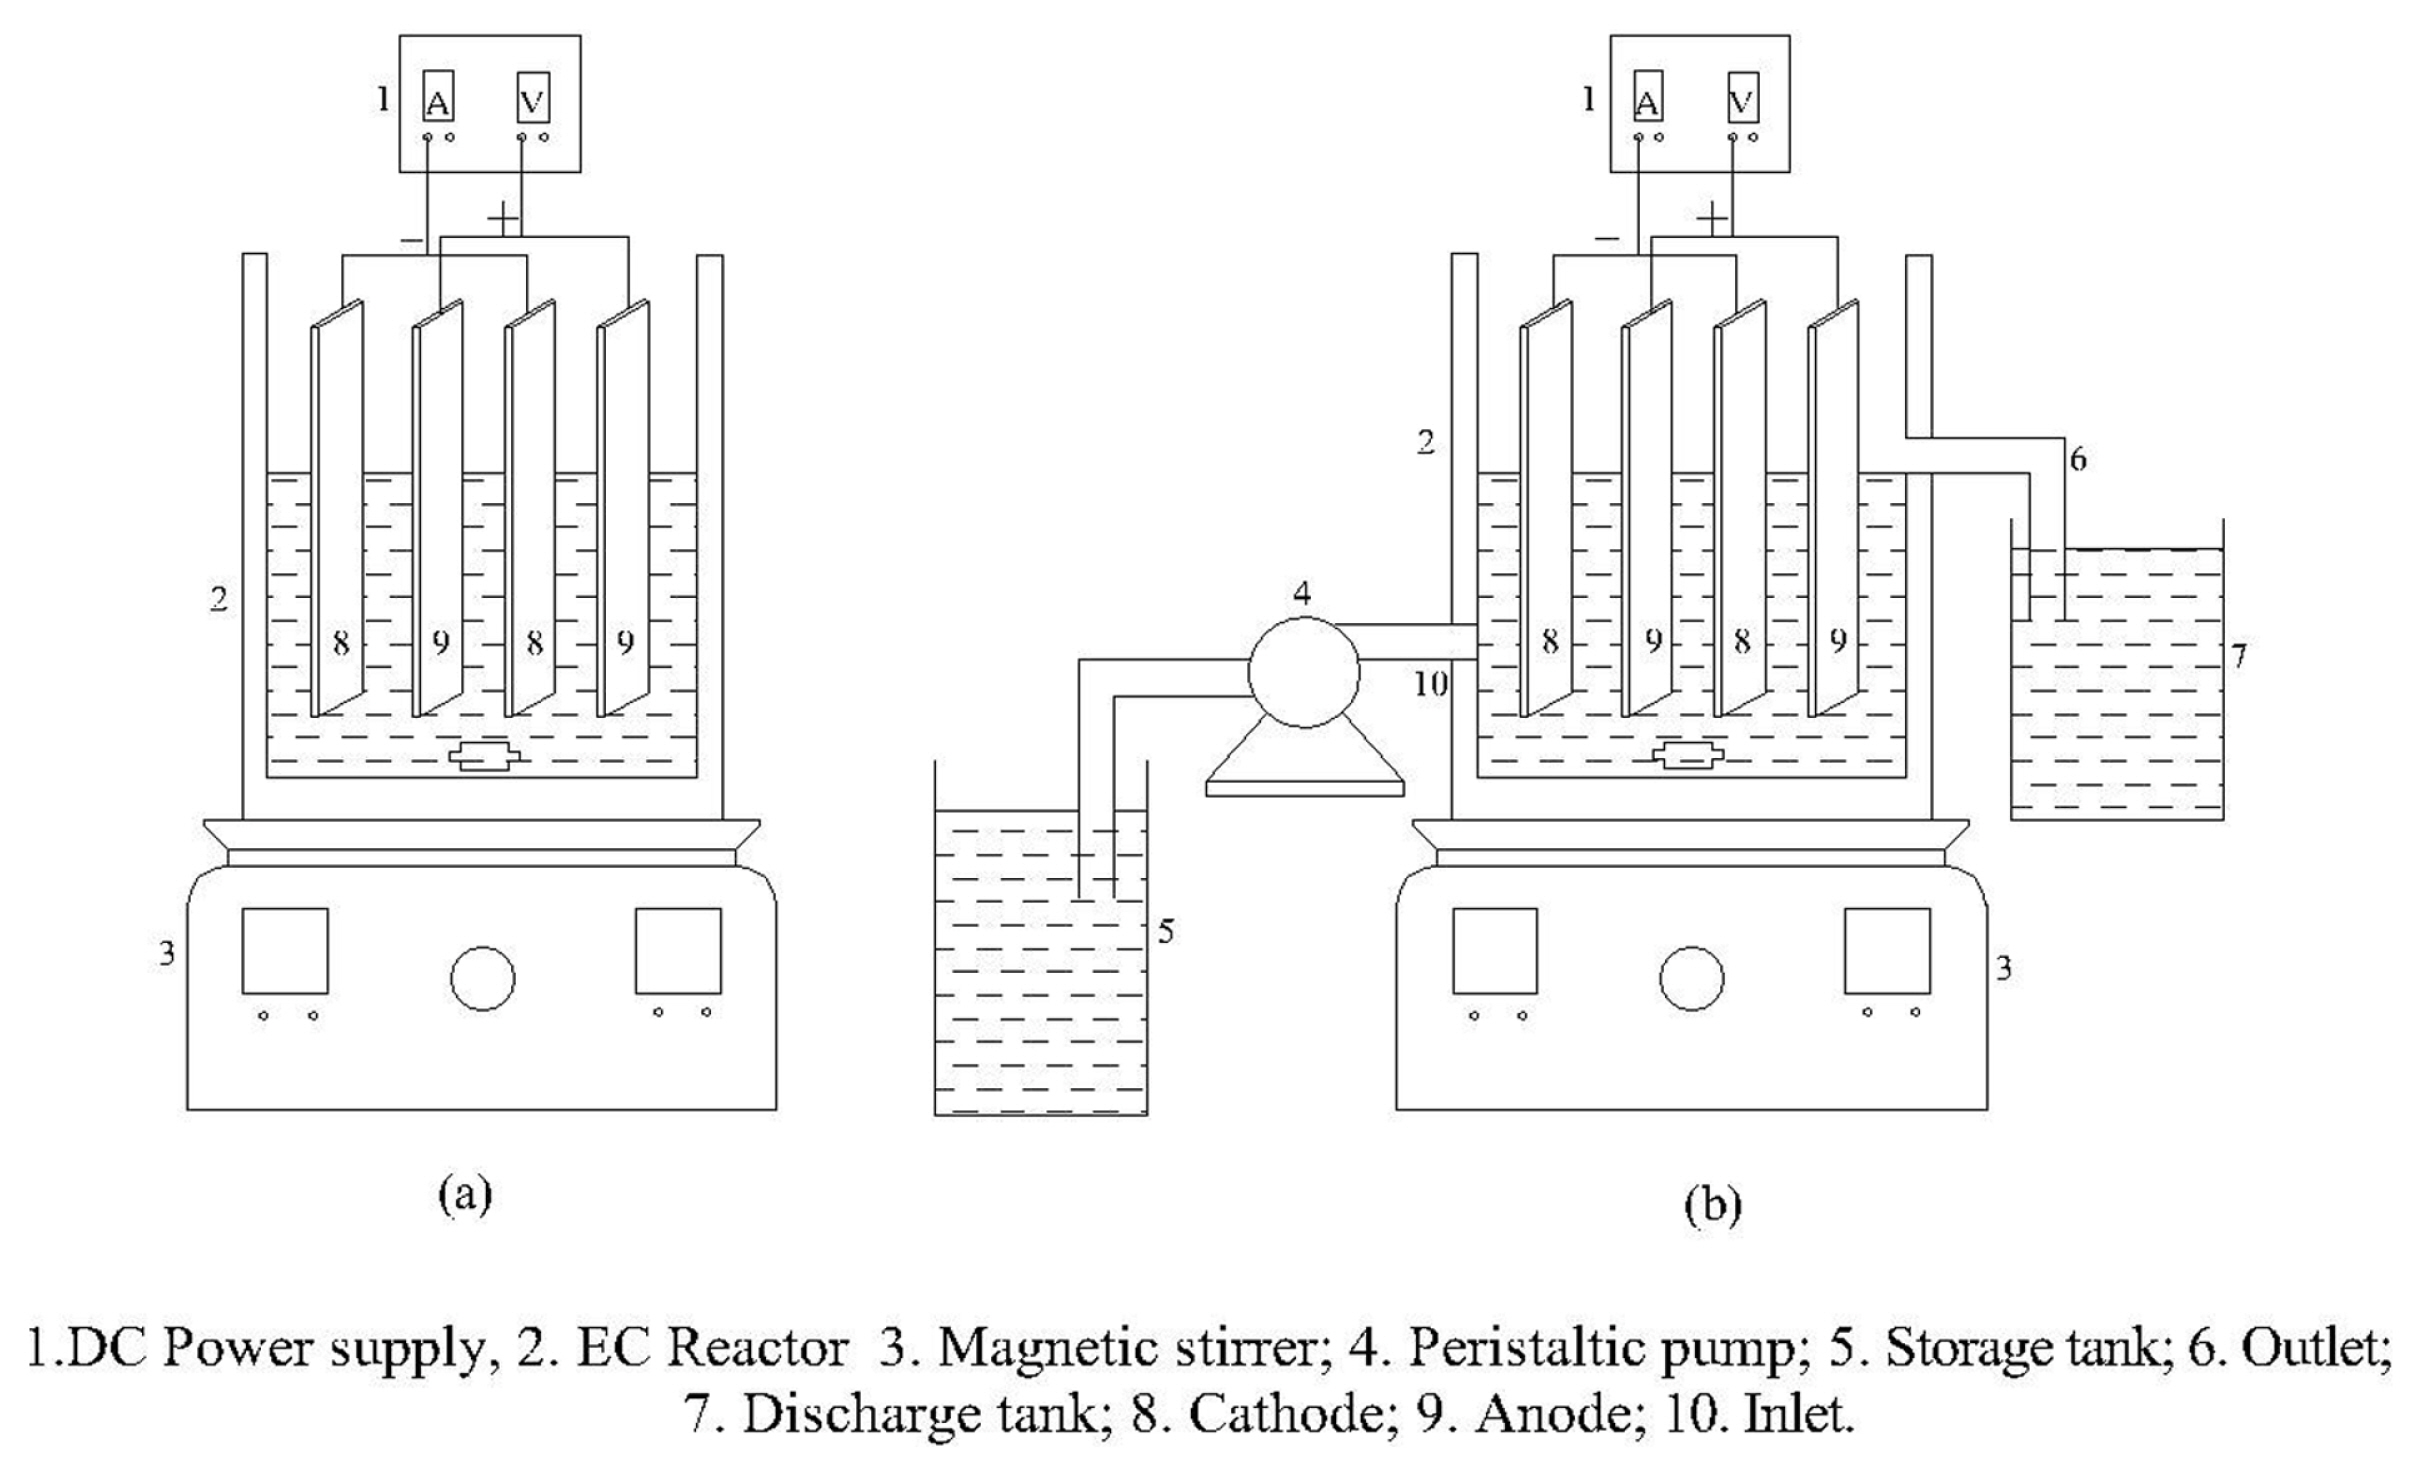
Electrocoagulation experiments were carried out in a 0.5 L glass electrochemical reactor, stirred at 300 rpm using magnetic stirrer as shown in Fig. 1. Electrical DC power supply (METRONIC model ME-305A, 0–5A and 0–30 V) and waste food grade aluminium foil, Fe and stainless steel (SUS 304) plates (35 mm × 50 mm × 2 mm) as electrodes with the cross-sectional area of 17.5 cm2 were used for the study. An inter-electrode space of 1 cm for both monopolar and bipolar arrangement (four anodes and four cathodes) was maintained. In a continuous electrochemical reactor, the inlet flow rate was controlled using a digital peristaltic pump (Micilins India PP-10-EX peristaltic pump). The different operating parameters range, considered for the EC process are pH (3–9), initial dye concentration (50–300mg/L), electrode connection mode (monopolar and bipolar), current density (2–10mA/cm2), and detention time (5–45 min).
Reactive Red 111 stock solution (1000 ppm) was prepared using distilled water. 0.1M HCL and NaOH were used to adjust the initial pH of the dye solution. NaCl was used as a supporting electrolyte. Conductivity and pH of dye solution were measured using a conductivity meter (INFRA DIGI model IR503 B) and digital microprocessor pH meter (Roy instruments model IR501A) respectively.
2.2 Reaction mechanism
The main reaction mechanism involved in the electrocoagulation process is as follows [30]:
The chemical reaction at the anode:
For Aluminium
For Mild steel
The chemical reaction at the cathode:
For Aluminium
For Mild steel
Overall reaction:
For Aluminium
For Mild steel
At the anode, oxidation of sacrificial electrode produces Al3+/Fe3+ ions, which combines with hydroxyl ion (OH−) generated at cathode to form Al(OH)3/ Fe(OH)3 compound. The dye molecule present in the electrolyte is thus removed through precipitation and adsorption by Al(OH)3/Fe(OH)3 coagulant molecules formed by the EC process. The easy removal of flocculated particles was aided by the hydrogen gas generated at the cathode.
2.3 Analytical procedure
The UV spectrophotometer (Hitachi U3210, Japan) was used to analyze the dye concentration at 450 nm. The measurement of COD was done using the closed reflux colorimetric method. To calculate the electrode consumption, the weight of the electrode was measured before and after each run.
COD and color removal percentage were determined by the following equations
Where Ci and Cf are initial and final dye concentrations and CODi and CODf are initial and final COD respectively.
Energy consumption and electrode consumption were evaluated as
Energy consumption (kWh/kg of COD)
Where V= voltage, I= Current (A), t = time (hr), VR = volume of the reactor (ml), MW = Molecular mass of Fe & Al (g/mol), F = Faradays constant (96485C/mol), Z = number of electrons transferred and V = volume of dye effluent (m3).
3. Results and Discussion
Experiments were carried out in a batch mode (500ml capacity) and continuous mode with waste food grade aluminum foil /mild steel as a sacrificial anode to treat reactive red 111 dye effluent under gal-vanostatic conditions. The effects of various parameters pH, initial dye concentration, electrode connection mode (monopolar and bipolar), current density, and time on the removal of reactive red111 were investigated. All the experimental values are presented in Tables and Figures and discussed below.
3.1 FTIR analysis of dye effluent and sludge
The Infrared absorbance of the dye molecules before treatment and the dye molecule adsorbed onto sludge obtained after electrocoagulation is shown in Fig. 2. It can be observed from these spectra that, some structural changes have taken place. The peaks from 3400 to 3100 cm−1 were due to N-H stretching as well as absorbed water content. The peaks at 1754, 1132, 3000 - 2840 cm−1 and 1350 – 1390 cm−1 corresponds to C=O, C-O, C-H and OH stretching. The peaks from 1500 to 1550 cm−1 were due to the presence of the nitro compound. The peaks at 979, 908 and 844 cm−1 were due to alkene (C=C) bending and peaks at 744, 630 and 530 cm−1 were due to C-H bending [31]. It may be confirmed from the peaks obtained for untreated dye solution and sludge that, the dye degradation has taken place and removed as sludge resulting in color and COD reduction.
3.2 Effect of Electrolyte Concentration on color Removal
The percentage of color removal for change in the concentration of the electrolyte is shown in Fig. 3. It can be observed that there is an increase in percentage color removal with an increase in electrolyte concentration. This may be due to the flow of high current at higher electrolyte concentration resulting in the formation of aluminium and iron hydroxide coagulants. Also, the formation of hypochlorite ion at the anode may have degraded the dye molecules by oxidation thereby increasing the overall performance [32]. However, an appreciable increase in color removal was not observed when the electrolyte concentration was increased beyond 3 g/l for both the electrodes. Hence, further experiments were carried out using 3 g/L as an optimum electrolyte concentration.
It can also be observed that Fe shows higher color removal than the Al electrode. The reason may be when Al is used the reaction mixture is alkaline resulting in the generation of sodium aluminates. Compared to aluminium hydroxide these aluminates are weaker coagulant, Also it is reported that the dissolution of the Al electrode is higher than the theoretical value obtained by Faraday's laws for aluminium electrode resulting in high sludge production [33].
3.3 Effect of current density on COD removal
Current density affects the percentage COD removal as it determines the coagulant amount, rate of hydrogen bubble formation, and floc growth as well as size. Hence the variation in percentage COD removal of dye at different current densities was studied and presented in Fig. 4. It can be observed from the figure that for both the electrodes there is a sharp increase in percentage COD removal at the lower time (≤ 30min). This increase may be due to a high anode dissolution rate at the initial stage resulting in more metal hydroxide flocs. Also, the formation of smaller bubbles observed at higher current density was beneficial for the separation process [34]. It was clear that the performance of Iron electrodes is better than aluminium foil.
Further, at a higher time (>30 min not shown) no appreciable increase in COD reduction, with an increase in current density was observed. This may be due to the prevalence of insufficient metal hydroxide for pollutants to settle. In other words, as time passes there is very low dye concentration remaining resulting in a decreased rate of adsorption of the dye on to the flocs despite constant floc generation rate at constant current density [35,36]. Hence an optimum current density of 6 mA/cm2 was taken for all the experiments.
3.4 Effect of pH on COD removal
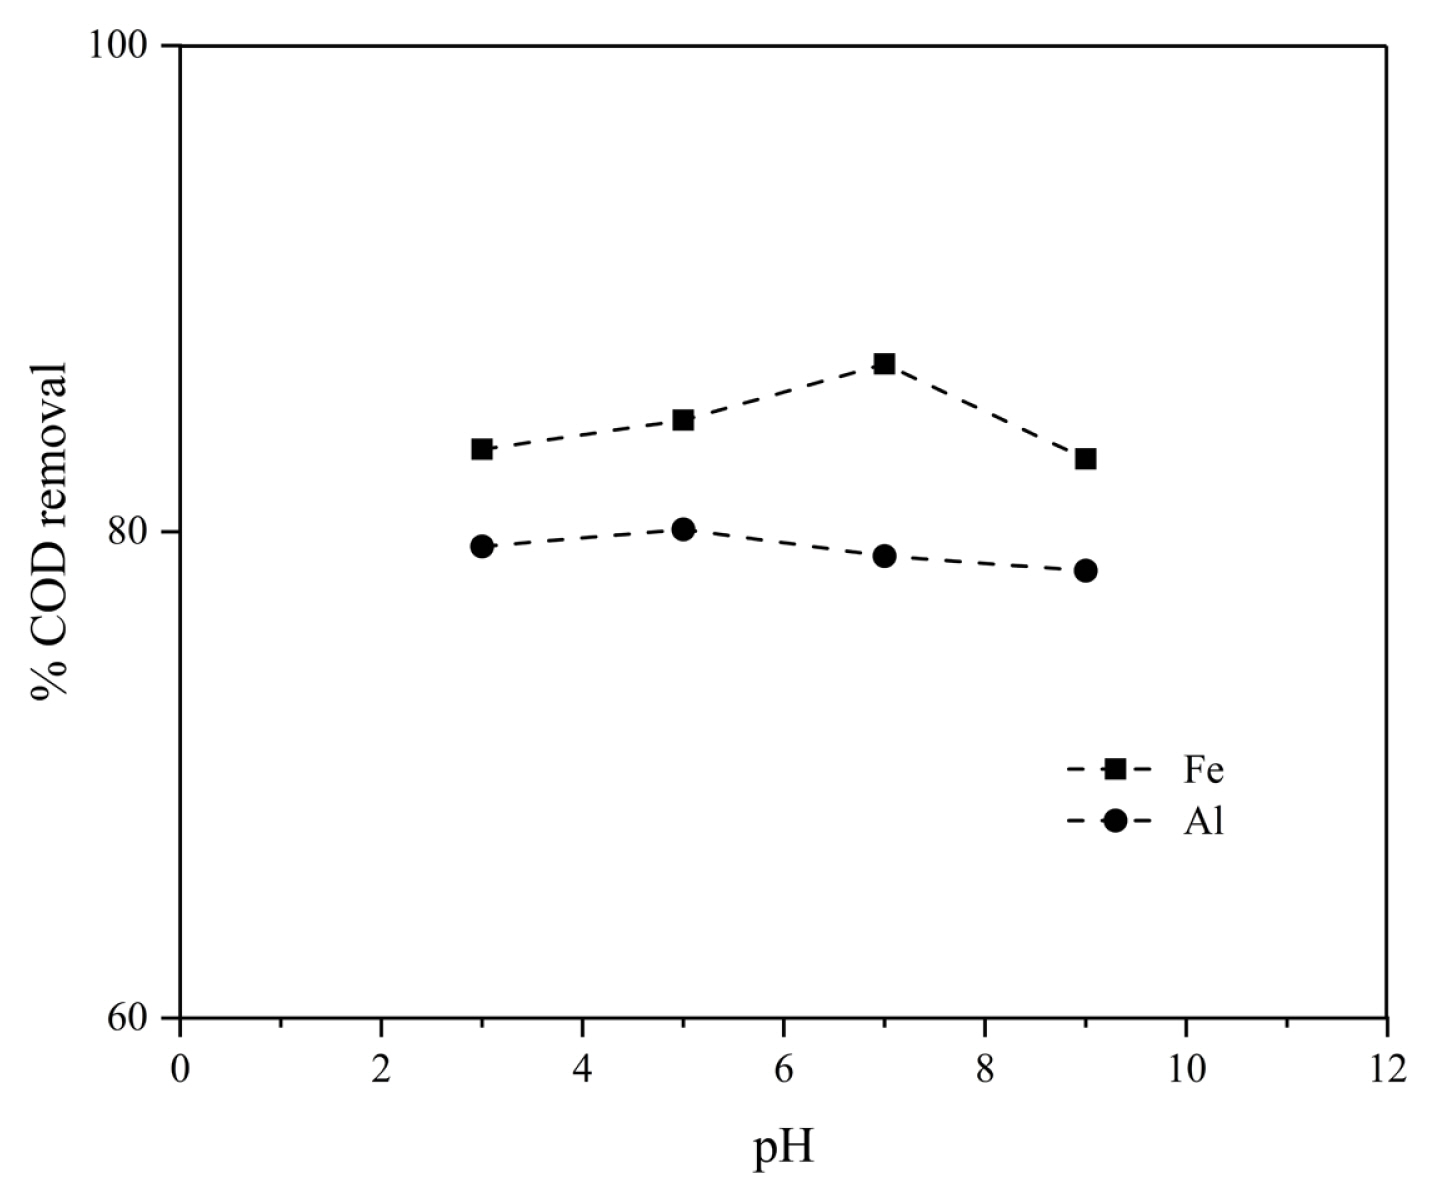
The effect of pH (3–9) on dye removal was studied and the results are shown in Fig. 5. It can be observed that, for the iron electrode increase in the pH of the solution (up to 7), the formation of Fe(OH)3 flocs increased resulted in high COD removal by complexion and coagulation. However, beyond 7pH, there is a decrease in COD removal which may be due to the solubilization of Fe(OH)3 to form Fe(OH)4− which reduces the adsorption of dye [37] at higher pH (> 7 pH).
In the case of aluminium foil as an electrode, maximum COD removal was obtained at pH 5. At this pH, the formation of monomeric ions (Fe(OH)4−) and precipitated Al coagulant enhanced the removal. Beyond pH >5, the COD removal decreases this may be due to the dissolution of aluminum hydroxide at high pH which in turn reduces the adsorption of dye onto the flocs [38].
3.5 Effect of the initial concentration of dye on COD removal
The effect of the initial concentration of dye on COD removal percentage for mild steel and aluminium foil as a sacrificial anode using optimum current density, residence time, and pH obtained previously is illustrated in Fig. 6(a) and 6(b) respectively. It can be observed from the figure that the COD removal percentage increases with an increase in time for both the electrodes.
The figure shows that there is a decrease in COD removal (from 91.3% to 74.5% and 84.3% to 64.8% for mild steel and aluminium foil anodes respectively) as the initial concentration is increased from 50 mg/L to 300 mg/L for both the electrodes.
This result is in agreement with studies, who have reported that the dye removal efficiency decreased with increasing initial dye concentration [22,39–40]. The reason may be, at any given time and current density, the amount of coagulant generated is fixed for all concentrations according to Faraday’s law.
Further, the mechanism by which the dye is removed here is adsorption. The amount of metallic ions generated is fixed irrespective of the concentration of the dye for fixed operating conditions and reaction time. Hence there is a gradual decrease in percentage COD removal as the dye concentration is increased indicating that when the initial concentration of the dye increases the adsorption capacity of the floc becomes exhausted.
3.6 Effect of electrode configuration and Energy consumption
To compare the performances of monopolar and bipolar electrode configurations on COD removal, experiments were carried out at optimum conditions (current density 6 mA/cm2, 30 min and pH 7 for Fe and 5 for Al,) and results are shown in Fig. 7(a) and 7(b) for Fe and Al respectively. It can be observed from the figure that the maximum COD removal (96.5% and 92.1% for Fe and Al electrodes respectively) was obtained for monopolar 4 electrodes configuration compared to bipolar and monopolar 2 electrodes configuration.
This may be because the effective electrode surface area for passing current in monopolar 4 electrodes configuration is double the monopolar 2 electrodes and bipolar electrodes configurations. At constant current density, higher current passes through the electrodes in monopolar 4 electrodes configuration compared to the other two configurations causing the release of more metal ions (Al3+& Fe2+) and hydroxyl ions thereby enhancing the production of more flocs which in-turn increases the COD removal [35].
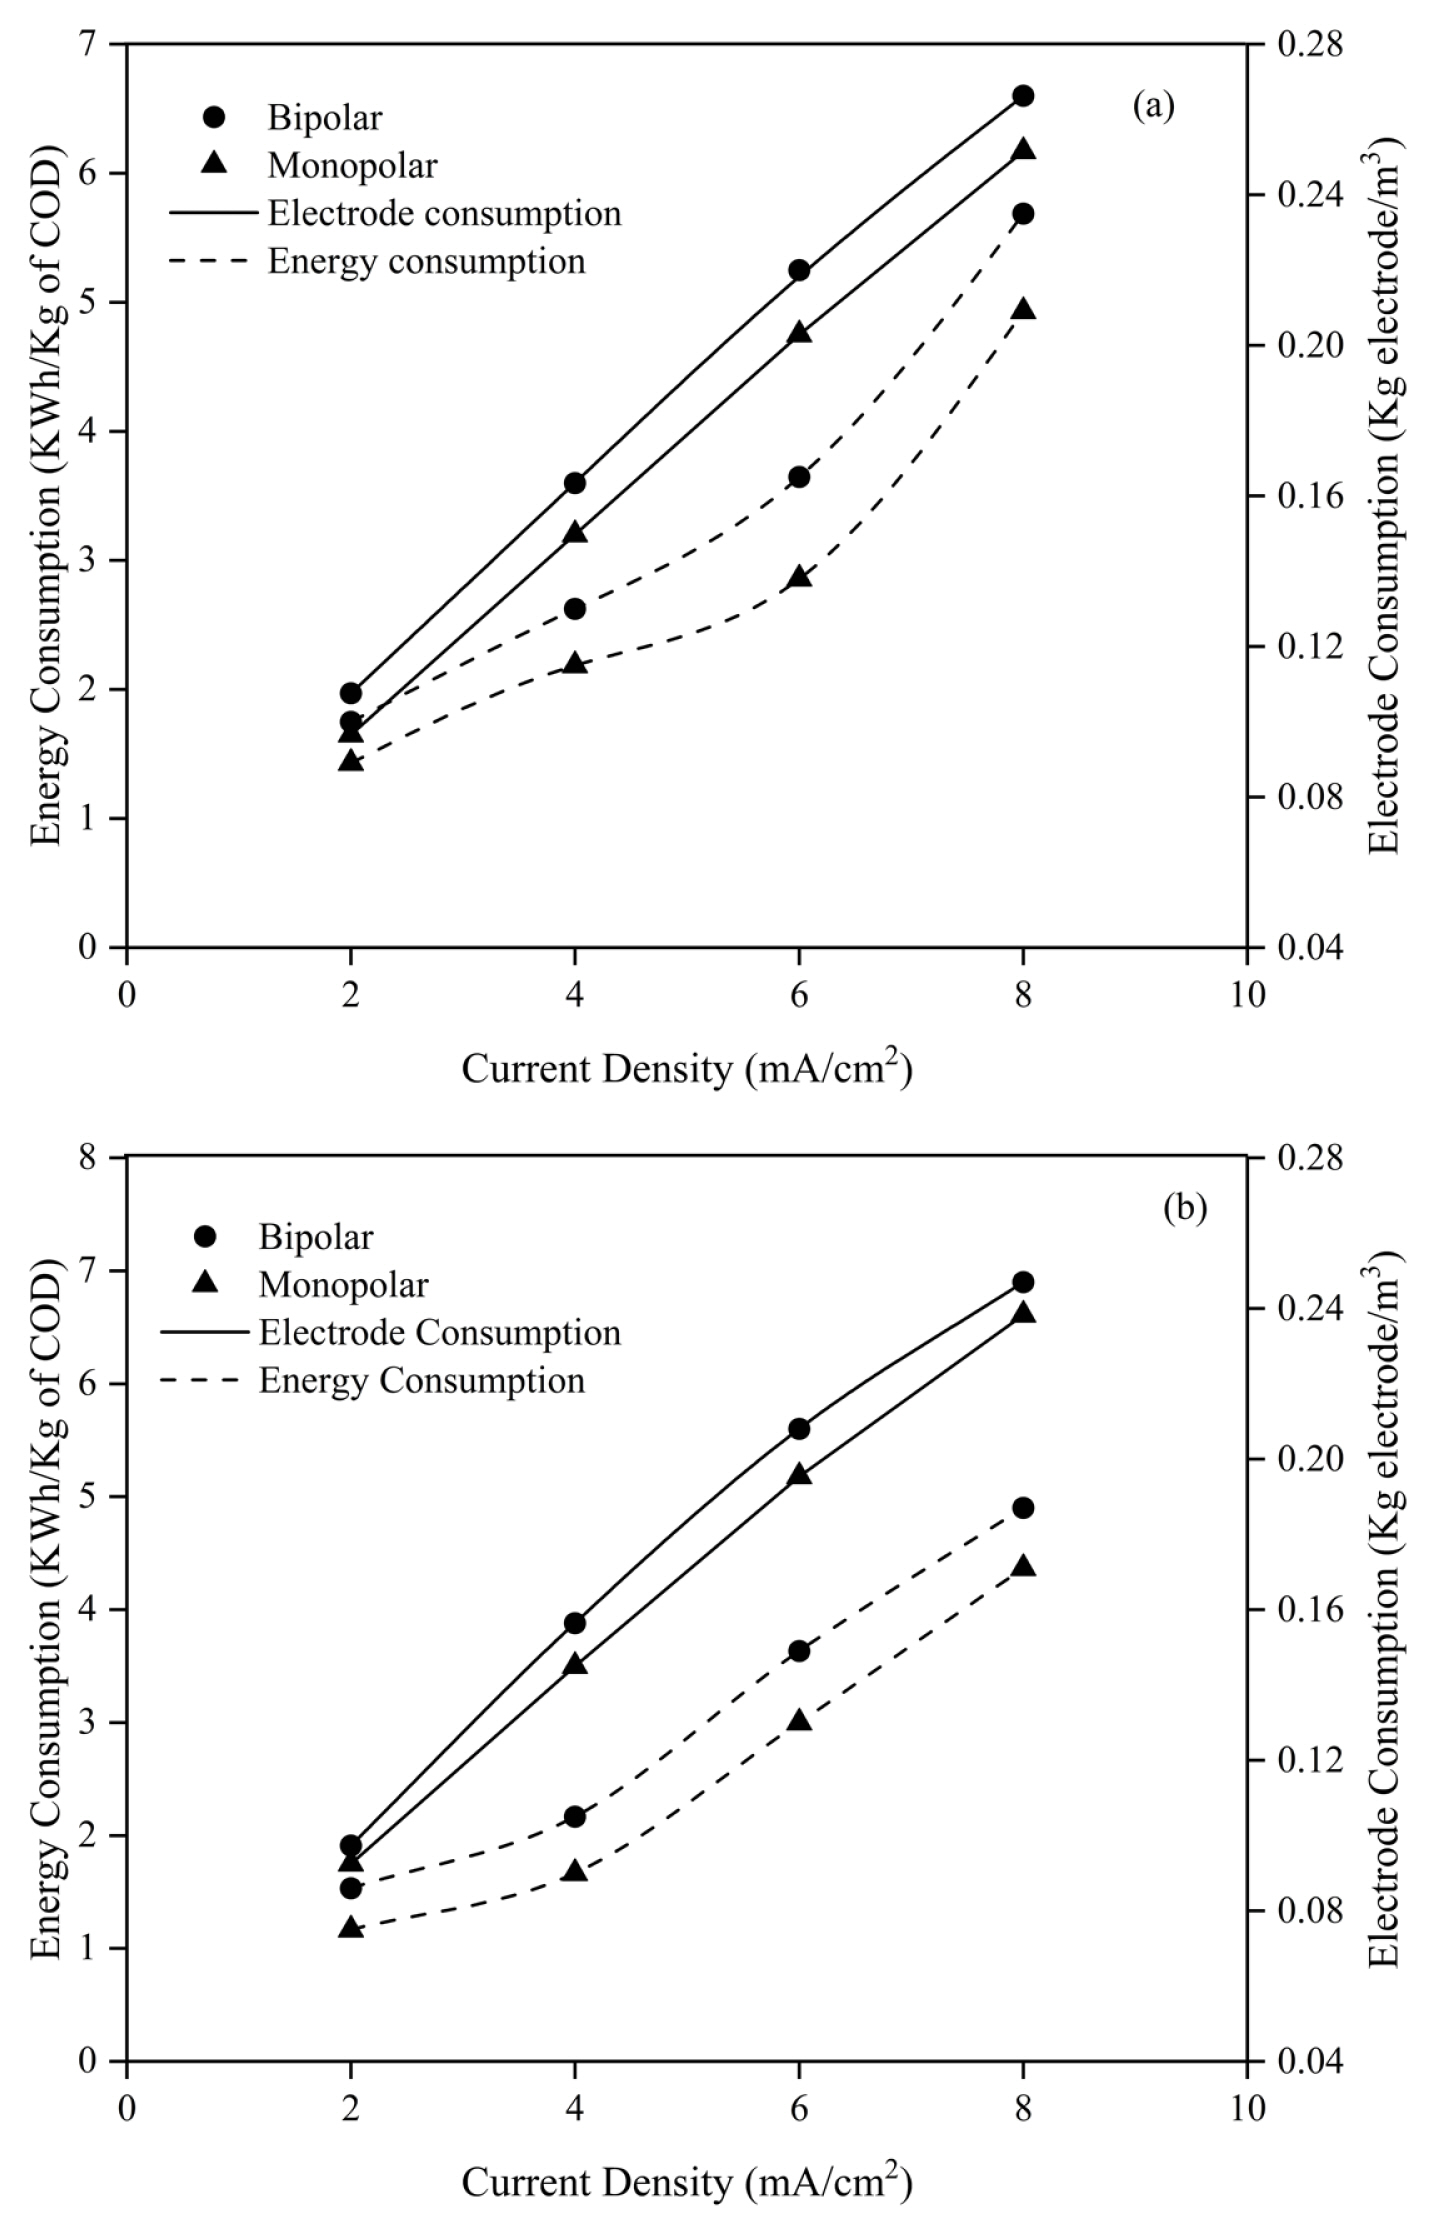
Fig. 8(a) and 8(b) shows the energy and electrode consumptions calculated for both the configurations. It can be ascertained from the figures that the energy consumption is lower for monopolar configuration (2.95 and 2.8 kWh/kg of COD for Al and Fe electrodes respectively) compared to the bipolar configuration (3.7 and 3.62 kWh/kg of COD for Al and Fe electrodes respectively) at optimum current density. This may be due to the higher voltage values for bipolar electrode configuration at constant current density when compared to monopolar because the potential difference between the electrodes for bipolar connection mode is higher than monopolar connection mode for both the configurations [26].
3.7 Effect of residence time for different flow rate on percentage COD removal
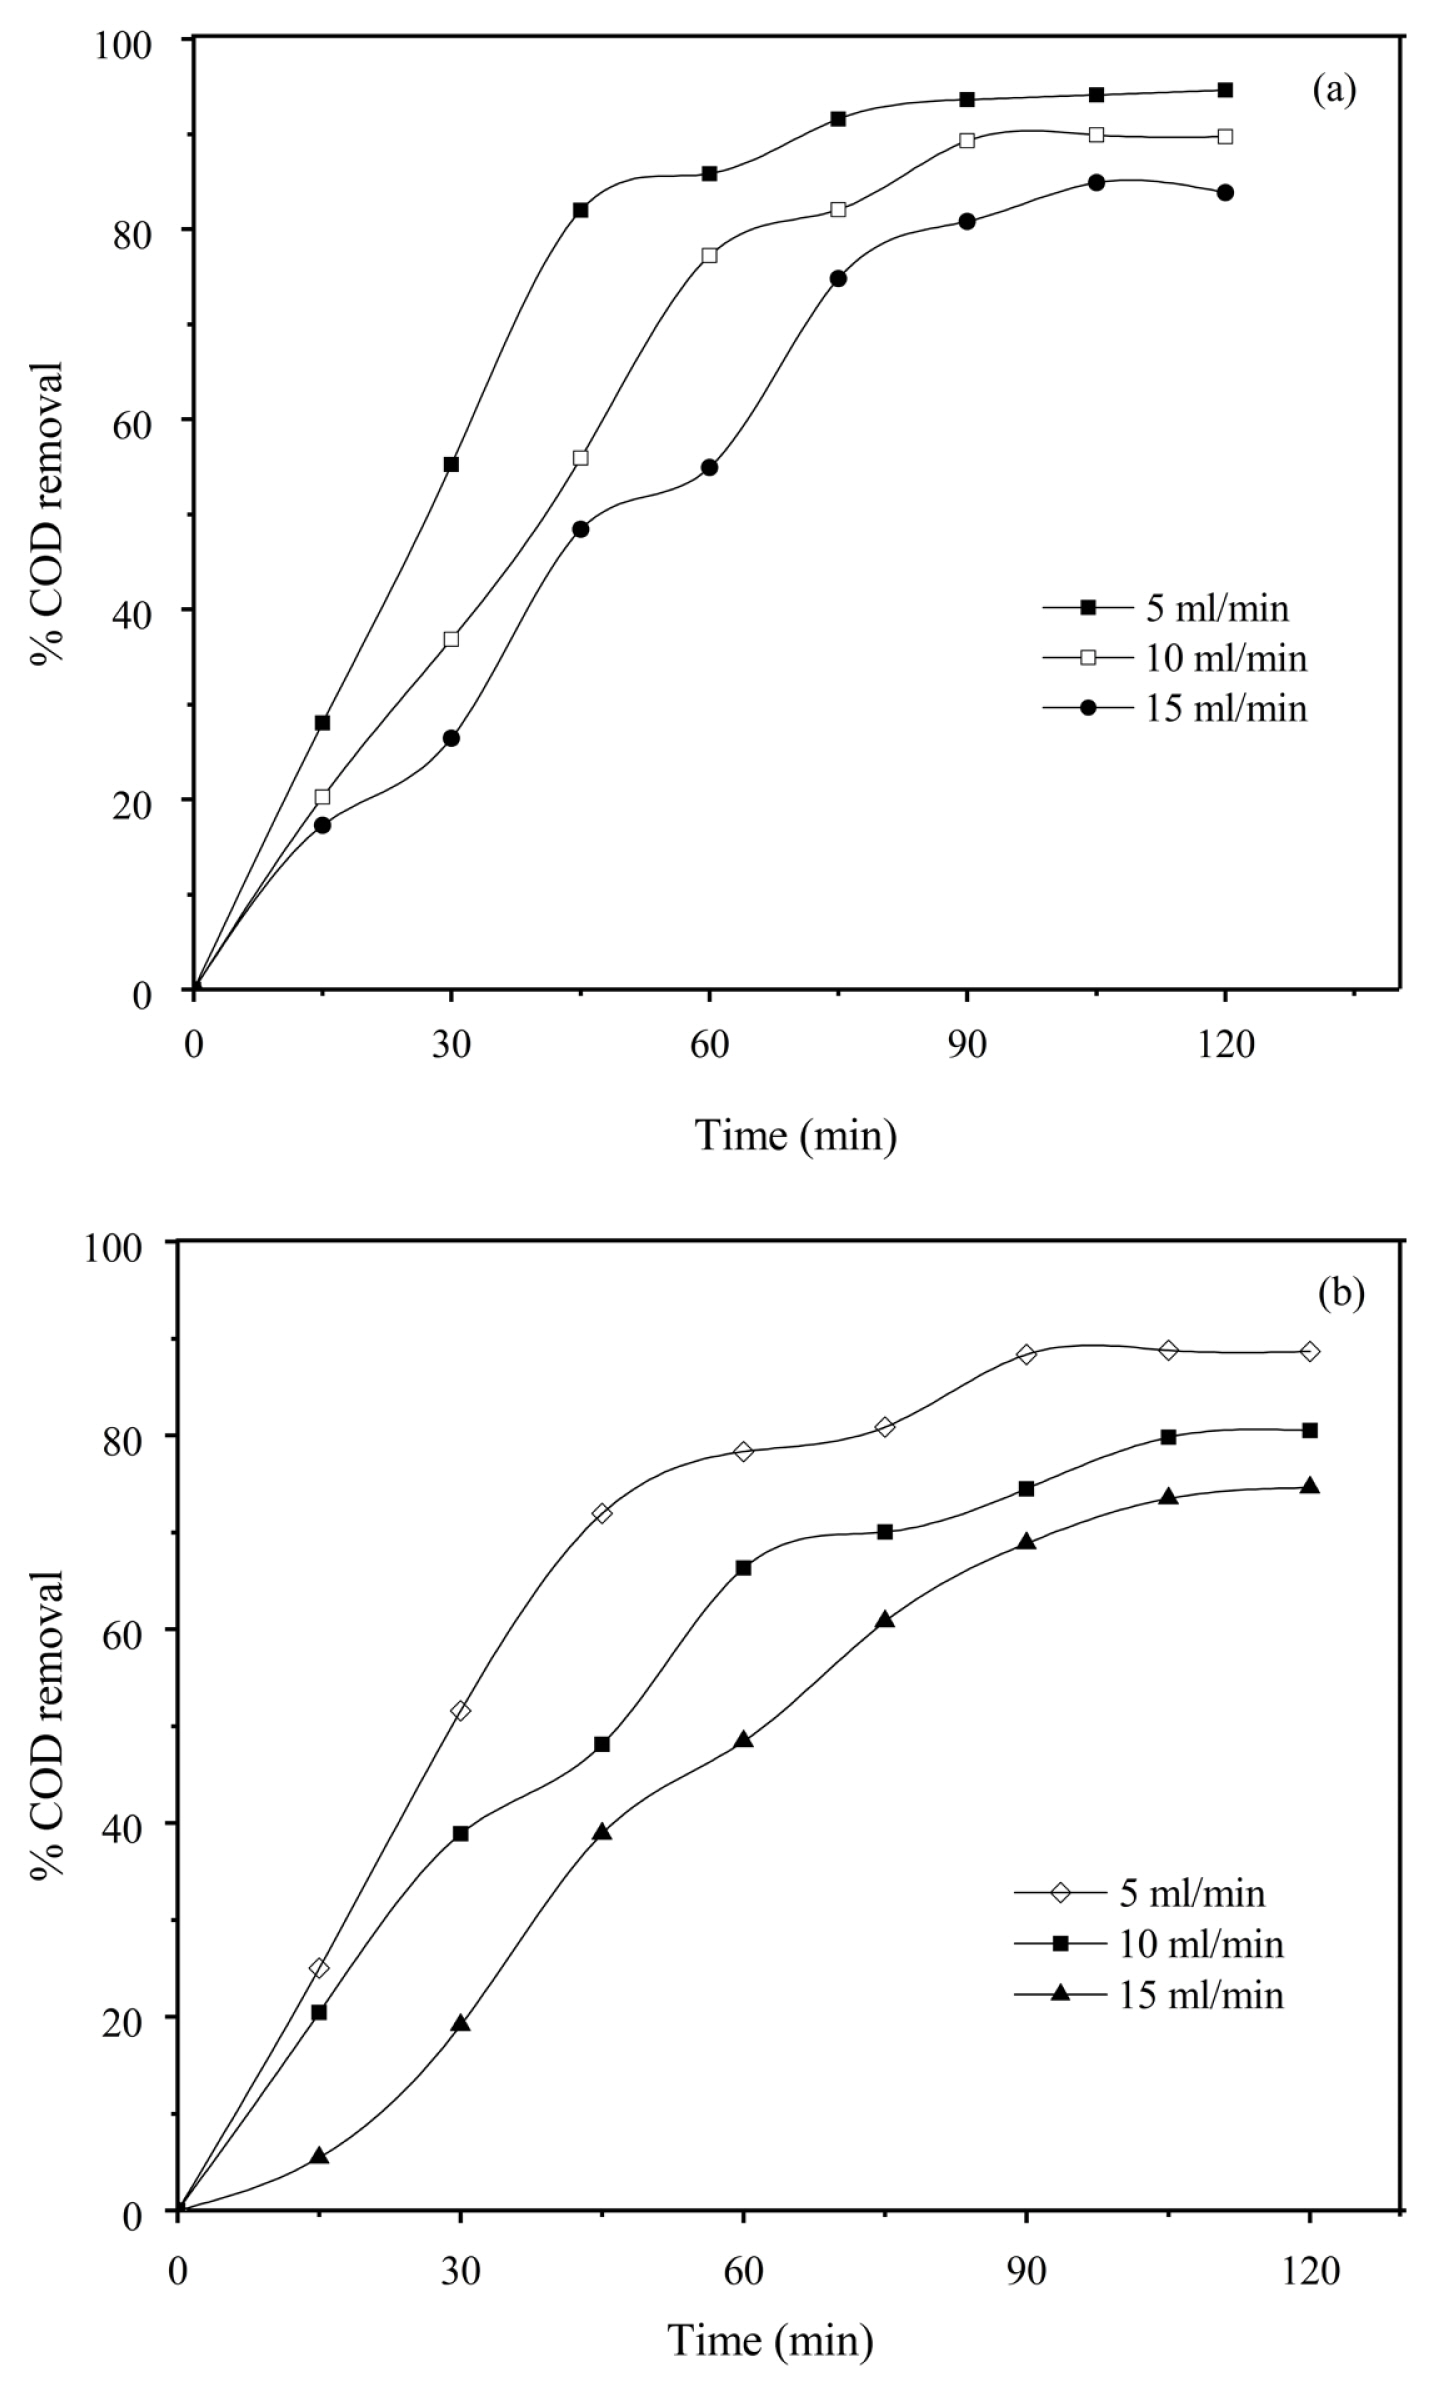
The effect of residence time for different flow rates on COD removal was studied and the results are shown in Fig. 9(a) & 9 (b). It can be inferred from the figure that the COD removal decreased with an increase in flow rate from 5 to 15 mL/min. This decrease is because the contact of pollutants with the coagulant generated is less as the flow rate is increased also more bubbles and flocs are produced. Also, the percentage of COD reduction increased with an increase in time (up to 90 minutes) but beyond 90 min no appreciable increase in COD removal was observed for all flow rates. At equilibrium, almost all dye molecules in the bulk solution are absorbed by monomeric and polymeric aluminium hydroxides [5].
3.8 Adsorption isotherms
The adsorption of dye molecules onto the flocs can be explained by Langmuir, Freundlich and Temkin isotherm models. It is assumed that in EC, the pollutant is adsorbed onto the flocs to form a precipitate. The adsorption isotherm can be explained as follows:
3.8.1 Langmuir isotherm
In Langmuir isotherm, it is assumed that mono-layer adsorption of pollutants occurs onto the adsorbent. The linearized expression is given by
Where Ce= the dye concentration (mg/L) at equilibrium, qmax= adsorption capacity (mg/g) and b =energy of adsorption (L/mg) and qe= equilibrium adsorption capacity (mg/g).
3.8.2 Freundlich isotherm
Freundlich isotherm gives the adsorption intensity of the adsorbate onto the adsorbent. This isotherm gives the reversible adsorption of sorbent with multi-layer formation. The mathematical expression is
Where, the constants K and n are adsorption capacity and adsorption intensity respectively. The linear form of this isotherm is
Where Freundlich constant is kf, the intensity of adsorption or energy is ‘n’, and concentration of dye (mg/L) at equilibrium and at a time are given as Ce and C respectively.
3.8.3 Temkin isotherm
Temkin suggested the following equation
Where A and B are the Temkin constants and
B = R T b
The adsorption isotherm parameters calculated from the experiment were compared with the results predicted from the three isotherms (Table 1). From the comparative analysis, it was found that the regression coefficient R2 for Langmuir was high compared to others.
3.8.4 Kinetic studies
Using the adsorption phenomenon, the modeling of dye removal can be done by estimating the amount of coagulant for a given time as in Eq. 15.
Where qt is the amount of dye adsorbed at any time t, m is the weight of electrode dissolved, V is the volume of effluent taken, CODo is the initial COD and CODt is COD at time‘t’.
Using pseudo-first and pseudo-second-order kinetic models the kinetics of Reactive Red 111 removal was investigated. The pseudo-first-order reaction kinetic model is given by the following equation
Where qt and qe represent the amount of dye adsorbed at a time ‘t’ and equilibrium respectively, k1 is the rate equilibrium rate constant.
The linear form of the above equation is
Similarly, the pseudo second-order kinetic equation can be written as
Where k2 is the equilibrium rate constant. The linear form of this Eq. 18 is
The parameters evaluated for both models are tabulated in Table 2. It can be observed that the pseudo-second-order models fitted well with the experimental data. Also, the linear regression R2 was higher for the pseudo-second-order model which indicates that the adsorption of the dye for both the electrodes follows the same.
4. Conclusion
Electrocoagulation using monopolar and bipolar configurations for Reactive Red 111 removal using mild steel and used waste aluminium foil as sacrificial electrodes were studied in a batch reactor. The COD removal using the monopolar configuration for mild steel was found to be 96.5% (electrode consumption and 0.21 kg electrode/m3 energy consumption 0.21 kg electrode/m3 ) while for used food grade aluminium foil was 89% (electrode consumption 0.21 kg electrode/m3 & 2.95 kWh/m3 and energy consumption). Hence it is concluded that aluminium foil can also be used effectively and equally as anode electrode with mild steel.