1. Introduction
In the modern existences, the energy that can be renewed has enlarged additional attention prolong the valuable fonts of conventional non-renewable energy like oil & natural gas and also due to their eco-friendly nature [1]. The cost of generating renewable energy has come down significantly due to technological advancement & research in this ground. By record, it is proved that, renewable energy sources which don’t have destructive atmospheric environment impact, which is the main benefit that is attained from renewable energy sources [2]. Today renewable energy tools are improving their skills most commonly in the field of power collection from solar energy, power from the airstream, electricity from water plants, electricity from thermal, and power from waste products by the biological sources [3]. The energy disaster in this generation is the reflection of the world’s demands [4]. The main reason behind this is there are no comprehensive thoughtful and clarifications for the assumed disaster. Currently, the assembling of batteries for high energy storage and power density by applying renewable sources with green chemistry ideas attain great response amongst the researchers [5]. The burning of fossil fuels donates in increasing, the production of carbon dioxide in the environment which in turn polluting the whole ecosystem. The numerous limitations shaped the need for batteries like instant recharge, size/weight, energy density, renewable catalysts, temperature operation, readily available fuel source and flexible shape. Among all other renewable energy sources now a days microbial fuel cell (MFC) is gaining more attention. A microbial fuel cell is considered as a device where one form of energy is converted into another form. The microbial fuel cell directly converts the chemical energy of fuel cell into electrical energy. However, no instant thermal or mechanical processes are involved in between so overall losses are less[6].
This manuscript aims to demonstrate a newly designed three single chamber microbial fuel cells (SCMFC) of different volume, which is performed to get sustainable power output as small cells connected in series offer higher potentials than bigger reactor volumes. The three different volume of fuel cell is further connected in series to step up the output voltage. Further connected three MFCs in series not only step up the output voltage at the same time power density is improved. Since dairy wastewater contain carbon source so the collection was done to use in MFCs as a substrate. Here Shewanella algae were used as biocatalyst for stable power generation from real dairy wastewater (RDW) using fed-batch condition. The drop in voltage was previously observed in MFCs during certain interval of time, therefore a proper feeding statigy was done according to their volume at proper interval [7]. Most of the wastewater contains a high level of organic load and toxic compounds which are detrimental for biocatalyst used in MFC. Thus understanding of substrate utilization kinetic study is of utmost importance for designing of a biochemical process. Results showed that serial connected based MFCs could reach to high stable output voltage with wastewater treatment with minimum volume of reactors. To understand the performance of MFC for continuous power production external resistance on COD removal efficiency and columbic efficiency (CE) was critically studied using the various load of external load were studied individually. Furthermore, the characterization of the polarization curve and power density curve was performed to estimate the performance efficiency and optimized condition of three SCMFCs using pure culture in the presence of RDW. Though the voltage generated by a single MFC is not sufficient for practical implementation thus the series-connected concepts were considered [8]. Thus the visible result was observed where the voltage obtained from three MFCs when connected in series was sufficient enough to glow a red LED at the same is much cost-effective then parallel connection.
2. Material and Methods
2.1 Microorganism and Chemicals
Shewanella algae-MTCC-10608 were previously screened based on their growth and iron-reducing capacity [9]. Luria bertani broth, and agar were analytical grade and were purchased from Himedia, Pvt. Ltd., India and was used in this work. Dipotassium hydrogen phosphate (K2HPO4) and potassium dihydrogen phosphate (KH2PO4) was were purchased from Himedia, Pvt. Ltd., India and used as a buffering agent. The seed culture of each microorganism was separately transferred from already grown solid media to the conical flask containing sterilized Luria Bertani Broth (LBB). The sterilized platinum loop was used for transferring of culture. The conical flask containing Shewanella algae- was incubated at 30°C for 24 h. The pH of the growth media was maintained at 7.4 before inoculation.
2.2 Wastewater acclimatization
Gomati cooperative union limited, is milk producer at Agartala, India. The wastewater used in this study was collected from the Gomati industry. After collection, the wastewater was kept inside the refrigerator lab. The COD measurement of this wastewater was performed using an available standard protocol [10]. Initially, Shewanella algae were grown in LBB media respectively for 24 hr. The 10% (v/v) microorganisms were transferred separately to 100 mL of real dairy wastewater (RDW) containing COD of 2000 mg/L. The pH of RDW was set to 7.4 before sterilization. The conical flask was separately incubated for 7 days under anaerobic condition. The incubation temperatures for growth of Shewanella algae-MTCC-10608 was 37°C respectively.
2.3 MFC setup and Operational procedure
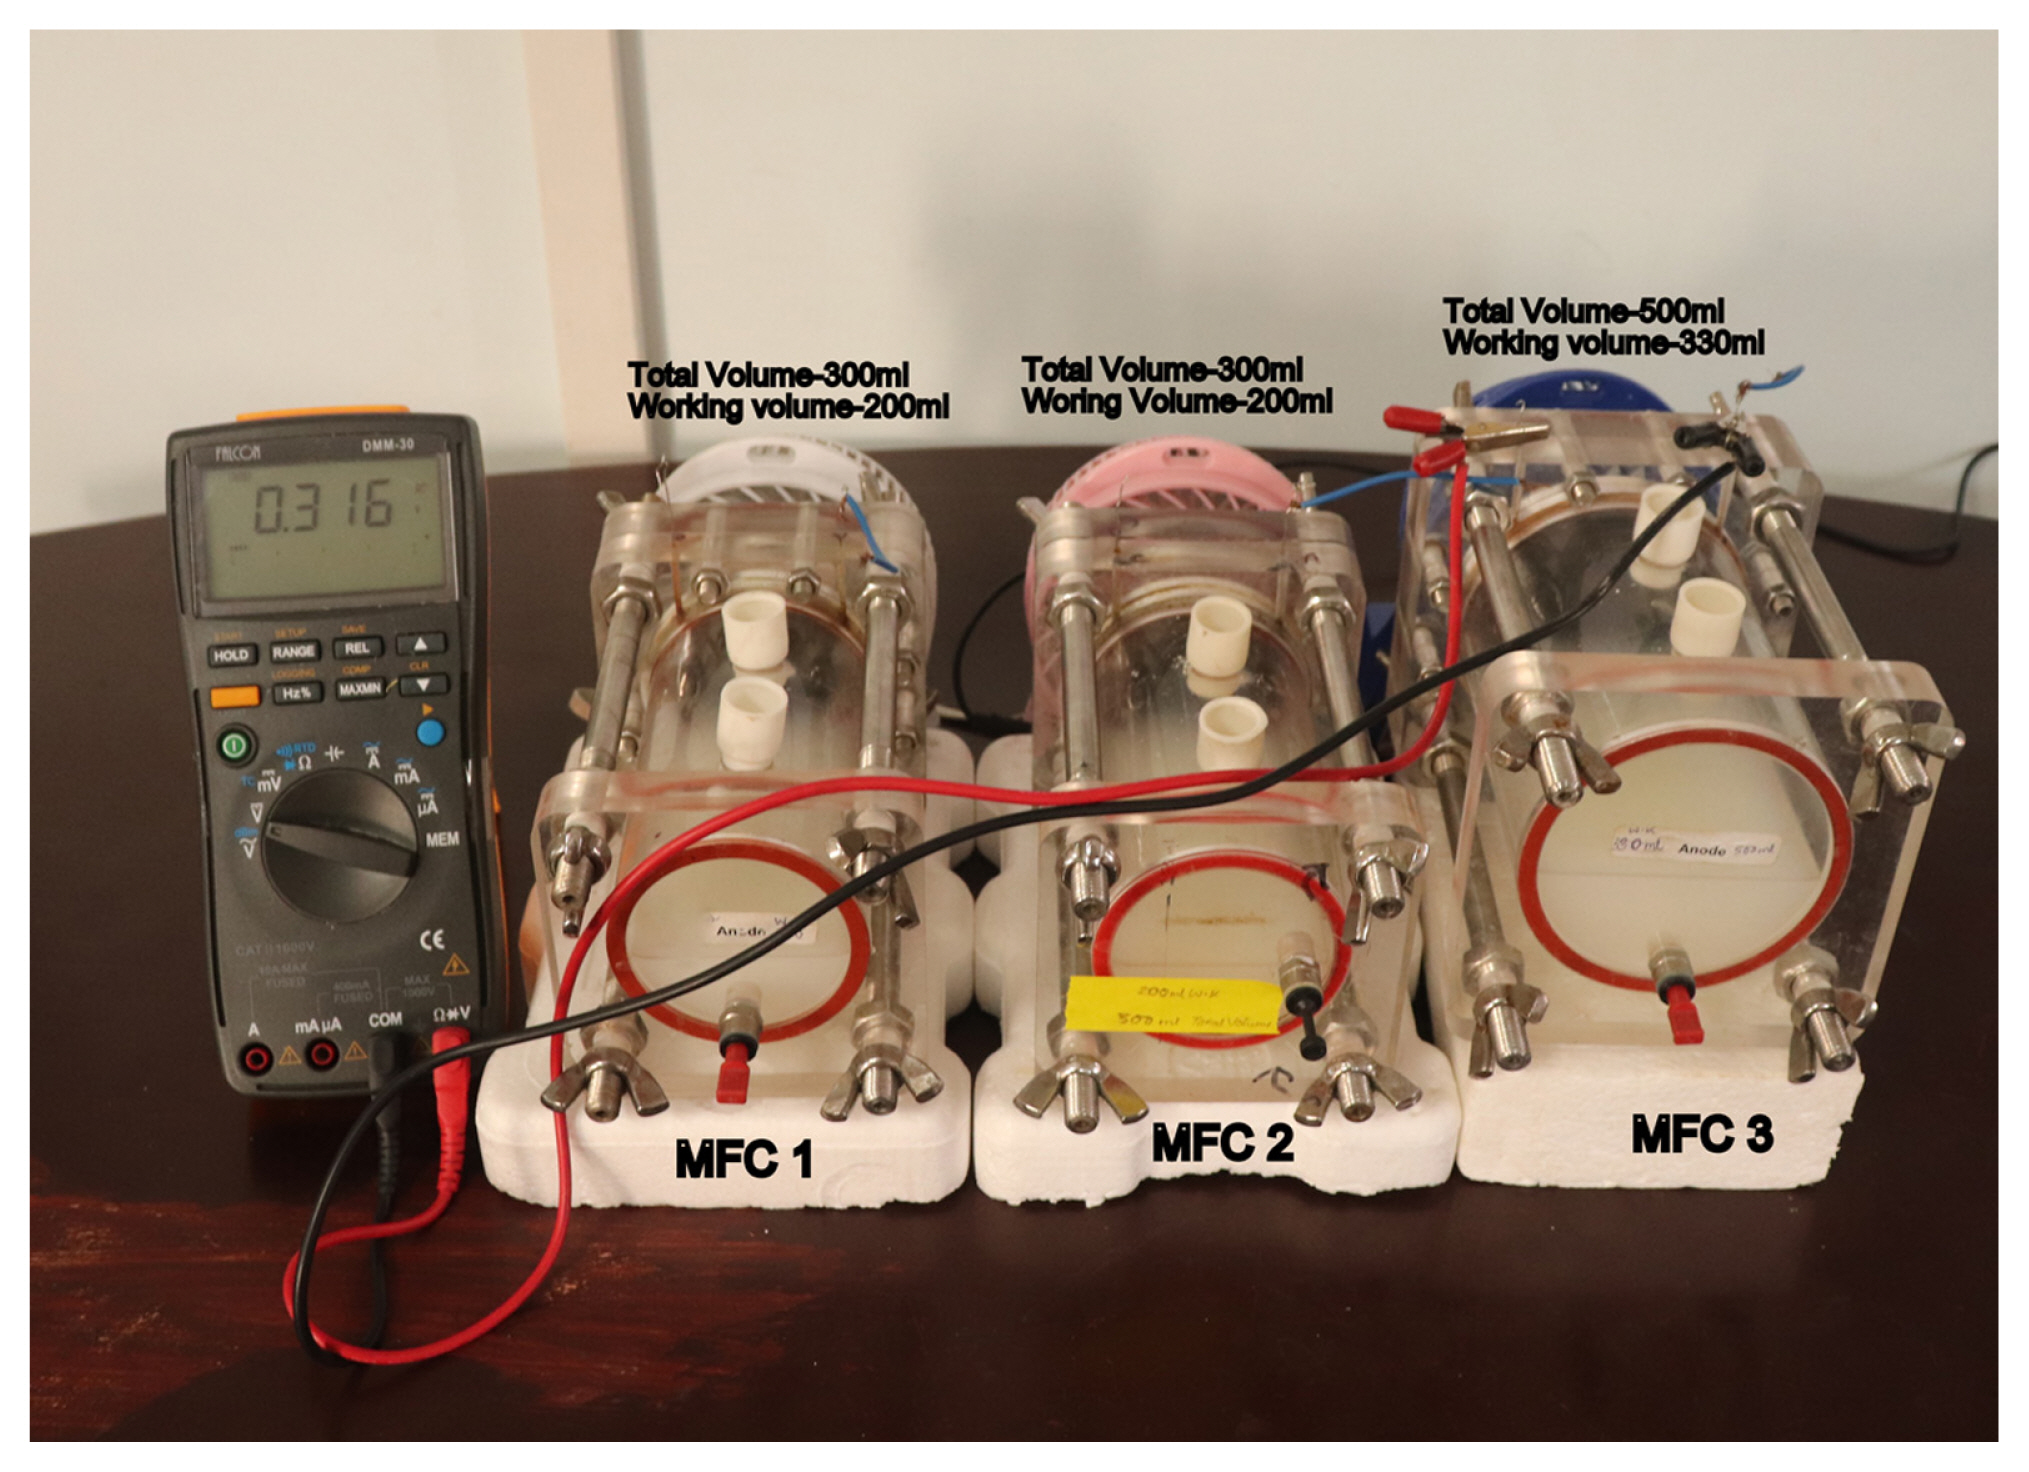
The single-chamber MFCs was used to carry out the entire experiments. The total volume and working volume of both MFC 1 and MFC 2 was “300 mL” and “200 mL” respectively. The MFC 3 had total volume and a working volume of “500 mL” and “330 mL” separately. Acrylic chamber was used to maintain anaerobic condition inside the chamber of SCMFC. The carbon cloth was used as anode and the surface area of the anode was 50 cm2. The platinum (pt) was used as a cathode which was supported on carbon cloth. The cathode was loaded on the carbon cloth with 0.5 mg/cm2 (Sainenergy fuel cell the USA). Nafion 117 (Sainenergy fuel cell the USA) was used as membrane and placed between cathode and anode. The thickness of the membrane was 157 micron. Both inlet and the outlet port are kept in the anode chamber of SCMFC for inoculation and with-drawing of samples. The stainless steel wire was used as an electrode material, which remains on the surface of SCMFC [11]. The setup of three single chamber Microbial fuel cell of different volume illustrated in Fig 1.
The SCMFC was initially rinsed with 70% (v/v) ethanol for sterilization of anode chamber. Therefore, previously grown microorganism attached inside the anode chamber was removed. After rinsing with ethanol, the SCMFC was placed inside the incubator for 24 hr and to dry it. Additionally, SCMFC was exposed for 10 minutes under Ultraviolet light inside the biosafety cabinet. Previously sterilized real dairy wastewater (RDW) having a pH of 7.4, was aseptically transferred inside the anode compartment. The seed culture of two microorganisms with the various combination was also transferred through the inlet port to the anode compartment of SCMFC under sterilized condition. The inlet port of SCMFC was closed after transferring the seed culture and anaerobic condition was maintained within the anode compartment. Nevertheless, the cathode compartment of SCMFC was keeping open to the fan. Three small fans was placed on the cathode side so to increase the continuous supply of air with power capacity of 12W, and air delivery of 50 CMM and revolutions per minute (RPM) of 2300.
The MFC was run under fed-batch study for 15 days [12]. Initially, the volume of MFC 1 And MFC 2 including seed culture was maintained to 100 mL and MFC 3 to 230 for 5 days. 10% (v/v) fresh mixed seed cultures (OD600nm ~ 0.1) of Shewanella algae with various volumetric proportion, was added as inoculum in MFC 1, MFC 2 and MFC 3. Additional feeding was done by two phases, which were given at 5th day and 10th day of operation. In each step, feeding was done with “50 mL” of RDW for all three MFCs. However, COD of RDW fed at 5th day and 10th day of operation was 6000 mg/L, and 8000 mg/ L, respectively. Furthermore, the pH of feeding RDW was kept to 9.0 by the buffer agent K2HPO4 and KH2−PO4. The treated wastewater was collected after 12 hr of the interval from the outlet port of MFC. The pH, growth of bacteria, and COD of treated samples were measured. The voltage generated after 12 h interval from MFCs was measured using a digital multimeter and continued for 15 days.
2.4 Tentative design of MFC
Experiments were conducted in one mode of electrical connection using three individual independent fed-batch flow MFCs as follows: MFC 1, MFC 2 and MFC 3 all three MFCs in series. The three individual MFCs with the electrical connection was connected in series and was used to take the voltage reading after every 12 h interval. In the series connection, the system was supplied with the RDW feed under fed-batch operation for along 15 days to ensure sustainability of power production.
2.5 Fed-batch kinetics for power generation
The kinetic behaviour of the current generation in the fed-batch process was studied through creating a relationship between COD of RDW and current density. The sample was withdrawn from MFCs during fed-batch operation with an interval of 24 hr and COD was measured using a previously described standard protocol [10]. The current generation was measured with 500 Ω of external resistance [13] and normalized to current density by dividing with anode area for three MFCs. The data obtained at various substrate-level was simulated using the various kinetic model and kinetic parameters were measured.
2.6 MFC performance evaluation
A digital millimetre was used to measure the cell voltage (V) obtained from three series-connected MFCs after a various time interval of operation. Coulombic efficiency (CE), power (P=IV), and current (I) were computed as per previously standardized protocol [14]. Here Eq. 1 was used to calculate coulombic efficiency of MFC for the fed-batch operation [15]:
Where, ΔCOD indicates the value of changing of COD of treated RDW over the fed batch cycle, F and I are Faraday’s constant and output current. The volume of working liquid at the anode chamber is represented with VAn.
2.7 Polarization and power density experiments
In experimentation for all three MFCs, polarization test and power density test was conducted and voltage and current and power of the system were measured. The experiment was conducted manually with different external resistances ranging from (50–15000) Ω and voltages were measured with digital multimeter and currents and power were calculated over time. Initially, the MFCs was set to open circuit for two hours and the voltage was recorded without load. Then, the external resistance was increasingly started from 15000 Ω to reduced 50 Ω with charging breaks. Therefore with the particular external resistances, voltage (V) of the individual MFCs were recorded subsequently after 10 min and current (I) and Power (P) is calculated. The power density was obtained by P = IV/A (Chen et al., 2015), where I is the current, V the voltage of the MFCs and A the projected area of the anode 50 cm2 which is kept same for all three MFCs. Thus a slope is obtained from the Polarization and power density graph from which we can calculate the value of internal resistance of the individual MFCs.
3. Results
3.1 Fed-batch study for voltage generation in MFCs
The existing protocol was used to test the dairy wastewater collected from Gomati, Agartala and was found 8010 mg/L. Subsequently, RDW comprises numerous organic substances with 8010 mg/L of COD value, therefore, the possible influence of RDW took serious care for OCV by conducting an fed-batch condition for a stable power generation for a longer period. It was reported in the previous study that the growth rate of Shewanella algae was found maximum at 0.2% (w/v) of lactose in RDW, therefore, the same focus was continued for conducting batch experiments (up to 120 hr) for all three MFCs individually [9]. After 70 hr of incubation, the highest OCV measured for MFC 1 is 0.60 V, MFC 2 is 0.66 V and MFC 3 is 0.55 V. Therefore the open-circuit voltage (OCV) remains almost constant with a rise of response time (Fig. 2) up to 110 hrs. Though, after increasing of incubation time, the OCV start decreasing and reach the lowest OCV of 0.55 V for MFC 1, 0.57 V for MFC 2 and 0.49 V for MFC 3 after 141 hr of individual MFC operation. The accessibility of substrate in MFCs helps to stimulate bacterial growth and transfer of an electron to the electrode, the pH keeps the media-neutral for bacterial growth and the particular temperature is needed by microorganism for their proper growth. Thus to understand this drop in voltage condition a test was primarily conducted to assess the best level of lactose concentration in substrate, pH, and temperature for the growth of Shewanella algae [16–18]. Therefore, results shows a decline of voltage was initiated after 110 hr of fermentation, and this occurs due to the substrate exhaustion in media. At the same time, extreme pH change was observed at the end of the batch operation (141 hr) and found to be near about 6.01 for all MFCs, this happens due to huge acid production in media. Additionally, the fed rate of the substrate was adjusted to 0.6%(w/v) of Lactose on RDW and the pH was set to 9 by adding buffer in the feeding media at 141 hrs of operation. Consequently, the substrate concentration and pH of media are dilute to 0.2% of (w/v) in RDW and 7.4 for all three MFCs.
Since for proper growth of the Shewanella algae pH of the media should be kept at 7.4, therefore, acidic environment in all three MFCs not only hampered the growth of bacterial at the same time OCV generation is also decreased [19]. As generated OCV is a metabolic procedure which is connected with bacterial growth, so, adding RDW will benefit in boosting OCV for all the three MFCs. Since during batch process vast quantity of substrate hampers the generated OCV due to rapid fluctuating of pH media, so, microorganism consumes energy from the substrate directly or indirectly as their primary source [20]. So, feeding plan is implemented after a proper interval of time to attain stabilized voltage in all three MFCs. In this context, two times the feeding plans was done with RDW.
Initially, for MFC 1 and MFC 2, was carried out with 100 mL of volume with RDW, and for MFC 3 with 230 mL of volume with RDW was used with 0.2% of lactose present in RDW was used and operated for 141 hr. Additional, “50 mL” of RDW with 0.6% of lactose was fed and the pH was adjusted to 9 so that at 141 hr of operation for all three MFCs. Results display within 3 hr of successful fed-batch condition the triggering of voltage and pH was done effectively so, OCV is additionally increased for all the three MFCs. The maximum OCV for MFC 1 obtained is 0.62 V, MFC 2 is .64 V and MFC 3 is .54 V which was initiated after 155 hr of process. Fig. 2 demonstrates continuous OCV from 144 to 230 hrs which is obvious on fed-batch operation. Though, after 230 hrs of MFCs operation, the pH of media is again found to be decreased to 6.12 and OCV for all MFCs was reduced to 0.58 V for MFC 1, 0.59 V for MFC 2 and 0.49 V MFC 3. In the second phase, at 230 hrs again 50 mL of RDW having 0.8% of lactose and pH was adjusted to 9 was used to feed in MFCs. It is apparent from Fig. 2 the OCV slowly got to baseline in 3 hrs of the second phase of this process and stayed steady up to 350 hrs condition [21]. The maximum OCV at the second feeding obtained for MFC 1 is 0.61 V, MFC 2 is 0.66 V is and MFC 3 is 0.55V found at 262 hr.
3.2 Kinetics and performance analysis for fed-batch operation
The fed-batch strategy can easily restrict the changes in pH and stabilize the OCV generation for a longer time, so feeding was carried out on the 5th and 10th day of operation for all three MFCs. The generation of voltage at various times of fed-batch process in the existence of different external loads [22]. Therefore, the external resistances used at various phases of fed-batch operation are approximately equal to the internal resistance (Rin) in that particular time of fed-batch operation [15,23]. It is found that the Rin is obtained to be 5000 Ω at the beginning of the fed-batch process and gradually decreased to 2000 Ω after 48 hr of operation. However, Rin is gradually reduced further up to the 5th day of fed-batch operation as voltage generation is found to be increased. Since RDW has a low level of conductivity at the beginning of the operation, therefore, internal resistance is found to be high. As bacteria overcome the lag phase, organic substances present in RDW starts to brake and the formation of ions takes place inside MFC due to the exponential growth of bacteria [24]. Therefore, the internal resistance of MFC is gradually decreased until the 5th days of operation. Results also show that the internal resistance of MFC remains constant from 5th to 15th days of operation. The value of Rin for MFC 1 is calculated as 448 Ω, MFC 2 as 300 Ω and MFC 3 as 700 Ω which is the half voltage of OCV recorded [25]. As the fed-batch process operates under a quasi-steady state, therefore, the growth rate of bacteria, as well as Rin, remains constant during fed batch operation. Since, smallest Rin is required for maximum power generation, therefore, fed batch process may be an alternative tool for maintaining low level of internal resistance [26]. Additionally, fed batch process also able to produce stable voltage generation in MFCs.
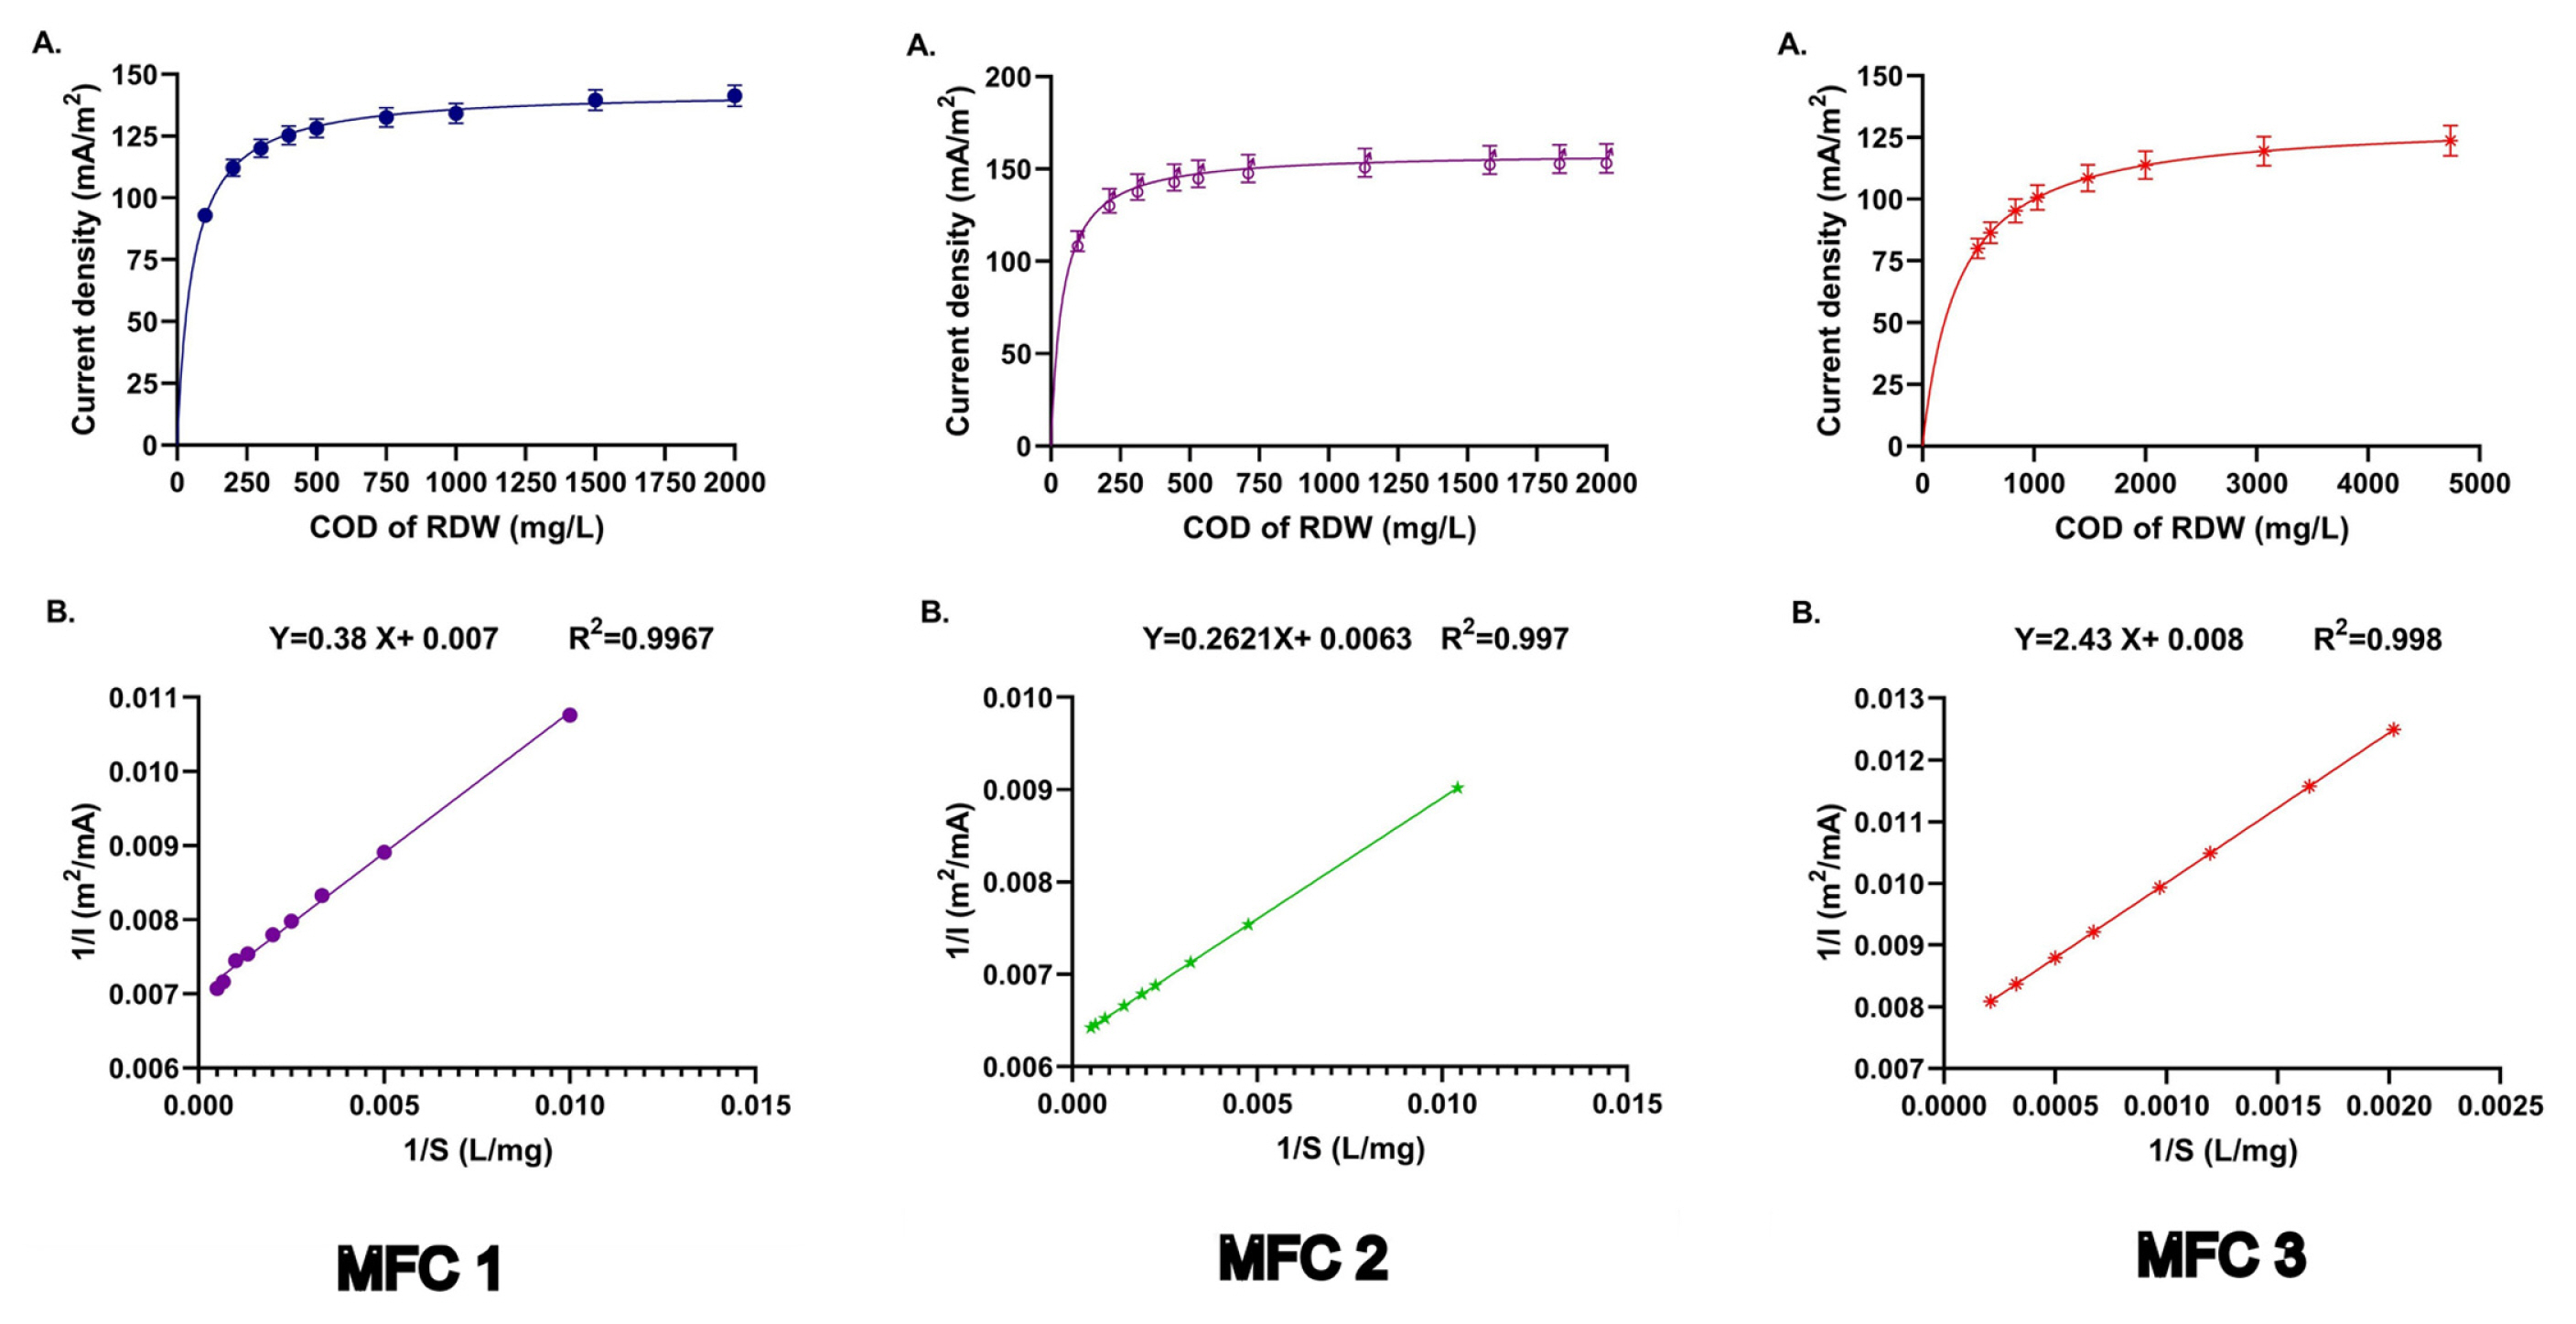
To understand the kinetic behaviour of the current generation in the fed-batch process, feeding of RDW having various levels of COD was carried out at 10th days of fed-batch operation. The COD of RDW was used in the range of 2000 mg/L. The volume and pH of RDW were maintained as 50 mL and 9 respectively. In this study, MFC 1 with 448 Ω, MFC 2 with 300 Ω and MFC 3 with 700 Ω of external resistance was used to evaluate the kinetic nature of the current generated during the fed-batch process [25,27]. The current was measured using Ohm’s law from the relationship of attained voltage and external resistance. Normalization of current was carried out by dividing the got current by the anode area. The current density obtained from various COD containing RDW was plotted against the COD of RDW in Fig. 3A for all three MFCs. It is evident that the current density is gradually increased as the COD value of RDW is enhanced. The maximum current density for MFC 1 (141 mA/m2), MFC 2 (155 mA/m2) and MFC 3 (123 mA/m2), is observed at 2000 mg/L of COD of RDW. The above phenomenon has similarities with a bacterial growth model, where the dependency of bacterial specific growth on substrate concentration was evident [28]. In the current study, the growth of bacteria depends on the level of organic substrate present in RDW. Since the level of current density depends on the number of bacterial cells present in MFCs at particular conditions, therefore, the COD value of RDW also modulates the generation of current density. The unstructured model given at Eq. 4 [29], was used to interpret the current density data obtained at the presence of various COD of RDW.
Where, Imax, and I represent the maximum current density (mA/m2) and current density (mA/m2). C and Ks are the value of COD of RDW (mg/L), and saturation constant (mg/L). A nonlinear equation given in Eq. 4, can be converted to the linear equation by taking the reciprocal of Eq. 4. A linear plot between 1/I vs 1/C was drawn and shown in Fig. 3B for all MFCs. The value of Imax was calculated from the intercept, and the Ks value was calculated from the slope. The value of Imax and Ks were calculated as 143.3 mA/m2, and 55.83 mg COD/L respectively.
In this experiment, the lower value of Ks is found, which represents that higher affection towards RDW is prominent for Shewanella algae. Lyon et al (2010) used a single chamber microbial fuel cell for generation of current from acetate containing domestic wastewater, and 150 mA/m2 of current density was achieved in presence of 1000 Ω of external resistance [30]. In another experiment, 130 mA/m2 of current density was obtained from acetate containing wastewater using MFCs [31]. In this investigation, obtained current density has a likeness with the previous observation and has an indication for the usability of the fed-batch process for the generation of current from dairy wastewater using MFC.
To understand the variation of generated current density under different external resistances, the experiments were conducted on the 10th day of the fed-batch process, when the generated OCV was stable. In these experiments, the external resistance within the range from 50 Ω to 15000 Ω was used and the current density was calculated. The entire experiments were conducted at the last phase (10th day) of the fed-batch process, where, RDW having 2000 mg/L of COD was used as a substrate at MFC.
Although, research on MFC is mainly intended for power generation, however, coulombic efficiency (CE) is an important parameter on the evaluation of the performance of MFC. It also comes into consideration when value addition from waste is concerned with MFCs. CE represents the percentage recovery of an electron in the form of energy or current from MFC or any system. The calculation of CE was performed by Eq. 1. During calculation, the maximum current obtained in the present experimental condition was considered. F and the flow rate (q) are taken for calculation as 96500 columb and 0.05 L per 5 days respectively. The residual COD of RDW was measured through the analysis of the sample, which was collected after the prerequisite time interval. It has been found that the value of COD of RDW after 15 days of operation was found for MFC 1 with 195.67 mg/L, MFC 2 with 158.80 mg/L and MFC 3 with 267 mg/L therefore, 90.21%, 92.04% and 84.45% of COD removal is possible using fed-batch operation for all three MFCs [32].
3.2 Assessment of polarization curve as well as power density curve
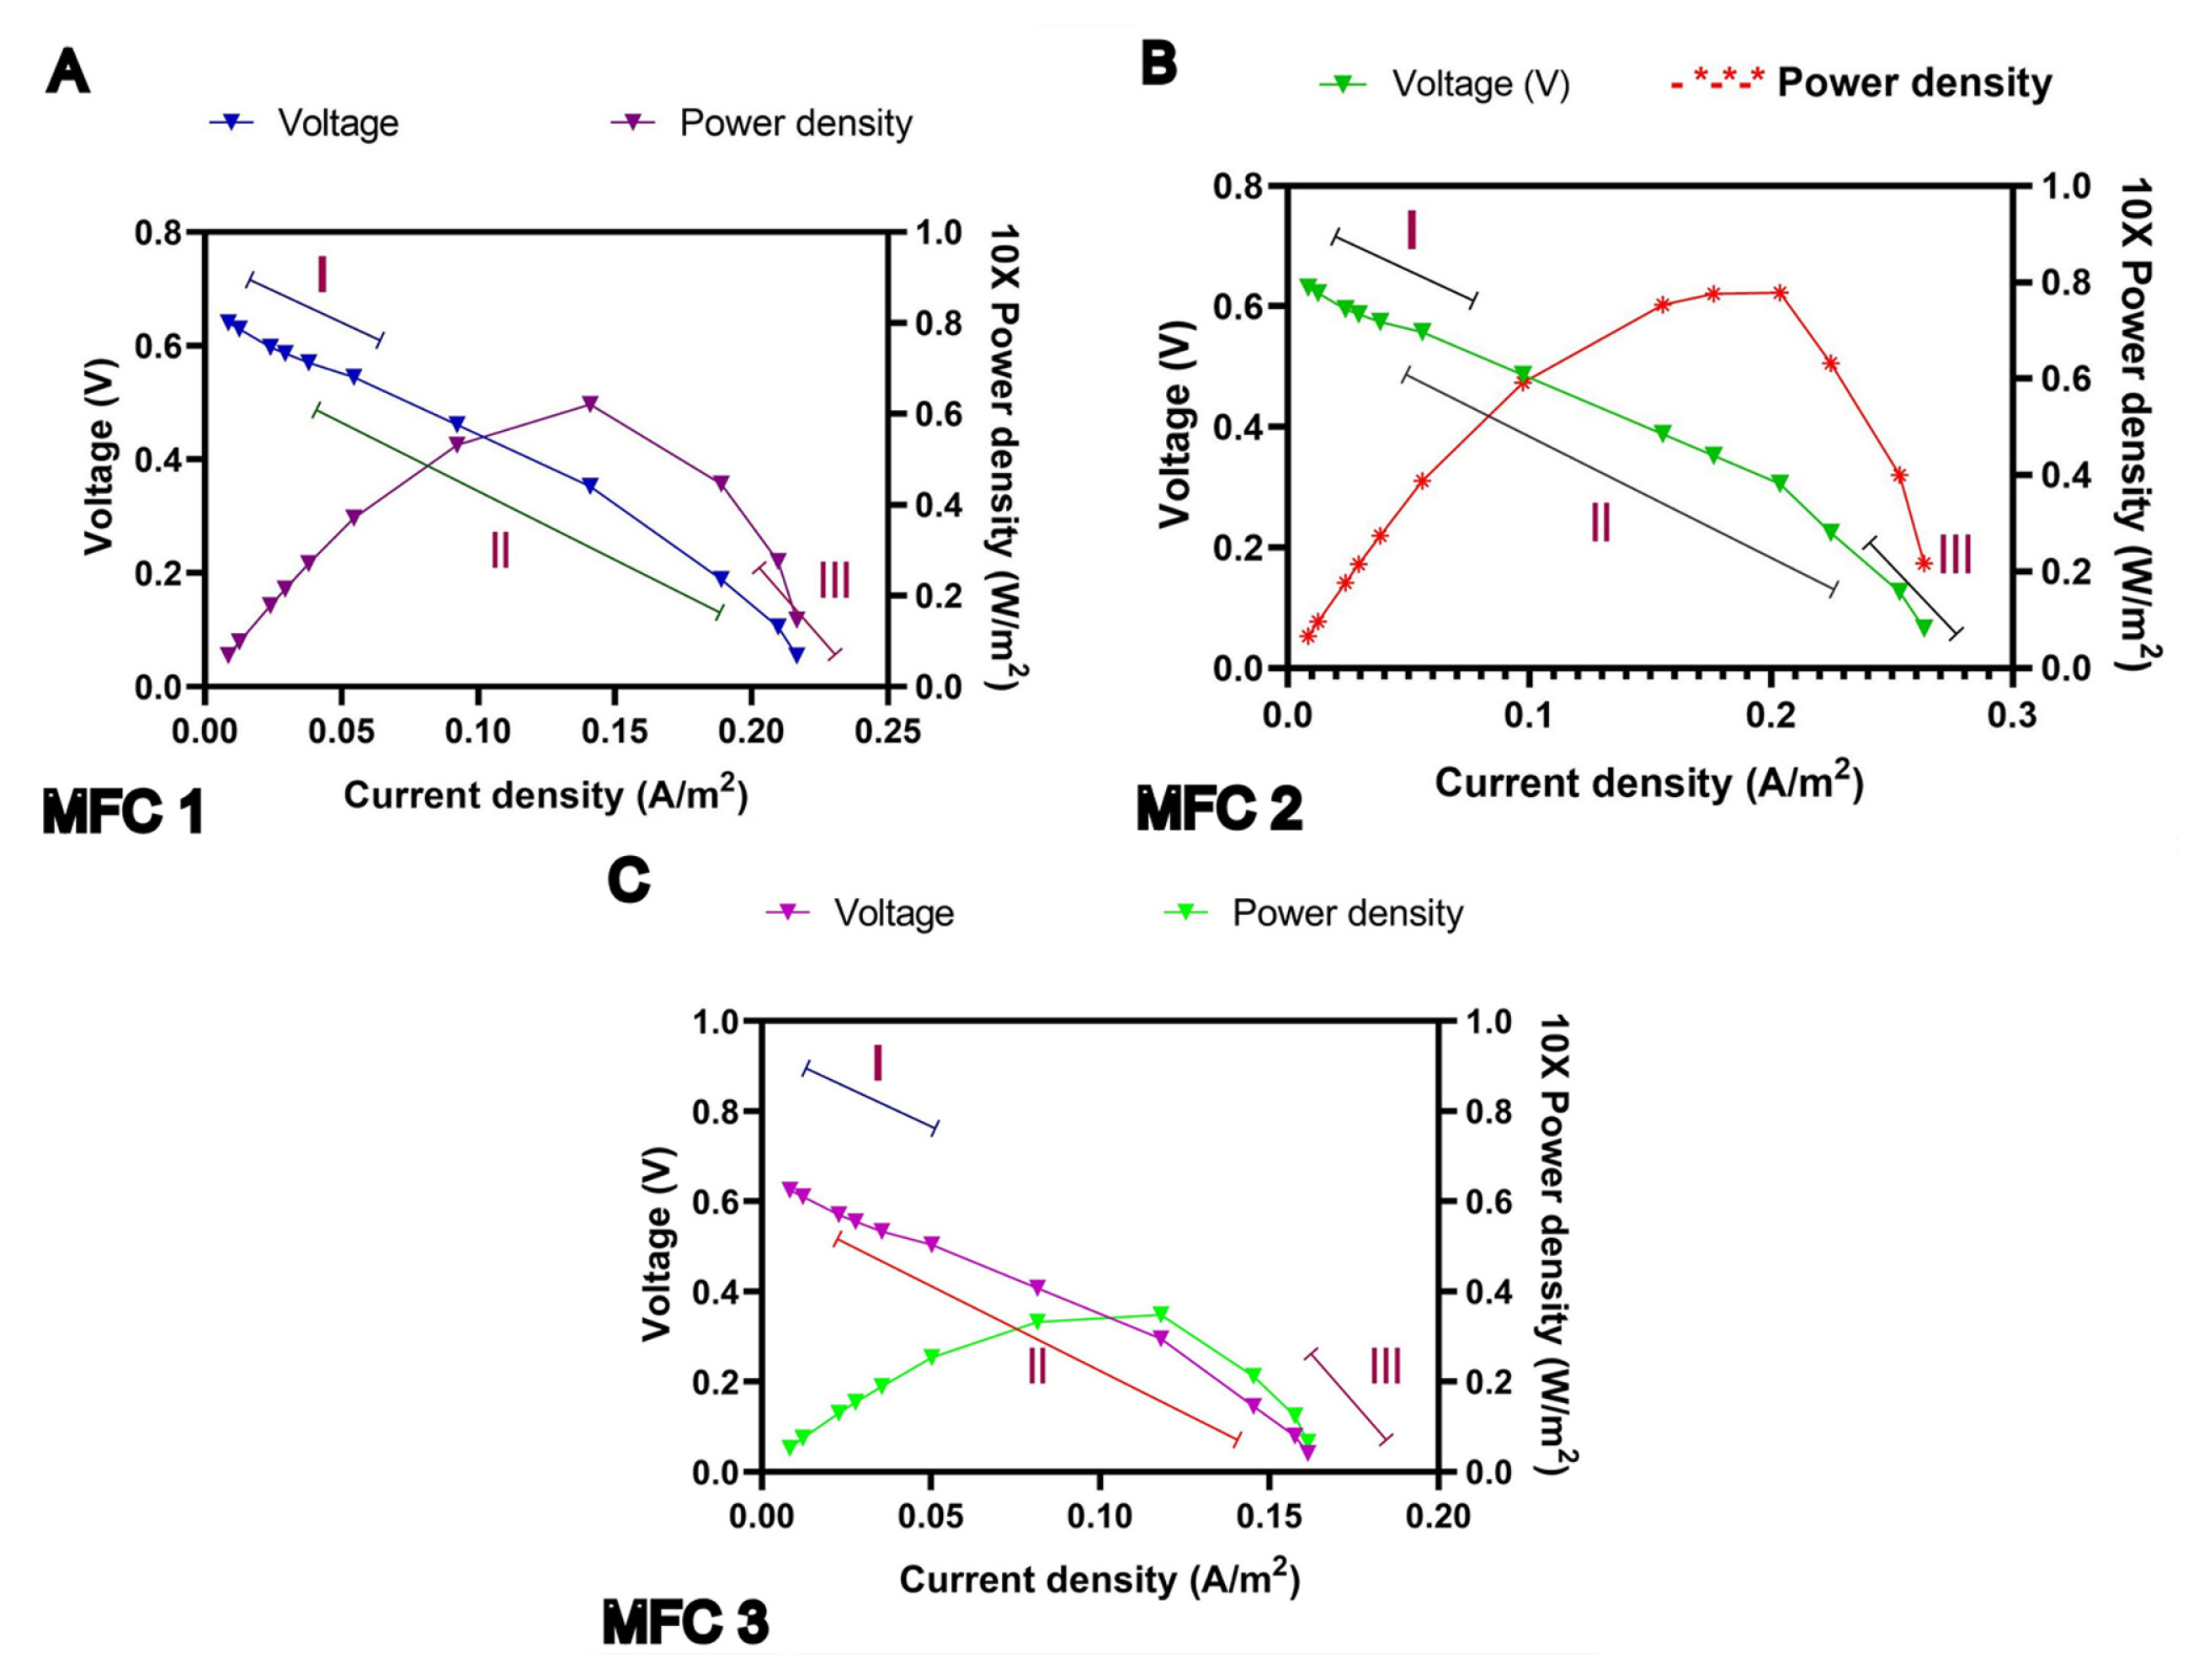
The graph plotted between the voltage and current density verified with variable external resistances ranging from (50–15000 Ω) gives the polarization curve and was achieved (Fig. 4) for MFC 1, MFC 2 and MFC 3 individually [33]. It is marked that the polarization curve comprises three sections I. Rapid loss of voltage region, II. Constant drop in voltage and III. Rapid region for voltage drop. The rapid loss of voltage is due to the necessity of energy for the beginning of biological and chemical reactions, known as oxidation or reduction reaction [34]. Moreover, limitation in the transfer of an electron from chamber to anode surface led to lower current density. The change of internal resistance causes due to resistance through electrodes, electrolytes, and due to the passing of hydrogen ion inside the membrane. A linear slope (ohmic) region was occurred in between the voltage and current density and thus the internal resistance can be calculated from the slope. Thus calculated result for MFC 1, MFC 2 and MFC 3 is 188 Ω,194 Ω, 250 Ω.
Fig. 4 also represents the power density curves for MFCs. It is apparent from the graph that the value of power density is primarily increased for MFC 1 up to 6.8 W/m2, MFC 2 up to 0.8 W/m2 and MFC 3 up to 3.8 W/m2 with the rise of current density. And yet after the rise in current density, power density starts decreasing. Subsequently, the electron movement in the circuit is dependent on the external resistance value, so, current density value would be high, rather than higher power density [35,36]. The maximum power density for MFC 1 is found to be 0.38 V, MFC 2 is 0.3 V and MFC 3 is 0.31 V respectively. The maximum current density for MFC 1 is 0.22 A/m2, MFC 2 is 0.27 A/m2 and MFC 3 is 0.17 A/m2 obtained from polarization curve. Thus from Fig. 4 the obtained the peak level of cell voltage obtained for MFC 1 is 4.9 V, MFC 2 is 0.5 V and MFC 3 is 3.9V. Thus, result was evident from Table 1 where all three MFCs obtained in the second feeding phase of the operation from the polarization and power density curve. Priya and Setty (2019) reported that 0.35A/m2 of current density and 31.58 mW/m2 of power density were achieved from MFC, where clarified apple juice was used as a substrate [23]. Power density and current density generated from MFC are higher with previous reports, where real wastewater was used as a substrate in MFC [23,37,38].
4. The voltage obtained in Series Connections
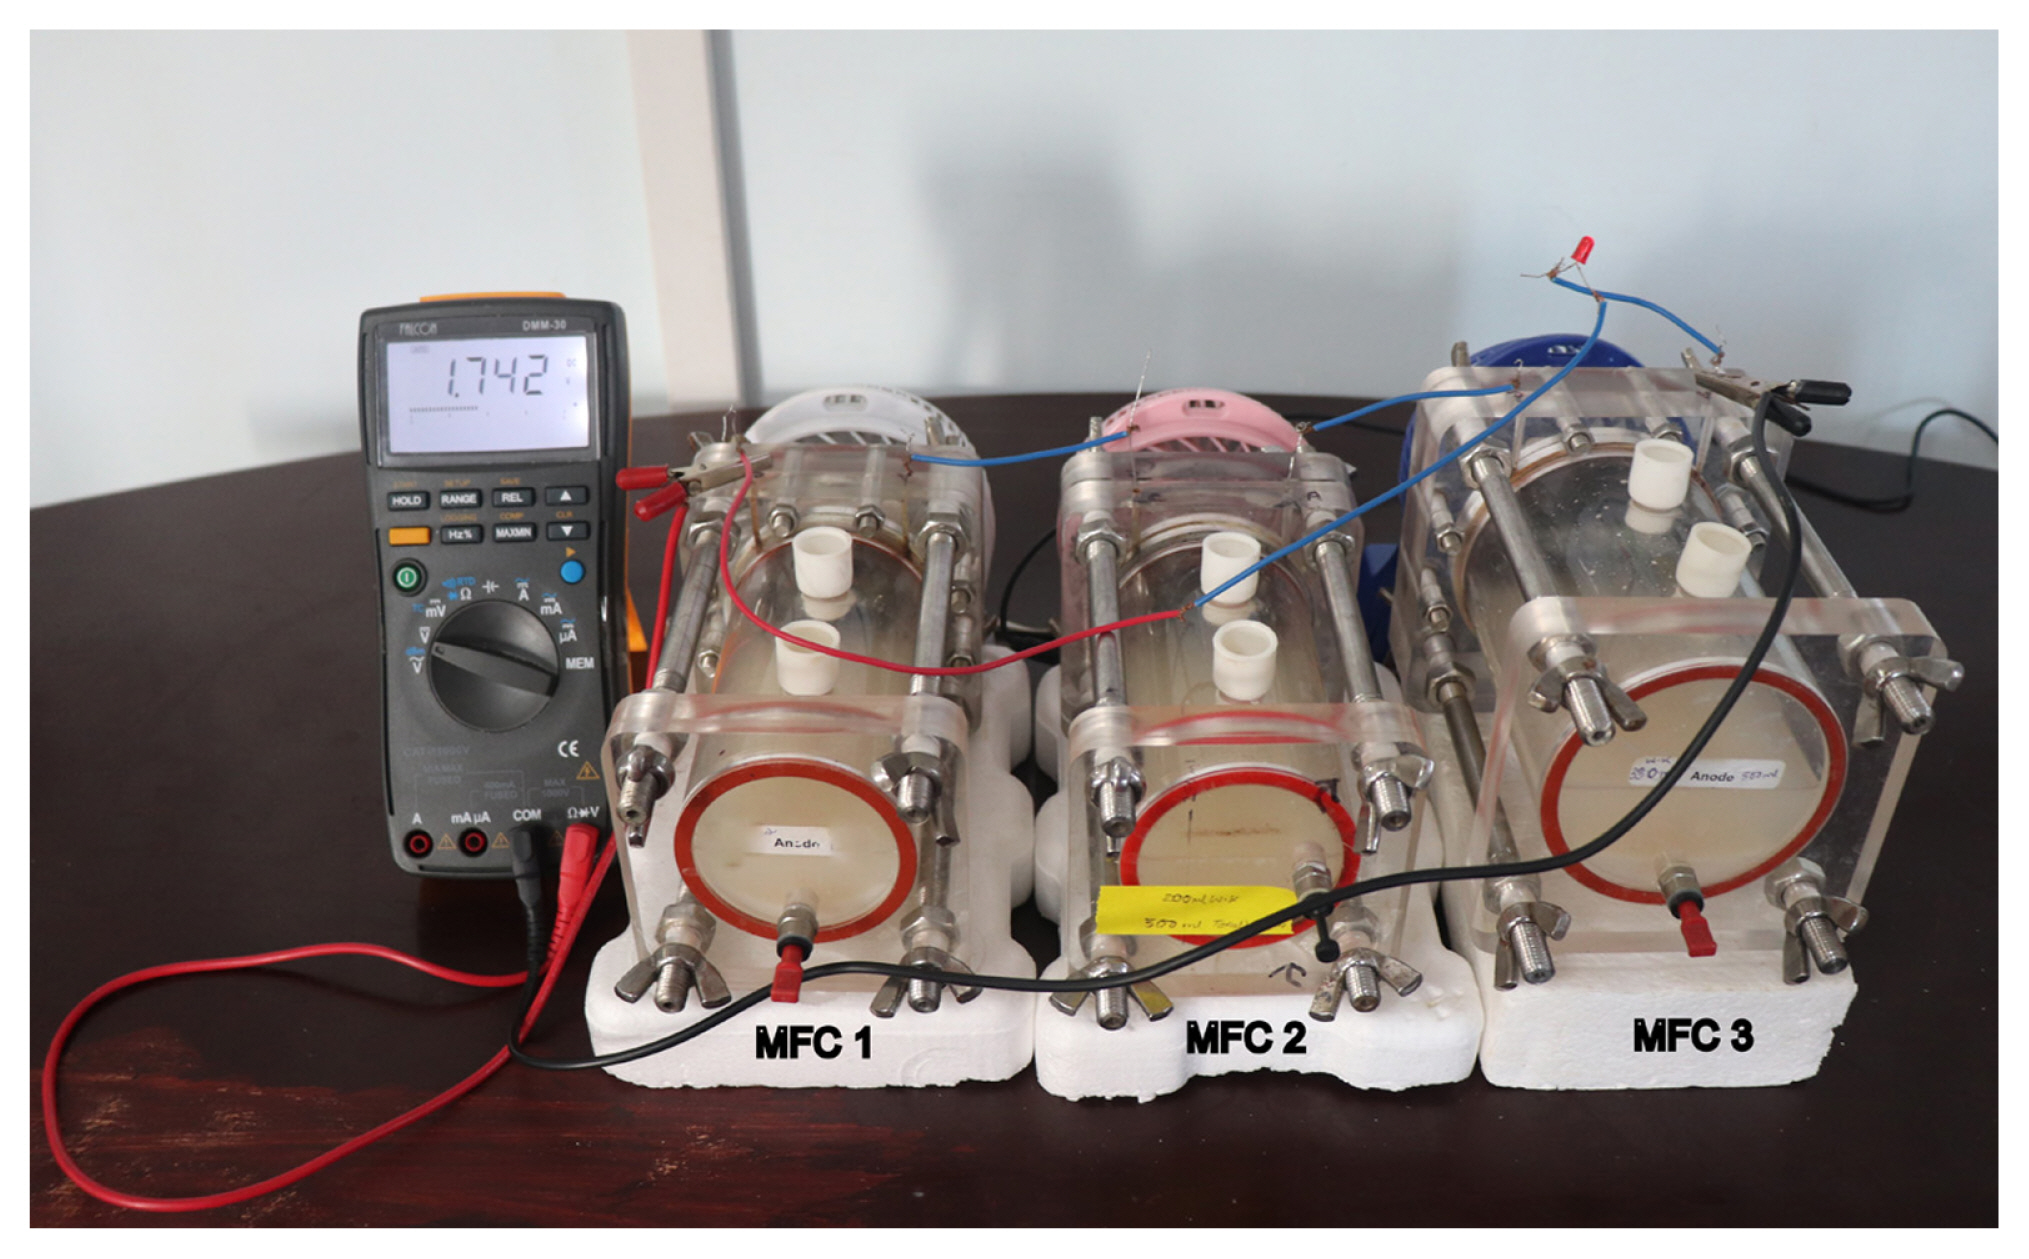
The individual MFC was operated first under fed-batch operation. To set up the voltage and to improve the overall performance of MFCs, the individual MFC 1, MFC 2 and MFC 3 were connected in series [39]. Thus MFC 1, MFC 2 and MFC 3 give an output working voltage of 0.60 V, 0.64 V and 0.51 V individually but when connected in series its gives a working voltage of 1.745 V. This experiment demonstrates that to get constant power output from MFCs in series, the fed batch process was confused and all connected cells must be in good working condition. Thus in Table 2 provides the OCV and a working voltage of individual MFCs and when connected in series. The MFC 1, MFC 2 and MFC 3 are so designed, that it had the same electrode spacing area at the anode. But the volume of MFC 1 and MFC 2 was kept the same “300 mL” and MFC 3 was kept “500 mL” separately. Thus with this different volume, the individual performance calculation shows the values obtained in similar configuration (MFC1 and MFC 2) gives better results than using larger cylinders (MFC 3) [20]. In general, the reduction of MFC size, as well as choosing the potent microorganisms can result in an enhancement of the power density output by the system [40]. Therefore, a series connection is a good strategy for getting a higher order of voltage by connected individual MFC systems. The information shows the importance of peripherals in MFC scaled-up systems and the need for careful consideration of essential parts (such as resistive loads) to avoid significant detriment to the MFC performance [41].In case of series connection, the voltage of SMFC increases whereas in the parallel connection, the voltage as well as current increases while the number of SMFC increases which increase the cost [42]. In the present study we obtain power density of 11.4W/m2 and total voltage of 1.74 V. when connected with load. Therefore, in Table 3 data is reported from previous studies where the series connected MFCs has a total working voltage and the power density which is lower then the present reported data. Mehravanfar H et al in 2019 reported that to gain the highest power output and COD removal, serial electrical connection is the best chioce. It is also reported that four different modes of electrical connection was done and experiment was carried out with the dual objective of maximizing power density and minimizing operating costs. Results shows that with series connection the lowest operating costs to maximum power is achieved. Optimization reduces operating costs by 61% with only 37% reduction in maximum power compared to maximum attainable power when connected in series. At the same time the lowest operating costs to COD removal ratio is observed in also observed in series connection [43]. Thus according to our energy demand we can connect either in series or parallel as per our requirement.
5. Conclusions
High attention must be given on dairy wastewater as it contains high organic matter, inorganic pollutants and nutrients. Consequently, extra care should be given to dairy wastewater than domestic wastewater as it may comprise possible impurities. In the existing study, three individual fed batch condition was carried with all MFCs. Then the three MFCs was connected in series with visible led glow and wastewater treatment was also carried at the same time. Fed-batch methodology with series-connected MFCs exhibited significant progress on the performance of MFCs, based on the generation of voltage and as well as cost. Thus kinetic behaviour of fed-batch method is clarified and recommended that Shewanella algae have a greater attraction to dairy wastewater. The current density, power density, and coulombic efficiency are proved to be higher when results were matched with recent reports. Thus the series connection can maximise voltage output and decreased cost, is the key to promoting the MFC technology as a real product that can add value, through a range of practical applications in a future with new markets. Therefore, MFCs can be a sustainable method to decrease environmental toxins.