List of symbols for diffusion coefficient equation derivation
y
Arbitrary stoichiometric number
I
Current [C s−1]
I0
Applied constant current [C s−1]
t
Time [s]
E
Voltage (electrochemical potential) [V]
τ
Duration time [s]
D
Diffusion coefficient [cm2 s−1]
ci
Concentration of species i [cm−3]
x
Distance coordinate [cm]
S
Area of the electrolyte-electrode interface [cm2]
zi
Charge number
q
Elementary charge, 1.602×10⁻¹⁹ C
L
Diffusion length [cm]
VM
Molar volume [cm3 mol−1]
δ
Deviation from the stoichiometric composition
mi
Mass of species i [g]
Mi
Molecular weight of species i [g mol−1]
NA
Avogadro’s number, 6.022×10²³ mol−1
F
Faraday constant, 96485 C mol−1
ΔEs
Steady-state voltage change [V]
ΔEt
Transient voltage change [V]
1. Introduction
The lithium-ion battery (LIB) market is rapidly growing, and LIBs have become the dominant energy storage technology because of their relatively high energy and power [1–3]. The 2019 Nobel Prize in Chemistry emphasizes the importance of LIBs [4,5]. To meet the energy demands of consumers and global targets for reductions in greenhouse gas emissions and improvement of air quality, significant effort is being dedicated toward developing safe and advanced LIBs with high energy density, lifetime, and rapid charging capabilities [6].
LIBs are highly complex, multidimensional energy storage systems influenced by the properties of their materials, which are determined by multiscale factors from the atomic to the microscopic levels [7]. However, the core idea of this technology is simple: LIBs are operated by the movement of lithium ions and electrons by a current or voltage supply [3]. Consequently, the battery charging and discharging process results from the electrochemical redox reaction of lithium ion (de)intercalation in the electrode. Therefore, understanding the kinetics of the electrode material is essential for fully understanding the background and strategies for enhancing LIB performance.
Various electrochemical techniques in addition to constant current charging and discharging have been employed for kinetic variable investigations. For example, the cyclic voltammetry (CV) technique, based on linear sweep voltammetry, is usually used to examine the kinetics of electrochemical redox reactions by repeating several cycles or changing the scan rate [8]. It is possible to determine the reversibility of chemical reactions and the potential at which the redox reaction occurs. The Randles–Sevcik equation describing the peak current with the square root of the scan rate can provide quantitative information on the diffusion coefficient of lithium ions [9]. Electrochemical impedance spectroscopy (EIS) is another powerful tool for examining the current response under AC voltage to obtain resistance, capacitance, and inductance values [10]. By modeling the equivalent circuit and fitting the Nyquist plot, the following specific resistance values can be quantified from the high-frequency region to the middle-frequency region: the bulk resistance of the whole cell components, interfacial layer resistance on the electrode, and charge transfer resistance related to the kinetics of the electrochemical reaction at the electrode. Moreover, the diffusion coefficient of lithium ions can be calculated in the low frequency region using the Warburg impedance.
Additionally, the galvanostatic intermittent titration technique (GITT) has become a widely applied electroanalytical method for the kinetic analyses of LIBs [11–18]. The GITT measures the transient voltage change and open-circuit voltage (OCV) change during the charging and discharging processes using only a constant current supply and specified cut-off intervals [18]. This procedure retrieves both thermodynamic and kinetic parameters and was first developed to examine the lithium-ion diffusion coefficient in host materials in battery electrodes. The GITT can calculate diffusivity values at various states of charge (SOCs) simply by voltage change, unlike the CV, which calculates the overall average diffusivity in the material by the sweep rate technique, and EIS analysis, which requires the fitting of Warburg impedance. Furthermore, other electrochemical parameters such as the OCV and resistance values at various SOCs can be easily gathered and calculated. Therefore, the GITT method has become a very useful electrochemical analysis tool for battery characterization and advances in LIBs.
In this mini-review, the basic principles of the GITT are introduced, from the measurement method to the equation derivation of the diffusion coefficient. It covers the practical applications of how this analysis has been utilized to examine the kinetic properties of materials for LIBs. This mini-review will be helpful to beginners as well as all communities related to battery research.
2. Principle of GITT
2.1 Diffusion coefficient equation derivation
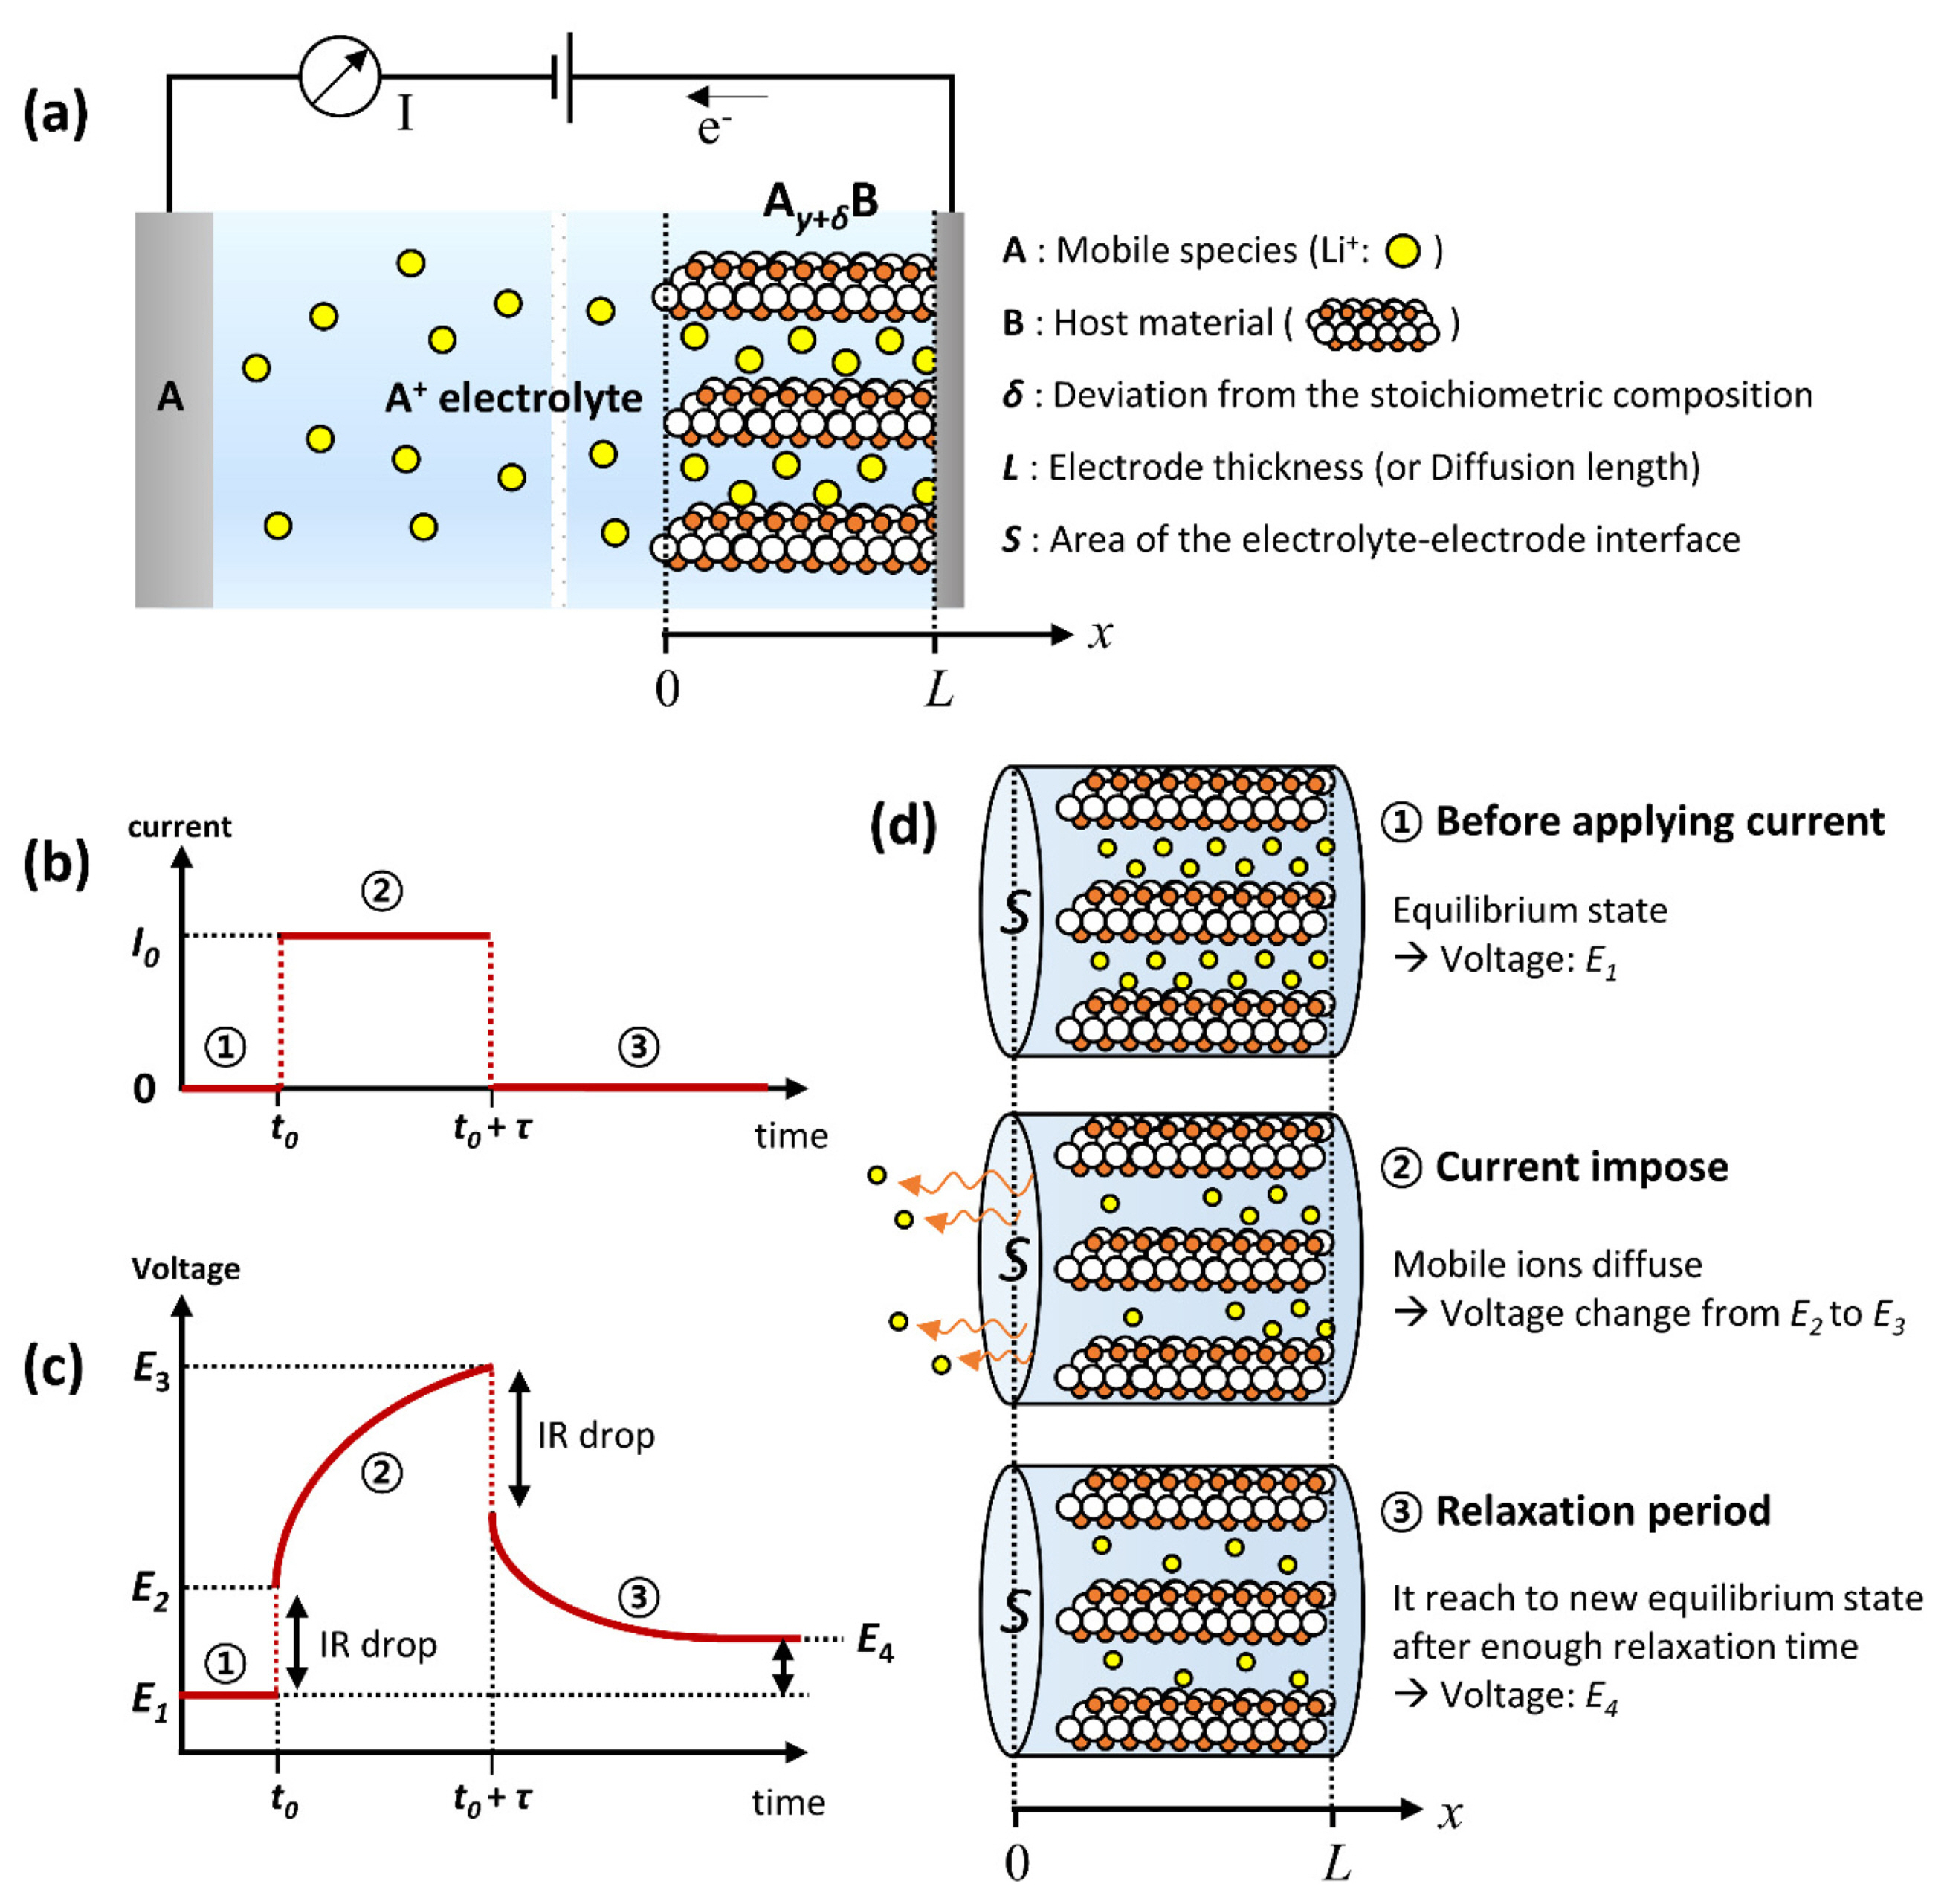
W. Weppner and R.A. Huggins first developed the GITT method in 1977 for kinetic parameter investigation of the compound Li3Sb [18]. The designed cell comprises a pure compound of mobile species, an electrolyte, and a working electrode, as shown in Fig. 1(a). This method is based on the idea that the number of ions passing through the electrolyte can be calculated from the current. That is, the GITT method is derived from Fick’s law by calculating the number of mobile ions moving at the interface between the electrolyte and the electrode phase boundary, correlating with the transient and steady-state voltage measurements.
The GITT experiment consists of a series of constant current pulses, each followed by a relaxation period. A relaxation period occurs when no current passes through the cell. One galvanostatic titration step is illustrated in Fig. 1(b) and (c). The initial state is in an equilibrium state, where the concentration of mobile ions is homogeneous throughout the electrode. When a constant current pulse (I0) is applied at time t0, a sudden voltage step occurs from E1 to E2 owing to the current flux in the form of an IR drop (the voltage increases or decreases when the current is positive or negative, respectively). Here, we consider a situation in which the current value is positive. During the current duration time (τ), the mobile ions (lithium ions, Li+) are deintercalated from the host material, and the voltage changes to E3. After the constant current pulse, the voltage drops again owing to an IR drop. During the relaxation period, the composition of the electrode becomes homogeneous by Li+ diffusion in the material, and the voltage reaches another equilibrium state, E4. This becomes another initial potential (i.e., new E1) for the next galvanostatic titration step. A schematic of the mobile ion movement during the GITT experiment is shown in Fig. 1(d).
To maintain the charge neutrality of the electron and Li+ from the redox reaction at the electrode, an electric current (I) can be expressed as Equation (1) using Fick’s 1st law:
where D is the chemical diffusion coefficient of species i [cm2 s−1], ci is the concentration of species i [cm−3], x is the distance coordinate [cm], S is the contact area of the electrolyte and electrode interface [cm2], zi is the charge number (e.g., zLi= 1), and q is the elementary charge (1.602×10⁻¹⁹C). Equation (1) expresses that the external current (I) is equivalent to the number of charge carriers transported in the electrode at the phase boundary with the electrolyte (where x = 0 in Fig. 1(a)). Because a constant current pulse (I0) is used in the GITT experiment, Equation (1) is expressed as Equation (2) for LIBs:
The concentration gradient ∂cLi ⁄ ∂x is a function of distance (x) and time (t), and the diffusion coefficient can be determined by solving the second-order differential equation:
Equation (3) is Fick’s 2nd law of diffusion. Equation (4) is the initial condition at equilibrium, where the concentrations of Li+ are homogeneous throughout the electrode before applying the current. Equations (5) and (6) are two boundary conditions at x = 0 and x = L, respectively. Equation (5) is transformed from Equation (2), and Equation (6) is a condition in which ions are impermeable at a finite boundary. The solution of the differential Equation (3) under conditions (4 )-(6) is known [19] and can be expressed as follows for x = 0:
where ierfc(z) = [π−0.5 exp(−z2)] − z[1 − erf(z)], and erf (z) is the error function. Assuming that the t « L2⁄D, Equation (7) can be approximated as follows:
Since the GITT experiment does not measure the change in concentration with time but the change in voltage with time, Equation (8) requires further transformation. If the volume change according to the composition can be neglected, the concentration can be related to the change in the chemical composition, and this expression can be denoted as follows:
where VM is the molar volume of the material (cm3 mol−1), and NA is Avogadro’s number (6.022×10²³ mol−1). Inserting Equation (9) into Equation (8) yields Equation (10). Subsequently, expanding by dE yields Equation (11), and the diffusion coefficient can be expressed as Equation (12) by arranging Equation (11). This result implies that the diffusion coefficient is determined by the three variables of cell voltage, time, and stoichiometry deviation.
Here, F is Faraday’s constant (96485 C mol−1), and dE⁄dδ and
d E / d t t d E / d t
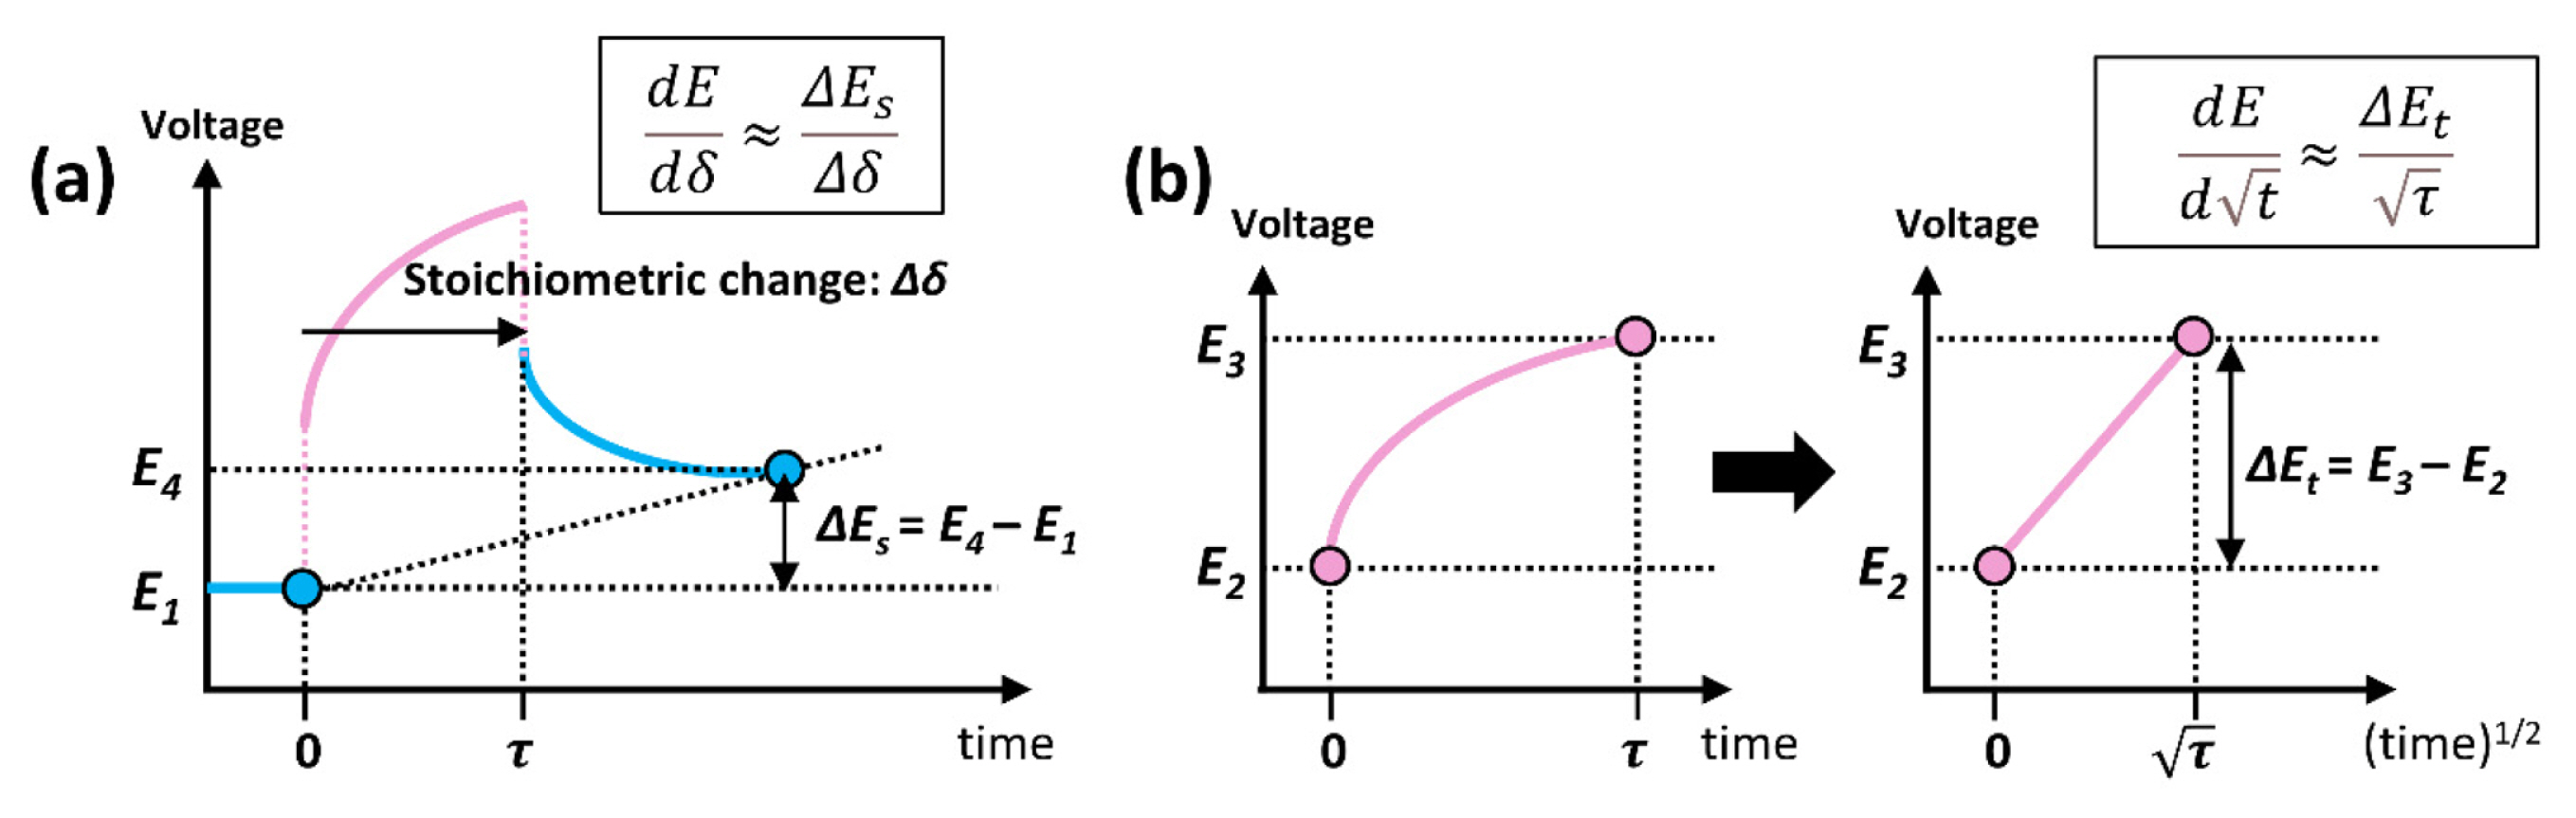
where ΔEs = E4 – E1 (steady-state voltage change) and ΔEt = E3 – E2 (total voltage change during the current pulse) (Fig. 2). Additionally, the stoichiometry change due to the current pulse in the titration step of Li+ can be expressed as Equation (15).
where mB is the mass of the host material in the electrode [g], and MB is the molecular weight of the host material [g mol−1]. Using the simple algebraic form of Equations (13), (14), and (15), the diffusion coefficient can be calculated at each step using the following Equation (16):
In summary, the chemical diffusion coefficient of lithium can be easily calculated based on GITT using Equation (16). VM and MB are the material properties; τ, mB, and S are the values of the experimental condition; and ΔEs and ΔEt are calculated from the GITT experimental results. The main assumptions for the diffusion coefficient equation were that the electrode material should be homogeneous, the molar volume change of the host material is not large enough, the current should be a low value with a short duration time, and the cell voltage should be linear for (duration time)1/2.
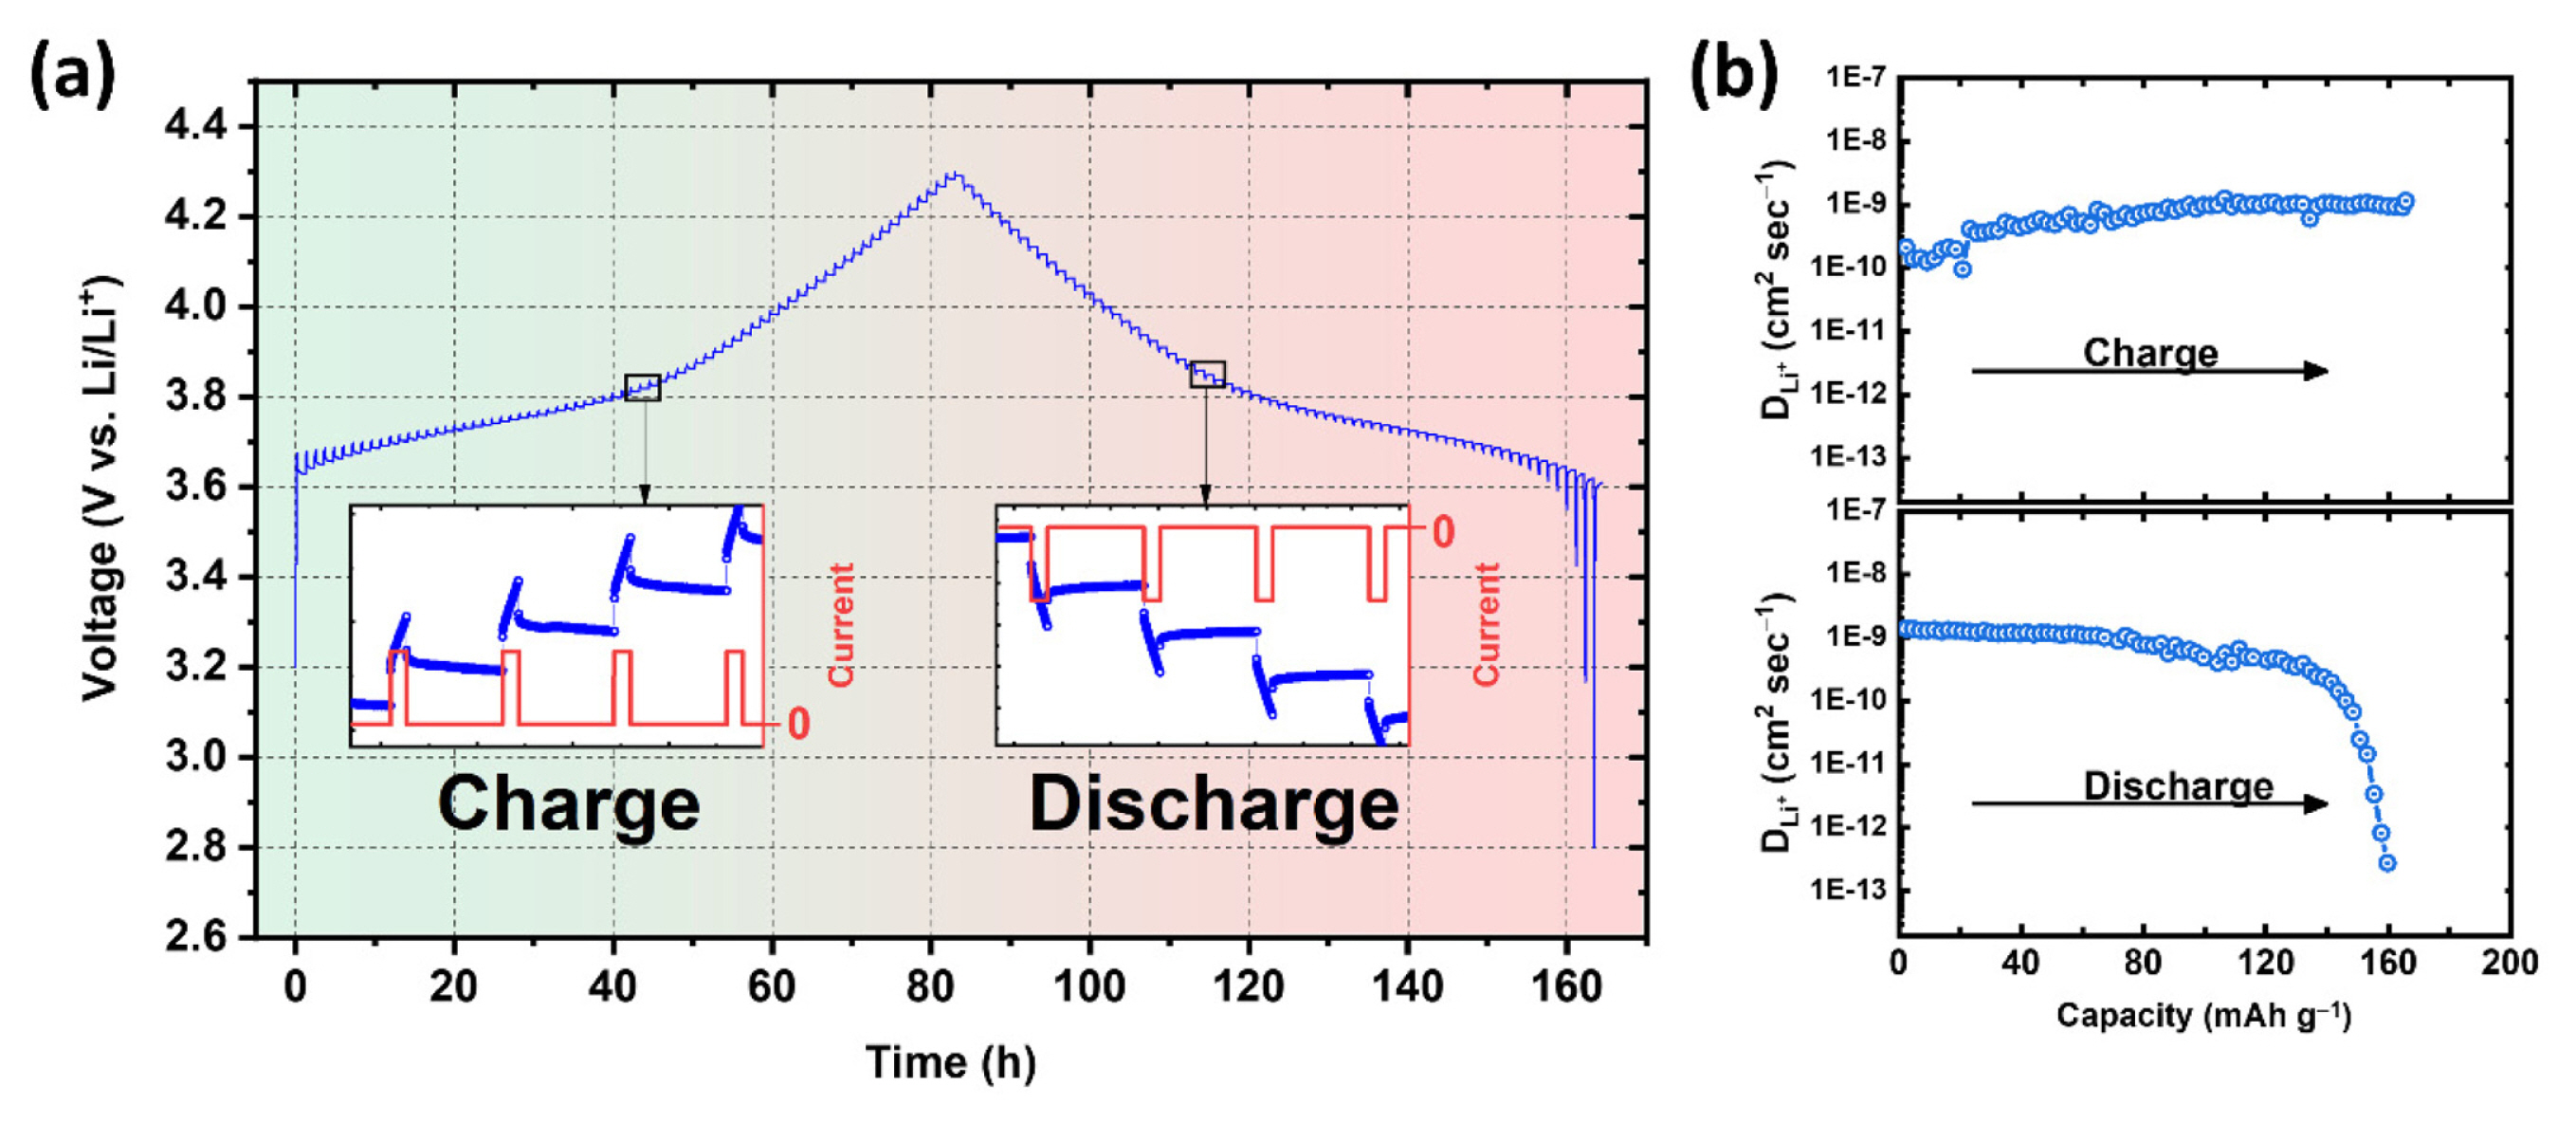
Fig. 3 shows an example of the GITT experiment of the LiNi0.5Co0.2Mn0.3O2 material, which shows the changes in current and voltage over time and the calculated diffusion coefficient. Each step comprised a 10 min current pulse at a current rate of C/20, followed by 1 h of the relaxation period with no current. During the charging process, a positive current pulse increased the cell voltage proportional to the IR drop, and the voltage slowly increased owing to the deintercalation reaction. After cutting off the current supply, the voltage decreased owing to the IR drop and continued to decrease, reaching the equilibrium state by Li+ diffusion. During the discharging process with a negative current pulse, the voltage changed in the opposite direction (Fig. 3(a)). The diffusion coefficient can be calculated for various SOCs in the material by repeated galvanostatic titration steps during charging and discharging processes (Fig. 3(b)).
2.2 Experimental condition and practical limitations of GITT
In measuring the diffusion coefficient using GITT, it is critical to set a reasonable experimental condition. Based on the assumptions for the diffusion coefficient equation, setting the small current injection for a short time followed by sufficient relaxation time is essential, as aforementioned. Some experimental conditions used for GITT, such as current rate, duration time of the current, and relaxation time, are summarized in Table 1 for comparison. Usually, the GITT experiments were performed with a current rate of about C/20 ~ C/10 for about 5 ~ 30 min in the current injection step. The relaxation time setting was varied, as the time to reach the equilibrium state after the current injection is different for each. Therefore, this condition should be properly established during the GITT measurement to collect the electrochemical responses without any misunderstanding.
Though the GITT is a powerful electroanalytical method for the kinetic analyses of LIBs, some practical limitations exist. First, this method takes a long time to fully measure due to the short current injection time at a low current rate and a long relaxation time. Depending on the experimental conditions, it may take more than a month [36]. Second, the materials which undergo phase transitions and pulverization are hard to apply, as they go against the assumptions for the diffusivity equation [18,37–39]. Third, extracted diffusion coefficient information from the GITT is not an absolute value. An electrode used in LIB is a heterogeneous system that contains active material, conductive agents, and binders. There is a distribution of particle sizes, and different diffusion regimes exist because of this porous composite electrode configuration so that reliable quantitative diffusion coefficients are difficult to extract from GITT alone [39,40]. Nevertheless, GITT can easily obtain a relative measure of diffusion. Additionally, thermodynamic information can be extracted regardless of the materials, enabling us to understand and trace the electrochemical reactions in the system. Further detailed GITT applications will be addressed in the next section.
3. GITT Application to LIBs
3.1 Diffusivity comparison of materials
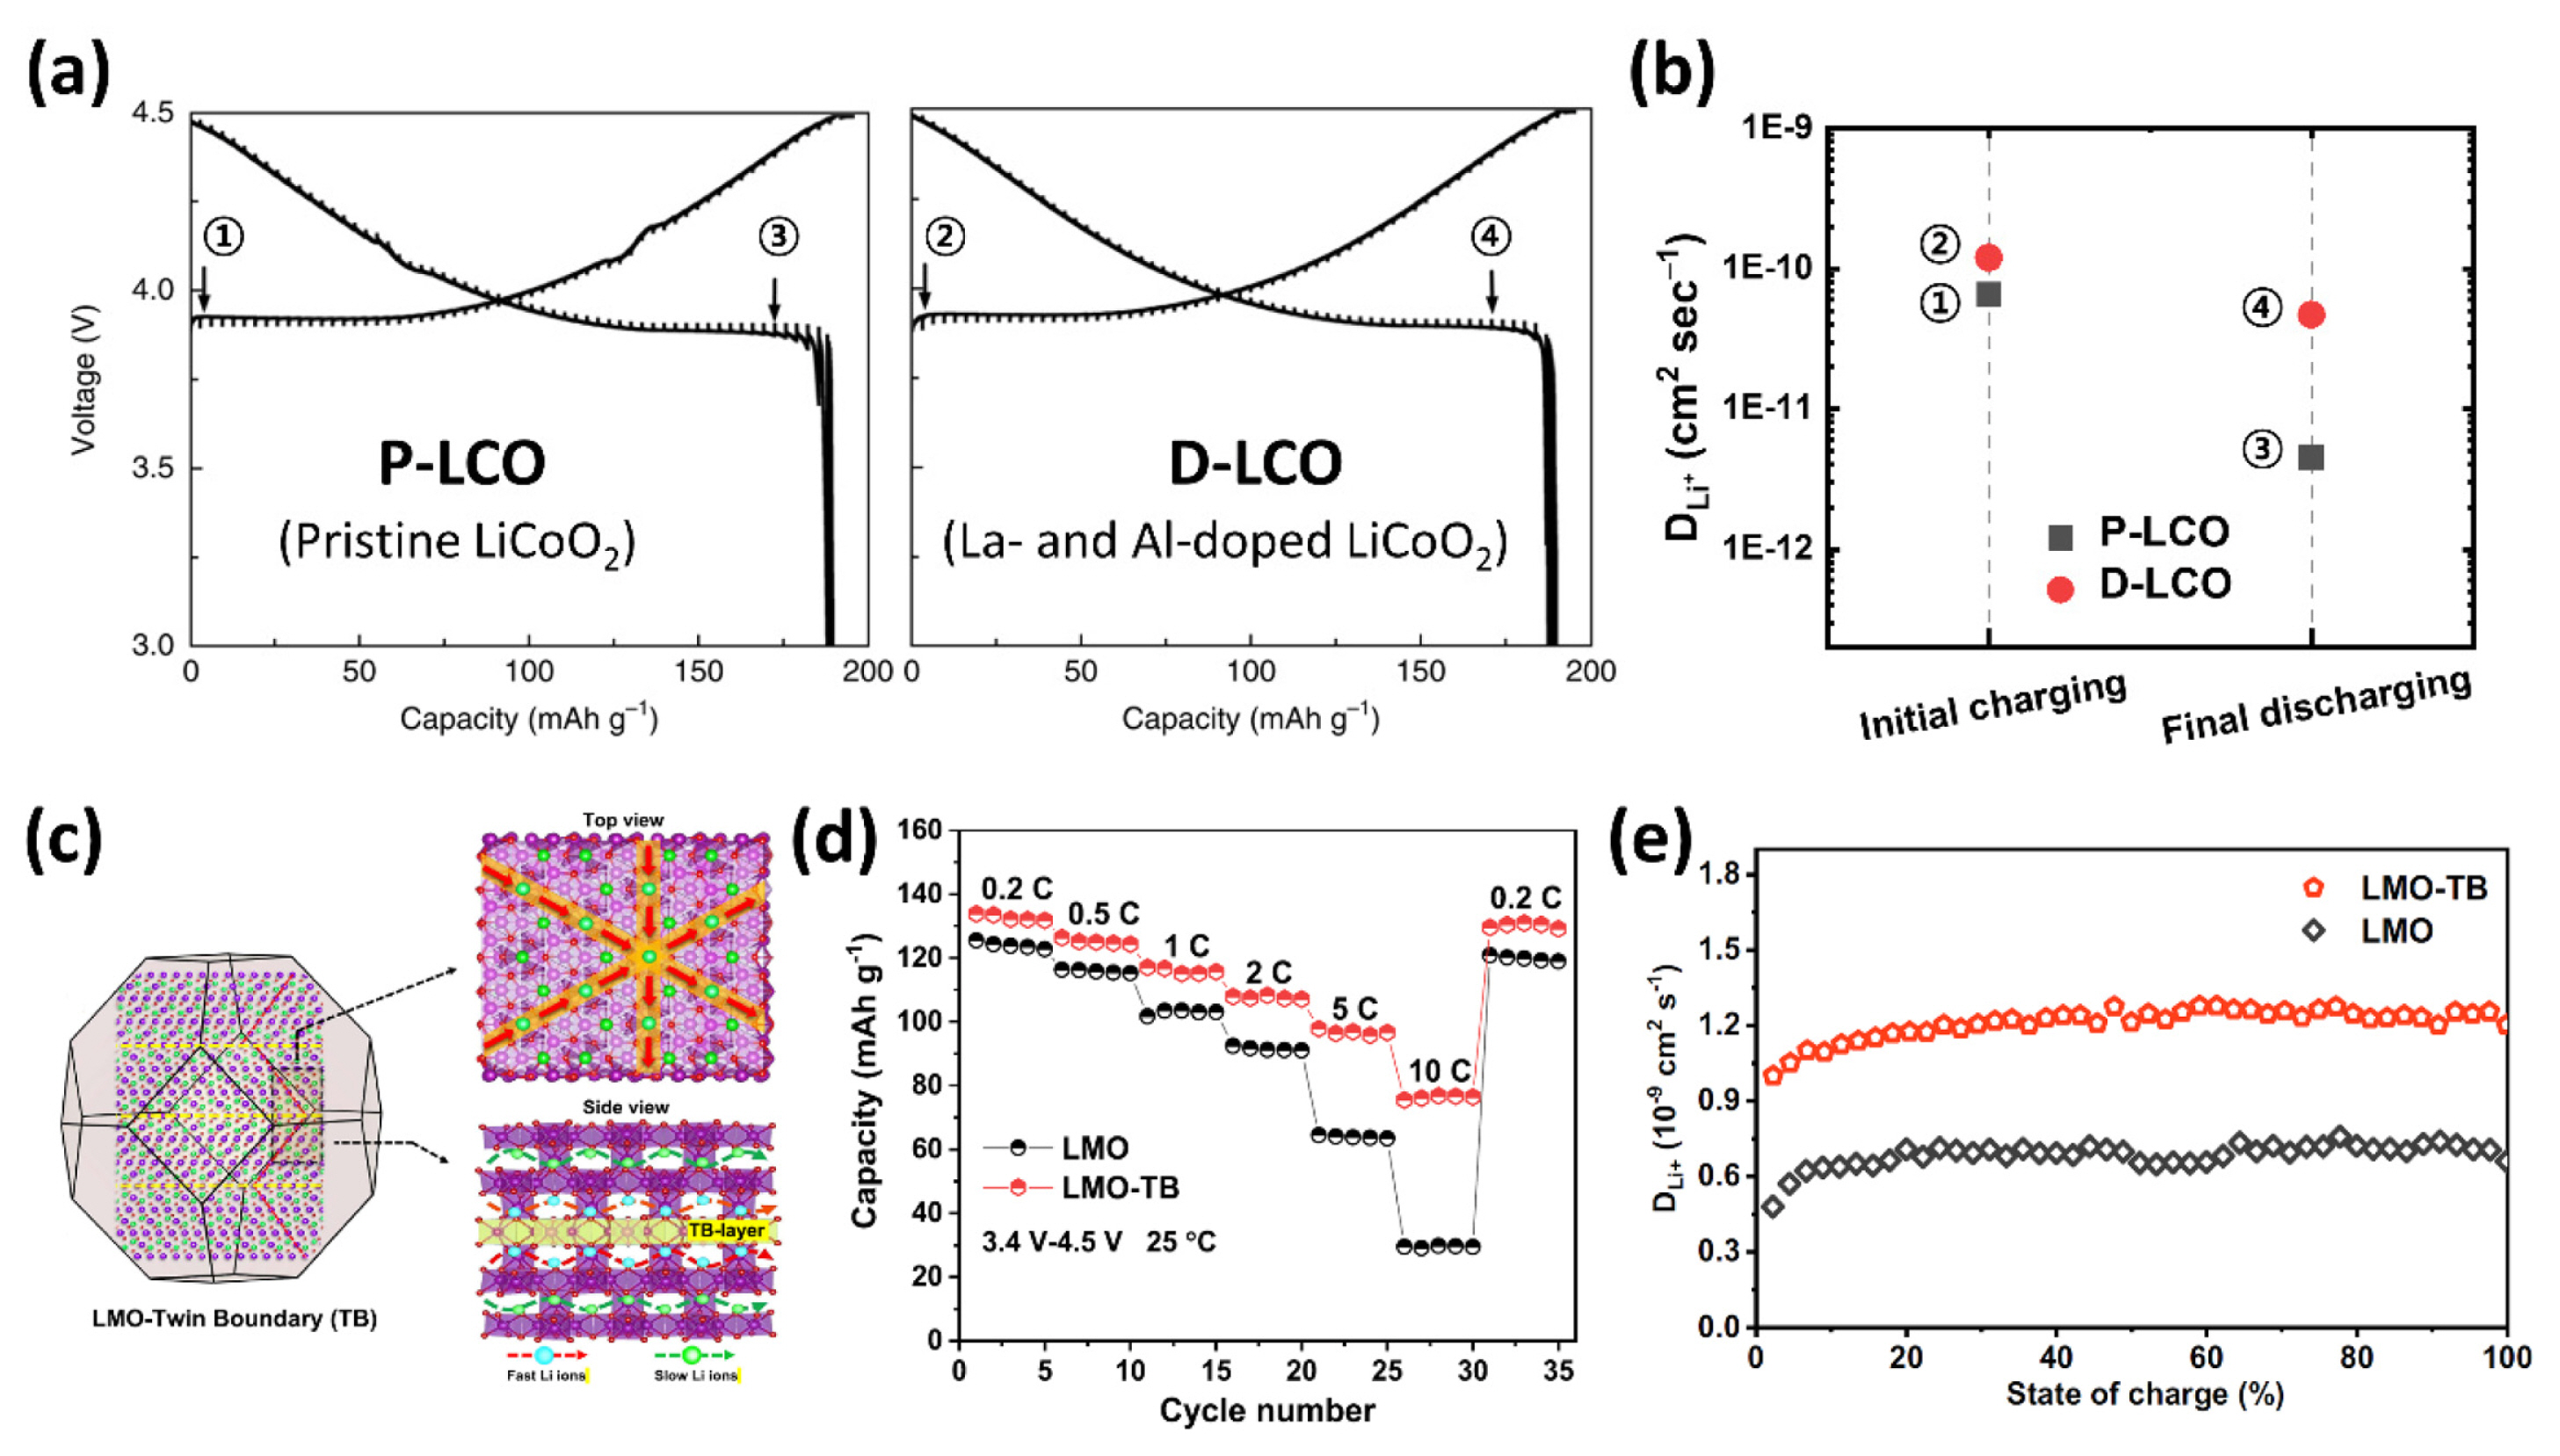
Numerous studies have been conducted on the lithium diffusion coefficient for various electrode materials in LIBs [12,24,41–43]. Because the diffusion coefficient Equation (16) is derived from some approximations as mentioned previously, some studies have used the newly derived diffusion equation from Equation (12) or combined it with CV and EIS analysis to minimize system error [25–27,37,43,44]. However, because the particle size of the material, electrode configuration, loading level, etc., are all different for each study, this approach results in a few orders of difference for the diffusion coefficient, making it difficult to compare the absolute values. Therefore, the GITT was applied to investigate the differences or changing tendencies between the comparative groups using the same experimental conditions [12,27–30]. For example, Liu et al. [27] utilized the GITT to investigate the doping effects for high voltage operation (4.5 V vs. Li/Li+) between pristine LiCoO2 (P-LCO) and La- and Al-doped LiCoO2 (D-LCO), as shown in Fig. 4(a). They showed that the larger La ions in the structure effectively enlarged the c-axis, increasing the diffusion pathway, and Al ions prevented the order-disorder transition, which substantially lowered the Li+ diffusivity from a structural point of view. The Li+ diffusivity values determined via GITT for D-LCO were twice those for P-LCO at the initial charging stage and ten times greater at the final discharging stage (Fig. 4(b)), resulting in a significantly enhanced rate capability. Wang et al. [12] showed a highly improved fast-charging performance in spinel lithium manganese oxide (LiMn2O4, LMO) by introducing a considerable number of twin boundary defects in the lattice via a defect engineering approach (Fig. 4(c, d)). They demonstrated that fast charging was enabled owing to the highly improved diffusion coefficient using the GITT (Fig. 4(e)), as well as CV analysis using the Randles-Sevcik equation mentioned above.
The changing tendency of diffusivity in various SOCs was analyzed by Hong et al. [29], correlating with the structural evolution of Ni-rich cathode materials, namely LiNi0.8Co0.1Mn0.1O2 (NCM811). They elucidated the changing tendency of the diffusion coefficient during charge and discharge as follows: The slow lithium diffusion in bulk in the initial SOC is due to the rare vacancies for diffusion. As the charging progresses, newly formed vacancies by the extraction of lithium and increased size of lithium pathways facilitate the diffusion kinetics, but the rapid shrinkage of the lithium layer at the end of the charge resulted in decreased diffusivity values. At the initial stage of discharge, the presence of concentration polarization facilitated an intercalation reaction with the highest diffusivity values. This tendency was maintained, and a drastically reduced value was observed at the end of discharge owing to the decreased size of the lithium pathway and the small number of lithium vacancies. The difference in the second cycle at the initial state of charge is due to the activation of the bulk structure of the H1 and H2 phases. The diffusivity value was the same when the lithium content was the same during the 2nd cycle.
3.2 Open-circuit voltage (OCV) analysis
As mentioned above, GITT is a method for measuring transient voltage changes during current supply and OCV after cutting off the current. In such processes during charge and discharge, thermodynamics can be retrieved and used to analyze the material properties as a function of the SOC. In other words, the OCV analysis provides key information on the thermodynamic properties of a cell.
The electrochemical response of an active material is influenced by its intrinsic material properties. The chemical potential (μ) difference of the lithium ions between the anode and cathode is termed as the OCV [45,46].
In the above Equation (17)V(x) is the equilibrium potential (i.e., OCV), where x is the amount of lithium, and e is the magnitude of the electronic charge. The chemical potential of lithium varies not only for the site in the crystal structure of the active material but also for the types and ratios of transition metals in alkali-ion transition metal oxides [7,45]. Therefore, the GITT method can be a powerful tool for examining the thermodynamic characteristics of materials. For example, Kim et al. [47] employed the GITT experiment combined with theoretical calculations to understand the fundamental characteristics of transition metals and their interactions in a given structure of Ni-rich layered cathode materials. As shown in Fig. 5(a), they investigated the correlation between the Ni and Mn ratios and the electrochemical behavior of the layered Ni-rich cathode for LiNi0.5Co0.2Mn0.3O2 (NCM523) and LiNi0.7Co0.2Mn0.1O2 (NCM721). Through first-principle calculations, they demonstrated that the equilibrium potentials based on the redox reactions of Ni2+/Ni3+ are highly dependent on the Mn ratio (NCM523 and NCM721: ~3.7 and 3.5 V) because of a donor electron transferred from Mn to Ni owing to crystal field splitting. Because of the fixed chemical state of Mn4+ in all structures during delithiation, the Ni2+/Ni3+ redox reaction initially contributes to the delithiation process, and the Ni3+/Ni4+ redox reaction is subsequently activated in the structures, resulting in NCM523 exhibiting a higher delithiation potential than NCM721. They confirmed the theoretical calculation results of the GITT measurements.
Furthermore, as OCV reflects the Gibbs free energy in a state of thermodynamic equilibrium depending on the amount of lithium, it can be an indicator for extrapolating the SOC of the materials. For instance, Tsai et al. [48] used the relaxed OCV as a measure of the SOC of a particle and analyzed the dependence of the interfacial charge transfer kinetics on the SOC. Kim et al. [31] used the OCV as an indicator for inhomogeneous reactions in an all-solid-state lithium battery (ASLB) system compared to a liquid electrolyte lithium battery (LELB). It is extensively used as a vital parameter for battery state estimation using BMSs in the battery industry [49,50].
In addition to investigating the equilibrium potential value itself, the GITT can be applied to analyze OCV variation after the current is cut off. As shown in Fig. 1(d), at the beginning of the relaxation period, mobile ions move to positions that minimize the total energy in a given structure to become a homogeneous or equilibrium state. In addition to the direct calculation of the diffusion coefficient, the time to reach an equilibrium state can be another parameter for investigating the transport kinetics of the material [11,32,33,51,52]. In the case of copper oxide (CuO), which is based on conversion reactions, Novák claimed that the CuO electrode needs two months to reach an equilibrium potential after applying a current pulse [51]. Taberna et al. [52] reported similar results for the conversion electrode material, Fe3O4. They showed that a long relaxation period of over 20 days is needed to reach an equilibrium state, which indicates the existence of long-lasting chemical gradients and poor transport kinetics in conversion electrodes. Additionally, Assat et al. [33] used the GITT to examine the kinetic properties of Li2Ru0.75Sn0.25O3 between the two staircase steps during the ‘staircase-like’ first charge. As shown in Fig. 5(b) insets, the time to reach equilibrium potential needed a few hours for the first 3.6 V step. On the contrary, voltage relaxation lasted for 44 h at the 4.15 V plateau, indicating an obvious kinetic difference during the first charging process. Similarly, Wang et al. [11] utilized the GITT to investigate the asymmetric behavior between charge and discharge when the O3-NaLi1/3Mn2/3O2 material experienced a high potential. The discharging curve dropped gradually upon reaching the high voltage redox process over 3.3 V with the simultaneous rapid growth of the overpotential. Two different equilibrium times were observed at weakly and highly charged states, indicating that the hysteresis is triggered toward the last 50% of the charge, hence, defining two domains. This result was further consistent with the nuclear magnetic resonance analysis, in which the existence of a very broad peak is compatible with slow ion dynamics.
3.3 Overpotential and internal resistance analysis
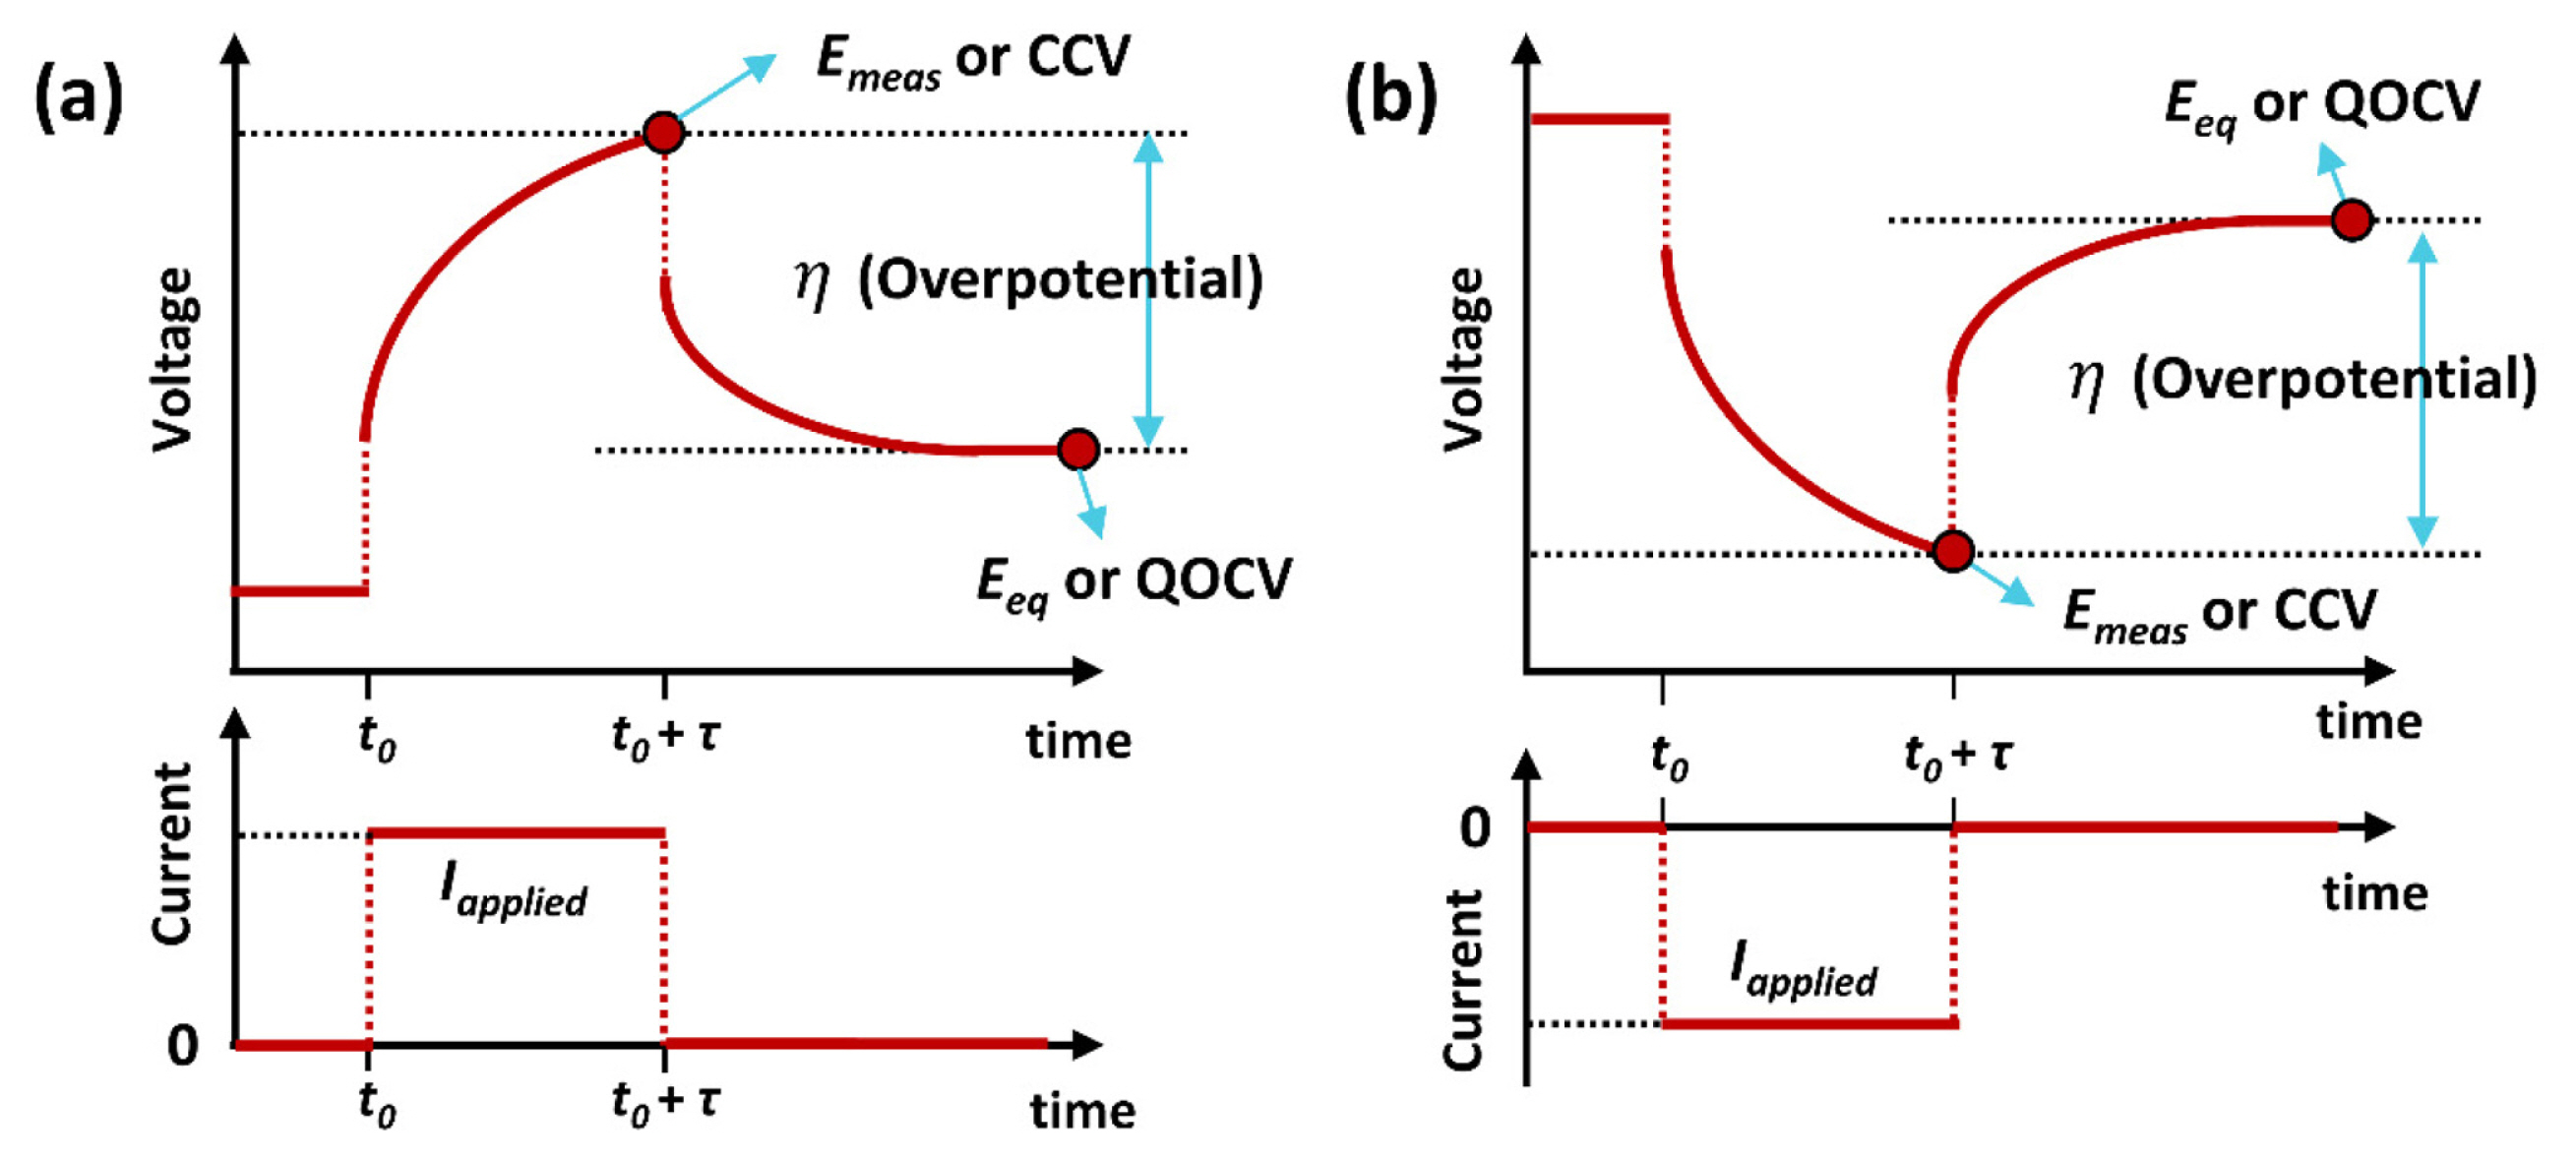
Because the GITT is a procedure for retrieving both thermodynamic and kinetic parameters for various SOCs, another useful information can be calculated, which is the overpotential (η) and internal resistance. Considering the electrochemical reactions occurring at the electrode, an overall electrode reaction encompasses a sequence of reaction steps, such as adsorption, mass transfer, and charge transfer processes from a kinetic point of view [52]. Each step is characterized by a certain overpotential, so that the overall total overpotential can be considered as the sum of each contribution. In the GITT measurement, the total overpotential can be calculated by the difference between the measured cell voltage during the current pulse and the voltage at the end of the relaxation period, as shown in Fig. 6 and Equation (18).
Using the GITT, Lee et al. [28] compared the relative lithium-ion diffusion kinetics of Co-fixed Ni-rich cathode materials, LiNi0.5+xCo0.2Mn0.3-xO2 (x = 0, 0.1, and 0.2) and calculated the overpotential values during the initial delithiation process in various SOCs (Fig. 7). A lower cation disorder of nickel ions and a wider inter-slab for lithium-ion diffusion with increasing nickel content were correlated with lower overpotential values during deintercalation. Cui et al. [53] used GITT measurements to investigate the equilibrium voltage and overpotential variation of the Li-O2 batteries with N-methyl-N-propylpiperidinium bis(trifluoromethanesulfonyl)imide as the electrolyte and vertically aligned carbon nanotubes as the cathode. The equilibrium voltage at 60°C was 2.85 V and showed a zero-voltage hysteresis between discharging and charging; however, the overpotential analysis revealed asymmetrical polarization behavior during discharge and charge. This means that the voltage gap during the discharge and charge originates only from the kinetics and not from the asymmetrical thermodynamic reaction path.
The internal resistance is similar to the overpotential but is a normalized concept. The internal resistance includes the entire resistance in the electrode kinetic factors, similar to the overpotential. This value can be obtained by dividing the overpotential by the applied current (Iapplied) using Equation (19):
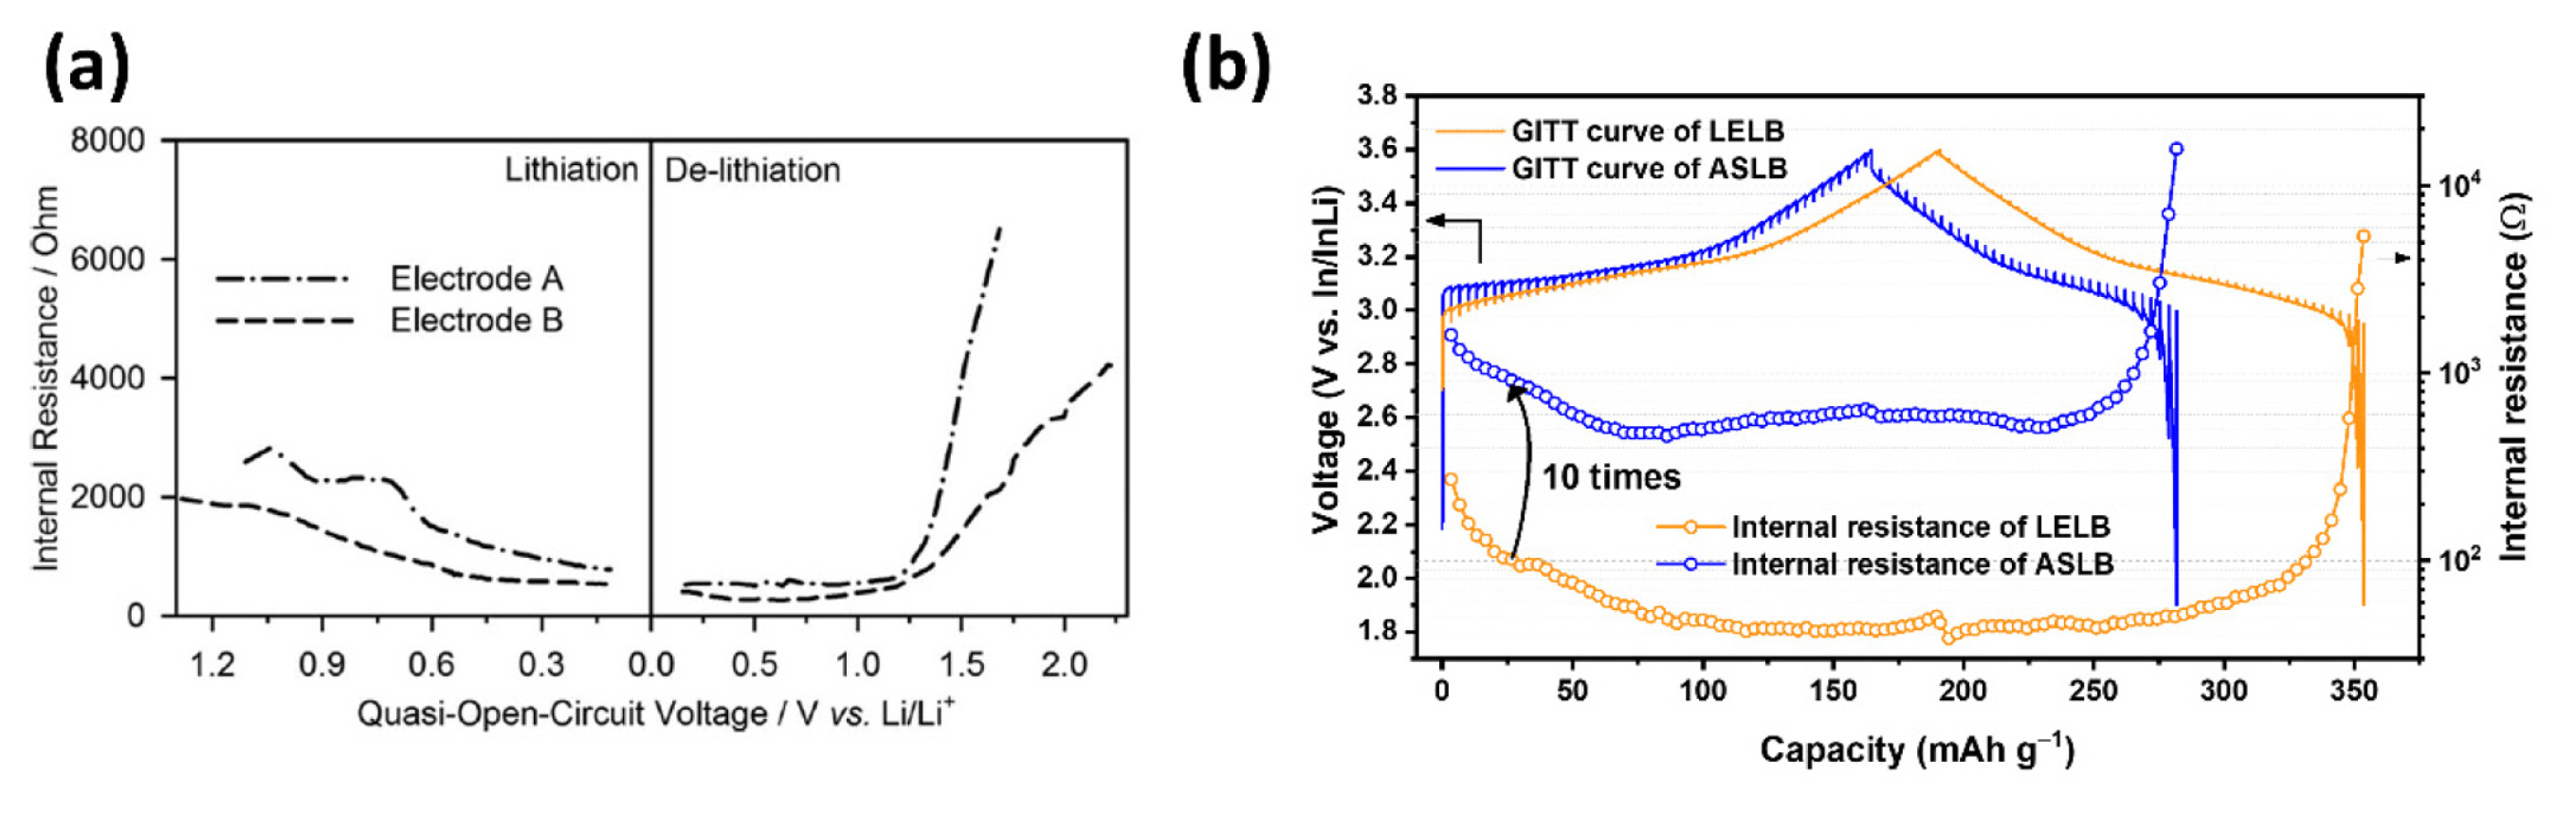
Internal resistance analysis has been widely applied to obtain more insights into the reaction kinetics in various SOCs of the lithiation/delithiation processes or in comparing systems [34,54–58]. For example, Chae et al. [57] conducted a comparative analysis of two nano-sized zinc oxide (ZnO) electrodes in which conductive carbon is embedded in different ways (Fig. 8(a)). They interpreted that the decrease and increase in the internal resistance during lithiation and delithiation is due to the intimate contact change between ZnO particles and the carbon matrix, and the difference between the two electrodes was whether the conductive network with ZnO was intimate or not. Similarly, Lim et al. [34] demonstrated that the smaller internal resistance of nano-sized anatase TiO2/carbon onion hybrid materials (nano-TiO2-C) compared to anatase nano-TiO2 resulted from the conductive carbon network improving the charge transfer kinetics. Internal resistance analysis can also be used to investigate the system after the gas evolution reaction at a high voltage (4.6 V) in a commercial 18650 cylindrical LIB cell [58]. The internal resistances remained similar regardless of the increase in the staying potential (4.6 V) and time; they interpreted that gas evolution has a limited influence on the degradation of the electrodes themselves. The large increase in internal resistance at the end of discharge is due to the higher ohmic resistance and concentration polarization [35]. The internal resistance analysis was also used to compare the different cell systems for LELB and ASLB, as shown in Fig. 8(b) [31].
4. Conclusions
Although the GITT method is notoriously time-consuming because of the short current pulse and sufficiently long relaxation time for reaching an equilibrium state, it is a non-destructive method for effectively investigating the internal process in a battery that has been widely applied for electrochemical analysis. Crucial information about the kinetics of LIBs can be obtained, such as the lithium-ion diffusion coefficient in the material and thermodynamic information. This mini-review encompassed the fundamental principles of the GITT from measurement to derivation of the diffusion coefficient equation and discussed applications for research in LIBs. The diffusion coefficient is an important kinetic parameter that determines the rate capability of LIBs and can be calculated from the GITT results. Through the OCV analysis, the calculated theoretical potential value can be demonstrated with experimental results for various SOCs and is an indicator of the SOC of the active material. In addition, by investigating the relaxation time for being in an equilibrium state after lithium-ion movement, the transport kinetics in the material can be estimated in outline. The overpotential and internal resistances can provide information on the cell dynamics during charging and discharging. By fully understanding the underlying information obtained through the GITT experiment, the results will provide fruitful information on material properties and ideas about the overall electrochemical mechanism in LIBs.