1. Introduction
With the rising demand for energy sources that can replace fossil fuels, various researches are underway to utilize fuel cells as next-generation renewable energy sources [1–5]. Molten carbonate fuel cells (MCFCs) are large-capacity, stationary power generation devices that can use carbon monoxide generated during hydrogen reformation from natural and synthetic gases as fuel. Moreover, MCFCs also facilitate carbon capture and utilization (e.g., conversion of benzene to benzoic acid by carboxylation of CO2 discharged after operation) [6,7]. However, the performance of MCFCs should be increased further to be more competitive than other energy sources. At 650°C, which is the typical operating temperature of MCFCs, the cell life is limited because of the thermal degradation of the cell components. Morita et al. [8] suggested a method to increase the cell life of MCFCs by lowering their operating temperature. They reported that the cell life increased when the MCFC operating temperature was lowered to 600°C. However, if the operating temperature is lowered, the electrochemical reaction rate in the cell decreases, resulting in a reduction in cell performance. To solve this problem, methods to improve MCFC performance at low temperatures should be investigated.
In an MCFC, when the gas and electrolyte meet on the surface of the porous electrode, the following reactions occur:
Anode reaction:
Cathode reaction:
The oxygen reduction reaction at the cathode is slower than the hydrogen oxidation reaction at the anode. If the operating temperature of the MCFC is lowered, the cell performance decreases considerably because of the reduction of oxygen reduction reaction at the cathode [9]. To improve the performance of MCFCs at low temperatures, it is necessary to enhance the oxygen reduction reaction by expanding the triple phase boundaries (TPBs), where the gas and electrolyte meet on the cathode surface. Many researchers have already reported on the improvement in cell performance by the application of a coating to expand the TPBs of the cathode [10–12]. Song et al. coated submicron LiNiO2 on the cathode and verified the improved performance of MCFCs. The submicron LiNiO2 coating expanded the TPBs of the cathode by providing a large surface area. This study aims to improve cell performance by expanding the TPBs using a cathode coated with nanosized LiCoO2 particles. Similar to LiNiO2, LiCoO2 has been considered as a substitute cathode material for MCFCs [13]. When nanosized LiCoO2 particles are coated on the cathode, the coated cathode acquires a double pore structure, as shown in Fig. 1. The LiCoO2-coated cathode can expand the TPBs by the large surface area of the nanosized LiCoO2 particle coating layer. Therefore, the cell performance is expected to improve by the expanded TPBs of the LiCoO2-coated cathode. Furthermore, the pore structure of the coating can be maintained stably because LiCoO2 has higher rigidity than lithiated NiO, which is used as the cathode material [14–16]. If the pore structure of the cathode collapses, gas diffusion and electrolyte impregnation through the pores are inhibited. However, the double pore structure ensures that the pore structure is maintained [17]. That is, a cell having a double pore structure on the cathode by LiCoO2 coating will exhibit a stable operating performance in the long term. To prepare the LiCoO2-coated cathode, the decal coating method was used. In the decal coating method, a slurry solution is used to produce a sheet using a doctor blade; the sheet is dried and then pressed onto the cathode using a hot press. This method is appropriate for mass production because it can produce sheets of uniform thickness, the thickness of the sheet can be easily adjusted, and the cost of the coating process is low. To examine the differences in the cell performance according to the coating thickness, cathodes were fabricated with different coating amounts of LiCoO2. Single cells were assembled using the fabricated LiCoO2-coated cathodes, and the cell performance was evaluated.
2. Experimental
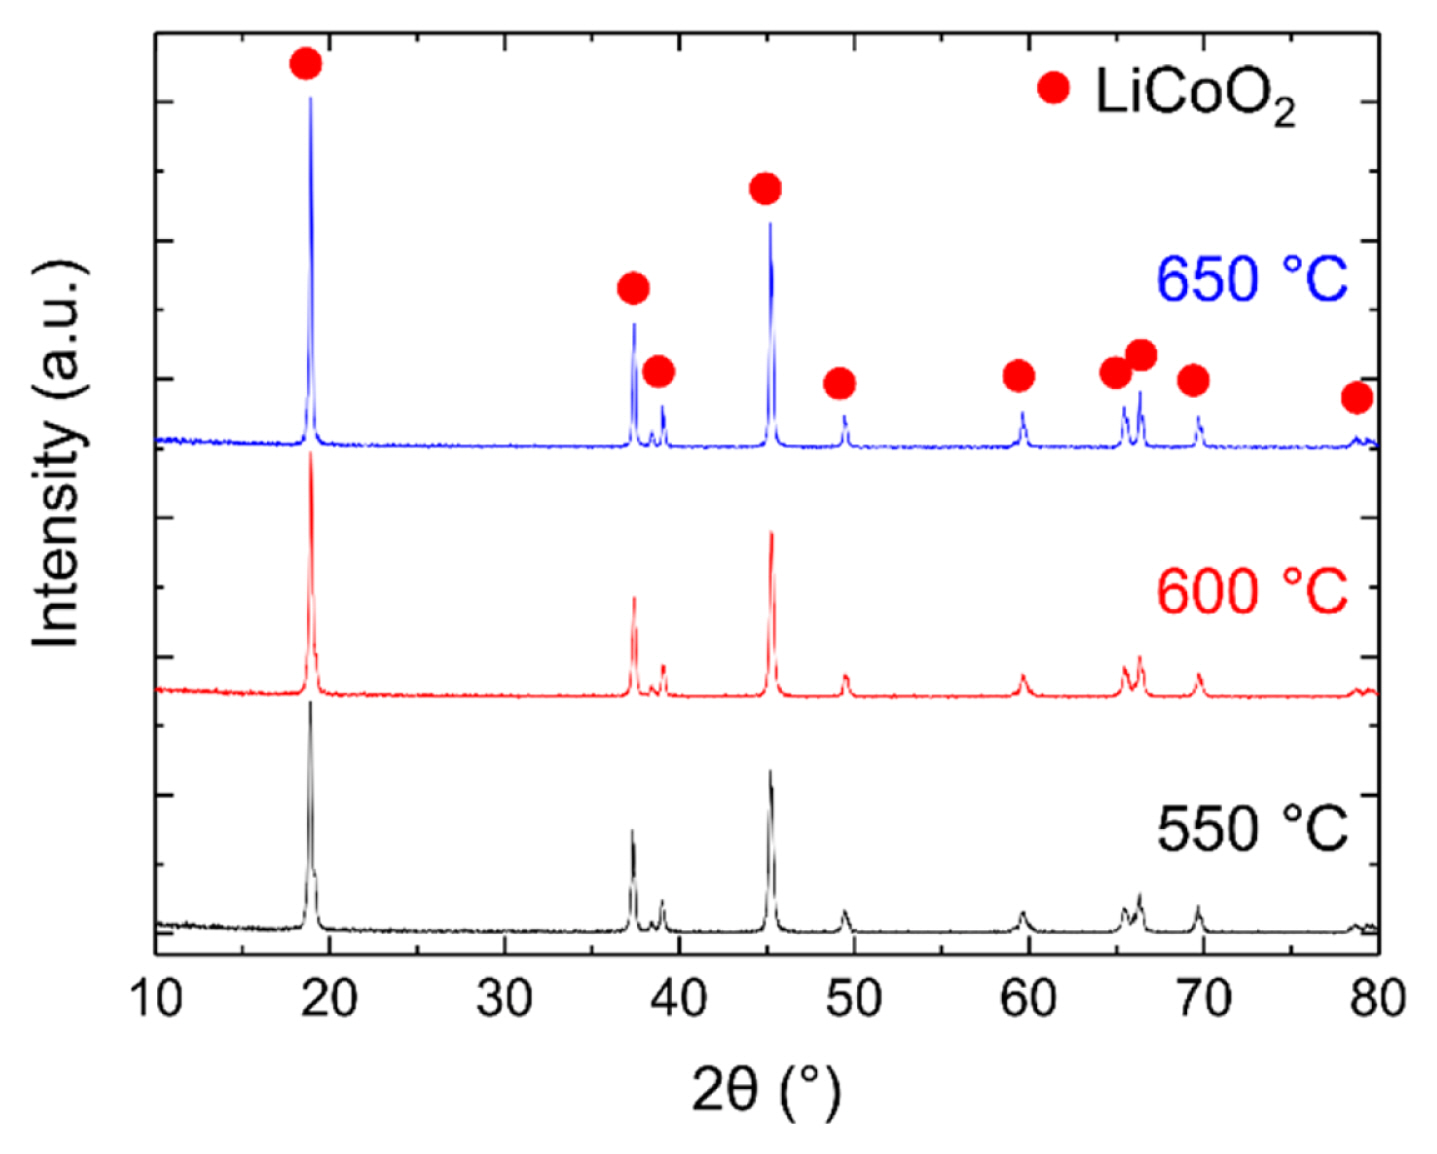
To produce LiCoO2 powders, LiNO3 (Junsei Chemical, Japan) and Co nanopowder (Nano Technology, Republic of Korea) were mixed in a mortar at a mole ratio of 1:1. The mixed powders were heated at 5°C min−1 in an air atmosphere and heat-treated at 550–650°C for 3 h. To verify the formation of LiCoO2, the heat-treated powders were analyzed by X-ray diffractometry (XRD; RINT-2000, Rigaku, Japan) with Cu Kα radiation at a scan speed of 0.3° min−1. In addition, to determine the size of the powder particles, the heat-treated powders were observed by scanning electron microscopy (SEM; MIRA3, TES-CAN, Czech Republic).
To produce the coating slurry, the synthesized LiCoO2 nanopowders were dispersed in a solvent of ethanol and toluene (with a volume ratio of 65:35) together with a dispersant (DISPERBYK-110, BYK, Germany) and ball-milled for 24 h. Next, a binder (Butvar B-72, Eastman, USA) was added, and the mixture was ball-milled for 24 h to produce the slurry. The weight ratios of the components used to produce the slurry were as follows: LiCoO2:solvent: dispersant:binder = 59:36:2:3. The produced slurry was poured onto a PET film, and a uniform thickness was obtained using a doctor blade. Then, the obtained layer was dried to produce a sheet. Four types of sheets with different thicknesses were prepared by adjusting the height of the doctor blade such that the weight of the sheet would be 10–25 wt% of the weight of the cathode. Mercury porosimetry (AutoPore IV 9500, Micromeritics, USA) was carried out to evaluate the pore characteristics of the produced sheet. For each thickness, a sheet was cut such that the sheet area was 6.61 cm2, which is the cathode size, and the cut sheet was placed on a cathode; 40% of the pores on the cathode were impregnated with the electrolyte. Then, the coated cathode was produced by pressing the coating onto the cathode at a pressure of 500 kgf cm−2 at a temperature of 90°C for 30 min. The thickness of the LiCoO2 coating was measured by the SEM observation of sections of the LiCoO2-coated cathodes.
The cell performance was measured by operating single cells with an uncoated cathode and a LiCoO2-coated cathode. Table 1 lists the materials used for the anode, cathode, matrix, electrolyte, current collector, and cell frame employed in the cell operation. The single cell was operated under a pressure of 0.21 kgf cm−2 at 600°C while applying a gas utilization of 0.1. The gas was injected at an air:CO2 mole ratio of 70:30 into the cathode and at a H2:CO2:H2O mole ratio of 72:18:10 into the anode. Table 2 lists the operating conditions for a single cell. The performance of the cell was determined by measuring a voltage at a current density of 0–200 mA cm−2 using an electronic loader (ESL-300Z, ELP Tek, Republic of Korea). The resistance of the cell at the open circuit voltage was analyzed in the range of 0.01–1000 Hz using an impedance analyzer (SP-240, Biologics, France). After the operation, the cathodes were collected and observed by SEM.
Since the cell life is affected by Ni dissolution, the uncoated cathode and LiCoO2 pellet were fabricated with the same size (6.61 cm2) and immersed in the electrolyte at a temperature of 600°C for 300 h to determine the dissolved concentration of Ni and Co. The electrolyte was prepared by mixing Li2CO3 (Junsei Chemical, Japan) and K2CO3 (Daejung Chemical, Republic of Korea) at a mole ratio of 62:38 and then ball-milling the mixture for 24 h. The experimental atmosphere was maintained by injecting the mixed gas of air and CO2 (a mole ratio of 70:30) at 30 mL min−1. The electrolyte into which electrode materials were dissolved was analyzed by inductively coupled plasma mass spectroscopy (NexION 300, PerkinElmer, UK).
3. Results and Discussion
To determine whether LiCoO2 was synthesized properly, the synthesized LiCoO2 powder was first inspected by XRD. Fig. 2 shows the XRD patterns of the LiCoO2 powders synthesized at 550, 600, and 650°C. If peak splitting occurs at approximately 37° in the XRD pattern, it indicates the formation of the impurity Co3O4, but in Fig. 2, peak splitting is not observed. This shows that all the synthesized LiCoO2 powders have a LiCoO2 single phase.
During the operation of the LiCoO2-coated cathode cell, smaller LiCoO2 particles are more advantageous for expanding TPBs. Therefore, it is necessary to select powders with small particles from the LiCoO2 powders synthesized at different temperatures by determining the particle size of LiCoO2. Fig. 3(a)–(c) shows the SEM images of LiCoO2 powders synthesized at 550, 600, and 650°C, respectively. Fig. 3(d) shows the size distribution of the LiCoO2 powders synthesized at each temperature; the distribution was obtained by measuring the size of particles from the SEM images. As shown in Fig. 3(a)–(c), the higher the temperature at which LiCoO2 is synthesized, the larger is the particle size. Furthermore, Fig. 3(d) indicates an increase in the average particle distribution with the temperature. The average sizes of the LiCoO2 particles synthesized at 550, 600, and 650°C were 131, 178, and 268 nm, respectively. Consequently, LiCoO2 synthesized at 550°C, which had the smallest particle size, was used for decal coating.
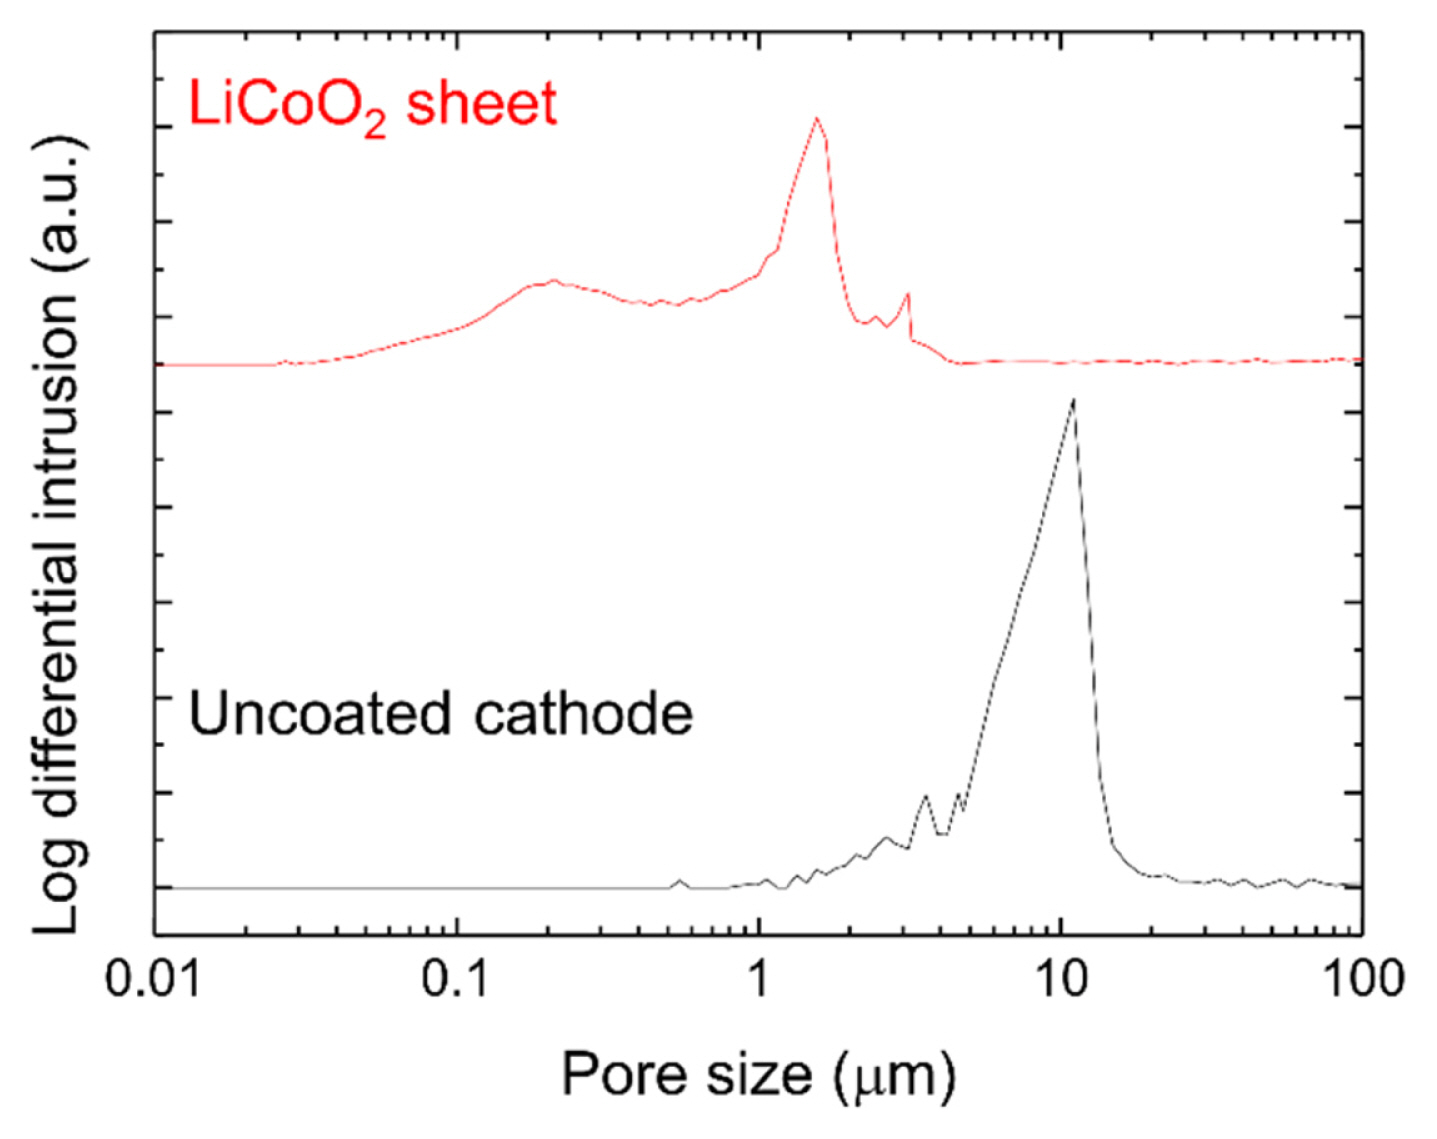
To determine whether LiCoO2 containing nanosized particles had sufficient pores and a high specific surface area, an uncoated cathode and a sheet fabricated using LiCoO2 synthesized at 550°C were analyzed using a mercury porosimeter. Fig. 4 shows the pore distribution of the uncoated cathode and the LiCoO2 sheet. Table 3 lists the median pore diameters, porosities, and specific surface areas of the uncoated cathode and the LiCoO2 sheet. The pore distribution of the LiCoO2 sheet was smaller than that of the uncoated cathode (Fig. 4), and the median pore diameter was 1.07 μm for the LiCoO2 sheet and 9.33 μm for the uncoated cathode (Table 3). Furthermore, the porosity of the LiCoO2 sheet was 57.1%, which was slightly lower than that of the uncoated cathode (63.1%), but the LiCoO2 sheet had sufficient pores to allow impregnation by the electrolyte. The specific surface area of the LiCoO2 sheet was 3.37 m2 g−1, which was considerably larger than that of the uncoated cathode (0.20 m2 g−1). The LiCoO2 sheet has a high specific surface area because LiCoO2 is produced from nanopowders. Because of the high specific surface area of nanosized LiCoO2 particles, it is expected that the cell performance will be improved by the expansion of TPBs.
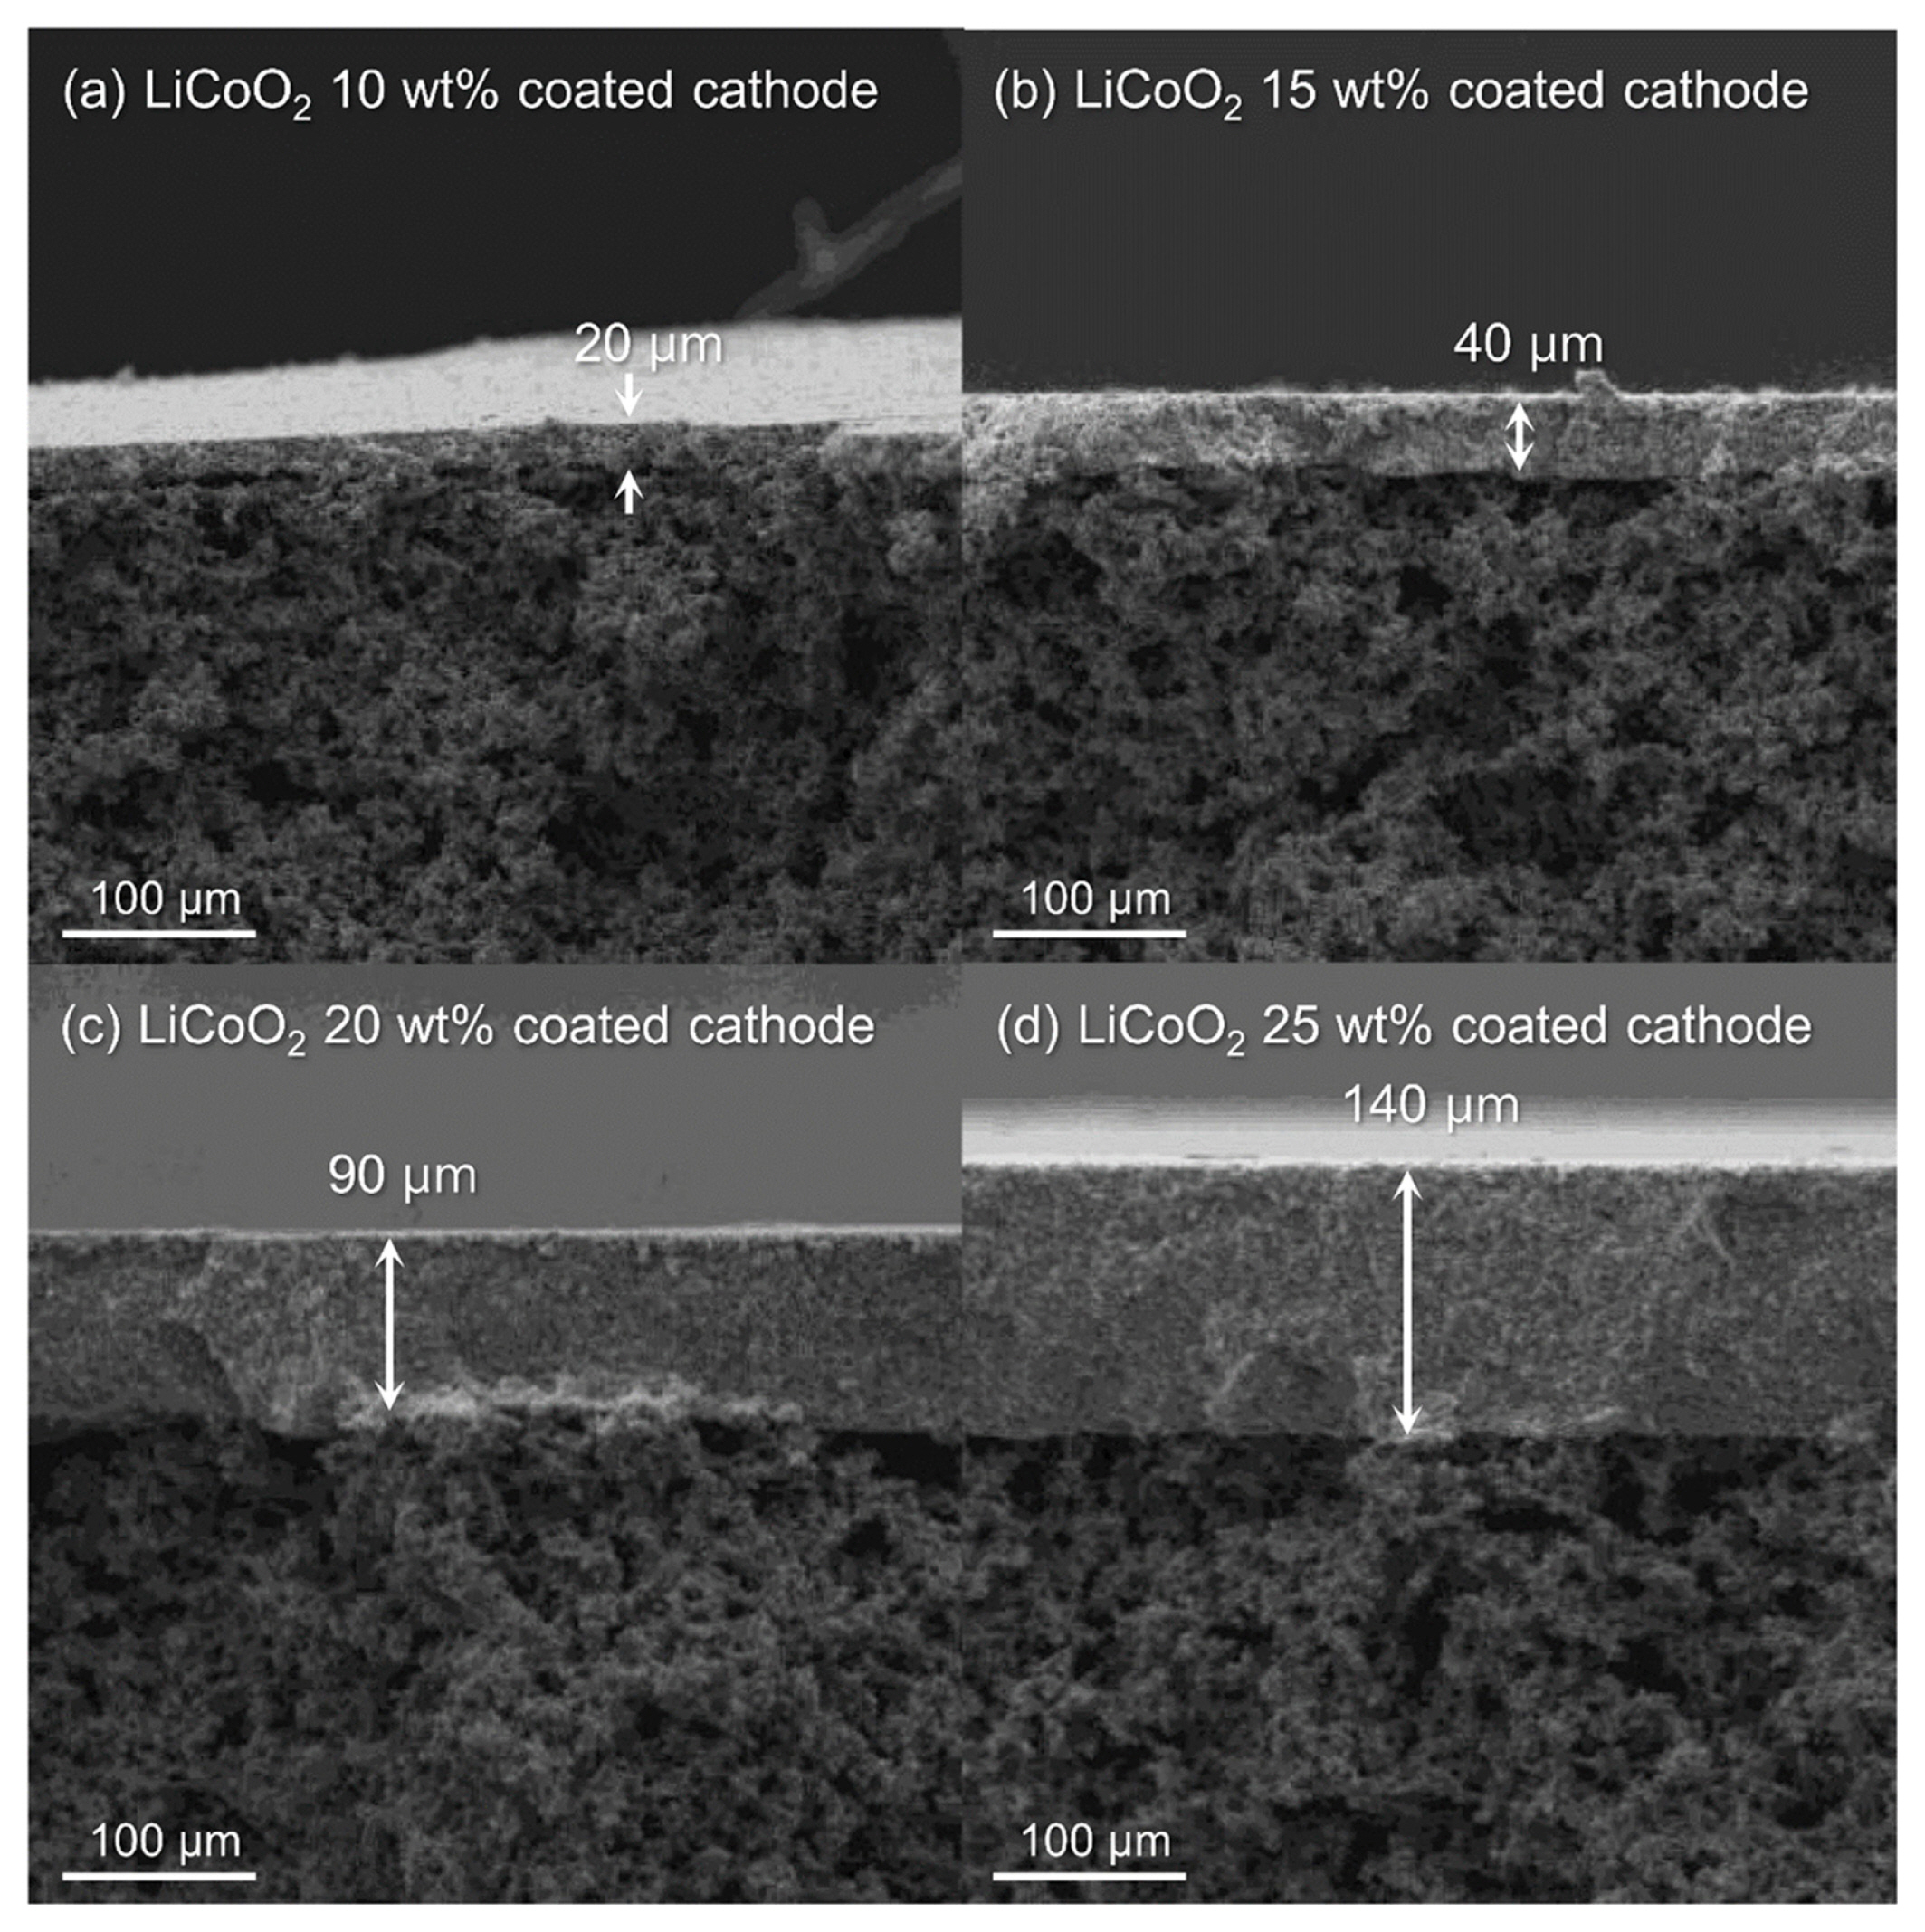
When the cell is operated by using the LiCoO2-coated cathode, the cell performance can be affected by the coating thickness. Hence, LiCoO2 sheets fabricated at 10, 15, 20, and 25 wt% of the cathode weight were coated on the cathodes. Fig. 5 shows the SEM images of sections of each LiCoO2-coated cathode. As the coating amount increased to 10, 15, 20, and 25 wt%, the coating thickness also increased to 20, 40, 90, and 140 μm, respectively.
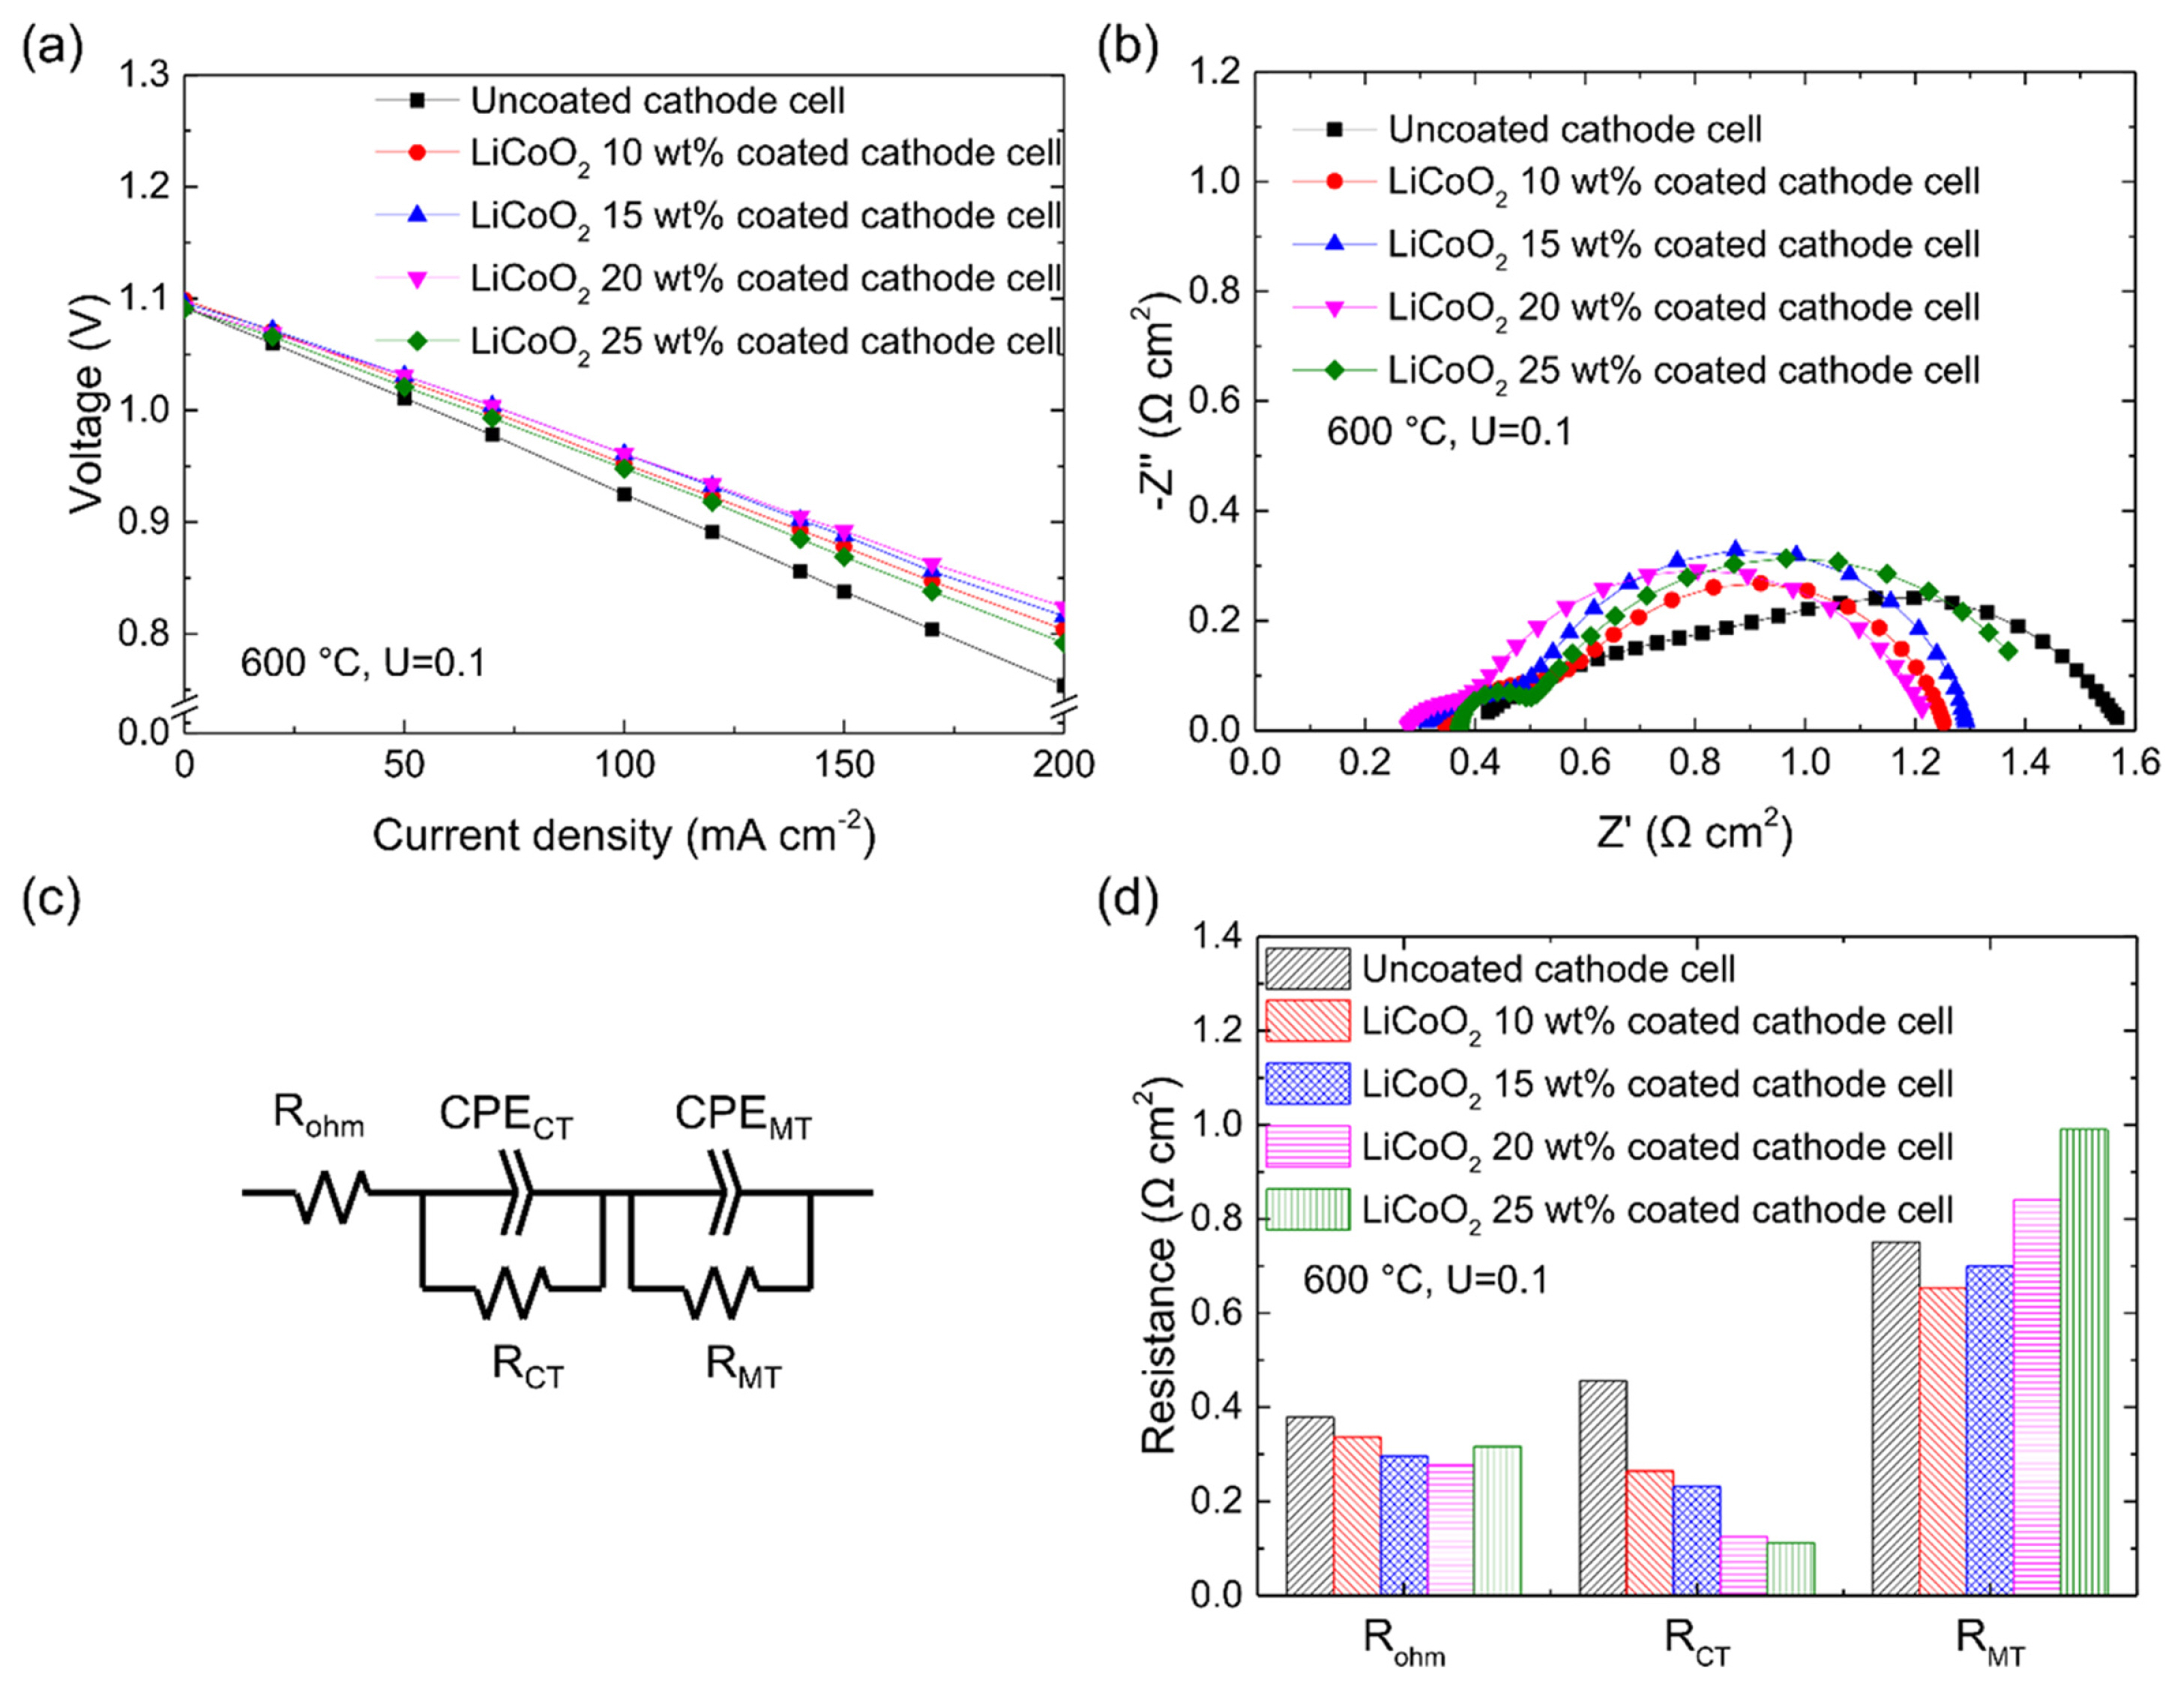
To evaluate the effect of the LiCoO2-coated cathode on the cell performance, 6.61 cm2 single cells using an uncoated cathode and a LiCoO2-coated cathode were operated at 600°C with a gas utilization of 0.1. Fig. 6(a) shows the measurement results obtained at a current density of 0–200 mA cm−2 at 300 h when the cell performance had stabilized. The uncoated cathode cell exhibited the performance of 0.838 V at 150 mA cm−2, whereas all the LiCoO2-coated cathode cells exhibited the higher performance than the uncoated cathode cell. The performances of the LiCoO2-coated cathode cells with coating amounts of 10, 15, 20, and 25 wt% were 0.878, 0.889, 0.892, and 0.869 V, respectively. Thus, the cell with the 20 wt% LiCoO2-coated cathode exhibited the highest performance.
Electrochemical impedance spectroscopy (EIS) analysis was performed to analyze the cause of the performance improvement of the LiCoO2-coated cathode cells, and the results are shown in Fig. 6(b). The uncoated cathode cell exhibited the largest resistance, whereas the cell with the 20 wt% LiCoO2-coated cathode exhibited the smallest resistance. Fig. 6(d) shows the result of dividing the resistances in Fig. 6(b) into ohmic resistance (Rohm), charge transfer resistance (RCT), and mass transfer resistance (RMT) by carrying out fitting using an equivalent circuit, as shown in Fig. 6(c). The resistance analysis result in Fig. 6(d) shows that the differences in the Rohm values between the uncoated cathode cell and LiCoO2-coated cathode cells were relatively small, but RCT decreased as the LiCoO2 coating became thicker. It seems that RCT decreased because the TPBs expanded with the LiCoO2 coating thickness. RMT was the smallest in the 10 wt% LiCoO2 coating, but it increased with the coating amount. This trend can be explained as follows. When the coating was thin, RMT decreased because the electrolyte was transferred to the cathode by capillary force due to the small pores of LiCoO2. In contrast, when the coating became thicker, RMT increased because it was more difficult for the gas to diffuse into the coating. Consequently, the cell with the 20 wt% LiCoO2-coated cathode, which had the smallest sum of RCT and RMT, exhibited the best performance.
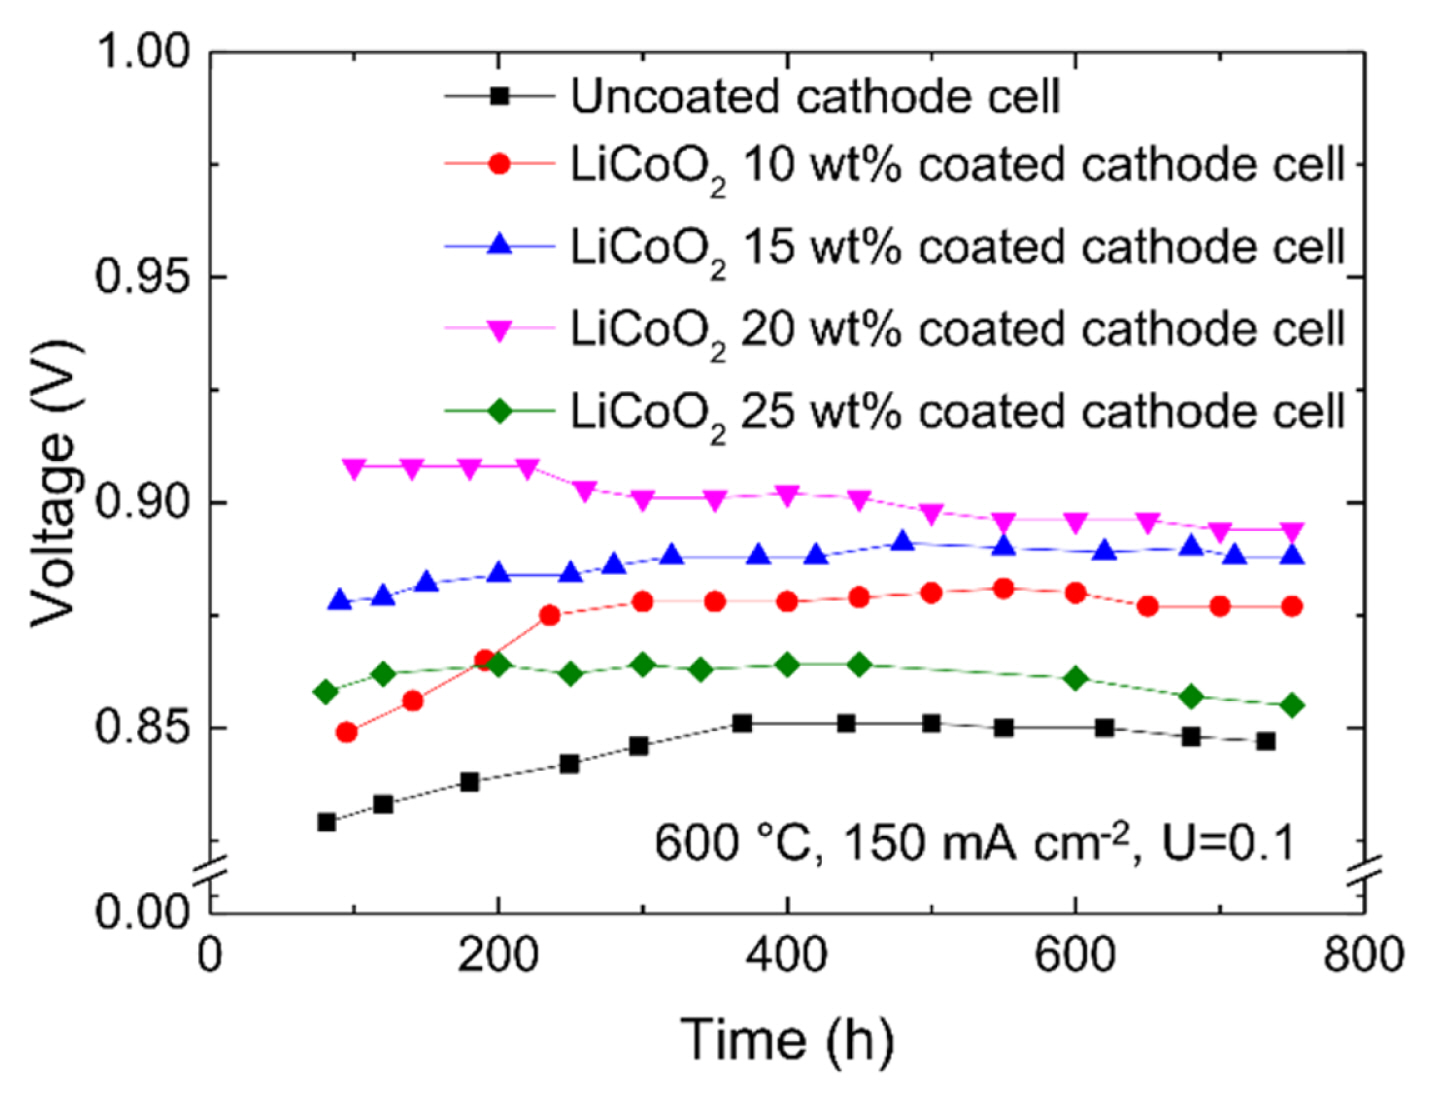
To verify the long-term performance stability of the cell, the uncoated cathode cell and LiCoO2-coated cathode cells were operated continuously for approximately one month (720 h or 744 h). Fig. 7 shows the performance changes of each cell over time. Each cell stabilized at 300–400 h. In particular, the cell with the 15 wt% LiCoO2-coated cathode exhibited the smallest fluctuations. To verify the uniformity of the LiCoO2 layer after the operation, the cell with the 15 wt% LiCoO2-coated cathode was decomposed and observed by SEM. Fig. 8 shows cross-sectional SEM images of the cell with the 15 wt% LiCoO2-coated cathode after the operation. As shown in Fig. 8(a) and (b), the LiCoO2 layer was still uniform without collapse and had good contacts with the cathode. Although the pore surfaces of the conventional cathode composed of Ni are wetted with the electrolyte, the pores are sufficiently connected that there is no problem in delivering the reactive gas to the LiCoO2 layer. As shown in Fig. 8(c), the LiCoO2 particles grew and became larger than those shown in Fig. 3(a). Hence, a change in the surface area caused by LiCoO2 particle growth can be expected to be a factor that causes performance changes during long-term operation.
Ni, which is a material of the conventional cathode, is dissolved into the electrolyte in a CO2 atmosphere and reduced at the anode. Hence, Ni can reduce cell life by forming a short circuit inside the cell during long-term operation. To prevent the recurrence of this problem, it is crucial to prevent the materials used for coating on the cathode from being dissolved into the electrolyte. To determine the dissolved concentration of LiCoO2 into the electrolyte, the uncoated cathode and the LiCoO2 pellet were immersed in the electrolyte at 600°C for 300 h. Then, the dissolved concentration of Ni and Co was compared (Table 4). The dissolved concentration of Co from the LiCoO2 pellet was considerably smaller than that of Ni, which was the uncoated cathode material. Therefore, there is no evidence to justify that the dissolution of Co from the LiCoO2 coating into the electrolyte would result in a decrease in the stability of the cell.
4. Conclusion
In this study, to expand the TPBs of the cathode, a cathode with a double pore structure was fabricated by decal-coating nanosized LiCoO2. LiCoO2 can enhance the oxygen reduction reaction by expanding the TPBs of the cathode because it has a high specific surface area. LiCoO2-coated cathodes were fabricated with different coating amounts of LiCoO2 and different coating thicknesses. Single cells were fabricated and operated to examine the performance of the LiCoO2-coated cathode. The LiCoO2-coated cathode cell provided a higher voltage than the uncoated cathode cell. In particular, the cell with the 20 wt% LiCoO2-coated cathode provided the highest voltage. The cause of the performance improvement was investigated through EIS analysis, and the results indicated that the reduction in RCT was the most substantial. The reason for the reduction in RCT seems to be the expansion of TPBs, which enhanced the oxygen reduction reaction. Furthermore, the evaluation of the long-term operating performance revealed that the cell with the 15 wt% LiCoO2-coated cathode exhibited the smallest performance change, indicating a stable operation pattern. The LiCoO2 coating should have an appropriate thickness because if the coating is too thin, the TPB expansion effect will be small, whereas if the coating is too thick, gas diffusion will be inhibited. The cell with the optimized 15 wt% LiCoO2-coated cathode could operate stably due to the coating that was maintained evenly during operation. Therefore, based on the results of this study, it is expected that MCFCs with improved performance and better stability can be realized and immediately used in various industries.