


Introduction
Cyclic voltammetry (CV) is the best known electrochemical technique which can show complex electrochemical information such as faradaic and nonfaradaic, charge-transfer controlled and mass-transfer controlled processes, reversible and irreversible reactions and so on. Even though CV is the best as a diagnostic tool for electrochemistry, it is strongly recommended to resort to other techniques if precise evaluation of electrochemical parameters is required. [1-2] Various kinds of pulse voltammetry, current-controlled techniques, and hydrodynamic methods may be used for specific purposes. Among them, electrochemical impedance spectroscopy (EIS) has attracted many attentions in the recent decades [3] because it resolves the electrode/electrolyte interface by frequencies to which individual electrochemical processes differently respond. Nevertheless, EIS is not so frequently used as CV is because it is hard to understand and explain the measured impedance data. [2,4] At that situation, computer-aided simulation can help. [5-6] However, there still remain difficulties such as finding an proper equivalent circuit or mathematical expressions for theoretically modelled electrochemical processes. [7-8] Especially, when the electrochemical reaction is complex [9] or the electrode is modified with functional materials [10], it would be harder or could be almost impossible to find a good electrochemical model to carry out the computer-aided simulation.
In this report, I adapt the finite element method (FEM) to conducting the digital simulation, [11-12] where molecular species and their concentrations are digitized as finite elements of time and space at molecular levels and the first-principle calculation based on charge transfer, mass transfer and chemical reaction rate are carried out to find values of each finite element. Using this simulation method, I study an electrochemical reaction coupled with a chemical reaction by finding the relationship between the current of CV and the resistance of EIS.
Theories and discussion
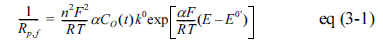
An electrochemical reaction can be described as O + e ŌåÆ R, and the electrode potential (E) and the resulting current (i) can be measured by voltammetry. When the potential is scanned along time, it can be expressed as a function of current and concentrations of redox molecules changing with the scanning time. Hence, the time-derivative is described as below.[1]

The first term on the right side is known as the polarization resistance, Rp, which tells the rate of change transfer at the electrified interface as described by eq(2) [13], while the rest part tells the rate of mass transfer through the diffusion layer.

kf and kr are rate constants for reduction and oxidation reactions, ╬▒ transfer coefficient, n the number of electron transferred, F faradaic constant, R gas constant and T temperature. From the above equation, we can guess that 1/Rp = 1/Rp,f + 1/ Rp,r where each is respectively referred to the following equations.

Here, we can learn that ln Rp,f and ln Rp,r are linear with the electrode potential and the slopes are the same as those of the Tafel plots [1] and the total resistance, Rp, is sum of them. By the way, the intercepts are different due to the concentrations of O and R at the electrified interface.
When an electrochemical reaction becomes complex by the proceeding or following chemical reactions, Rp should be changed because Rp,f and Rp,r are dependent on concentrations of O and R species. When a 1-order homogeneous reaction follows the heterogeneous faradaic reaction,[14]
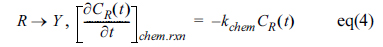
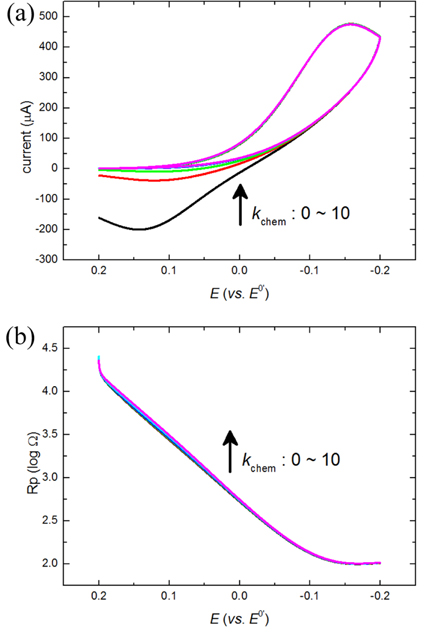
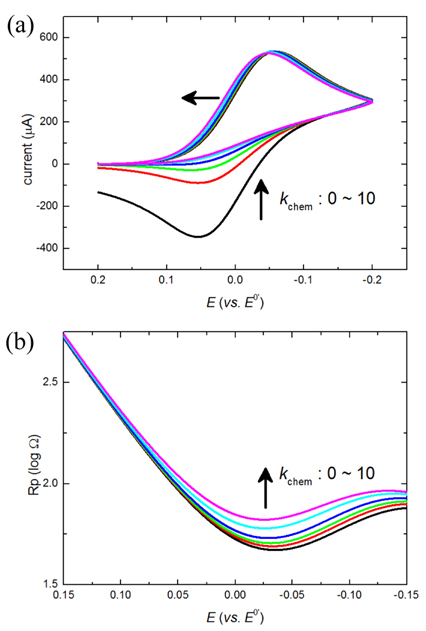
the changing concentrations are taken into account at eq(3). Simulations with changing k0 and kchem leads us to a short conclusion that Rp,f and Rp,r can be almost separately modulated to manipulate Rp. Decrease of k0 increases the intercept of Rp,f while increase of kchem increases that of Rp,r. In other words, the decreased k0 slows down the electron transfer rate of the forward reaction of which the resistance is increased, and the increased kchem decreases CR(t) so that the resistance of eq (3-2) is increased. As results of properly controlling Rp,f and Rp,r, we observe different behavior of Rp. First, even when Rp,f increases by decreased k0, Rp,r can be almost unchanged due to the facile consumption of the R species by the following chemical reaction (R ŌåÆ Y). Consequently, the unbalanced change of Rp,f and Rp,r will make a shift of the lowest Rp to the positive potential direction. Eventually at a very small k0, huge value of Rp,f overwhelms Rp,r such that the electrochemical reaction is totally controlled by the slow forward reaction. This situation is described as an irreversible faradaic reaction because only the forward reaction is dominantly observable and confirmed by simulation of cyclic voltammetry as shown in Fig. 1(a). Also, the total Rp is seen to be mostly determined by the overwhelming Rp,f no matter Rp,r is controlled by kchem as shown in Fig. 1(b).
Fig.┬Ā1.
The cyclic voltammogram (a) and the polarization resistance (b) are obtained by the FEM-based simulation. Simulation parameters are following: the scan rate = 100 mV/s, k0 = 0.001 cm/s, ╬▒ = 0.5 and varying kchem = 0, 0.5, 1, 2, 5 and 10 mM/s. The arrow shows the increasing direction of kchem.
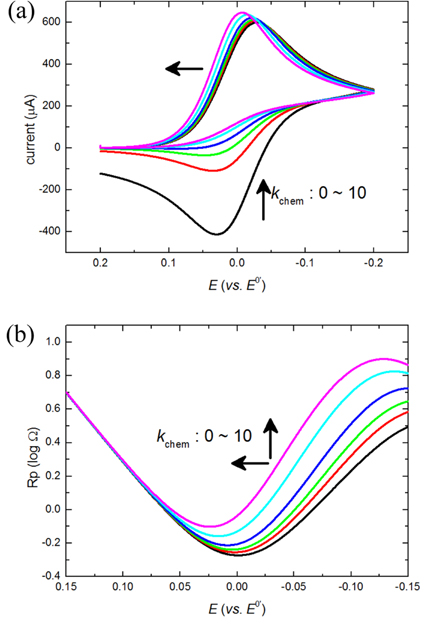
On the other hand, when kchem is gradually increased with high k0, the concentration of R, CR(t), is decreased by eq(4) and Rp,r is increased by eq(3) subsequently while little change of Rp,f is expected from the change of kchem. Fig. 2(b) shows how the total Rp changes according to the change of kchem. The value of the lowest Rp increases and its position shifts to the positive direction as kchem increases. These results can be clearly shown by simulations of cyclic voltammograms in Fig. 2(a). It is not surprising that the position shifts are in accordance with the shifts of the current curves because the lowest Rp goes with the current peaks. However, it is surprising to observe that the current peaks increase with increase of Rp values.
Fig.┬Ā2.
The cyclic voltammogram (a) and the polarization resistance (b) are obtained by the FEM-based simulation. Simulation parameters are following: the scan rate = 100 mV/s, k0 = 1 cm/s, ╬▒ = 0.5 and varying kchem = 0, 0.5, 1, 2, 5 and 10 mM/s. The arrow shows the increasing direction of kchem.
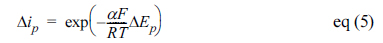
This ironic observation is explained from the aspect of overpotential. When the Rp curves or the current curves of a reduction reaction shift to the positive direction of potential, less overpotentials are required to activate such faradaic reactions. The reduced overpotential generates extra potential at a certain electrode potential. Such superfluous potential can facilitate the charge transfer process, and when the facilitation effect is large enough, it can beat the resistance of charge transfer, Rp. The reduced overpotentials (ŌłåEp) are estimated from the potentials of the lowest Rp, and plotted with the increased peak currents (Ōłåip) in Fig. 3. The linear relationships is explained by the Bulter-Volmer equation below,
Fig.┬Ā3.
The potential shifts and peak currents obtained by varying values of kchem are plotted. The plots are fitted to the Butler-Volmer equation as down the red line. Deviation is shown when the chemical reaction rate is too high because it severely decrease CR(t) in eq(3-2). As a result of that, Rp,r is increased more than exp[ŌłÆ╬▒F╬öE/RT] so that the current becomes less than the expected value.

This is very similar to the Frumkin effect but works oppositely; the Frumkin effect corrects the current with decreased overpotential, [15-16] however this effect does with increased over potential.
Nevertheless, the accelerated charge transfer by the redundant potential is not always observable. When the extra-potential is not enough to overcome the resistance of transferring charges at the electrified interface, we can only observe potential shift without current increase. Such conditions can be made with moderate values of k0 and kchem. In Fig. 4, we can see that increases of k0 and kchem increase both Rp,f and Rp,r, which lead to increase of total Rp with small potentials shifts. At this situation, decrease of over-potential is canceled out by increase of Rp, so that effective acceleration of charge transfer is hampered by the stronger resistance. Eventually, no current increase is observed even with potential is shifted. Fig. 5 shows the overall effects of the combination of k0 and kchem on the peak current. When k0 is low, kchem has little effect on the electrochemistry. However, when k0 is high enough, kchem makes significant effects onto the electrochemical reaction.

Experimental of the FEM-based simulation
All the simulations are done using Matlab. The concentrations of O and R species in the linear transfer space and time are defined by CO(x,t) and CR(x,t), and re-defined by CO(n,m) and CR(n,m) as finite elements and framed in a 2D-matrix. Here, n and m are dimensionless parameters determined by n = x/Δx, and m = t/Δt, respectively, as used in electrochemistry simulations. [11,17-18]
For calculation for the diffusion of j species, the FickŌĆÖs first and second laws are modified and combined to express a dimensionless concentration, Cj(n,m), by the dimensionless parameters as shown below,

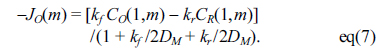
Here, DM is a dimensionless diffusion coefficient obtained from DŌłåt/Ōłåx2 and called the model diffusion coefficient.[17] For calculation for the flux at the electrified interface, the charge transfer rate and the diffusion rate are balanced to yield the following equation,
For calculation for the change by the homogeneous chemical reaction, the concentrations are obtained by the following equation,

The constant kM = kchemŌłåt is a dimensionless parameter for the chemical reaction rate. To satisfy the conditions of the semi-infinite diffusion and the explicit finite elements, DM < 0.5 and the maximum n >6(DMm)1/2/Ōłåx are set.
Conclusion
So far, I have discussed on a complex electrochemical reaction, where a heterogeneous faradaic reaction is accompanied by a homogeneous chemical reaction from viewpoints of voltammetric current and resistance using the digital simulation. The digital simulation is conducted in the finite element method discretizing the dimension, time and concentrations of chemicals. The concentrations are used to theoretically calculate polarization resistances and their flux to obtain voltammograms which can be measured by experiments. By changing the rates of heterogeneous and homogeneous reactions respectively, it is learned how the resistance is reflected on the measurable voltammogram. With decreasing k0, the resistance increases to lead an irreversible faradaic reaction regardless of the chemical reaction. On the other hand, with increasing kchem, the resistance increases with lowering overpotential. From this sense, a paradox that current is increased with increased resistance is explained. Also, the co-play of k0 and kchem studied to predict how the voltammogram appears.
From this report, I present a vision of FEM-based digital simulation study on impedance, more specifically resistance. Even though there are many electro-chemical measurement techniques such as voltammetry and electrochemical impedance spectroscopy, we still have limitations in understanding the observations especially when the reactions are very complex. As shown in this report, such understandings can be facilitated by computer simulations. [19] While theoretical resistance data are mostly simulated based on the equivalent circuit models, ours are done using the finite elements at the molecular levels. Consequently, it is not necessary to find an appropriate equivalent circuit or mathematical equations of potential and current. For the time being, it is only shown that resistance simulation is possible at the molecular level. In the forth-coming reports, it will be reported how an equivalent circuit is modelled from our FEM-based resistance simulation results.


