1. Introduction
All living things in the ecosystem requires water. Water pollution is a major environmental concern worldwide. The effluent from the textile industry is the most significant contributor to water pollution [1]. Due to dye and water consumption, several industries, including textile, paper, and plastic, generate large amounts of colored wastewater. The first pollutant detected in wastewater is color. As a result, a small amount of dye in water is highly visible. Dyes are hazardous and can result in serious health problems, including cancer. Previous research has shown that some dyes cause bladder cancer in humans and chromosomal disorders in living organisms [2]. Dyes are classified into acid, basic, direct, vat, azoic color, sulphur, reactive, and metal complex dyes. The efficiency of various dye removal techniques is ascertained by the chromophore and auxo chromes of the dye. The removal of dyes from the effluent is a major problem due to dyesŌĆÖ high tinctorial value and complex structure, toxicity, and the presence of metals in some dye structures [3]. Reactive dyes are widely used in the textile industry due to their reactive groupsŌĆÖ ability to form covalent bonds with textile fibers [4].
Electrochemical wastewater treatment methods have several advantages, including ease of operation, high speed in removing contaminants, no need for large amounts of chemicals, and low sludge production. Furthermore, because the coagulants are produced by the electrooxidation of a sacrificial soluble anode, the addition of chemicals is either unnecessary or minimized [5]. Electrochemical treatment techniques, on the other hand, are superior to chemical coagulation for treating textile wastewater. Coagulants are used in chemical coagulation to remove pollutants, resulting in more sludge formation. When metal hydroxides are used as a coagulant in the electrocoagulation process, the amount of sludge generated is minimal because the adsorption of hydroxide on mineral surfaces is 100 times greater in-situ rather than on pre-precipitated hydroxides [6]. Coagulant species form during this treatment as a result of the dissolution of a sacrificial anode in an electrochemical cell. These coagulants interact with pollutants in the solution, resulting in solubility reduction or entrapment in growing flocs of precipitates, eventually promoting pollution removal via sedimentation and flotation/filtration stages [7].
Because the traditional optimization technique of changing one variable at a time to study the effects of variables on the response is time-consuming and expensive, and it does not represent the effect of interactions between different factors for multivariable systems, it is no longer used. The response surface methodology (RSM), a statistical experimental design, is used for modeling and analysis of problems in which several variables affect the response of interest, to optimize this response using the fewest number of experiments possible [8]. This methodology employs mathematical and statistical techniques: (i) develop a second-order polynomial model, (ii) comprehend the effects of various variables (factors) and their interactions on response, (iii) determine the comparative significance of several effective factors, and (iv) optimize the process [9].
Abu Ghalwa et al. successfully performed electrocoagulation with a synthetically prepared reactive red 24 dye solution. The chemical oxygen demand and color treatment were investigated using two different electrodes, aluminum and iron. Under the optimum conditions of an initial concentration of 100 mg/L, inter-electrode distance of 0.8 cm, sodium chloride concentration of 2.5 g/L, and temperature of 20┬░C, iron electrodes removed 99.6% of color and 91.5% of COD and aluminum electrodes removed 97.9% of color and 83.8% of COD [4]. The electrocoagulation treatment method was used by Daneshvar et al. to treat textile wastewater. The color and chemical oxygen demand were successfully removed by more than 98% and 84%, respectively, with synthetically prepared Orange II dye at a concentration of 50 ppm. The maximum removal efficiency for the Orange II dye was obtained at the optimum current density of 34.62 A/m2 using Iron electrodes [10].
In this research, an electrocoagulation technique with aluminum electrodes was hired to treat synthetic Reactive black dye solution. The main objective of this research is to optimize the dye removal efficiency by process influencing independent variables such as pH, electrolysis time (ET), and current density (CD) using Box-Behnken design (BBD) optimization and Genetic Algorithm (GA) modelling. The calibration curve was used to determine the concentration of the treated solution by measuring the absorbance of the solution at 591 nm. The Characteristics of Reactive Black dye was shown in Table 1.
2. Expermental
2.1 Synthetic dye wastewater
The Reactive black dye is frequently used in textile industries have been purchased from Indian dyes, Tiruppur. The basic properties of Reactive black dye are shown in Table 1. The stock solution was prepared by adding 1 g/L of synthetic dye with double distilled water (DDW). During the experiment, the solution was diluted to the required concentration of 100 mg/L.
2.2 Experimental procedure
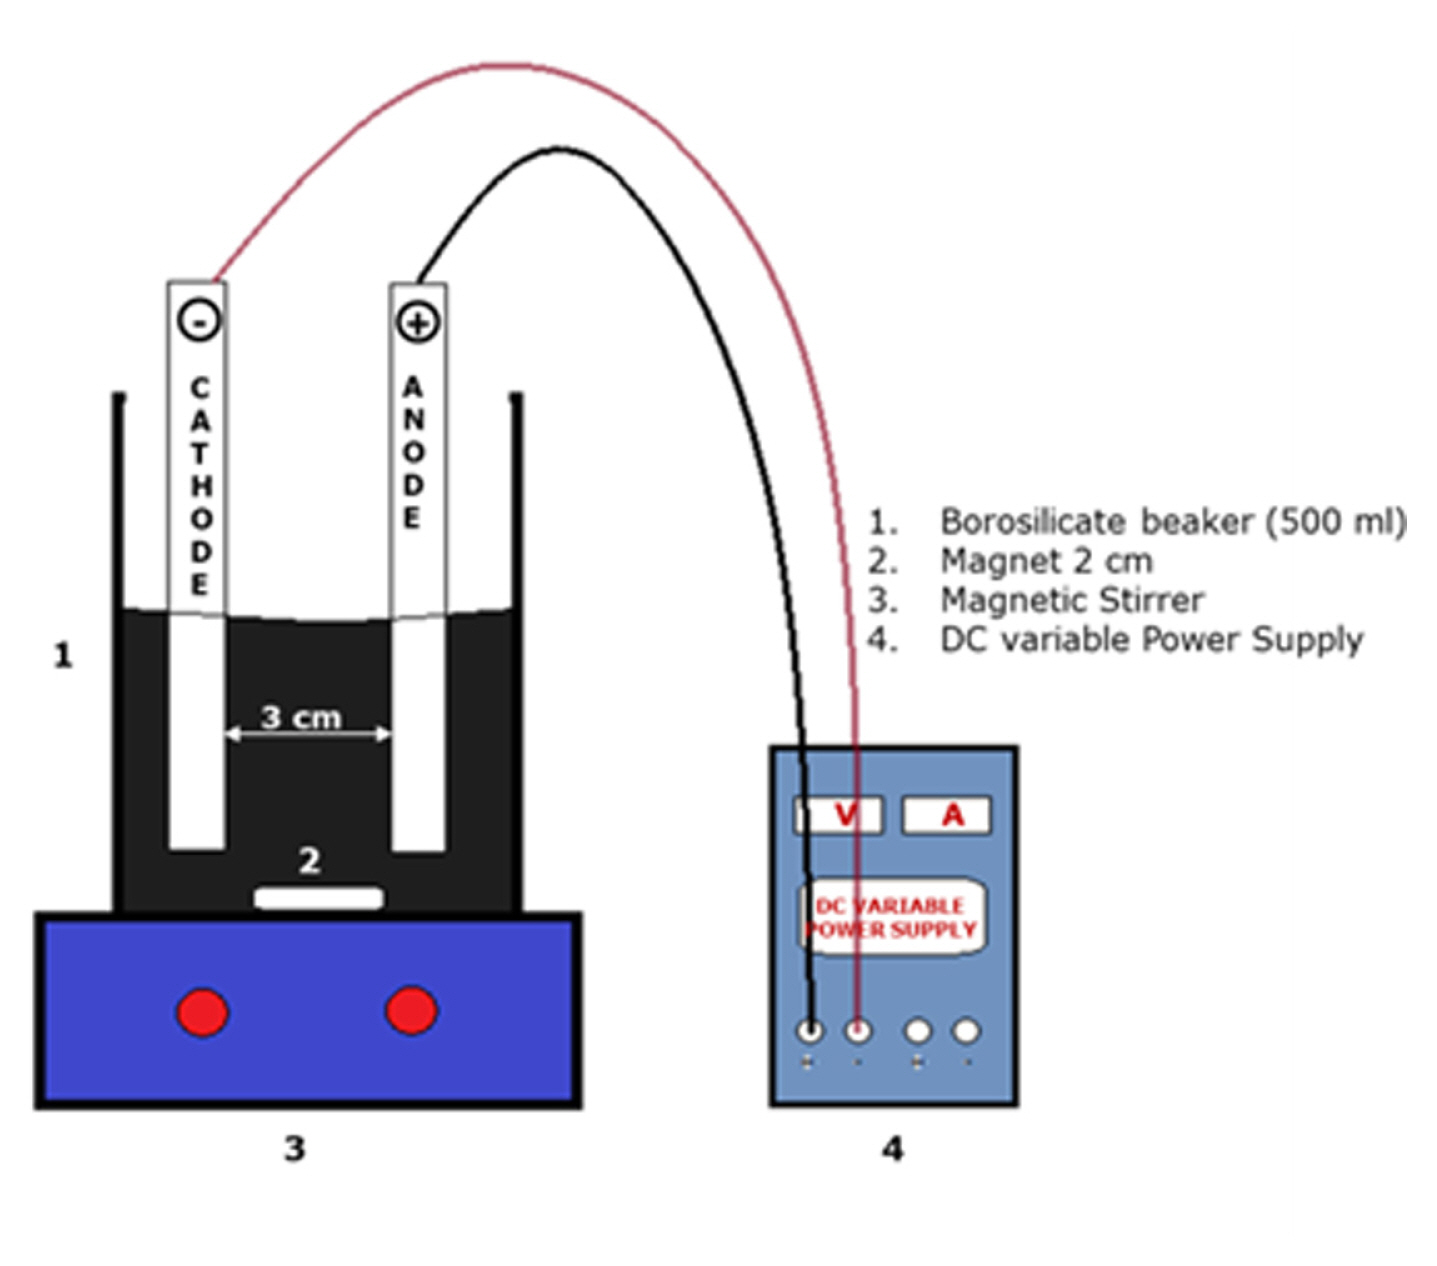
The experimental setup was carried out under batch mode potentiometric operations with synthetically prepared anionic dye solution. The electrochemical reactor consists of a 0.5-l cylindrical glass beaker with aluminum metal as anode and cathode material. The distance between the two electrodes was maintained at 1.5 cm. In each experiment, 250 ml of synthetic dye solution was treated and it was taken for analysis after 60 minutes of retention time. The geometrical active surface area for the electrode materials was maintained as 22.5 cm2. The vortex flow was induced by a magnetic stirrer in the solution at 300 rpm. The current to the electrodes was supplied from DC variable power supply instrument (0ŌĆō30 V, 0ŌĆō5 A). The pH of the dye solution was adjusted by dropping the desired amount of sodium hydroxide (NaOH) 0.1 N and hydrochloric acid (HCL) 0.1 M into the sample. The impurities in the electrodes were cleaned by dipping 100 mL of 0.1 M HCL solution and also the surface area of the electrode was washed with distilled water at every trial. The concentration of the dye solution was determined by measuring the absorbance by using a double beam UV visible spectrophotometer. The mathematical expression used to calculate the dye removal efficiency was given in Eq. 1.
Where, Co and Ci represent the final and initial concentration of the solution. To find out the peak wavelength for the reactive black dye, the survey scan was carried out wavelength between 250 nm to 900 nm. The maximum peak wavelength was found to be 609 nm. The reactor setup is shown in Fig. 1.
2.3 Experiment design by RSM
The Response surface methodology has various optimization methods like Central Composite Design (CCD) and Box-Behnken design (BBD). In this research, the BBD was used to optimize the process influencing variables such as pH, Current Density and Electrolysis Time. A three-level and three-factor experimental design of the BBD method was used to find out the optimum dye removal efficiency considering maximum dye removal. The Box-Behnken design is suitable for sequential experiments to obtain relevant information for testing the lack of fit without requiring a large number of design points [11]. Three independent variables were coded as ŌłÆ1, 0 and 1, where, +1 denotes the maximum level of each factor and 0, ŌłÆ1 denotes the medium and minimum level of each factor. The levels of variables tested in Box-Behnken Design (BBD) were given in Table 2. The total number of experiments defined by the Design Expert software was seventeen. The mathematical expression to calculate the number of experiments required for optimization was given in Eq. 2.
Where C0 is the number of center points and k is the number of variables [12]. Based on the given data, the software tool was automatically calculating the various regression models like liner, interaction, square and cubic regressions. Non-linear regressions have been used to solve the majority of engineering problems. The dye removal efficiency was predicted by following second-order polynomial regression. This was given in Eq. 3.
Where Y is the predicted response (Dye removal efficiency), Xi and Xj are the independent factors, ╬▓i, ╬▓j, and ╬▓ij are coefficients for linear, quadratic and interaction effects [13].
2.4 Genetic Algorithm
The Genetic Algorithm (GA) is part of a family of optimization techniques inspired by living nature. From the standpoint of optimization, it represents random search techniques with improved capability of searching for and capturing a global optimum and it has been successfully applied to a wide range of problems [14]. GA applies mutation, crossover, and selection operators to a population of encoded variable space. The algorithm investigates various areas of the parameter space and directs the search to the region with a high probability of a global optimum [15]. More details about GA were deeply discussed elsewhere [16]. To run the GA, the fitness function is mandatory. The second-order polynomial regression model was given as the objective function for maximizing dye removal efficiency. This regression equation includes three independent variables: pH, CD, and ET. The objective function was created separate script file in MATLAB, then the script file was included in the GA optimum tool during optimization. The lower and upper bounds of each variable were the main components required to provide the GA tool. The lower and upper limits for pH, ET, CD were set at 5 to 9, 5 to 25 minutes and 22.22 to 66.66 mA/cm2.
3. Results and Discussion
3.1 RSM optimization
The main objective of this study was to optimize and model the process influencing independent variables considering maximum dye removal efficiency by using BBD and Genetic algorithm modeling. The process influencing independent variables were: pH, CD and ET, and also the dependent variable was Dye removal efficiency. The pre-framed design matrix was developed by using the BBD design tool in Design Expert software before experimenting. The details of the predefined design matrix along with experimental and predicted results were given in Table 3.
The overall experimental performance and quality of the model fit are represented by the coefficient of determination (R2). The coefficient of determination calculated between experimental and predicted results was 0.9872. This term denotes that the 98.72% prediction results matched the experimental results. The higher difference values represent the insignificant of the response model. R2 is the proportion of variation in the response attributed to the model rather than to random error and an R2 value above 80% suggests a good fit for a model [17]. The difference between adjusted R2 and R2 was found to be 1.22%. In between these two values, no more deviations above 2% were not found. Hence, In terms of the coefficient of determination, the model was deliberated as significant. Analysis of variance (ANOVA) is used for graphical analysis of data to obtain interaction between process independent and dependent parameters. The ANOVA test for the quadratic models was shown in Table 4.
From the ANOVA results, the calculated F-value from the regression model is 60.14, which is greater than the theoretically calculated value of 4.95 at 99% of the confidence level. The p-value observed from the model was less than 0.0001. However, a p-value less than 0.05 were considered the significant model in most statistical analysis. The beta coefficient for linear, interaction and square terms was separately computed and corresponding details were given in Table 5. For considering linear terms like pH, ET and CD, the ET has a higher beta co-efficient over other terms. This indicates that the ET was one of the most influential parameters in removing the dye from the aqueous solution. The estimated beta coefficient for pH, ET and CD was 1.40, 12.80 and 11.08 from RSM modelling. A higher coefficient indicates a greater contribution of the factor. Hence, the order of rank was expressed as ET > CD > pH. The second-order polynomial regression model analyzed from this model was given in Eq. 4.
(4)
Where, Y is the Dye removal efficiency in percentage, X1, X2, and X3 are the coded variables like pH, ET and CD.
3.1.1 Influence of pH and ET
The dye removal efficiency was increased with increasing pH and ET up to pH 7, afterwards, the removal efficiency reduction was found. This denotes, the removal efficiency reduction occurred when the sample pH was more acidic and under basic conditions. The Dye removal efficiency at different pH and ET are shown in Fig. 2. The stats observed by Tezcan Un et al. denotes, the minimum solubility of metallic specious was observed at pH 6ŌĆō7. If pH was less than 4, Al(H2O)63+ was predominant due to hydrolysis of Al3+ ions in an aqueous solution. Moreover, with pH between 5 to 6, the Al(OH)2+ and Al(OH)2+ were predominant; at pH > 9, the Al(OH)4ŌłÆ was predominant [18]. The Al(OH)3 has a large surface area which was helpful to trap the colloidal particles and adsorb the soluble compounds, resulting in the maximum removal efficiency achieved [19]. Similar reasons also reported in Khandegar et al., like, as the pH of the solution is lies between 4 and 9, the Al3+ and OHŌłÆ ions generated by the electrode react to form monomeric species and polymeric species that finally transform into insoluble amorphous Al(OH)3, resulting in a higher removal efficiency obtained [3]. Hence, the aforementioned literature and experimental study denote, approximately, the neutral pH has more pollutant removal capacity than more acidic and basic. The EC process was controlling the high-level pH change in wastewater after treatment because of production and consumption of hydroxyl radicals were balanced in this system [20].
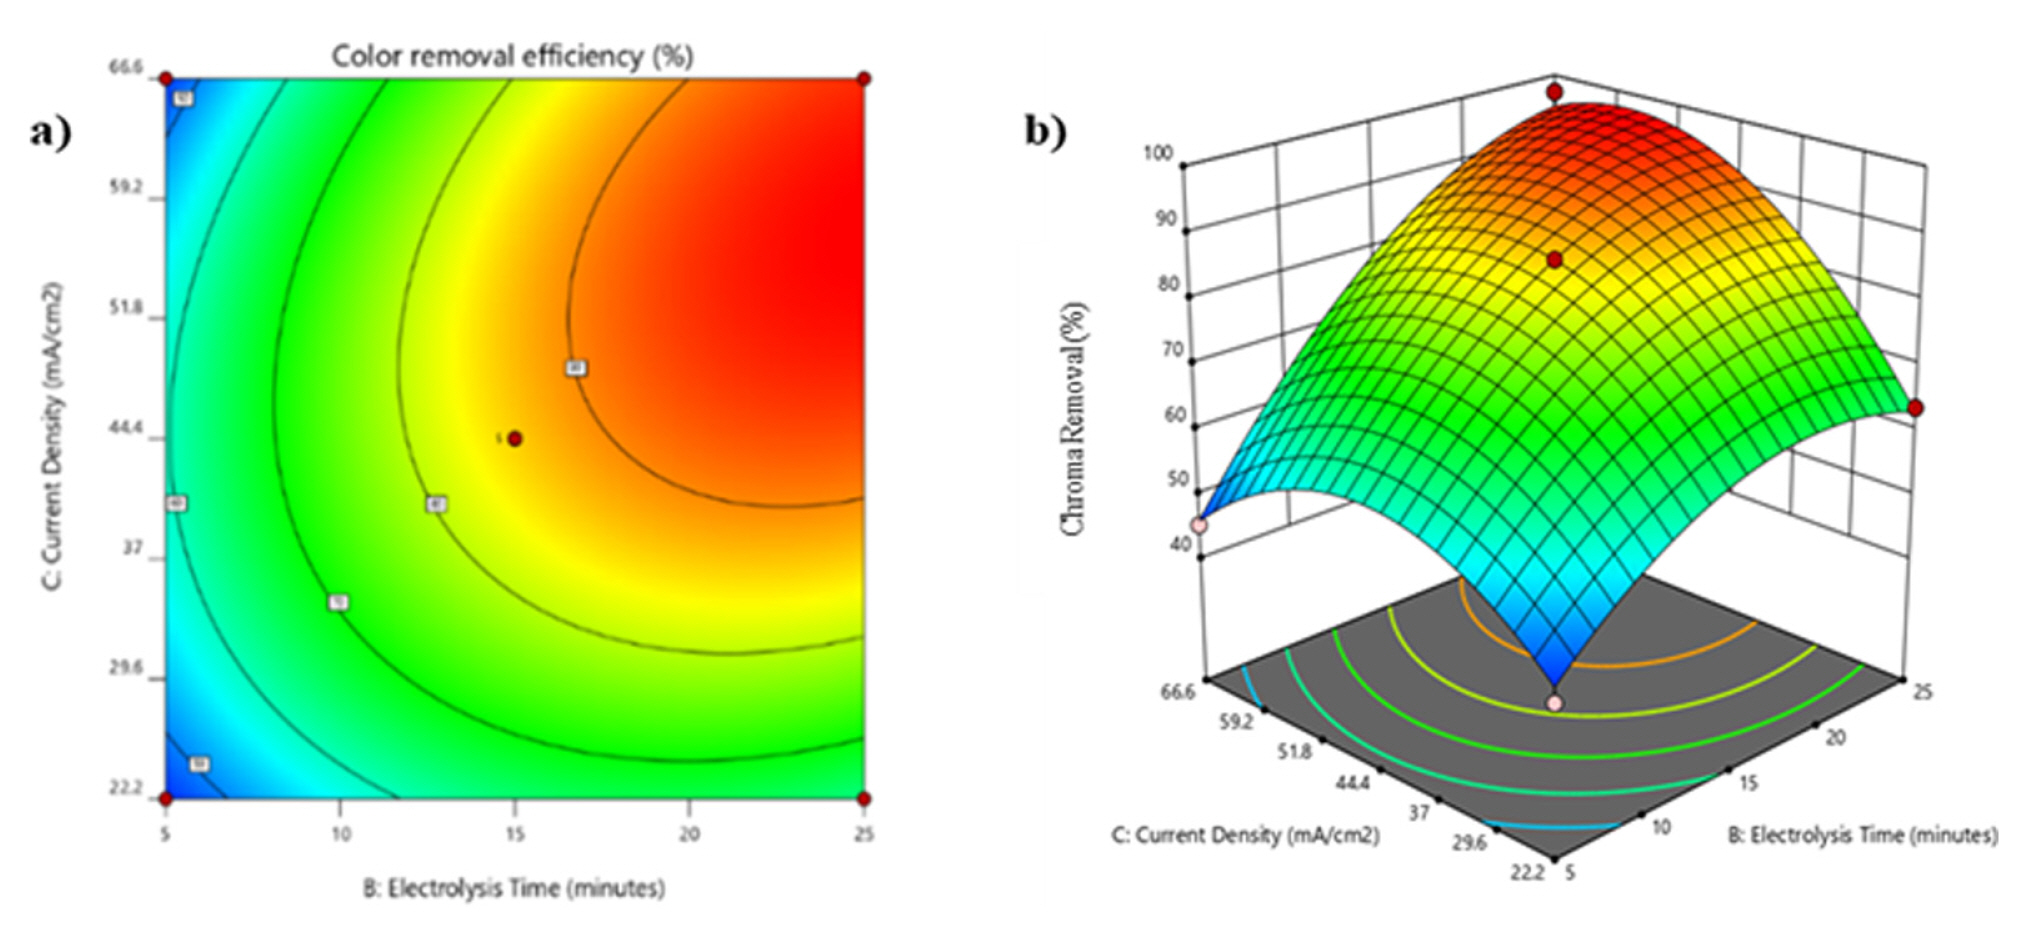
3.1.2 Effect of CD and ET
The current density was an important tool for determining the amount of metal ion generation, coagulant dosage, and bubble formation rate in the EC process. The maximum pollutant removal efficiencies were achieved at a higher current density due to the maximum generation of hydroxide flocks for supplying current through the solution [21,22]. The CD and ET were directly proportional to dye removal efficiency. The dye removal efficiency was increased with an increase a CD and ET. The graphical representations for the influence of ET and CD were shown in Fig. 3. The theoretical amount of metal ions supplied from the unit surface area was directly proportional to the CD. So, the formation of the metal ion was increased by increasing the CD. The production of higher metal hydroxides provided greater pollutant removal efficiency due to precipitation and sweep coagulation [23]. During the electrolysis operation, the anodic reactions occurred in the positive electrode and cathodic reactions occurred in the negative electrode. The released ions were neutralized by the charged particles and the pollutant removal occurs by the principle of coagulation [24]. The pollutant removal efficiency depended on the concentration of metal ions released from the electrode surface and operation time. The Faradays law describes the rate of coagulant generation was increased with increasing the electrolysis time [25].
3.1.3 Effect of pH and CD
The effect of the study between pH and CD was found to be different from the previous one. In a pH respect CD, the removal efficiency was increased with an increased pH up to 7; however, after increasing the pH value above 7, the removal efficiency was decreased. The graphical representations for the influence of pH and CD were shown in Fig. 4. The pH change in treated wastewater was controlled by the electrocoagulation process, which balanced the production and consumption of hydroxyl radicals [20]. The greater removal efficiency was achieved by providing higher CD through the solution due occurrence of anode dissolution [26]. The removal efficiency also depends on the charge supplied to the unit volume of the solution [27].
3.1.4 Optimization
The optimum conditions for getting the maximum dye removal efficiency were found by using the desirability function tool presents in the Design Expert software. The desirability function is a well-known and well-established technique for determining the settings of input variables that can provide the best performance levels for one or more responses at the same time [28]. The desirability was an objective function with a range of zero to one. The higher desirability values and their corresponding points were chosen as the optimum conditions for a numerical optimization problem. If the desirability value was one, the function was desirable. Otherwise, it was zero, indicating that the function was unsuitable. The primary goal of this optimization problem was to maximize the dye removal efficiency corresponding to independent variables. The softwareŌĆÖs numerical optimization was chosen to locate the specific point that maximizes the desirability function. The desired goal was chosen by adjusting the weight, which could change the characteristics of a goal. The response goal locations have five options: none, maximum, minimum, target, and within range. In this analysis, maximum was chosen as the goal. The optimum conditions analyzed from RSM optimization were: pH-8.4, electrolysis time-24.17 minutes and current density-59.11 mA/cm2. At this stage of prediction, the removal efficiency was 97.52%. In this operation, the maximum desirability values and their corresponding points were suggested as the optimum points. The optimum desirability ramp was shown in Fig. 5.
3.2 Genetic Algorithm Modelling
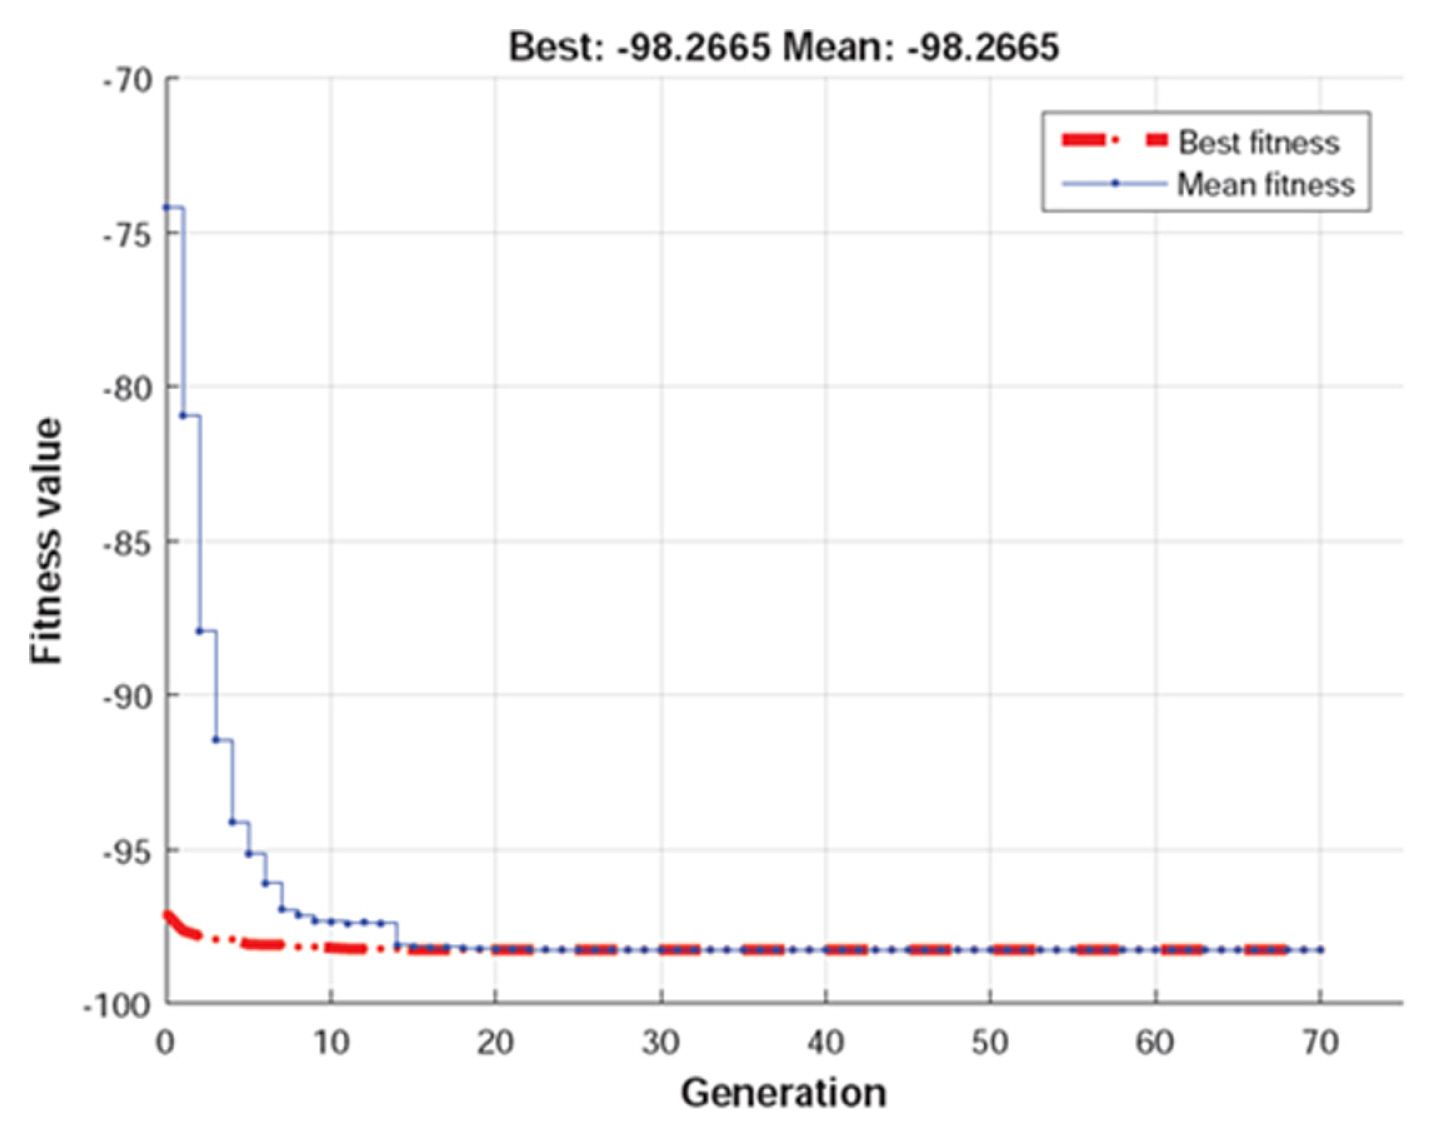
The main goal of the Genetic Algorithm modelling was to optimize the maximum dye removal efficiency considering pH, ET and CD as independent variables. The GA operation was executed by creating a second-order polynomial regression equation as the objective function. If increasing the number of iterations, the best fitness value arises was happen. Once, the generation reached above thirty, the mean and best fitness line was co-inside with each other. The best fitness and mean fitness values considering iteration was shown in Fig. 6. The best fitness value observed from the GA modelling was 98.26% under optimum conditions such as pH-7.8, CD-57.24 mA/cm2 and ET-25 minutes. The following key factors were used for GA modelling operation: Population size-100, Scattered cross function-0.1, mutation rate-0.1 and iteration-1000. The same methodology RSM over Taguchi optimization was practiced by Sunita Parinam et all for optimizing the optical parameter, High Transmission Optical Filter Design [29].
3.3 Confirmation study from RSM optimization and Genetic Algorithm Modelling
The confirmation study is carried out under optimal conditions and should compare the outcome to the predictions. To evaluate the prediction results, the experiment was carried out where the optimum operation condition was optimized from RSM optimization and GA modelling. If the results of the confirmation experiments agree with the predictions, the developed model is robust and insensitive to external noises or tolerances introduced by varying the levels of the factors [28]. The performance of the model was evaluated by computing the percentage of error between experimental and prediction results. The difference between both results was named as the percentage of error. For RSM optimization, the prediction error was three percent (3.0%) which is greater than the Genetic Algorithm modelling prediction results of 2.04%. The results from the confirmation study were denoted, and the GA modelling prediction results were superior to the RSM optimization results. The experimental and predicted results found from RSM optimization and GA modelling was given in Table 6.
4. Conclusions
In this experimental study, the electrocoagulation technique effectively removes the Reactive Black dye from an aqueous solution by using aluminum electrode pairs. The Genetic Algorithm (GA) modelling results were more efficient than RSM optimization results. The optimum operational factors under RSM optimization were: pH-8.4, electrolysis time-24.17 minutes, and current density-59.11 mA/cm2. The optimum operational factors under GA modelling were: pH-7.8, electrolysis time-25 minutes, and current density-57.24 mA/cm2. The order of process influencing variables was: ET > CD > pH. The conclusions of the results show the GA model was the perfect tool for optimizing independent variables to predicting dye removal efficiency under electrocoagulation operation. This technique will useful for the optimization of process influencing variables in various engineering applications.