1. Introduction
Lithium-ion batteries (LIBs) are widely used as energy storage devices and are employed in various applications, ranging from small electronics to electric vehicles [1ŌĆō8]. The demand for high energy densities has driven the development of high-capacity cathode materials for LIBs [9ŌĆō12]. Li2O-based cathodes utilizing oxideŌĆōperoxide conversion are gaining attention as next-generation cathode materials with the potential to offer higher energy densities than those of commercial cathodes [13ŌĆō18]. These cathodes typically consist of Li2O, which is an active material that generates capacity through redox reactions, and a catalyst matrix that promotes redox reactions. Li2O-based cathodes offer a higher capacity per weight than commercial cathodes owing to their lighter oxygen-based redox chemistry and reduced dependence on heavy transition metal ion intercalation. However, the strong interfacial reactions between Li2O-based cathodes and electrolytes negatively impact usable capacity and cyclic performance, hindering their commercialization [19ŌĆō21]. During charging, oxygen ions in Li2O undergo redox reactions and release electrons, transforming into highly reactive superoxides (OxŌłÆ, 1 Ōēż x < 2). These superoxides readily react with electrolytes (salts or solvents), creating an unfavorable interfacial layer that impedes the flow of Li and electrons. Furthermore, some superoxides are depleted through interfacial reactions and do not revert to Li2O during discharging, leading to the loss of active material (Li2O) and reduced usable capacity of Li2O-based cathodes.
To mitigate the adverse interfacial reactions in LIB systems, the surface coating treatment of the cathode is a common approach [22ŌĆō25]. Surface coating limits the direct contact between the cathode and electrolyte using stable materials, such as oxides and phosphates, reducing interfacial reactions. However, surface coating is rarely applied to Li2O-based cathodes as the reactive Li2O cannot withstand the heat treatment process required for surface coating. The use of electrolyte additives is a promising alternative solution to mitigate interfacial reactions as they form a protective layer on the cathode layer through decomposition during cycling [26ŌĆō28]. Vinylene carbonate (VC) is a representative additive for mitigating interfacial reactions at the Li2O-based cathodeŌĆōelectrolyte interface [28]. VC forms a protective layer on the surface of anodes (carbons) and suppresses interfacial reactions associated with Li2O-based cathodes [29,30]. Research on more effective additives than VC for Li2O-based cathodes is currently an active area of investigation.
This study introduces succinonitrile (SN) as a new additive with the aim of stabilizing the Li2O-based cathodeŌĆōelectrolyte interface. SN forms a stable protective layer with a nitrile functional group (ŌłÆCN) on the surface of cathodes [31ŌĆō34]. However, prior research has focused on conventional cathodes relying on the redox reaction of transition metal ions. We evaluated the potential of SN as an additive for Li2O-based cathodes that rely on oxygen-based redox reactions and as an alternative to VC. The Li2O-based cathode used in this study consisted of Li2O and Ni-embedded reduced graphene oxide (Ni-rGO), serving as a catalytic framework. The prepared Li2O/Ni-rGO composite is referred as LNGO for convenience. Our LNGO cathode comprised inexpensive Ni as a catalyst supported by the electrically conductive graphene matrix and achieved considerable performance, contrasting the results of previous studies relying on costly catalysts [15,17]. This study demonstrated the potential for improved performance through the use of additives. The effect of the SN additive was confirmed through X-ray photoelectron spectroscopy (XPS) and transmission electron microscopy (TEM) analyses. Furthermore, the as-obtained results were compared to those obtained using the VC additive.
2. Experimental
The synthesis of the Ni-embedded reduced graphene oxide used as a catalytic framework for LNGO cathodes was performed by first stirring 7 mL of graphene oxide (GO) solution (1 wt.% in water, Standard Graphene) in 70 mL of water. After 10 min, Ni(NO3)2┬Ę6H2O (99.99%, Aldrich) and hexamethy-lenetetramine (HMT, 99.0%, Aldrich) were dissolved in the dispersed GO solution. The weight ratio of Ni to GO was 0.4:1, and the molar ratio of HMT to Ni was maintained at 2:1. The solutions were stirred for 2 h and then sealed in a 100 mL Teflon-lined stainless steel autoclave for a 7 h hydrothermal treatment at 140┬░C to produce a Ni(OH)2-graphene oxide composite. The Ni(OH)2-graphene oxide powder was filtered through a 0.45 ╬╝m polyamide membrane filter and washed with distilled water to remove any residual Ni salt and HMT. The Ni(OH)2-graphene oxide composite powder was then reduced through heating with a continuous flow of 10% H2 gas (balance Ar) to 450┬░C for 3 h, resulting in Ni nanoparticle-embedded reduced graphene oxide (Ni-rGO). Ni-rGO was tested using thermogravimetry (TG) from room temperature to 800┬░C to determine the content of metallic Ni. For preparing LNGO, Ni-rGO was mixed with lithia (Li2O, 97%, Aldrich) powder to achieve a Ni content [fRu = Ni/(Ni+Li)] of 0.09 mol.% through manual mixing. The resulting powder was pulverized and uniformly mixed using a planetary ball mill (Pulverisette 6, Fritch) at 150 rpm for 50 h to obtain Li2O/Ni-rGO composites (LNGO). To avoid powder overheating, milling was performed in 15 min intervals with a 10 min rest and was repeated 200 times. The obtained Ni-rGO and LNGO powders were observed by TEM, and X-ray diffraction (XRD) analyses.
For electrochemical testing, an LNGO cathode slurry was prepared by mixing the active cathode, carbon nanotubes (CNTs, Hanwha Chemical), and polyacrylonitrile (PAN, Aldrich) binder in a 60:30:10 weight ratio, using N-methyl-2-pyrrolidone (NMP, anhydrous, Aldrich) as the solvent. An aluminum foil was used as the current collector, and the cast slurry was dried under vacuum at 80┬░C for 24 h. The electrode loading level and electrode density were 0.1ŌĆō0.2 mg┬ĘcmŌłÆ2 and ~0.4 mg┬ĘcmŌłÆ3, respectively. During testing, 2032 coin-type cells were used, consisting of an LNGO cathode, a Li metal anode (400 ╬╝m), and a polypropylene (Celgard 2400) separator (25 ╬╝m). The ŌĆ£pristine electrolyteŌĆØ used in the tests was a mixture of ethylene carbonate (EC) and dimethyl carbonate (DMC) in a 1:1 volumetric ratio (Enchem Co., Ltd.) with 1 M lithium bis(trifluoromethanesulfonyl) imide (LiTFSI) as the Li salt. Electrolyte additives of 1 and 3 wt.% VC (Chunbo Co., Ltd.) or 1 and 3 wt.% SN (99.0%, Aldrich) were added to the pristine electrolyte. The electrolytes containing VC and SN additives were separately stirred until homogeneous solutions were obtained, and these electrolytes are hereafter referred as the VC electrolyte and the SN electrolyte, respectively. The amount of electrolyte used for each cell was ~40 ╬╝L. The cells were cycled with a current density of 100 mA┬ĘgŌłÆ1 in a cutoff voltage range of 1.5ŌĆō4.35 V at 30┬░C using a WonATech voltammetry system. The cycling capacity was limited to 300 mAh┬ĘgŌłÆ1, and the next step was conducted when this limit was reached, regardless of whether the voltage reached its limits (1.5 or 4.35 V). The impedance of the cells was measured using an electrochemical workstation (Ametek, VersaSTAT 3) by applying an alternating current voltage with an amplitude of 5 mV over a frequency range of 0.1 Hz to 100 kHz.
To evaluate the efficacy of the electrolyte additives, TEM and XPS were employed to characterize the LNGO cathodes. After the 1st and 100th cycles, the samples were cleaned with DMC to minimize the impact of residual Li salt on the cathode surface. The cathode surface layer was analyzed using TEM (JEOL JEM-2100F, Cs corrector) and XPS (NEXSA, Thermo Scientific K-Alpha+) to verify interfacial reactions between the cathode and electrolyte. The samples were then transferred to a glass vacuum desiccator to prevent air exposure. The XPS spectra were fitted using the XPS-peak software (Avantage Data System). The binding energy scale was calibrated using the CŌĆōC peak (284.5 eV) of the C 1s spectrum.
3. Results and Discussion
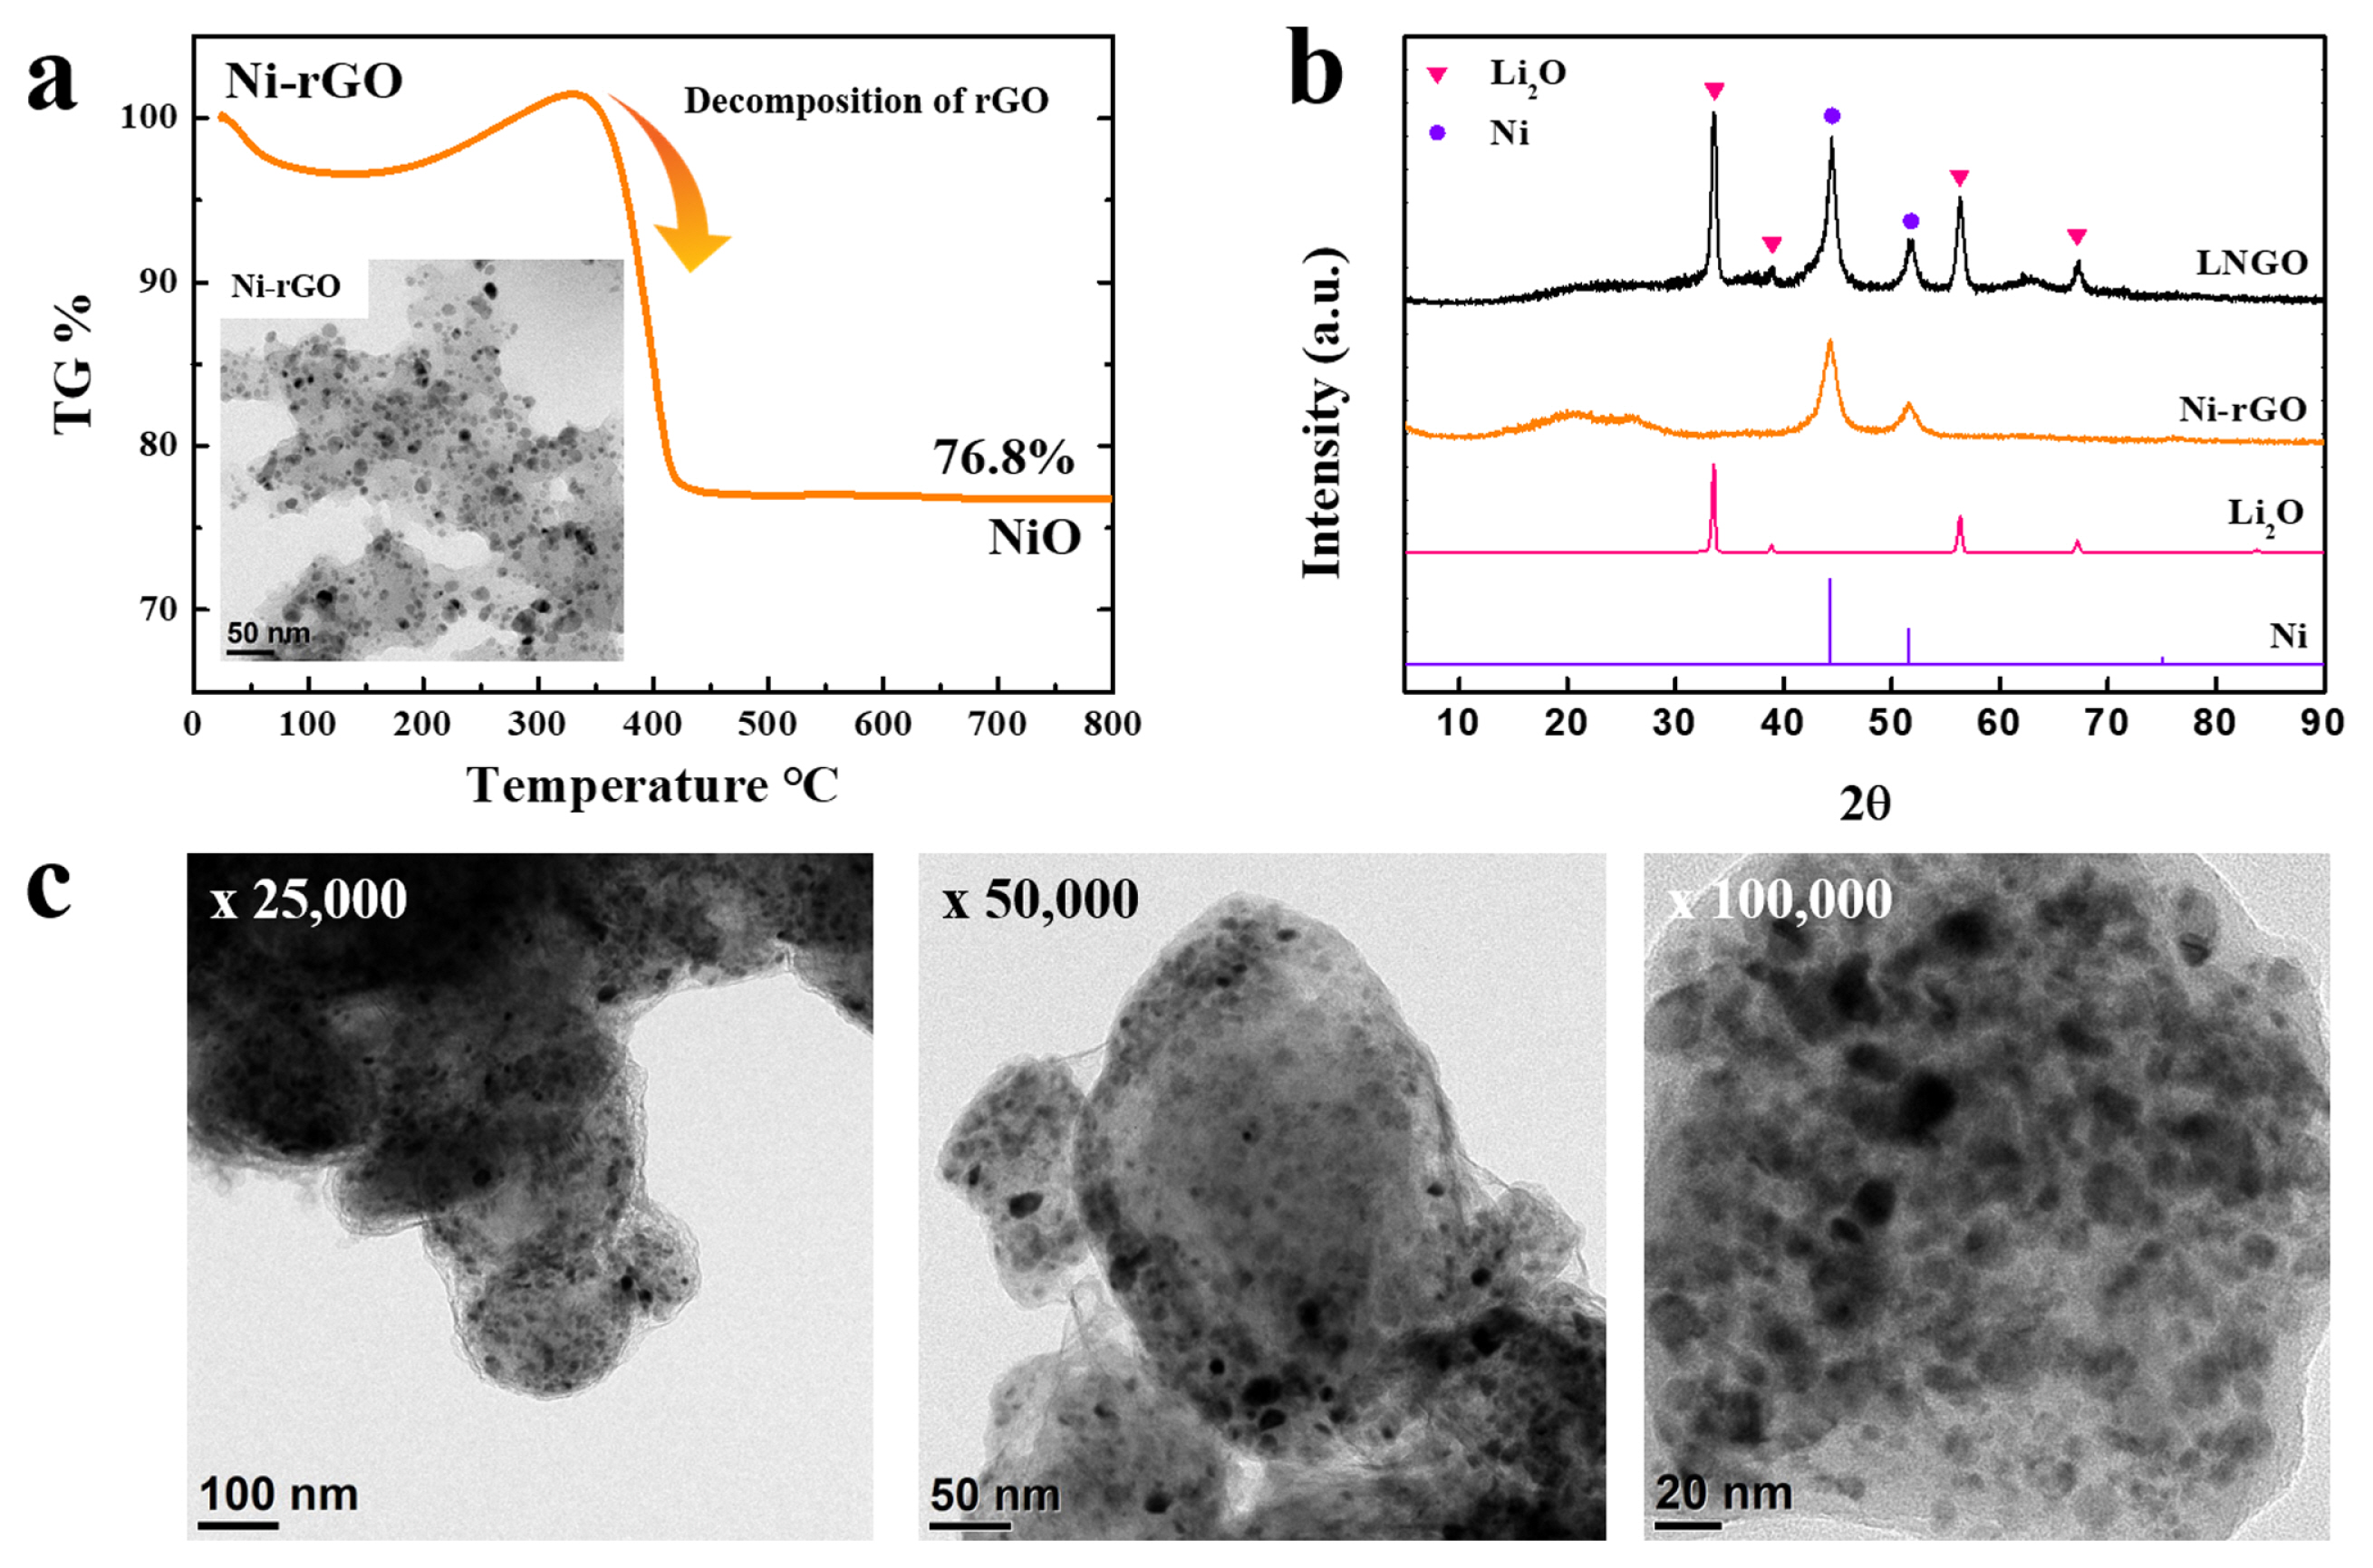
The morphology and structure of Ni-rGO, which was the precursor material for LNGO, were investigated using TG, TEM, and XRD analyses. Fig. 1a shows the results of the TG analysis of Ni-rGO heated to 800┬░C. The residual weight was approximately 76.8% of the initial weight, with most of the weight loss occurring between 350 and 400┬░C, probably owing to the decomposition of rGO. The remaining material was expected to be NiO, formed by the oxidation of Ni in Ni-rGO. Based on the Ni/NiO weight ratio (0.786), an estimate of 60% Ni was calculated in the Ni-rGO, implying that it consisted of approximately 40% rGO and 60% Ni. The TEM image of Ni-rGO in the inset of Fig. 1a shows several nanometer-sized Ni particles homogeneously distributed on the surface of GO. These nano-sized Ni particles are expected to serve as efficient catalysts for activating the redox reactivity of Li2O. Additionally, the high conductivity of rGO may compensate for the insufficient conductivity of Li2O-based cathodes.
Fig. 1b shows the XRD patterns of Ni (metal), Li2O, Ni-rGO, and LNGO. The presence of Ni peaks in the XRD pattern of Ni-rGO confirms the use of metallic Ni with higher activity than Ni-oxides as the catalyst. The XRD pattern of LNGO exhibited Ni and Li2O peaks without any distinctive heterogeneous peaks, indicating that LNGO was formed as a mixture of Li2O (active material) and Ni particles (catalyst), as intended. The TEM images of LNGO (Fig. 1c) show an even distribution of Ni nanoparticles throughout the sample. Despite the challenge of distinguishing between rGO and Li2O, the uniform distribution of Ni nanoparticles confirms the successful formation of the composite from Li2O and Ni-rGO.
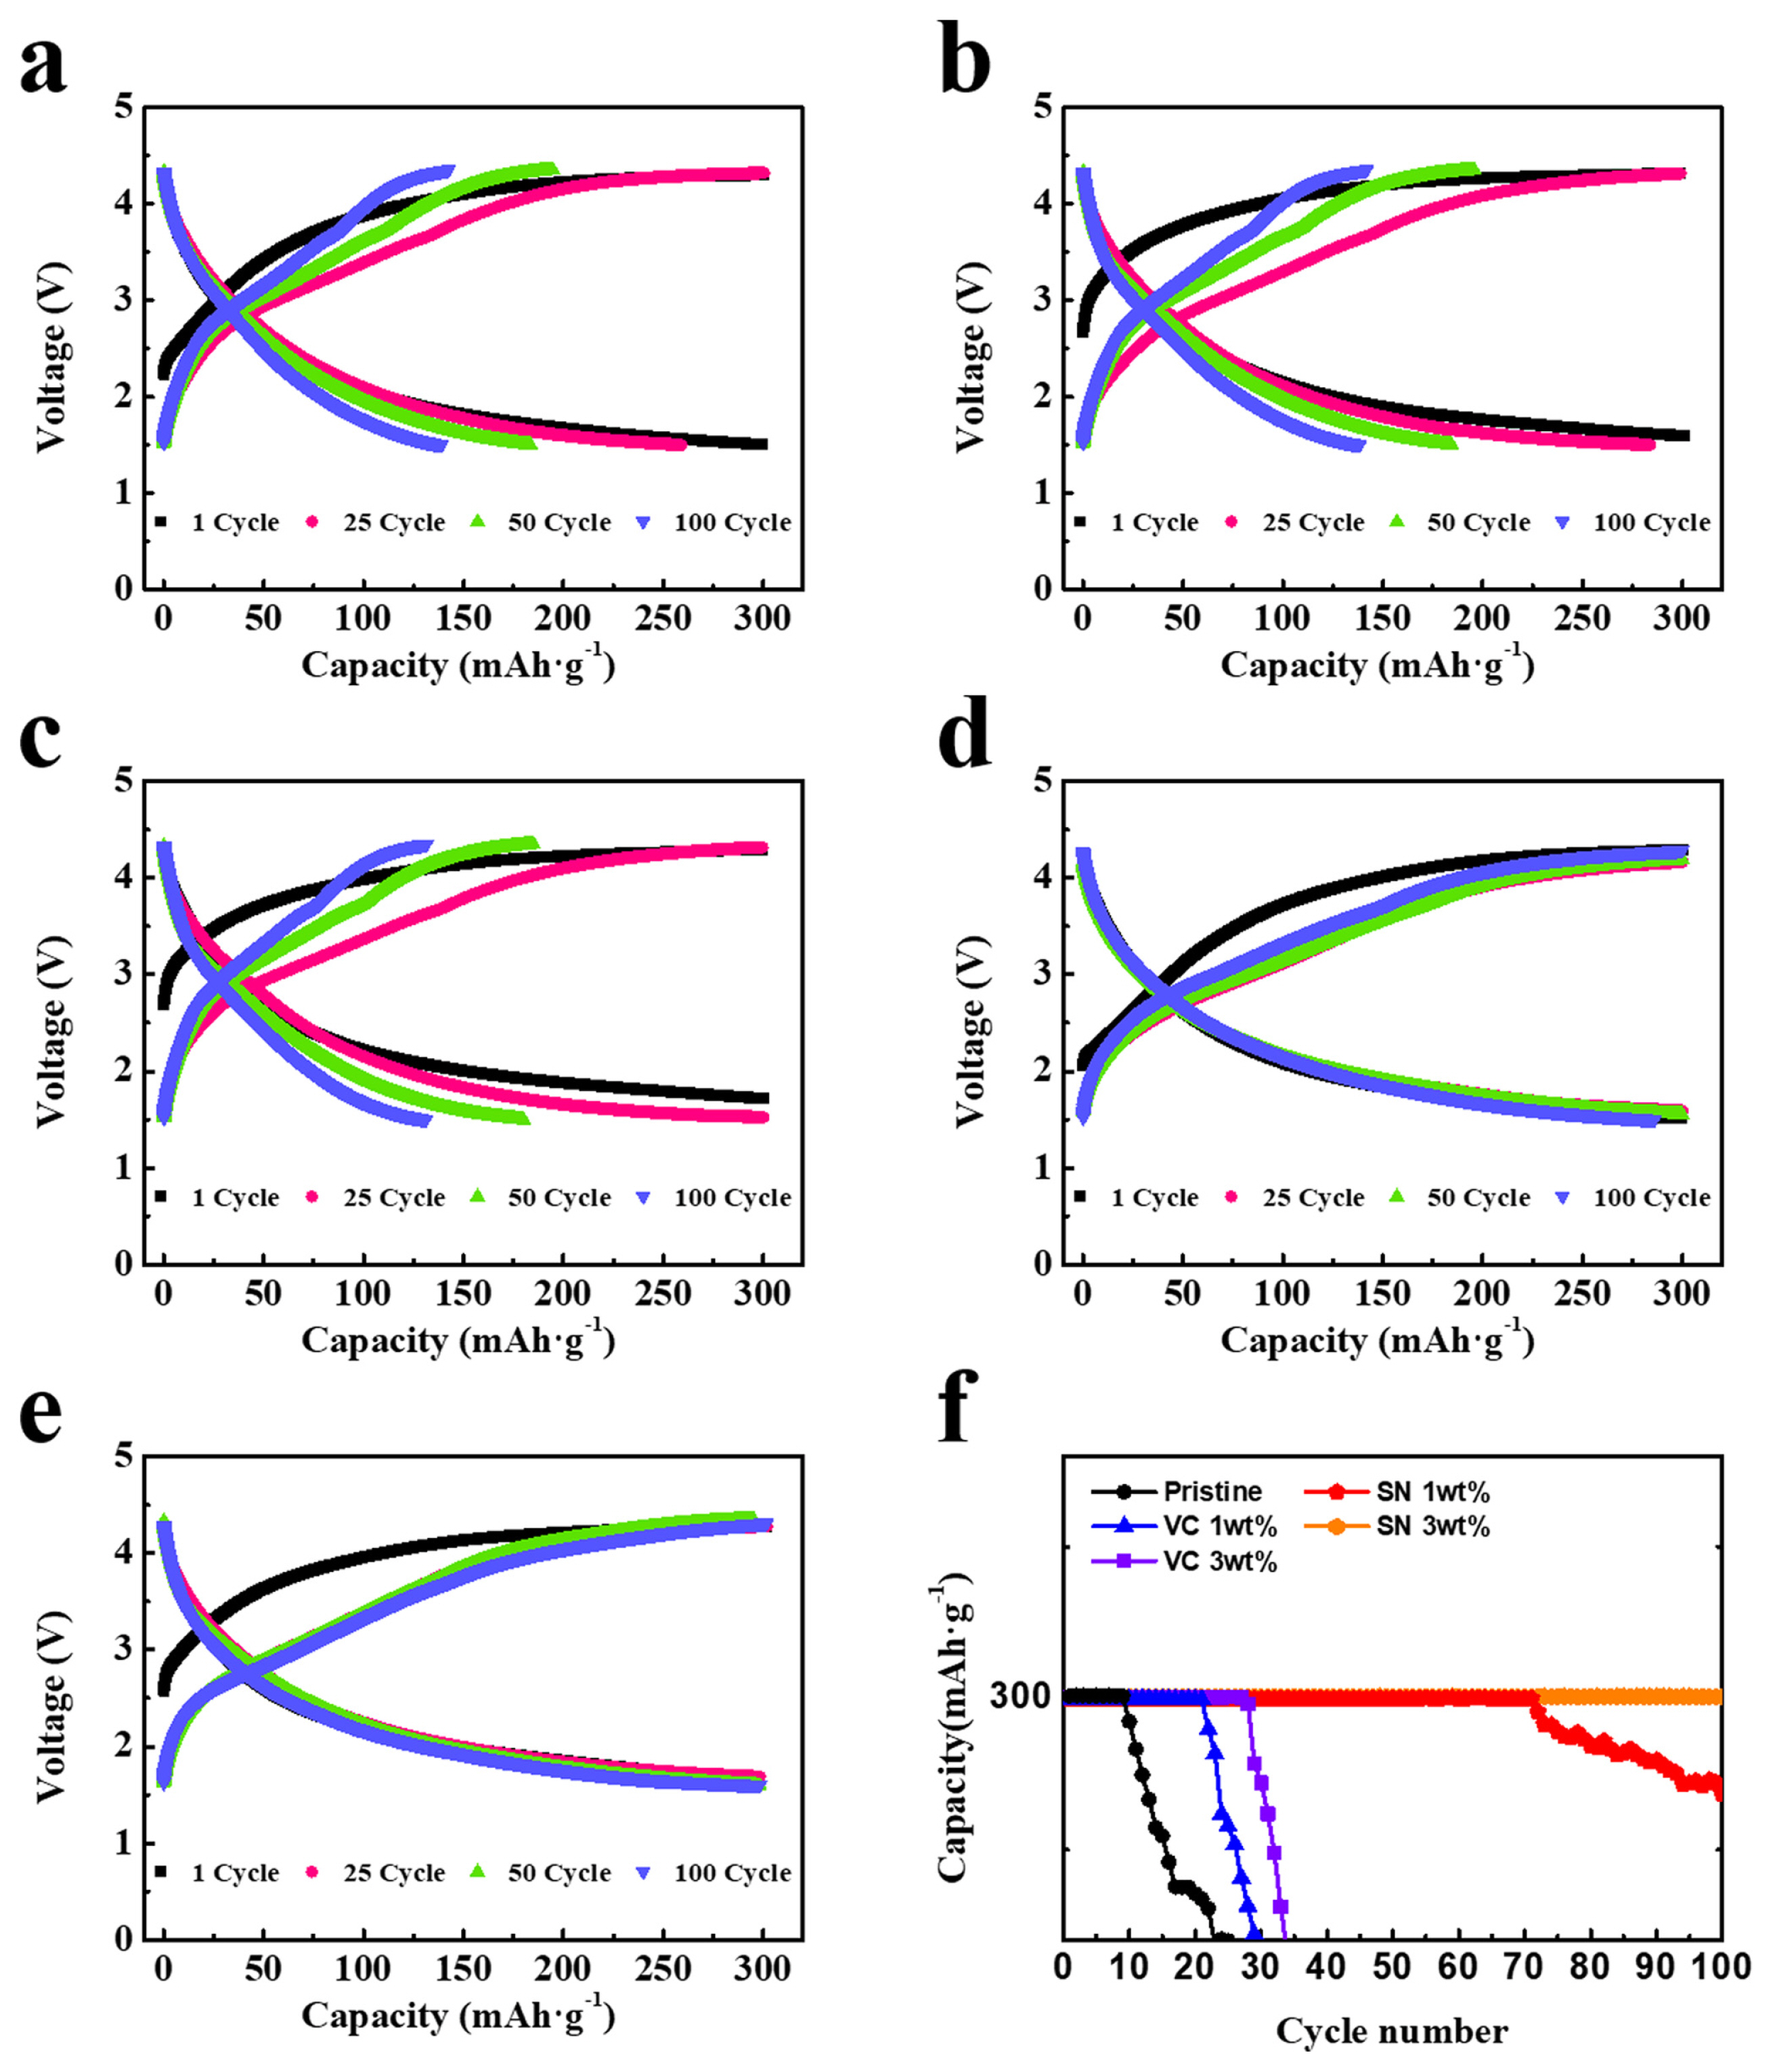
The discharge capacity and cyclic performance of cells containing LNGO were evaluated using pristine, VC, and SN electrolytes. The capacity of the cathodes was calculated based on the total weight, including both the Ni-rGO catalyst and the Li2O active materials, although Ni-rGO did not contribute to the capacity during charging and discharging. The theoretical capacity of pure Li2O is 897 mAh┬ĘgŌłÆ1, whereas that of LNGO, considering the weight of Ni-rGO as a catalyst, is approximately 540 mAh┬ĘgŌłÆ1. The charging/discharging capacity of LNGO cathodes was limited to a specified value during measurements to prevent the formation of superoxo species (such as O2 1ŌłÆ in LiO2) and the evolution of gaseous O2 owing to overcharging [13ŌĆō21]. In particular, the capacity of LNGO was limited to 300 mA┬Ęh┬ĘgŌłÆ1 at a current density of 100 mA┬ĘgŌłÆ1. Fig. 2aŌĆō2e present the voltage profiles of the cells during the 1st, 25th, 50th, and 100th cycles with pristine, VC (1 and 3 wt.%), and SN (1 and 3 wt.%) electrolytes. As shown in Fig. 2a, the cell with the pristine electrolyte exhibits a specified capacity of 300 mAh┬ĘgŌłÆ1 in the 1st cycle, which rapidly decreases in the 25th, 50th, and 100th cycles. This indicates that 300 mAh┬ĘgŌłÆ1 is not a usable capacity of LNGO when using the pristine electrolyte. The addition of 1 wt.% VC maintained the specified capacity in the 1st and 25th cycles. However, the capacity decreased in the 50th and 100th cycles (Fig. 2b). Increasing the amount of the VC additive to 3 wt.% resulted in a similar capacity fading over the cycles (Fig. 2c). In contrast, the addition of SN significantly reduced the capacity fading. As shown in Fig. 2d and 2e, after the addition of SN, the 50th chargeŌĆōdischarge profile is nearly identical to the 25th profile, without capacity loss. Although a slight capacity decrease was observed at the 100th cycle with the addition of 1 wt.% SN, a stable charge/discharge profile was maintained until the 100th cycle with the addition of 3 wt.% SN. Fig. 2f compares the cyclic performance of the cells over 100 cycles at a current density of 100 mA┬ĘgŌłÆ1. The cell using the pristine electrolyte showed a capacity decrease after the 10th cycle, whereas the cell using a 3 wt.% SN electrolyte maintained its specified capacity until the 100th cycle. The cyclic performance improvement was larger with the addition of SN than that obtained with VC.
The usable capacity of the LNGO cathode is determined by the number of O2ŌłÆ ions in the Li2O that can undergo a reversible redox reaction to form O1ŌłÆ in the Li2O2. Previous studies [14,20,21] have demonstrated that the presence of an efficient catalyst is necessary to facilitate the activation of O2ŌłÆ ions. A uniform mixing of Li2O with efficient catalysts is crucial for maximizing the usable capacity toward its theoretical limit. Charging beyond the usable capacity (overcharging) can cause the oxidation of activated O2ŌłÆ ions, resulting in the formation of a superoxo species (O2 1ŌłÆ in LiO2) or gaseous O2. These species cannot revert to O2ŌłÆ during the discharging process, causing a rapid decrease in capacity during cycling. The interfacial reaction with the electrolyte is another crucial factor affecting the usable capacity. During charging, O2ŌłÆ ions on the surface of the LNGO cathode tend to transform into O1ŌłÆ ions, which then react with the electrolyte. This results in the formation of highly reactive side reaction products that consume O1ŌłÆ ions and prevent them from returning to O2ŌłÆ during discharging, leading to a capacity decline during cycling. As shown in Fig. 2, the specified capacity (300 mAh┬ĘgŌłÆ1) for a cell using a pristine electrolyte exceeds the usable capacity. In contrast, for a cell using an SN electrolyte, 300 mAh┬ĘgŌłÆ1 can be considered a usable capacity under the current experimental conditions. Because the LNGO materials used in the cells were identical, the variation in the usable capacity could not be attributed to the effect of the catalyst. The use of additives probably reduced interfacial reactions, decreasing the consumption of O1ŌłÆ by interfacial side reactions and increasing the usable capacity.
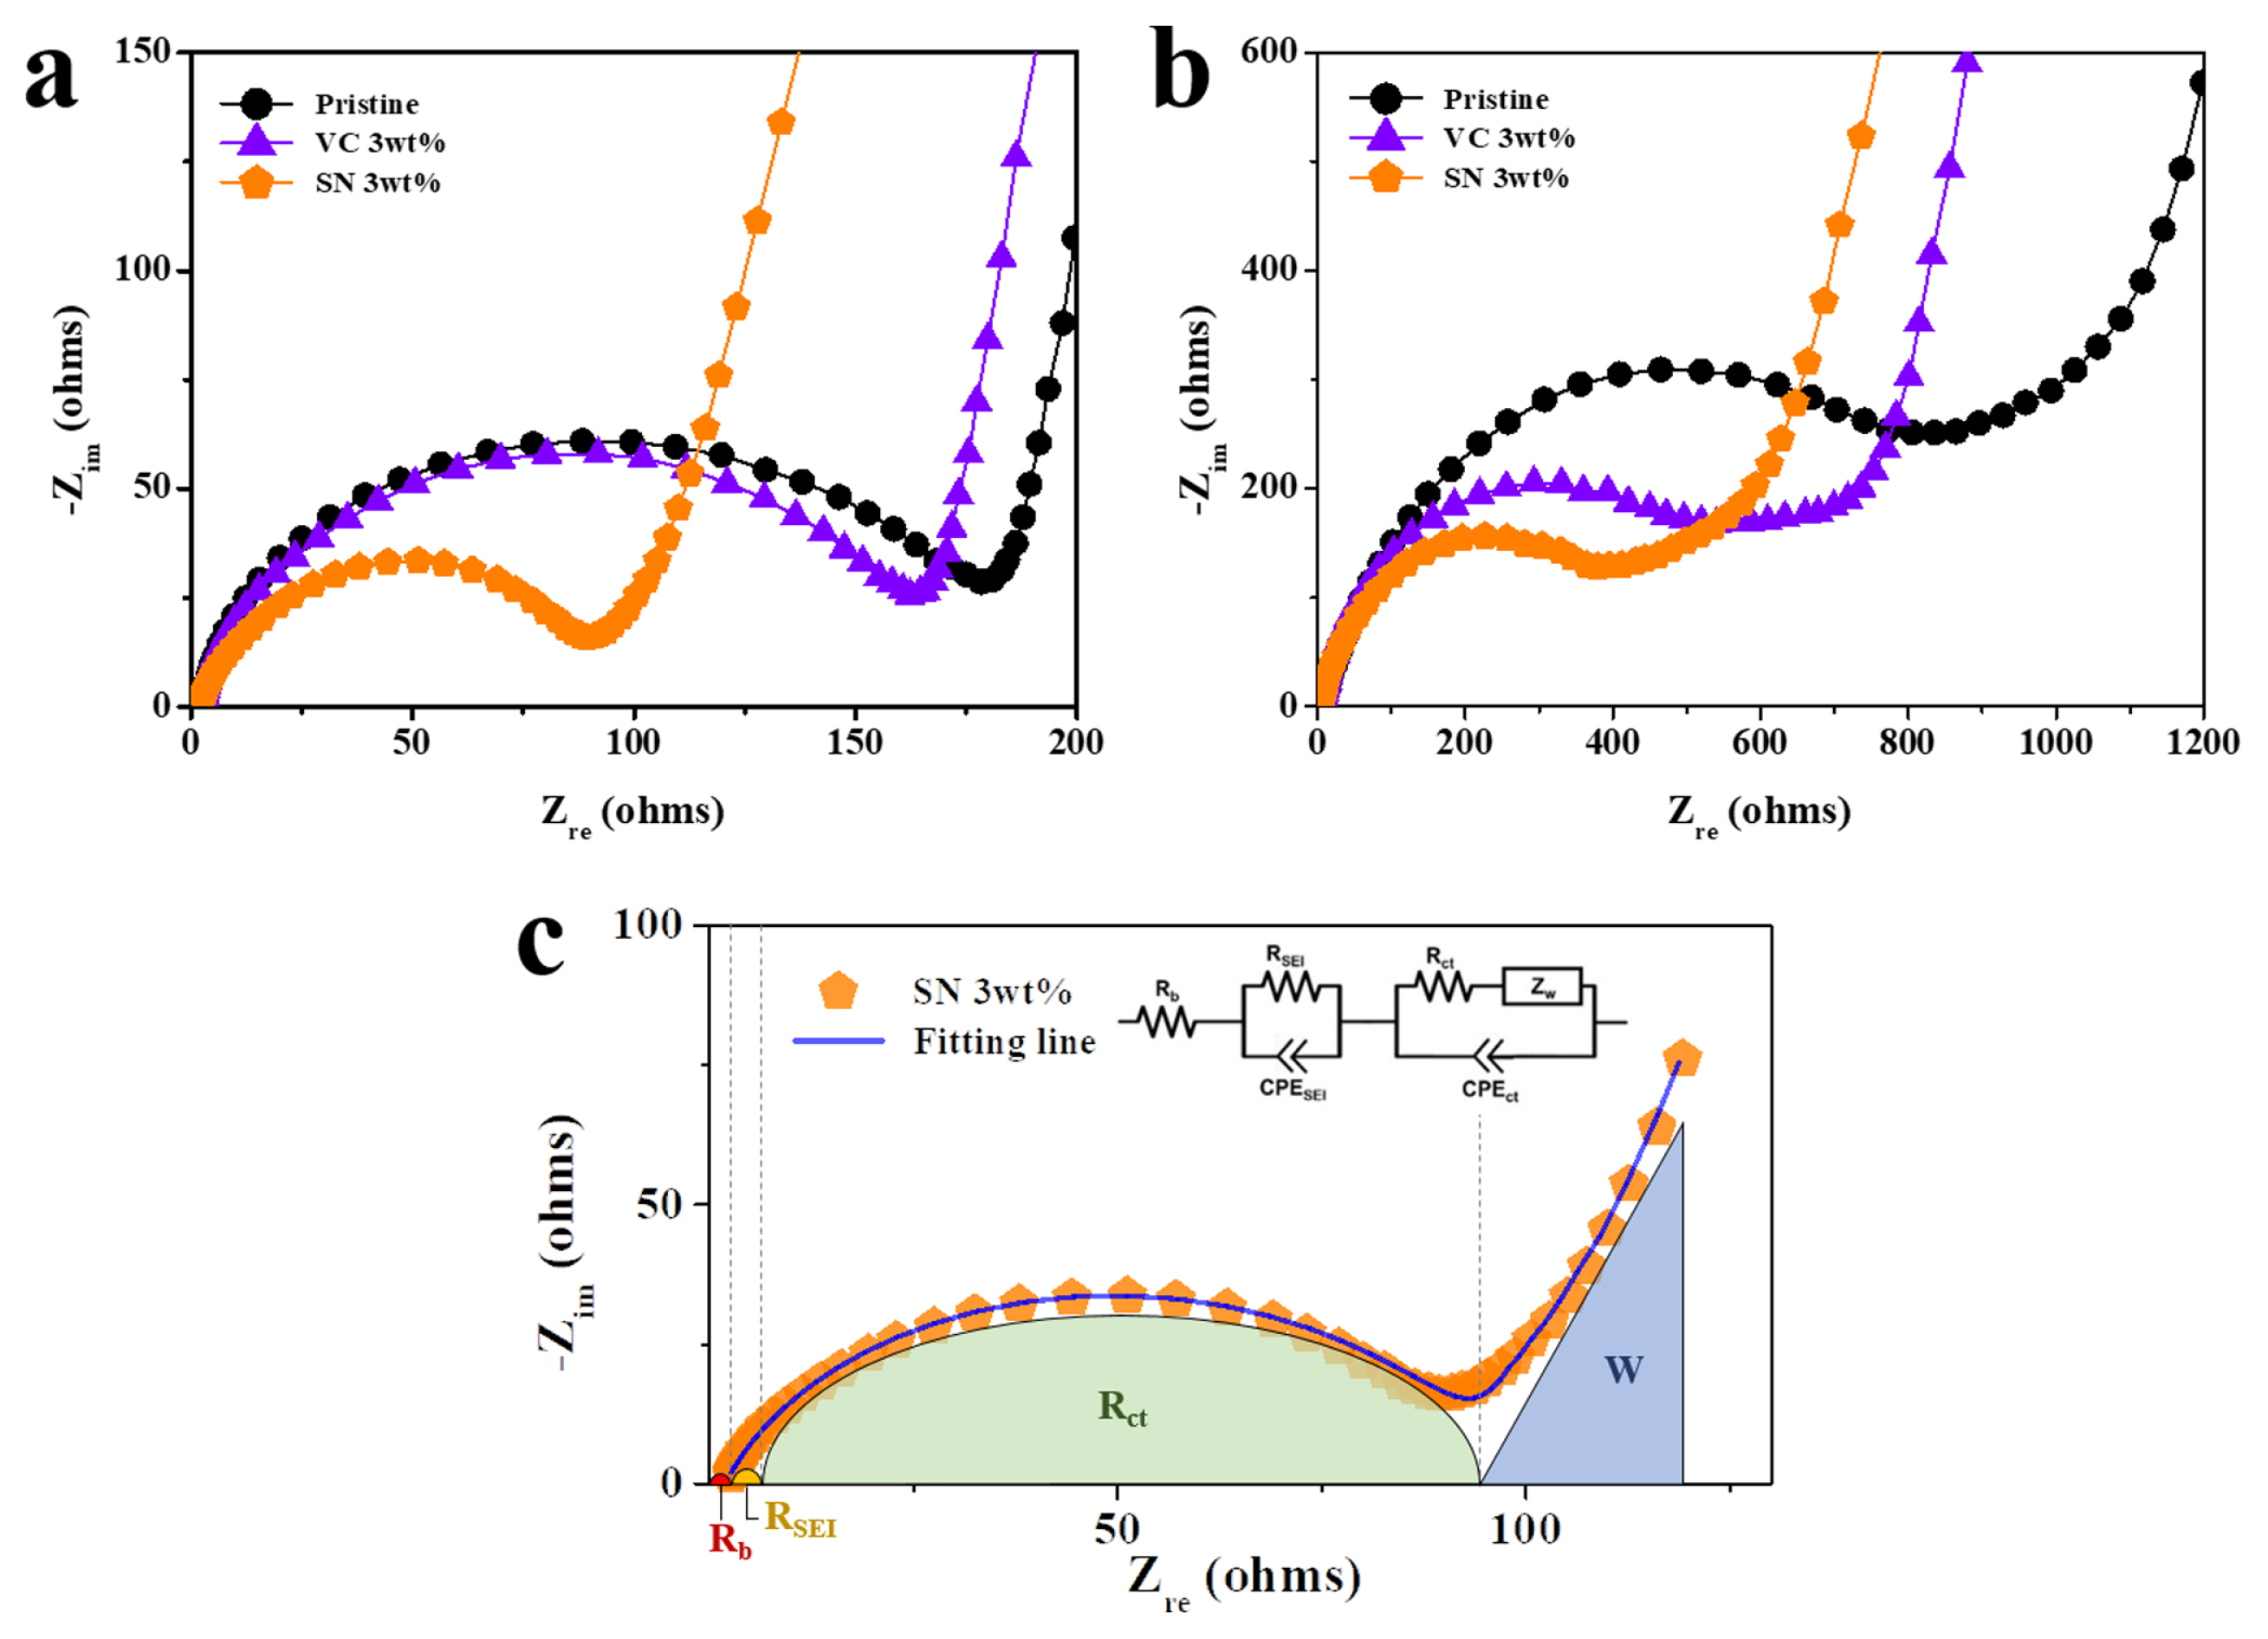
Impedance analysis and TEM images were utilized to study the effect of adding VC and SN on interfacial reactions. The Nyquist plots of the cells using pristine, VC (3 wt.%), and SN (3 wt.%) electrolytes are shown in Fig. 3a and 3b. The addition of VC slightly reduced the size of the semicircle after the 1st cycle, whereas the addition of SN reduced it more significantly (Fig. 3a), indicating that the impedance value decreases owing to the use of additives. An equivalent circuit was used to model the Nyquist plots shown in Fig. 3c, with the impedance values classified as Rb (bulk resistance), RSEI (resistance related to the solid electrolyte interphase), Rct (charge transfer resistance), and W (Warburg resistance). The obtained impedance values are listed in Table 1. The Rct value of the cell (after one cycle) using the pristine electrolyte was 177.5 ╬®, whereas that of the cell using the SN electrolyte was 94.1 ╬®. After 100 cycles, the size of the semicircle of the cells increased, indicating a rise in impedance values possibly because of the interfacial reactions that occurred during cycling. The RSEI and Rct values of the cells using the pristine electrolyte were 8.7 and 845.7 ╬®, respectively. The VC and SN electrolytes showed a minimal increase in the semicircle size, possibly due to the additives that suppress interface reactions. In particular, using SN appeared to be more efficient than using VC. The RSEI and Rct values of the cell using the SN electrolyte were reduced to 5.7 and 467.6 ╬®, respectively. The low impedance value may contribute to the enhanced electrochemical performance of the cells using SN additives, as shown in Fig. 2.
Fig. 4 compares the TEM images of LNGO samples collected after the 1st and 100th cycles. When using the pristine electrolyte, the interfacial layer was thin after the 1st cycle (Fig. 4a). However, after the 100th cycle, the amount of layers significantly increased, indicating persistent side reactions between the cathode and electrolyte (Fig. 4b). When using the VC electrolyte, a thin interfacial layer was distinctly observed in the TEM image of the sample after the 1st cycle (Fig. 4c). This interfacial layer may consist of materials formed by the decomposition of VC during the initial cycling. This layer grew substantially over 100 cycles but appeared to be thinner (approximately 50ŌĆō60 nm) than that observed when the pristine electrolyte was used (approximately 80ŌĆō90 nm), indicating that the addition of VC reduced the side reactions (Fig. 4d). The addition of SN forms a more distinct interfacial layer (approximately 10 nm) after the 1st cycle, as shown in Fig. 4e. This indicates that the decomposition of SN leads to a slightly thicker and stronger protective layer compared to that of VC. In contrast, the interfacial layer after 100 cycles was thinner (approximately 20ŌĆō30 nm) than those obtained with the pristine and VC electrolytes. This accounts for the significant decrease in impedance values, as presented in Fig. 3 and Table 1, which is due to the addition of SN.
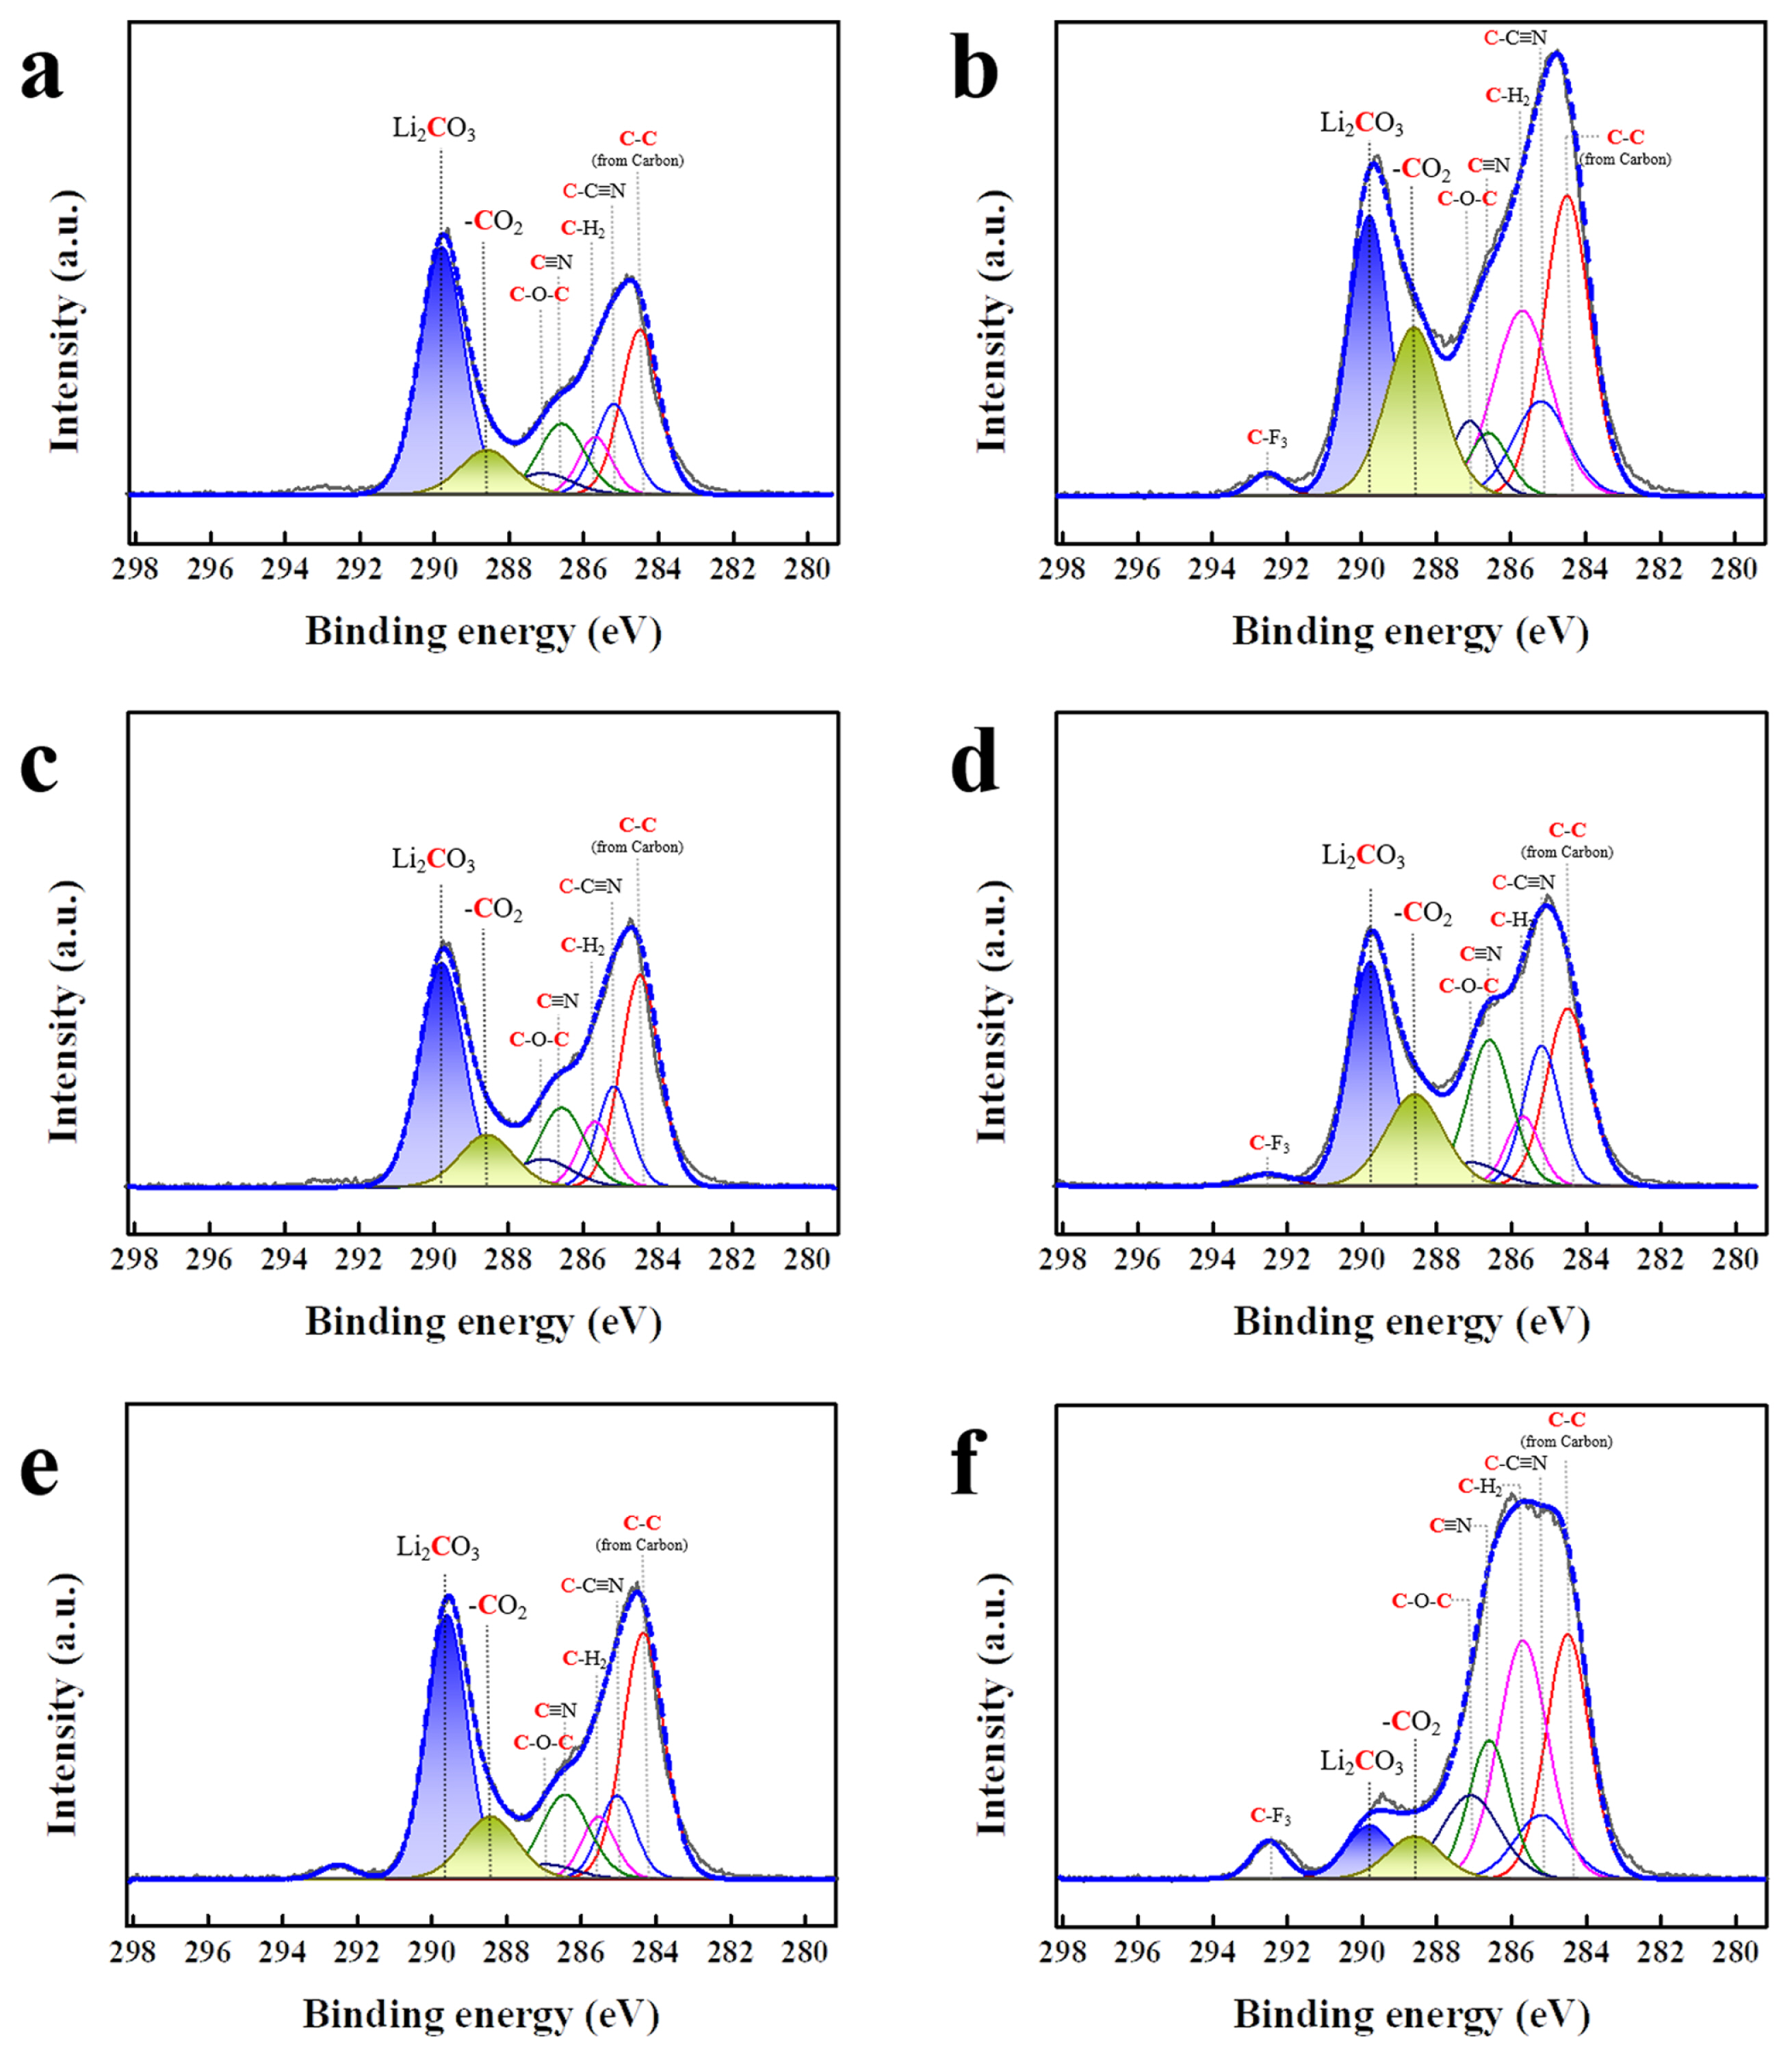
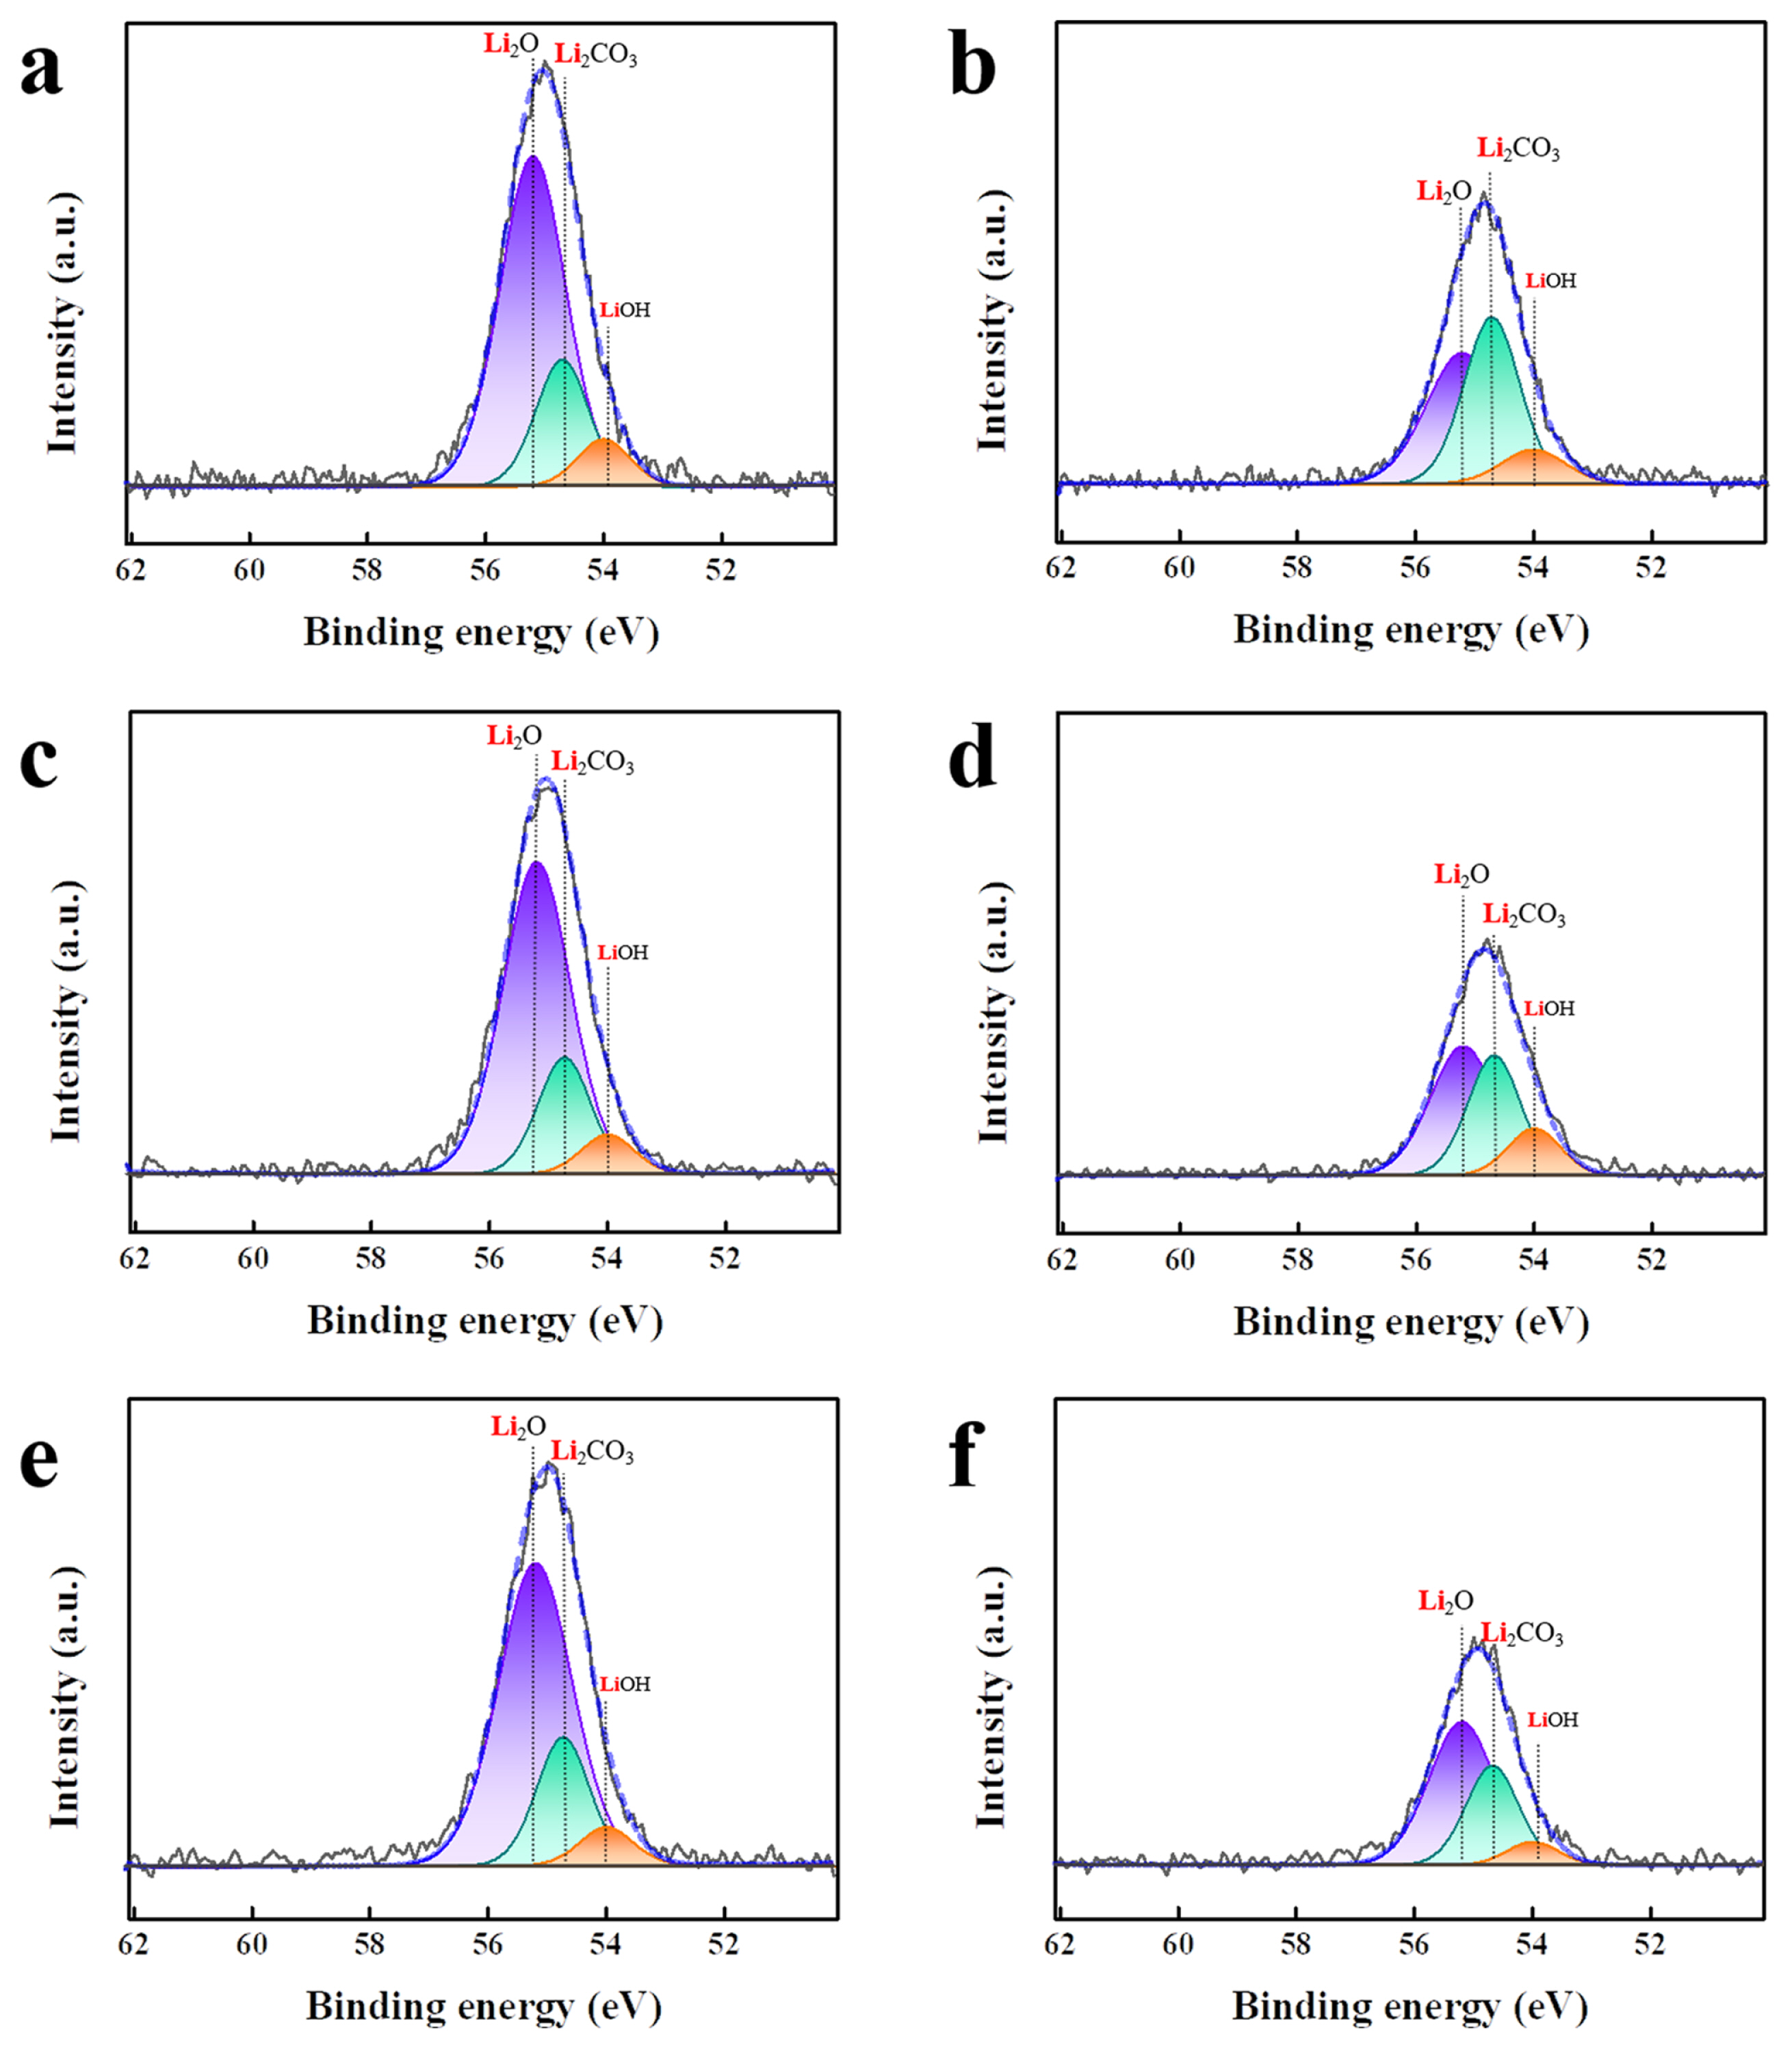
The reactions at the cathodeŌĆōelectrolyte interface were characterized using XPS analysis. Fig. 5 shows the C 1s XPS spectra of LNGO samples cycled using pristine, VC (3 wt.%), and SN (3 wt.%) electrolytes. The CŌĆōC bonds (approximately 284.5 eV) are associated with carbon [35,36]. The CŌĆōC=N (approximately 285.2 eV), CŌĆōH2 (approximately 285.7 eV), and C ŌēĪ N (approximately 286.6 eV) bonds are attributed to the binder [27,37] of the cathode. In addition, the CŌĆōOŌĆōC bonds (approximately 287.1 eV) were due to residual carbon impurities [38]. The peaks indicating the side reactions at the interface corresponded to Li2CO3 (violet-blue) and CO2 (light green), located at approximately 289.8 and 288.6 eV, respectively. As shown in Fig. 5a, 5c, and 5e, Li2CO3 and CO2 peaks of similar intensities are observed after one cycle, regardless of the electrolyte used. After 100 cycles, the CO2 peak intensity for the LNGO with pristine electrolyte increased, whereas the peak intensity for the LNGO with the VC electrolyte remained relatively weak, although it increased slightly during cycling. The sample using the SN electrolyte exhibited considerably decreased Li2CO3 and CO2 peak intensities during cycling. As shown in TEM images (Fig. 4e and 4f), the interfacial layer grew to a certain degree during cycling, even with the use of SN electrolyte. Therefore, the decrease in Li2- CO3 and CO2 peak intensities indicated that the composition of the interfacial layer differed from the general composition. As shown in Fig. 6, Li2O (approximately 55.2 eV, shown in purple), Li2CO3 (approximately 54.7 eV, shown in green), and LiOH (approximately 54.0 eV, shown in orange) peaks are observed in the Li 1s spectra. After 100 cycles, the peak intensity of Li2O was significantly reduced, indicating the presence of a covering interfacial layer on the cathode surface (Fig. 6b, 6d, and 6f). The use of the VC electrolyte resulted in a lower intensity of the Li2CO3 peak compared to that obtained using the pristine electrolyte. The use of the SN electrolyte resulted in a more pronounced decrease in the Li2CO3 peak intensity. This confirms that the addition of SN effectively reduced the formation of undesirable products from general side reactions.
Fig. 7 shows the N 1s XPS spectra of the LNGO samples after the 1st and 100th cycles. Li3N (approximately 398.2 eV, yellow), NŌēĪC (approximately 398.1 eV), CŌĆōNH2 (approximately 400 eV), and NŌĆōH (approximately 400.7 eV) peaks are observed in the spectra. The intensity of these peaks increased considerably over 100 cycles with the use of the pristine electrolyte (Fig. 7a and 7b). The growth of these peaks was limited during cycling when the VC electrolyte was used (Fig. 7c and 7d). In contrast, the use of the SN electrolyte resulted in a comparatively stronger intensity of the peaks than those obtained using the other electrolytes, even after 1st cycle. Additionally, the peaks grew even stronger with the appearance of a new peak (LiNxOy, approximately 400.9 eV). This indicates that the addition of SN contributes to the formation of a N-derived interfacial layer, such as that comprising the nitrile functional group (ŌłÆCN) [31ŌĆō34]. Overall, the XPS analysis revealed that the addition of SN effectively reduced the general side reaction products, such as Li2CO3, and promoted the formation of the N-derived interfacial layer. The presence of the N-derived interfacial layer may also inhibit the exchange of electrons and ions during cycling. However, it may probably mitigate the thickening of the interface layer by suppressing side reactions between the cathode and electrolyte (Fig. 4f). This change in the surface interface layer led to an improvement in the usable capacity and high cycling performance of cells containing the SN additive. The addition of VC also decreases the side reaction products and improves the electrochemical performance, as shown in Fig. 2. However, the use of SN additive was more effective in suppressing interfacial side reactions than the use of the VC additive.
4. Conclusions
SN was added to the electrolyte to stabilize the interface between the LNGO cathode and electrolyte. The decomposition of SN during cycling is expected to form a protective layer that can mitigate undesirable side reactions on the surface of the cathode. The LNGO cathode used in this study was fabricated by mixing Li2O, which served as the active material, and Ni-embedded reduced graphene oxide that acted as a catalyst matrix to activate Li2O. The addition of SN improved the usable capacity and enhanced the cycling performance of cells containing LNGO. Furthermore, the impedance values of the cells decreased with the addition of SN. Compared to the use of the VC additive, the use of SN was more effective in enhancing the electrochemical performance of the cells. Moreover, the TEM images revealed that the addition of SN considerably reduced the thickness of the interfacial layer on the surface of LNGO during cycling. This suggests that the incorporation of SN effectively suppresses the side reactions at the cathodeŌĆōelectrolyte interface, significantly improving the electrochemical performance of the cell containing LNGO. As revealed using the XPS spectra of LNGO after the 1st and 100th cycles, the use of SN electrolytes considerably reduced the formation of general side reaction products, such as Li2CO3. The Ni-derived materials produced from the decomposition of the SN additive suppressed undesirable side reactions, leading to a relatively thinner interfacial layer compared to that obtained with the use of pristine and VC electrolytes. In conclusion, our findings demonstrate that the use of SN is more effective than the conventional VC additive in improving the usable capacity and enhancing cycling performance.