1. Introduction
To meet the 1.5ô¯C target of global warming along with net zero emissions realized by energy transformation from fossil fuels to renewable energy, the utilization of hydrogen as a renewable energy carrier is required [1ã3]. Hydrogen has been mainly produced from fossil fuels using steam methane reforming, which accounts for approximately 96% of the total hydrogen production [4]. Accordingly, water electrolysis using renewable electrical energy is urgently required for clean hydrogen production and the long-term storage of surplus electricity generated from solar and wind power units [5]. Among the various types of water electrolysis processes, proton exchange membrane water electrolysis (PEMWE) is the most suitable for clean hydrogen production because of its high current density, good load-following capability, fast response time, and compact size [6]. According to the International Energy Agency (IEA) report, ãNet Zero Emissions by 2050 Scenarioã, the demand for water electrolysis cell deployment is expected to reach 3,600 GW by 2050 [7]. However, for the full commercialization of PEMWE, further research and development focused on the scale-up (e.g., electrode area), automation, and fast production of water electrolysis cells are required to reduce material and manufacturing costs [7]. Therefore, it is necessary to develop fabrication techniques suitable for the mass production of PEMWE systems.
In PEMWE system, IrO2-based anode is one of the key components closely related to the performance of electrolysis cell, and various catalyst coating methods have been investigated: slot-die coating [8,9], spray coating [10ã17], electrodeposition [18ã21], sputtering [22], reactive spray deposition [23], atomic layer deposition [24], doctor blade coating [25,26], inkjet printing [27,28], impregnationãreduction [29], and so on. For mass production, the slot-die coating combined with roll-to-roll process, which has a high production rate [8,9], has been extensively developed by PEMWE companies such as Plug Power and NEL Hydrogen [30,31], while further improvement in the uniformity of the coated film [31,32] and the membrane swelling problem due to the long interaction time between the ink solvent and the membrane [8] are required for enhanced performances. In contrast, the spray coating technique can provide a high uniformity of coated layer, less vulnerability to membrane swelling, precise control of catalyst loading, and good scalability of coating area [8], even though its production rate is relatively low compared to the conventional slot-die coating. Also, the electrodeposition, where the catalyst precursors are directly transformed to the catalyst layers mainly on conductive porous transport layers (PTLs), is also expected to be an alternative technology for the mass production as it was reported to provide high performance [18,20,21], scalability, and the precise control of the catalyst loading amount.
For the spray coating, there have been various studies to enhance the performances, including the effect of catalyst ink characteristics and spray conditions. Ink is a primary component for spray coating and composed of IrO2 powder, ionomer (Nafion resin), and solvent, which is usually the mixture of organic solvents and deionized water, such as isopropanol and deionized water (IPA-DIW) [11,13,15ã17] or n-propanol and DIW [10,12,14]. These recipes have also been commonly used for the spray coating of the catalyst layer in proton exchange membrane fuel cells owing to the good dispersion of catalyst particles in the ink and fast evaporation after spraying [33ã35]. However, some issues have been reported for the propanol/water mixture solvents: the swelling and deformation of the Nafion membrane [8,9,36], and the formation of the rough catalyst layer during the evaporation of solvents [37]. Some studies reported that the fuel cell fabricated by using pure organic solvents such as ethylene glycol and dimethyl oxalate, instead of using the conventional mixture, exhibited superior performance with changing of the catalyst microstructure, which led to the enhanced mass transport of the reactant [38,39]. Although all of ink components, including solvent in spray coating, affect the performance of water electrolysis cells [12], the use of pure organic solvent for spray coating has not been attempted for the fabrication of water electrolysis cells. Our study focused on the use of pure organic solvents for spray coating of the catalyst layer for water electrolysis cells. The use of the pure organic solvent should be investigated in various aspects, such as the catalyst dispersion in the solvent, spray-feasibility, and electrolysis performance. In this study, various pure organic solvents were examined as substitutes for IPA-DIW in the catalyst ink of spray coating for the fabrication of the anode of the PEMWE electrolysis cell. Firstly, the dispersion characteristics of several pure organic solvents were examined, and then the selected solvent was further examined by single-cell tests in comparison to the conventional IPA-DIW mixture solvent case. In addition, various spray conditions, such as ionomer concentration, drying temperature, and spray nozzle type were optimized for the PEMWE performances.
2. Experimental
2.1 Catalyst ink preparation and characterization
An IrO2 powder (Alfa Aesar, PremionôÛ, metal trace 99.99%, Ir 84.5%, 43396) and Nafion resin solution (Sigma-Aldrich) were purchased as commercial-grade chemicals. The tested solvents were IPA (Samchun Chemical), 2-BuOH (Samchun Chemical), acetonitrile (MeCN; Sigma-Aldrich), 1,1,1,3,3,3-hexafluoro-isopropanol (HFIPA; Sigma-Aldrich), toluene (Sigma-Aldrich), hexane (Sigma-Aldrich), benzene (Sigma-Aldrich), and deionized water (DIW, >18 Möˋ). The IrO2 powder (10 mg mLã1) and ionomer (0.53 mg mLã1 which corresponds to 5 wt.% of IrO2) were dispersed in each solvent under magnetic stirring for 1 h and then ultrasonicated in an ice water bath for ~30 min.
The size and öÑ-potential of the dispersed particles were analyzed through dynamic light scattering (DLS; ELSZ-2000ZS, Photal Otsuka Electronics, 664.5 nm), and the Z-average diameter of the particles was measured five times for each ink. For DLS measurements, 0.5 mg mLã1 IrO2 dispersions and 0.53 mg mLã1 Nafion ionomer dispersions were utilized to ensure light transmittance. Before DLS measurements, the prepared inks were microfiltered to eliminate large particles, which can lead to false scattering peaks. To confirm the measurement error, monodisperse (0.10ôÝ0.03 ö¥m) polystyrene particles (SupelcoôÛ) were used as the standard sample for DLS analyses, and the size deviation was determined to be below 5%. The öÑ-potentials of various inks were measured using a slit cell.
2.2 Electrode and MEA fabrication
The anode catalyst inks were prepared by dispersing the IrO2 powder and a Nafion resin solution (5 wt.% solution, Sigma-Aldrich) in 2-BuOH or 1:1 IPA-DIW mixture as the solvent. The amount of the catalyst was 10 mg mLã1 (which corresponds to 1 wt.% of the total solvent). The anode ink solution was first moderately stirred using a magnetic bar and then ultrasonicated for 30 min in an ice bath. Then, the anode catalyst ink was sprayed onto Nafion 212 (Chemours, 51 ö¥m thick) membranes at a mantle temperature of 90ã120ô¯C using a dual concentric air nozzle (NNC-DN-1823, 18ã23G, NanoNC) for conventional spray coating or an ultrasonic nozzle (Sono-Tek, AccuMistôÛ 120 kHz, 30 mL hã1) for ultrasonic spray coating. After spray coating the catalyst ink, the MEA was heated on a hot plate for 30 min to evaporate the residual solvent. The loading of the IrO2 catalyst was controlled at 1.0 mg cmã2 by measuring the sprayed amount using a microbalance (Entris 2241-1S).
2.3 Electrochemical characterization of single cells
Electrochemical measurements were conducted on single cells with a geometric electrode area of 4.0 cm2 consisting of a Ti anode plate, a graphite cathode, and bipolar plate (CNL Energy). All electrochemical measurements were conducted using a potentiostat (Biologic HCP-803). Linear sweep voltammetry (LSV) was conducted in the voltage range of 1.20ã2.0 V at a scan rate of 10 mV sã1. The impedance spectra were recorded with an amplitude of 18 mV over the frequency range of 50 mHz to 30 kHz in the potentiostatic mode at 1.90 V. Accelerated degradation tests (ADTs) were performed by applying triangular voltage between 1.60 and 1.90 V at a scan rate of 300 mV sã1 for 8000 cycles. After ADT, LSV and EIS data were acquired to investigate the electrochemical degradation of the MEA.
2.4 Catalyst layer characterization
The porosity of the catalyst layer was measured using mercury intrusion porosimetry (Autosorb-iQ 2ST/MP, Quanthrome, PM33GT). Samples were prepared by spraying the same ink onto a 4.0 cm2 spray mask fixed on a vacuum hot plate. After the spraying was completed, the 4.0 cm2 anode was sliced into four 1.0 cm2 specimens for repeated measurements. The intrusion pressure ranged from 0.2 to 32982.8 PSIA (absolute pressure) in all tests. The morphology of the catalyst layer was observed using field-emission scanning electron microscopy (FE-SEM; Inspect F50), and the cross-sectional images were scanned using a focused ion beam (FIB; Helios NanoLab 600).
3. Results and Discussion
3.1 Dispersion of the catalyst in various organic solvents
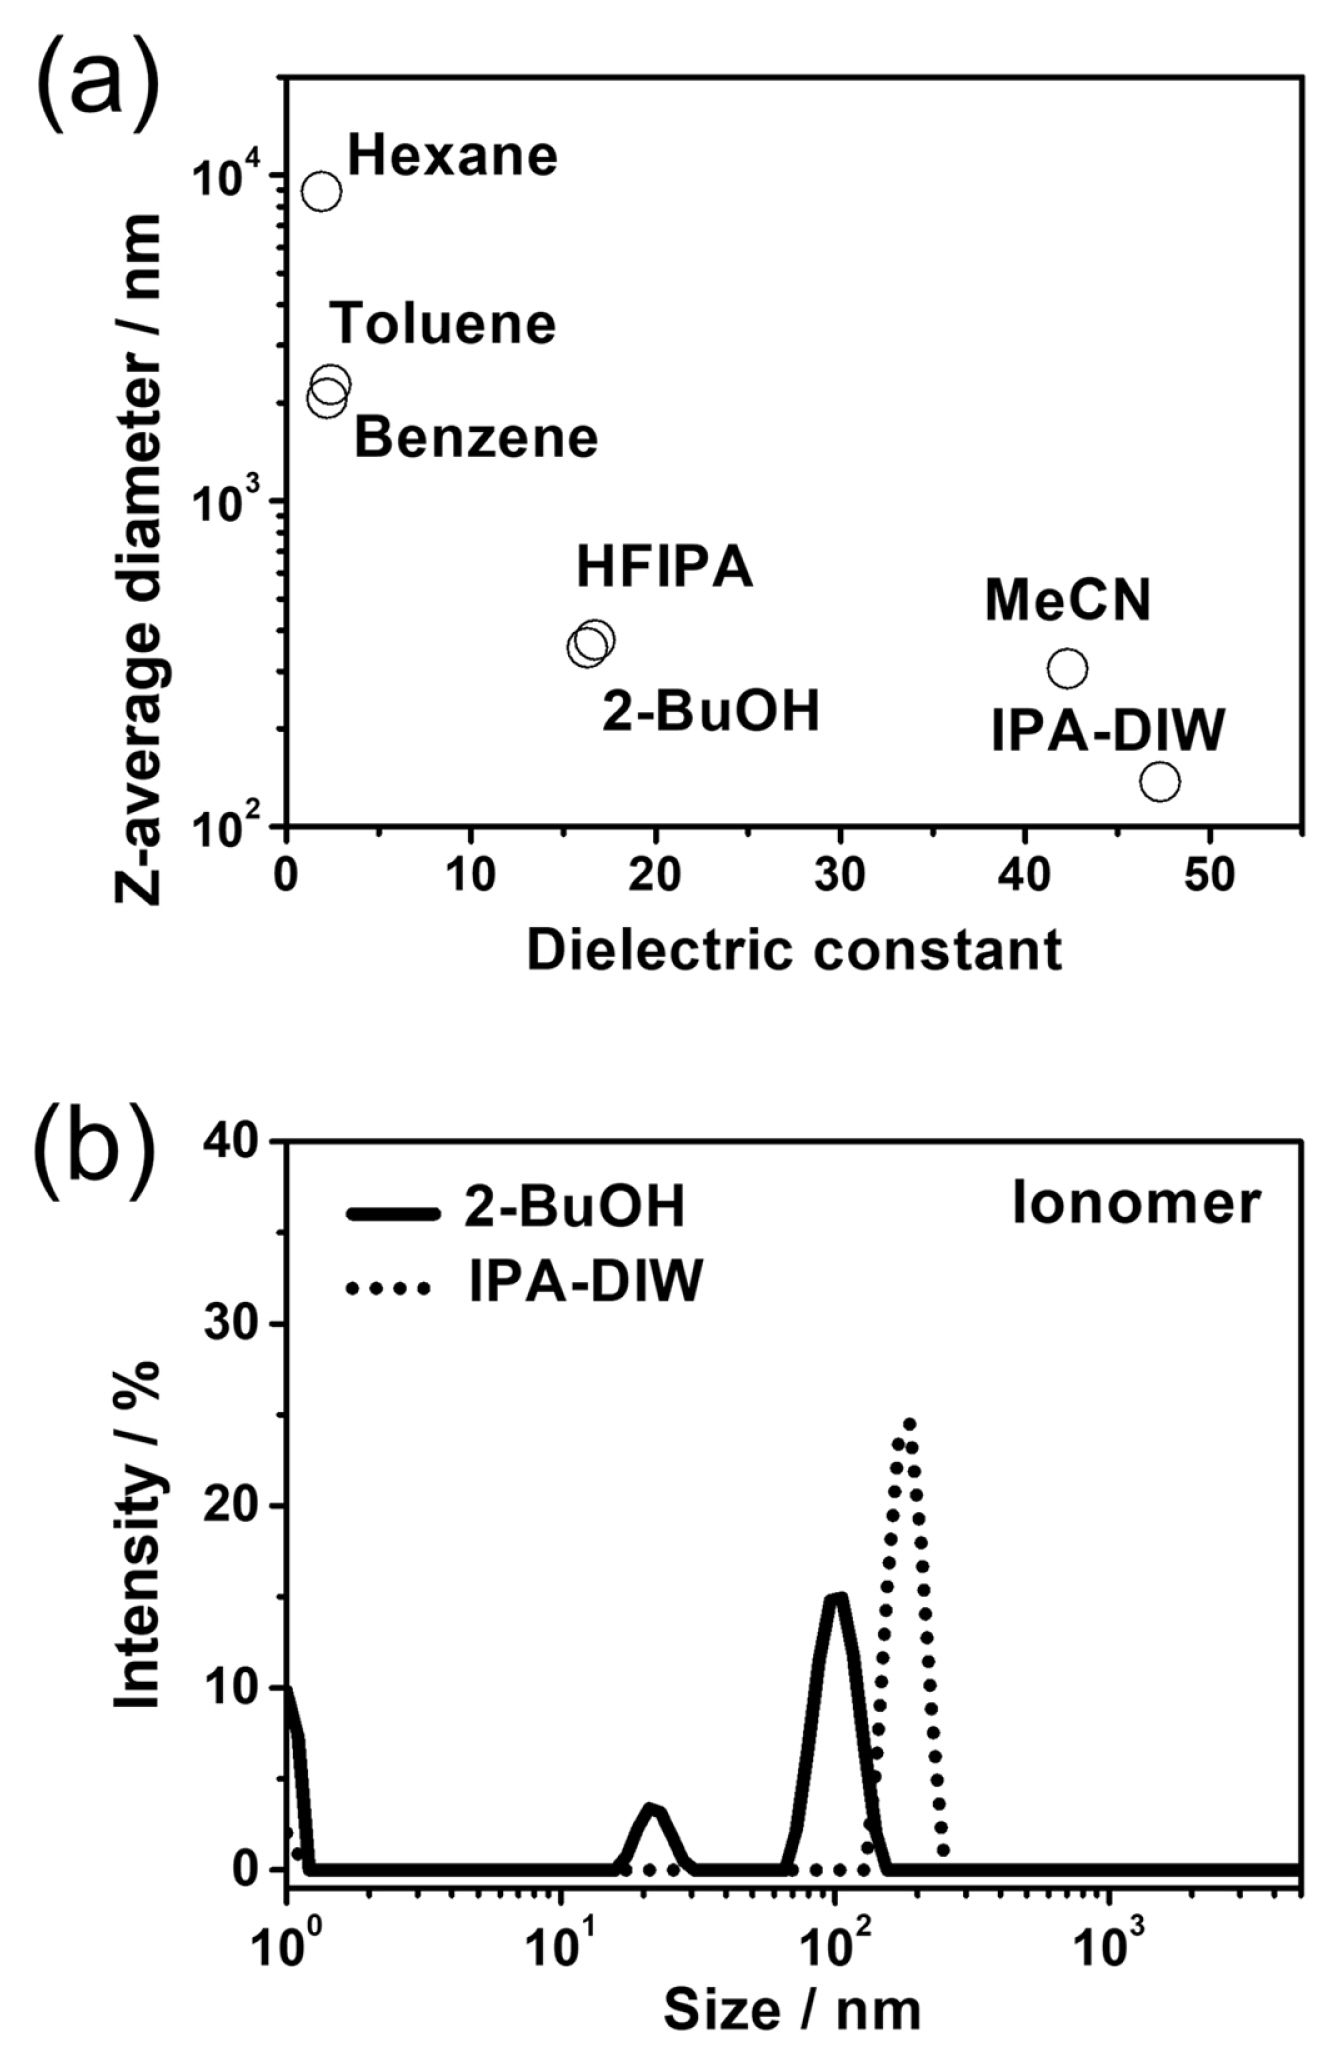
Among the various inexpensive and readily available organic solvents considering the application for the mass production of anode catalyst layer, six organic solvents (polar: 2-BuOH, HFIPA, and MeCN / nonpolar: hexane, benzene, and toluene) having various dielectric constants in the range of 1 to 50 (where the dielectric constant of IPA-DIW is 47.3) were selected and the dispersion characteristics of the IrO2 catalyst powder in these solvents were examined through DLS measurements (Fig. 1). The polar solvents with higher dielectric constants exhibited good IrO2 dispersion characteristics, and the size of the dispersed particles was below 400 nm. On the other hand, the particle size reached the micrometer-scale in nonpolar solvents, indicating poor dispersibility of the catalyst. Among the polar solvents with good IrO2 dispersion, the 2-BuOH was selected as a suitable candidate for replacing the conventional IPA-DIW mixture. Other polar solvents have disadvantages for spray coating in large scale: the MeCN is highly volatile and toxic [40] and was also reported to degrade the catalytic activity and proton conductivity in proton exchange membrane [41]; and HFIPA is also toxic [42] and relatively expensive.
Next, the dispersibility of the ionomer in 2-BuOH and IPA-DIW was also evaluated via DLS measurements (Fig. 1). The Nafion ionomer in 2-BuOH displayed a major peak at 106 nm with a relative intensity of 71%, accompanied by minor peaks at 1 and 25 nm. In the case of Nafion in IPA-DIW, a major peak appeared at 187 nm with a minor peak at 1 nm, which is in reasonable agreement with previous studies [43]. Therefore, it could be confirmed that the 2-BuOH can provide good ionomer dispersion similar to the IPA-DIW mixture.
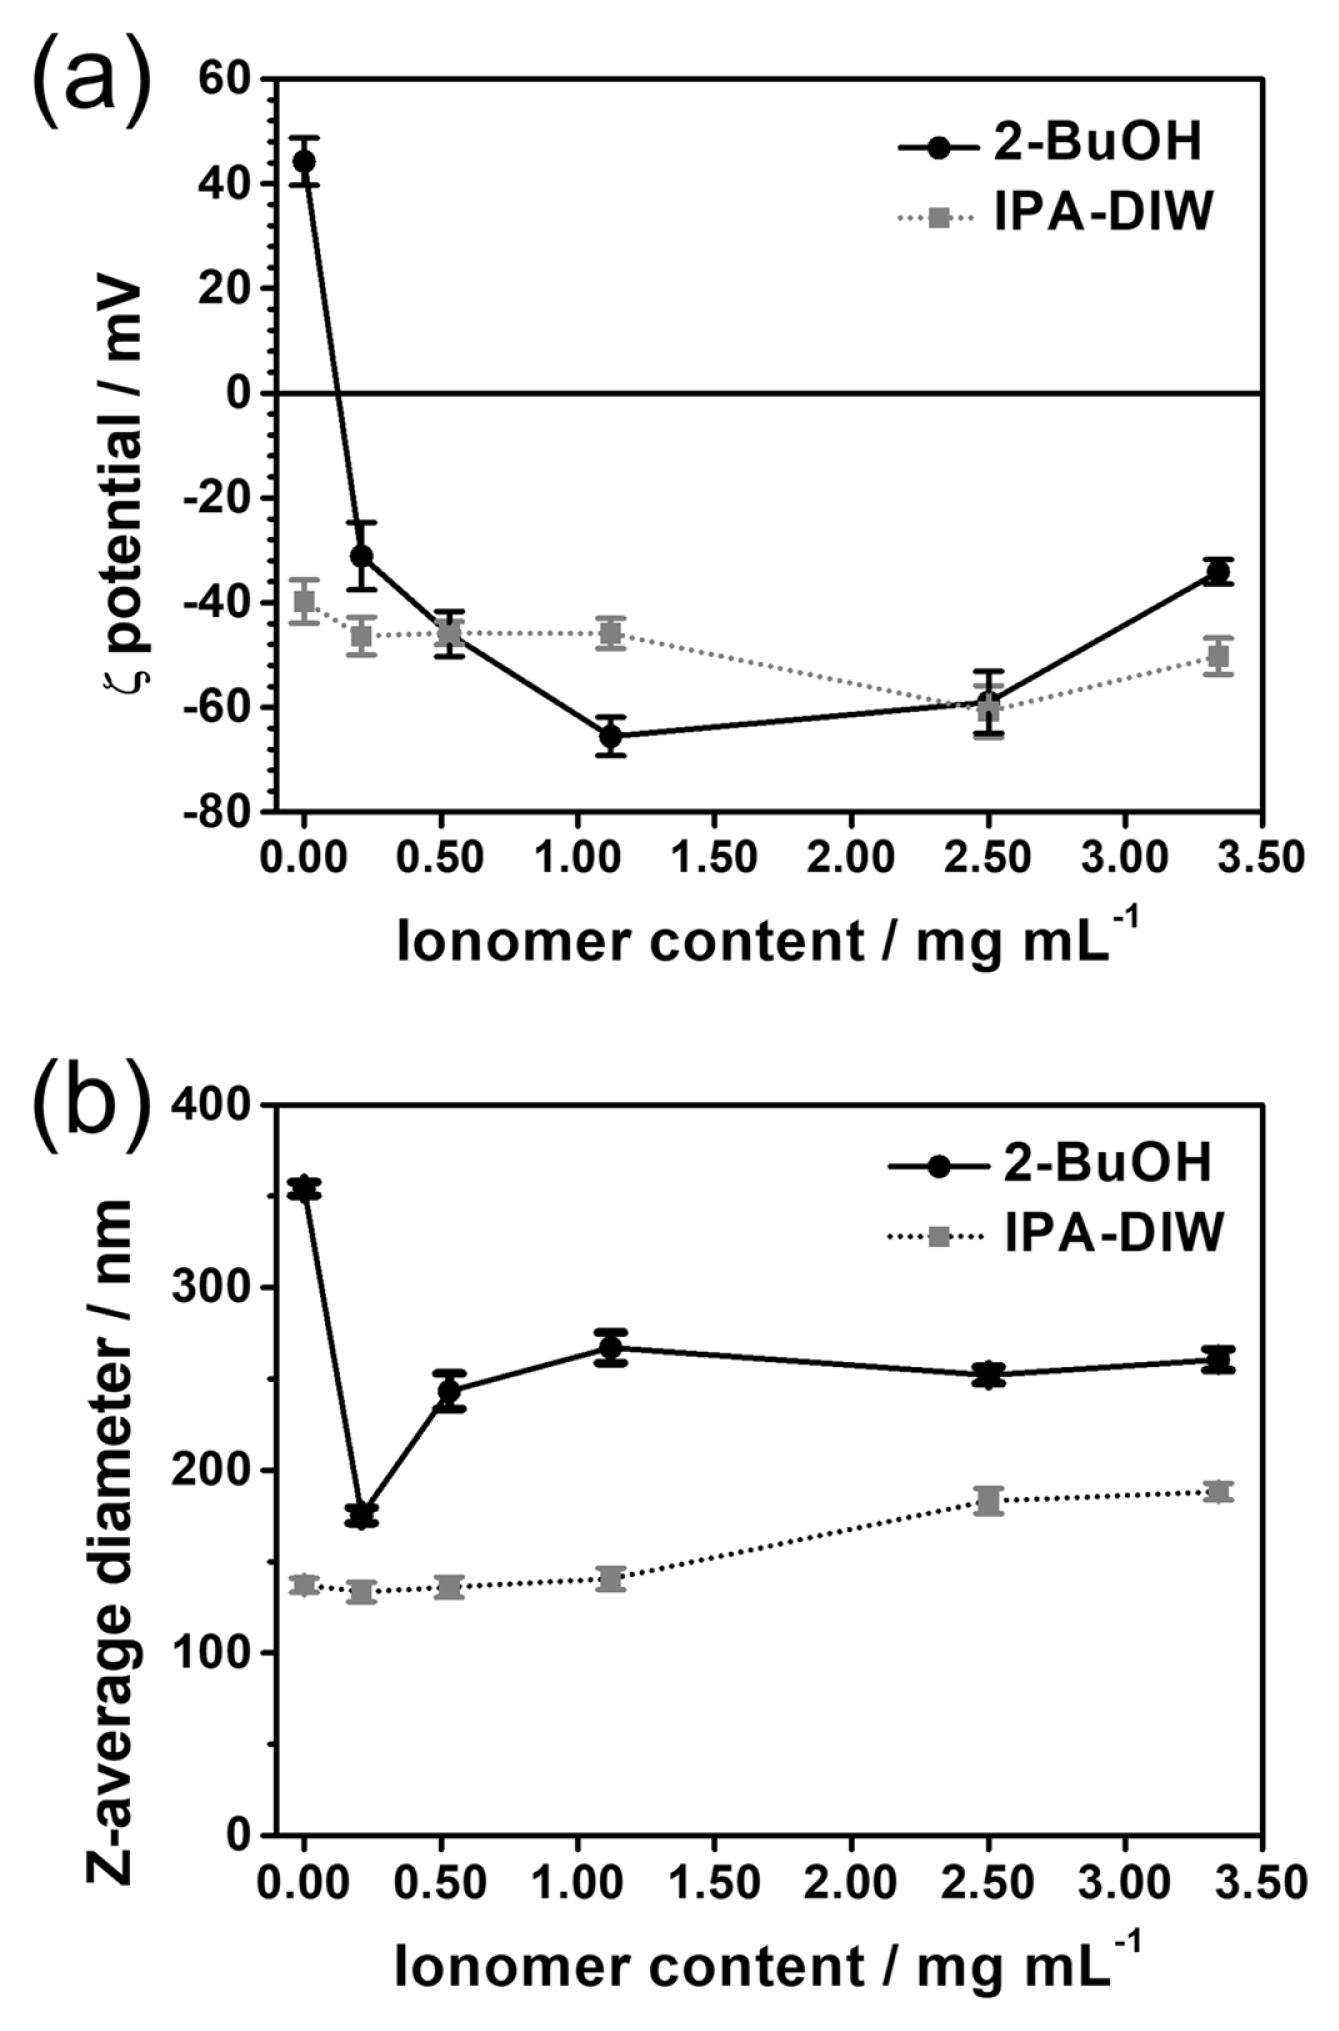
Fig. 2a shows the öÑ-potentials of the IrO2 catalyst (0.5 mg mLã1) dispersed in 2-BuOH and IPA-DIW as a function of the ionomer content. It indicates that the addition of a small amount of the ionomer (0.21 mg mLã1) to the catalyst suspension in 2-BuOH resulted in a high öÑ-potential (>|30| mV) which would lead to appropriate dispersion of the catalyst. In 2-BuOH, the öÑ-potential of the IrO2 catalyst was 46.4 mV without the ionomer. However, it decreased substantially to ã31.13 mV with the addition of 0.21 mg mLã1 ionomer, and the negative value was maintained (ã34 to ã66 mV) with a further increase in the ionomer content in the ink. This result implies that the surface of IrO2 particles, which is initially positively charged in pure 2-BuOH, can be readily covered with the ionomer, as similarly observed for the IrO2 particles in n-propanol [44]. Meanwhile, the öÑ-potential of the IrO2 particles in IPA-DIW ranged from ã39.78 to ã60.79 mV, and it did not change significantly with the addition of the ionomer.
Fig. 2b plots the Z-average diameter of the IrO2ãionomer colloids in 2-BuOH and IPA-DIW against the ionomer contents, and the results reveal that the diameter of the colloidal particles in 2-BuOH was slightly larger than that in IPA-DIW. In the case of 2-BuOH, the Z-average diameter was ~350 nm in the absence of the ionomer, and it sharply decreased to 170 nm with the addition of 0.21 mg mLã1 ionomer. This could be attributed to the change in the öÑ-potential of the dispersed catalyst particles, as shown in Fig. 2a. The colloidal size increased to ~250 nm with the further addition of the ionomer, indicating that the excess ionomer stacked on the colloid surface, leading to large catalyst agglomerates. The Z-average diameter of the IrO2ãionomer colloidal particles in the IPA-DIW was smaller than that of 2-BuOH over the entire range of the ionomer content investigated in this study, possibly due to the difference in acidity of solvents.
3.2 Performances of single cells with anodes fabricated using the 2-BuOH-based ink
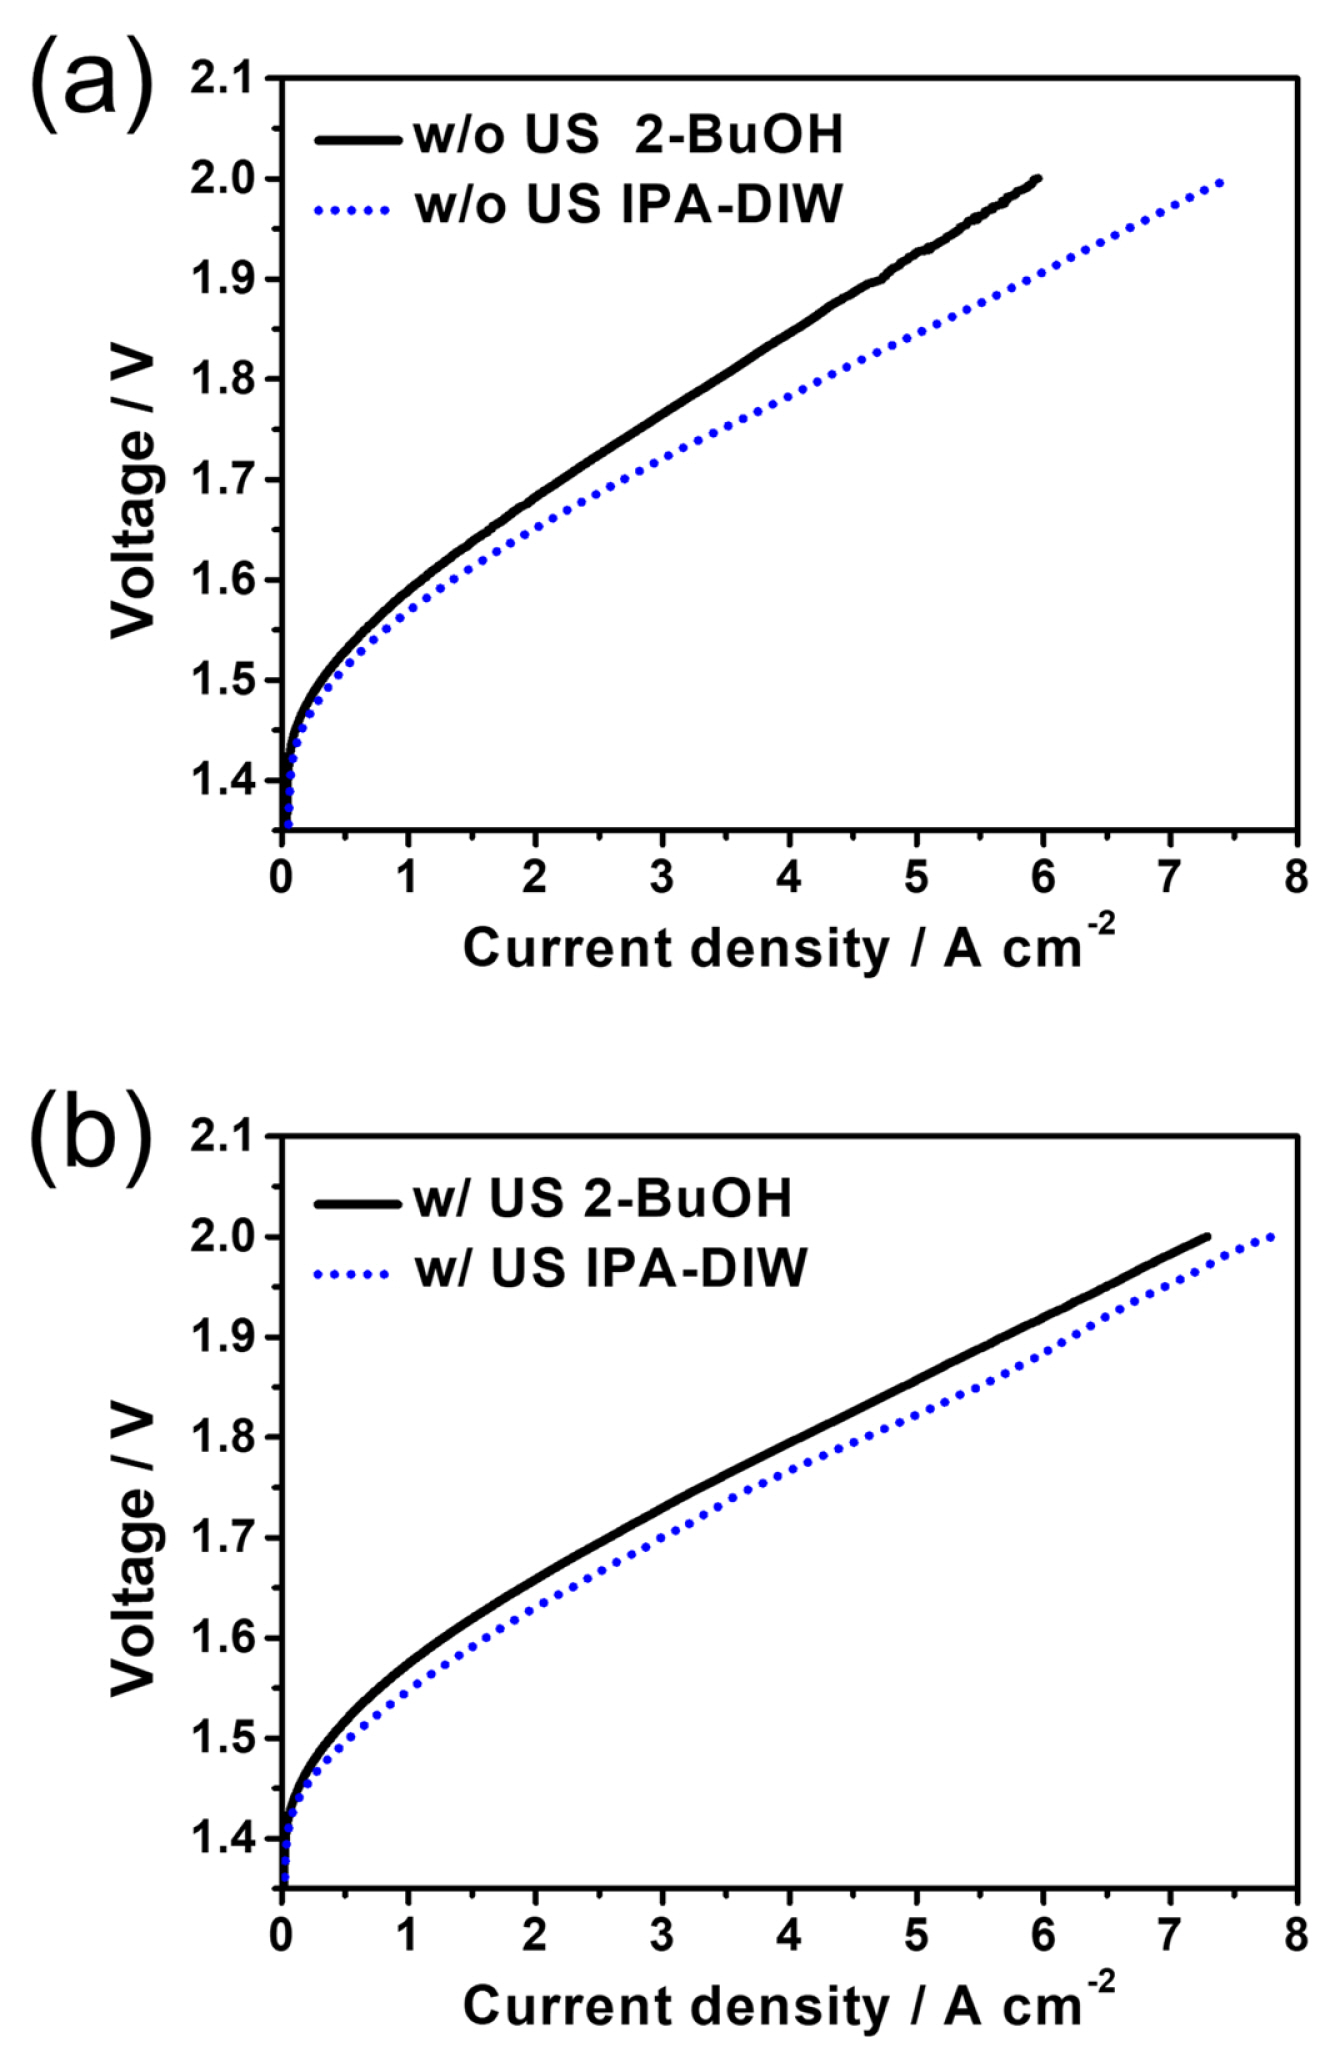
Anodes were fabricated using 2-BuOH as the solvent of the IrO2ãionomer ink, and their performances in PEMWE were evaluated and compared with those of the anodes fabricated using IPA-DIW (Fig. 3). In the case of conventional spray coating, the performance of the single cell with the anode fabricated using 2-BuOH was slightly inferior to that of the cell with the anode fabricated using IPA-DIW (Fig. 3a). At a cell voltage of 1.90 V, the current densities of the anodes fabricated with 2-BuOH and IPA-DIW were 4.7 and 5.9 A cmã2, respectively. However, when the ultrasonic spray coating technique was utilized, the PEMWE performance of the anode fabricated using 2-BuOH was enhanced larger compared to the IPA-DIW case, and it exhibited a current density of 5.7 A cmã2 at 1.90 V, which corresponds to 92% of that of the IPA-DIW. It suggests that the effect of ultrasonic atomization was dependent on the solvent type. For 2-BuOH and IPA-DIW mixture solvents, the effect of other experimental variables, such as ionomer content and drying temperature, was further examined by PEMWE single-cell tests.
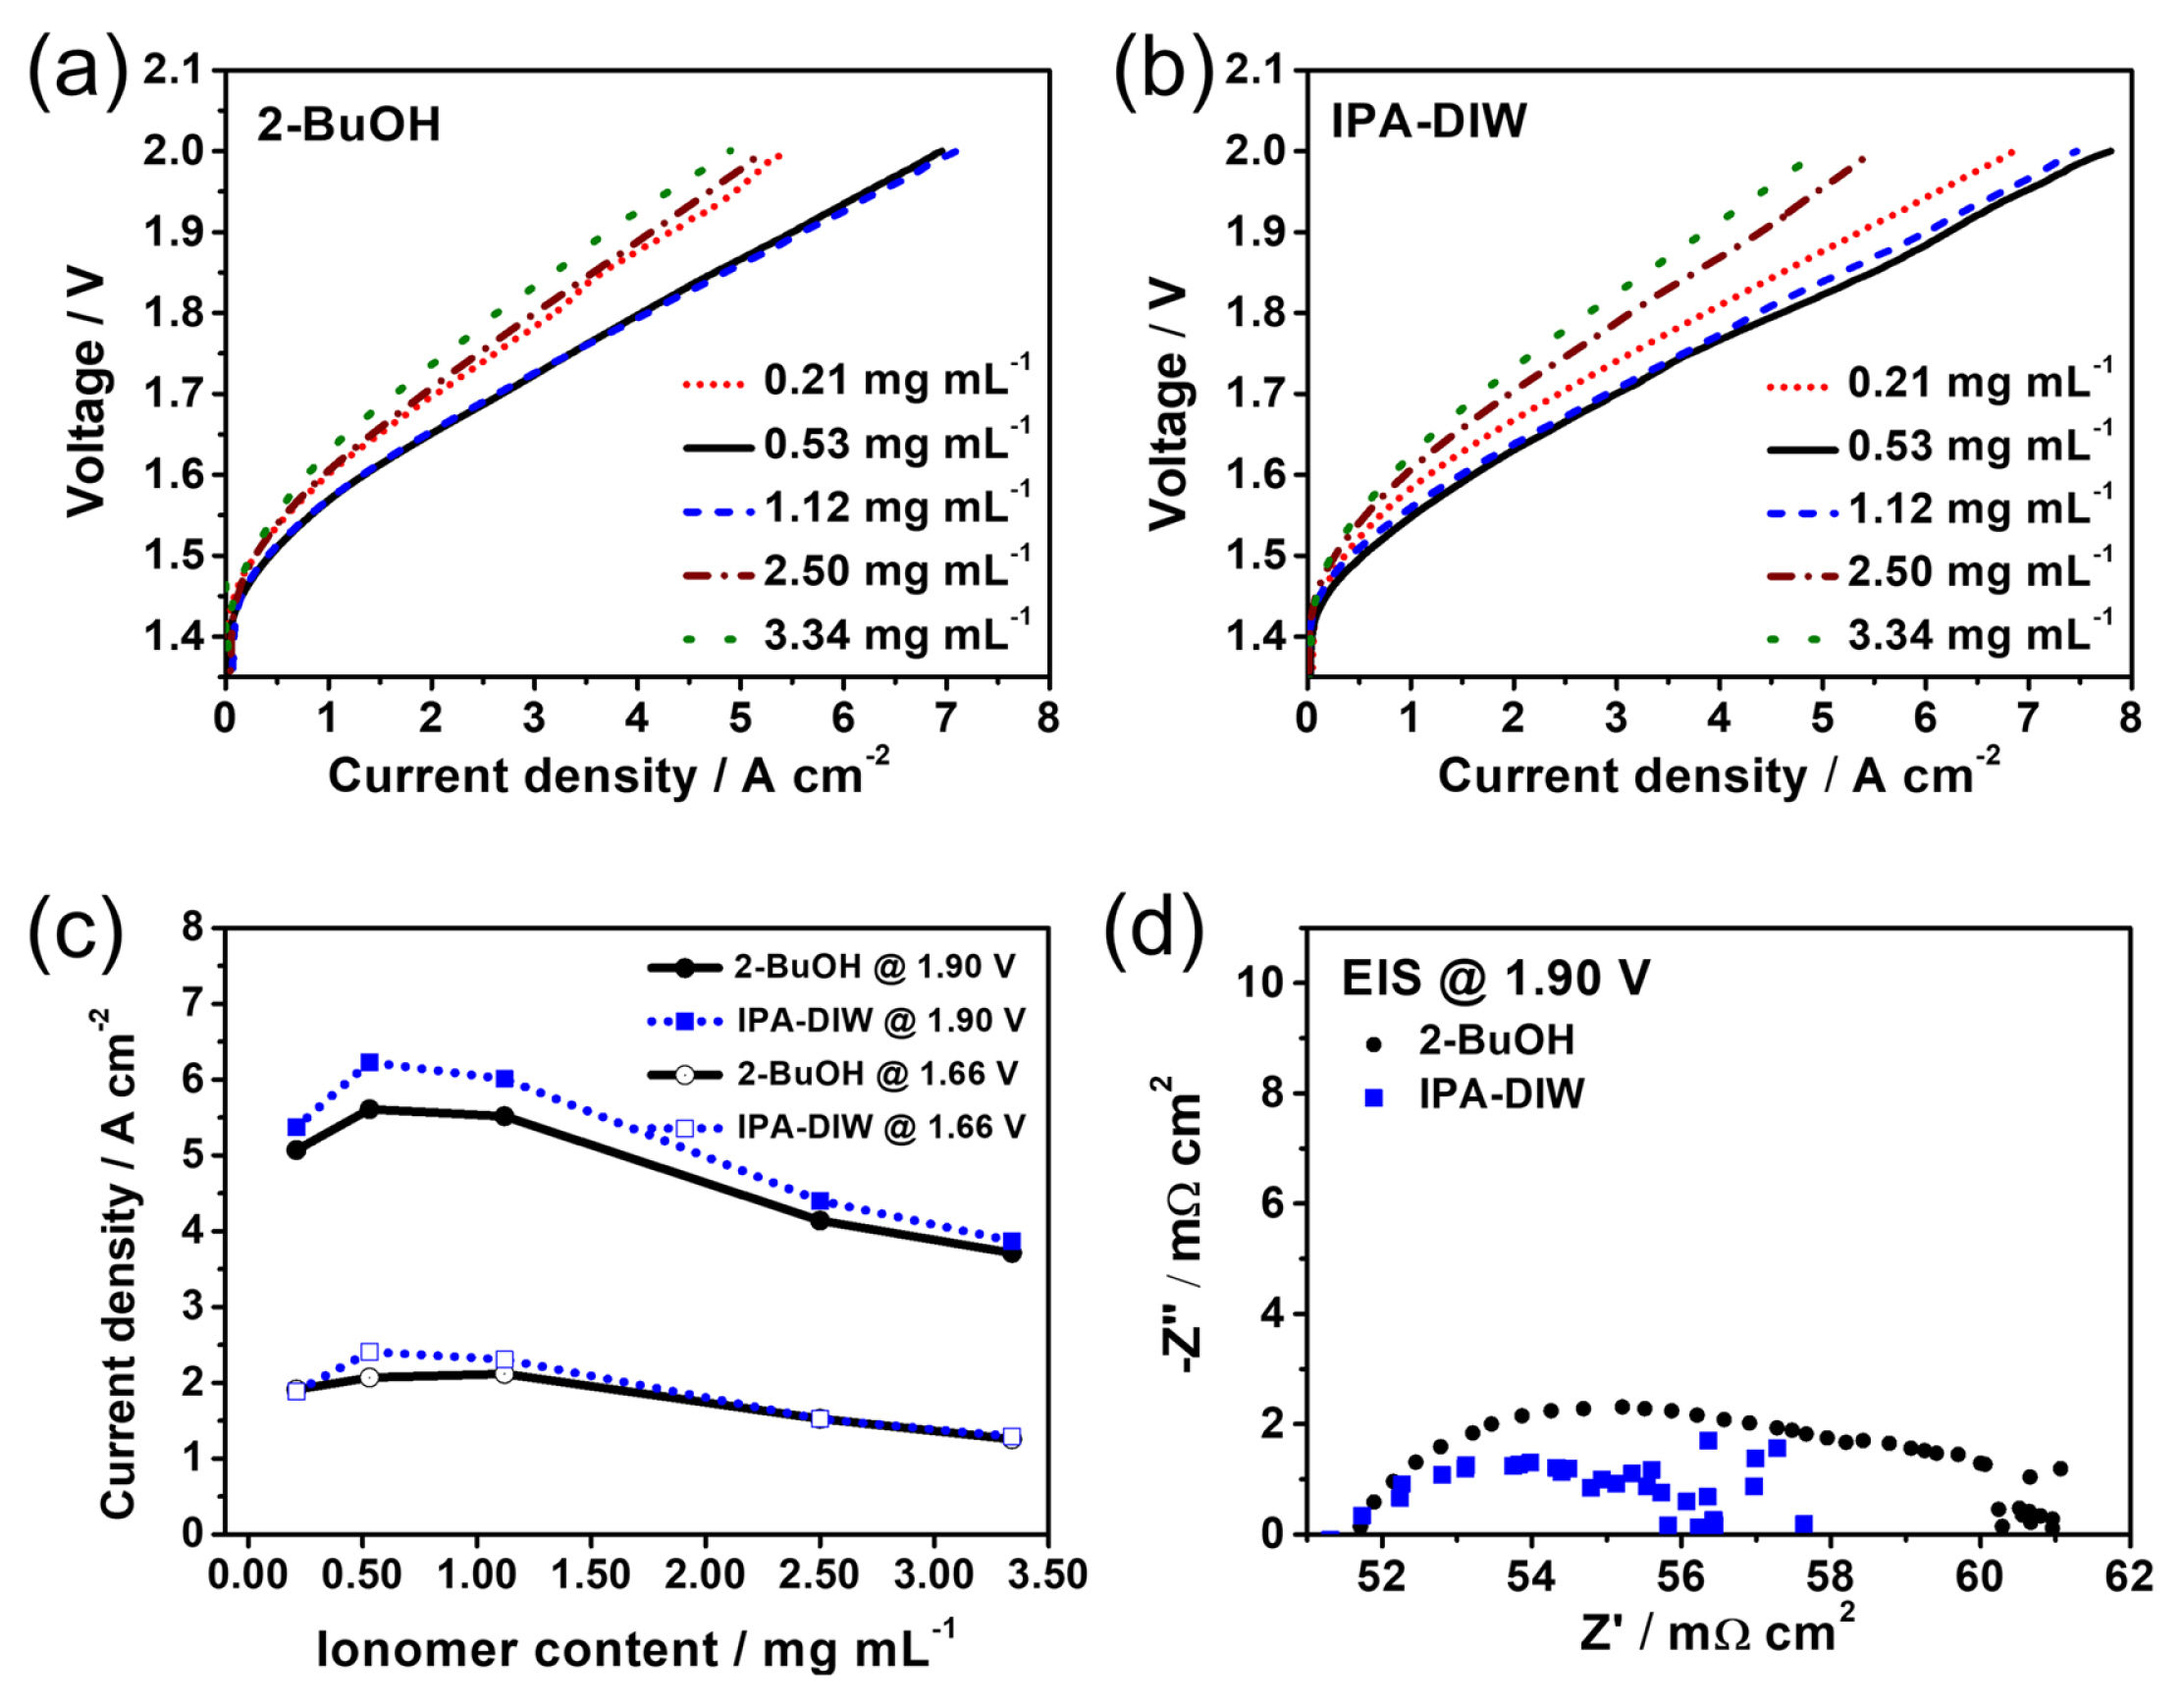
Fig. 4a and 4b present the PEMWE performance of the systems fabricated with the ultrasonic spray coating using catalyst inks containing various ionomer contents. The highest PEMWE performance was observed at 0.53 mg mLã1 ionomer content in the ink for both the 2-BuOH and IPA-DIW cases, which is comparable to that of the previously reported n-propanol-DIW solvent case [12] As shown in Fig. 4c, the electrolysis cell performance decreased as the ionomer content increased beyond 2.50 mg mLã1 because of the blockage of the active catalytic sites by the excess ionomer [16]. The current density decreased more drastically at higher voltages, implying that the decrease in the electrical conductivity and mass transport due to the overload of the ionomer can affect the cell performance more severely than the insufficient ionic conductivity at a relatively low ionomer content. At a low applied voltage (1.66 V), where the effects of the reaction kinetics and active surface area are more dominant compared to those at high cell voltages, the performances of the electrolysis cells were comparable for the two ink cases. As shown in Fig. 4d, the charge transfer resistance for the 2-BuOH case was slightly larger than that of the IPA-DIW case, consistent with the performance results presented in Fig. 4c.
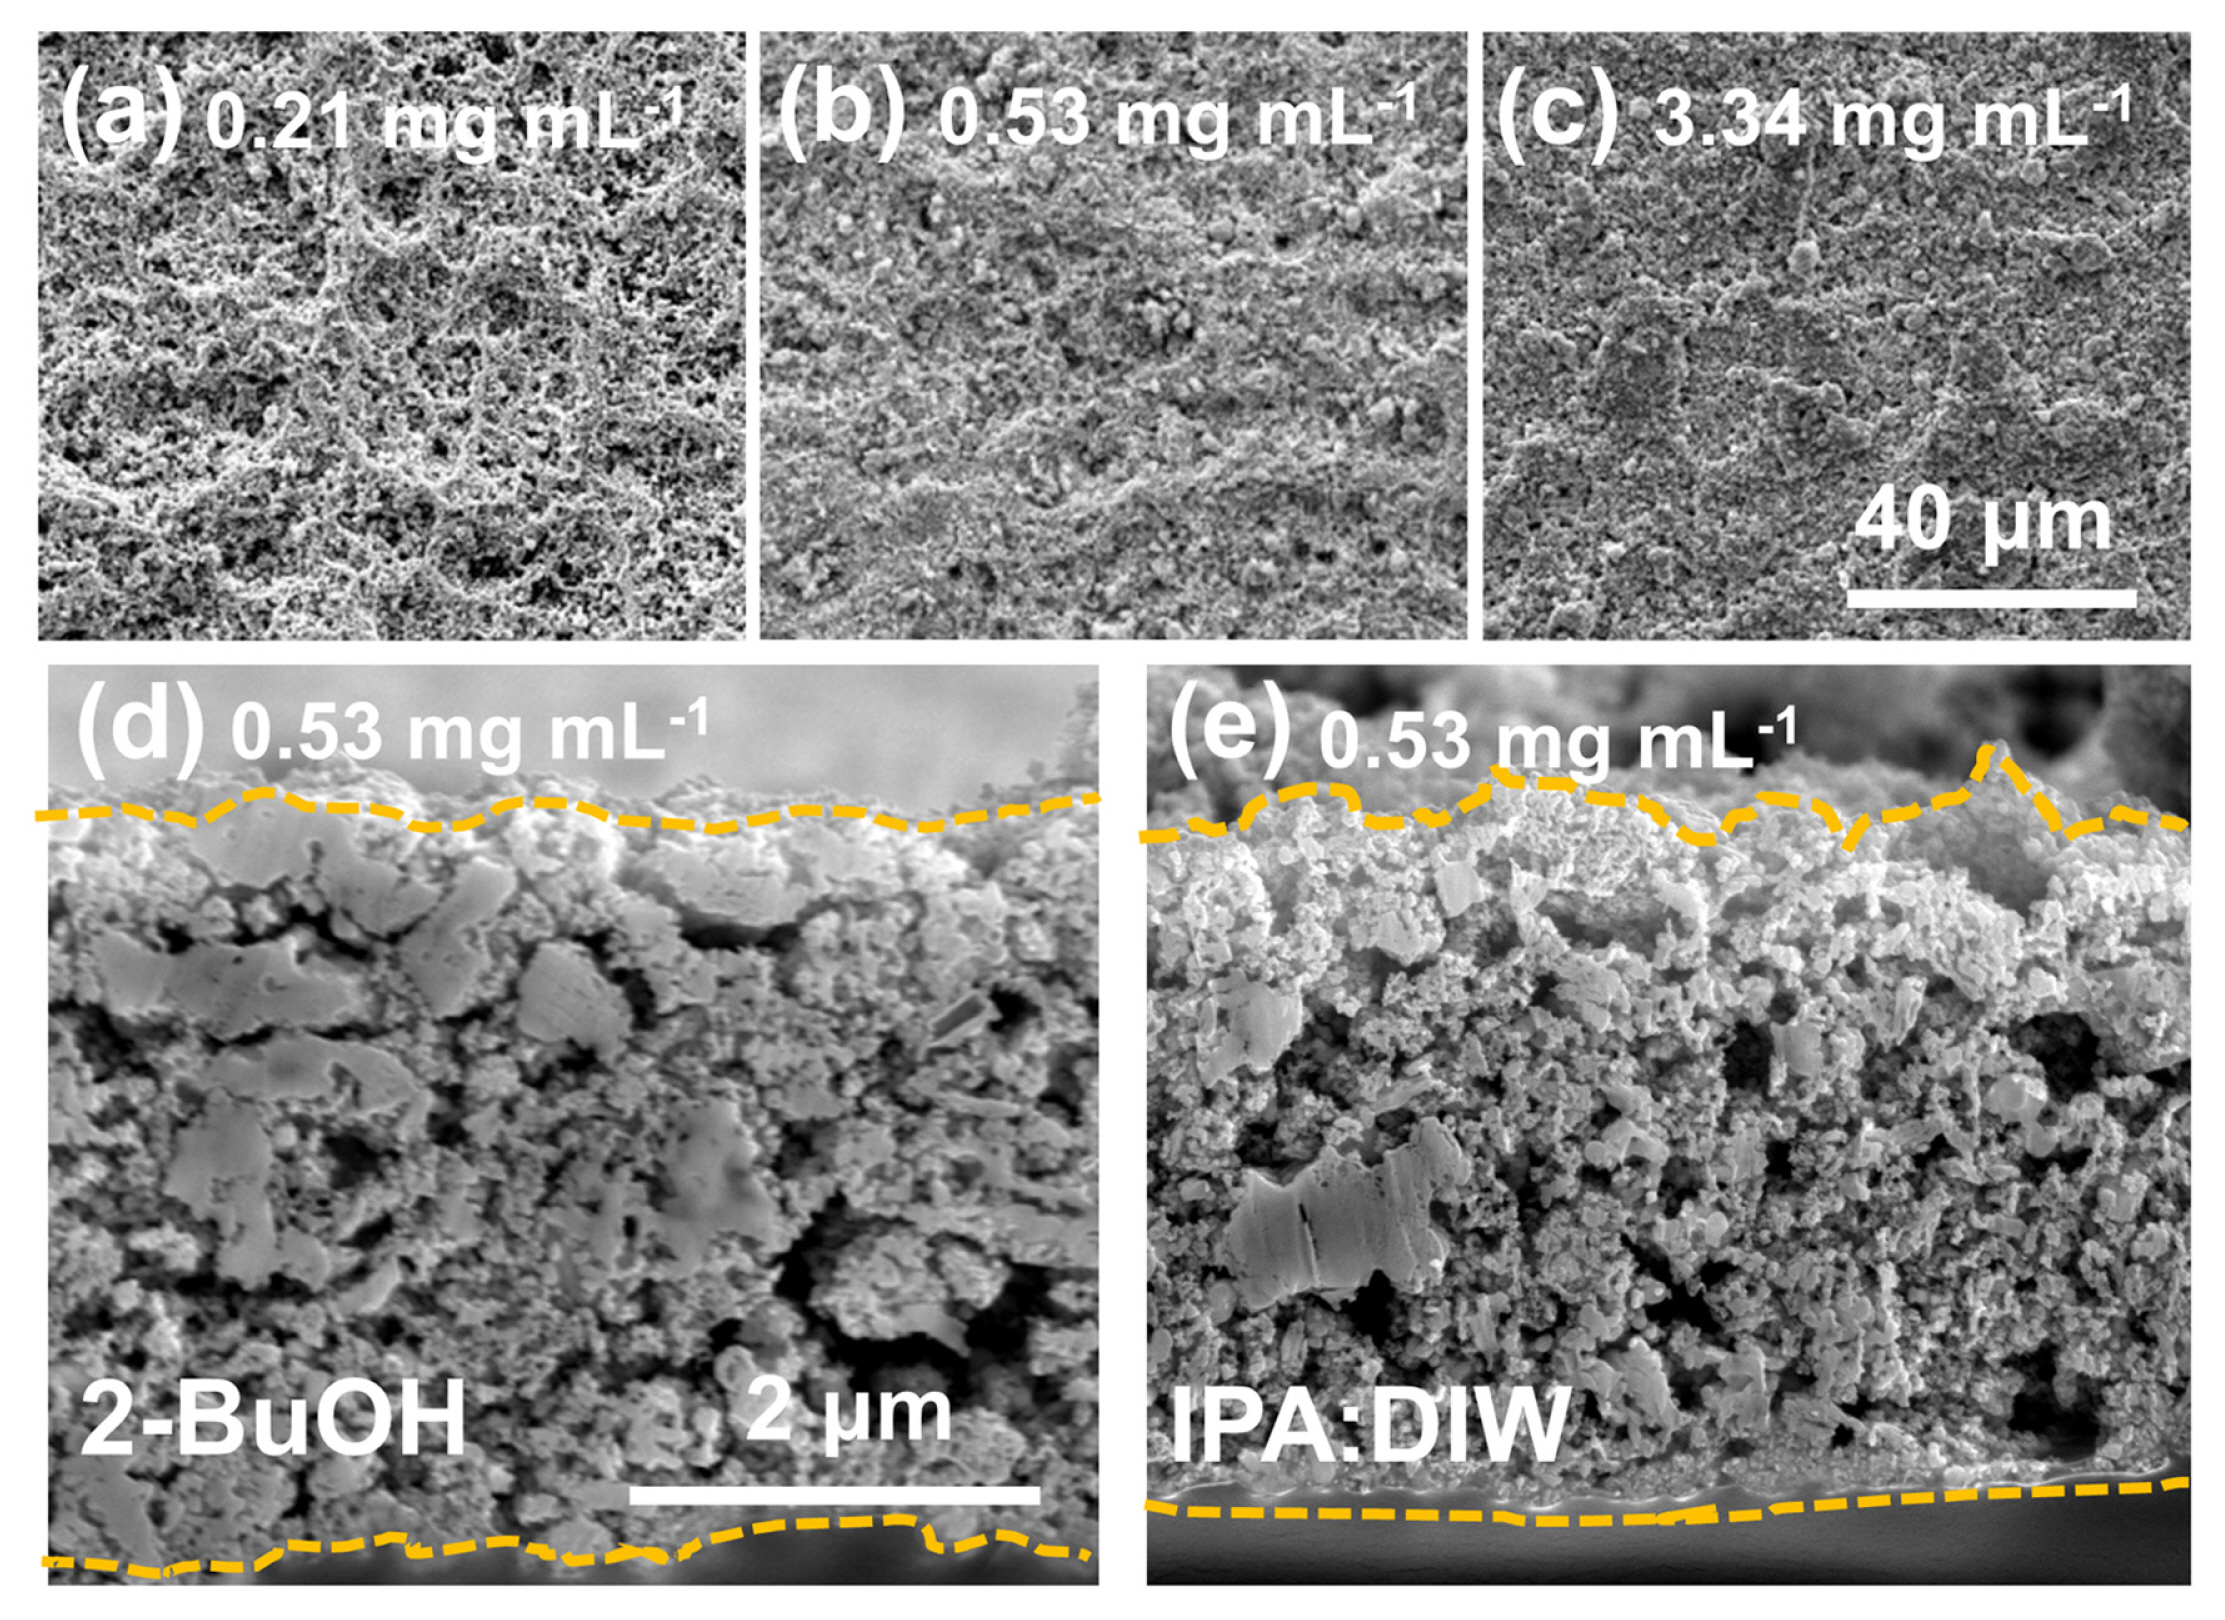
Fig. 5 shows the surface and cross-sectional SEM images of the IrO2 catalyst layer prepared using the 2-BuOH ink. As expected, the film fabricated with a low ionomer content exhibited a more porous and cracked surface (Fig. 5aãc). It also showed that the thicknesses of the catalyst layers coated from 2-BuOH and IPA-DIW were almost the same (Fig. 5d,e), which is consistent with the controlled loading amounts of IrO2 and ionomer in 2-BuOH and IPA-DIW. However, the catalyst layer coated from 2-BuOH had more agglomerated and coarse particles compared to IPA-DIW, which might increase the heterogeneity of the microstructure [45].
3.4 Effect of drying temperature for 2-BuOH and IPA-DIW inks
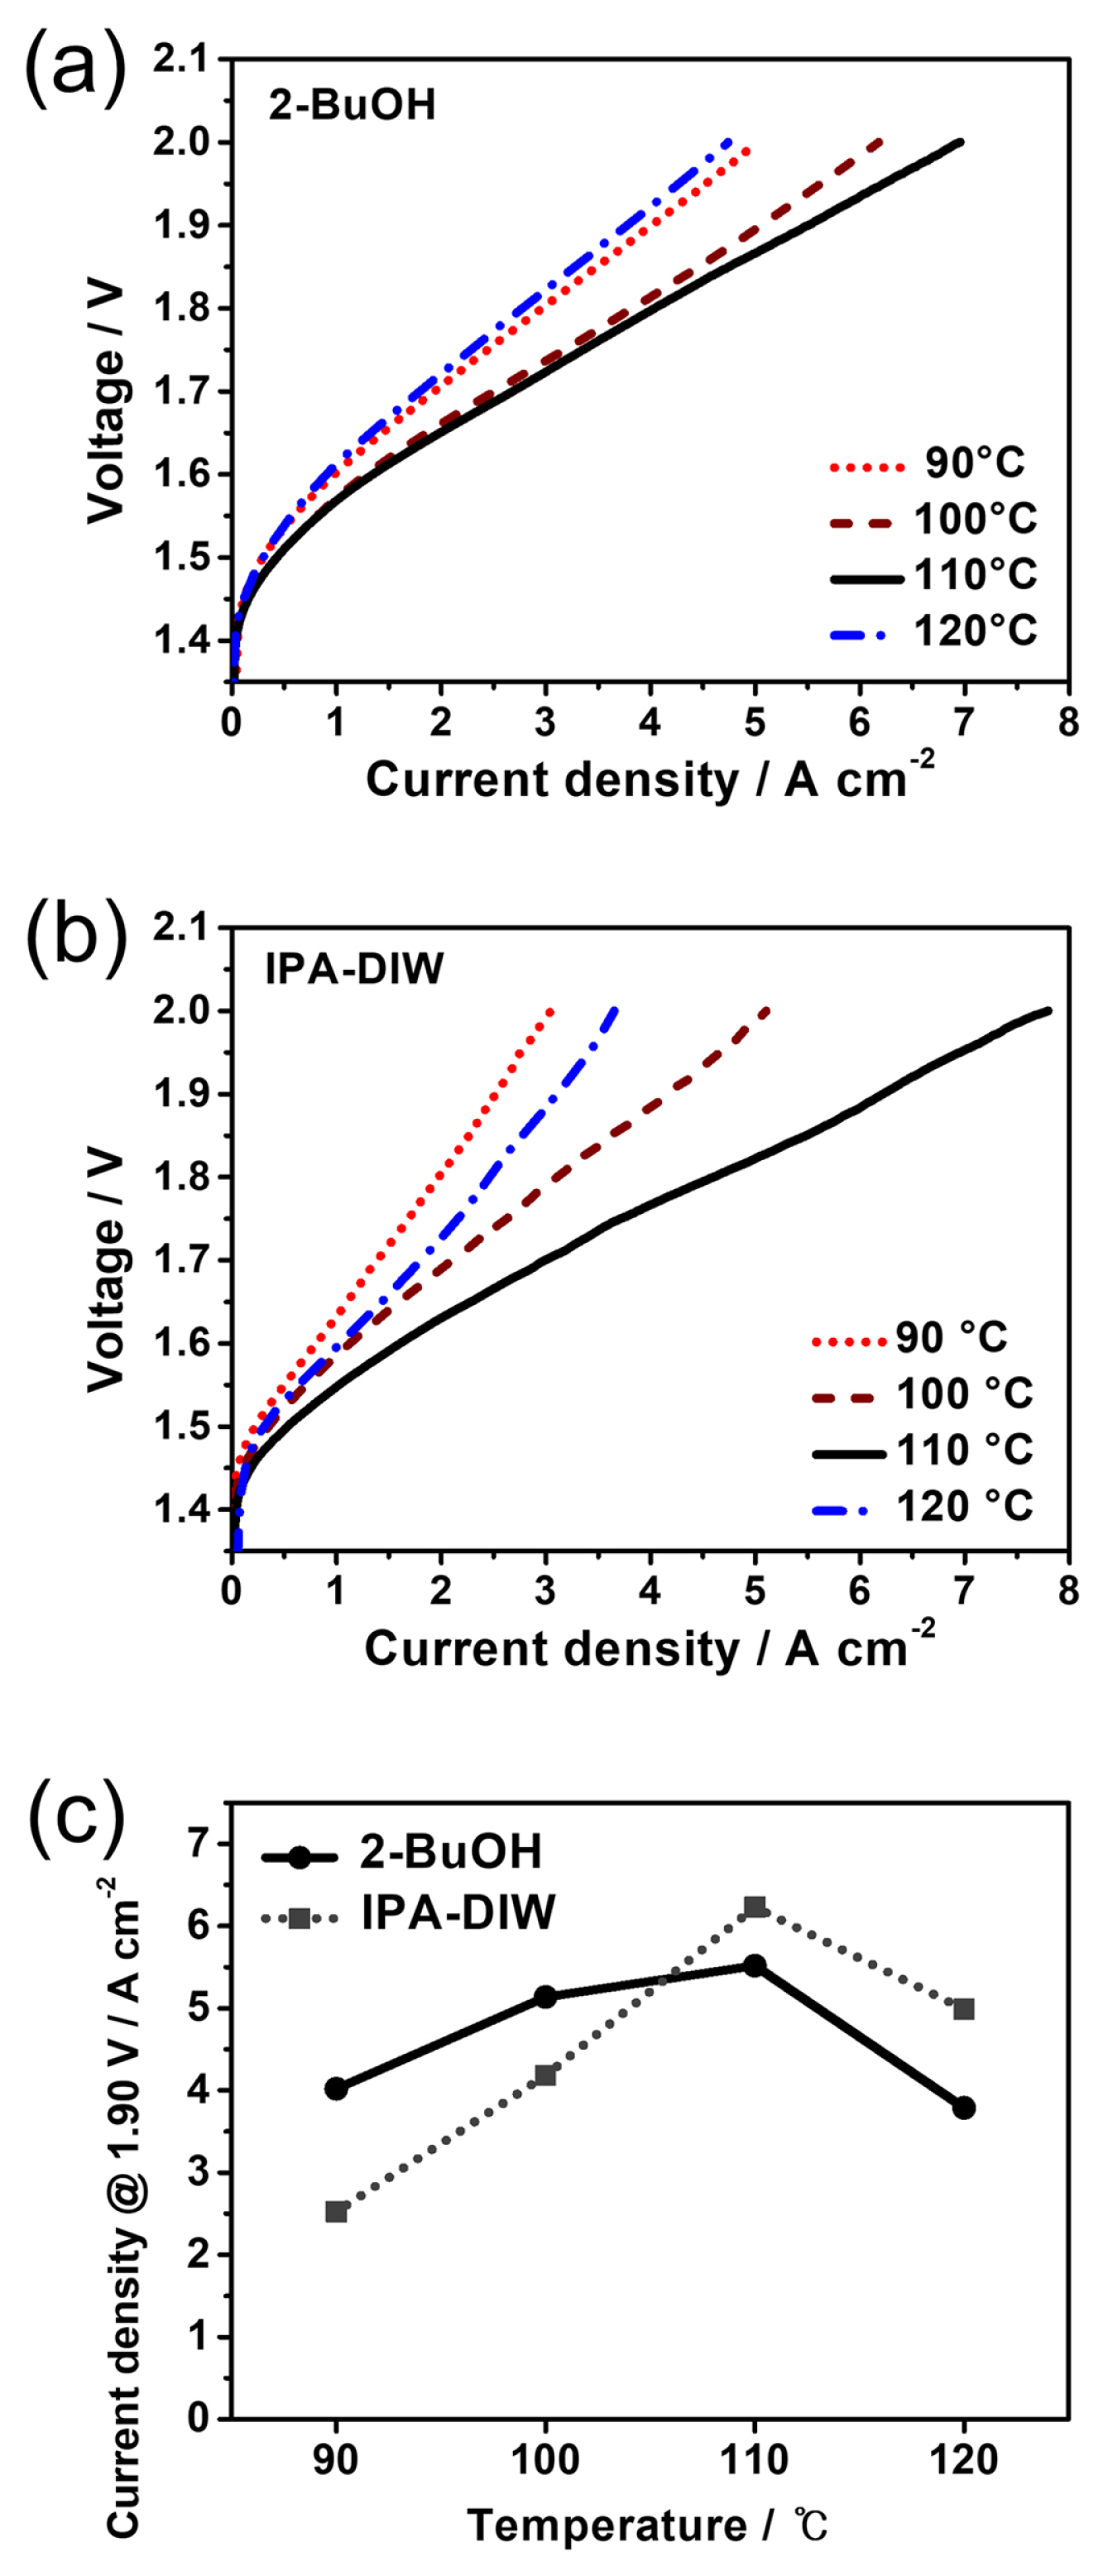
The effect of the ink drying temperature on the single-cell performance was investigated by analyzing the polarization curves (Fig. 6a,b). Specifically, the current density at 1.90 V from the polarization curve was plotted against the drying temperature (Fig. 6c). For both the 2-BuOH (Fig. 6a) and IPA-DIW (Fig. 6b) cases, the PEMWE performance increased with the drying temperature and reached a maximum at 110ô¯C. Rapid solvent evaporation using a high drying temperature would be beneficial for obtaining a more uniform microstructure as it limits ionomer migration [46] and prevents uneven swelling of the Nafion membrane [8]. However, the PEMWE performance of the anode dried at 120ô¯C was lower than that of the anode dried at 110ô¯C possibly because of the deformation of the membrane annealed near its Tg (~120ô¯C) and reduced rehydration [47]. The effect of drying temperature was less drastic for 2-BuOH compared to IPW-DIW, which might be related to the difference in the boiling temperatures of 2-BuOH (99.5ô¯C) and IPA-DIW (80.4ô¯C). These characteristics of 2-BuOH can be beneficial for the large-scale processes with temperature variations.
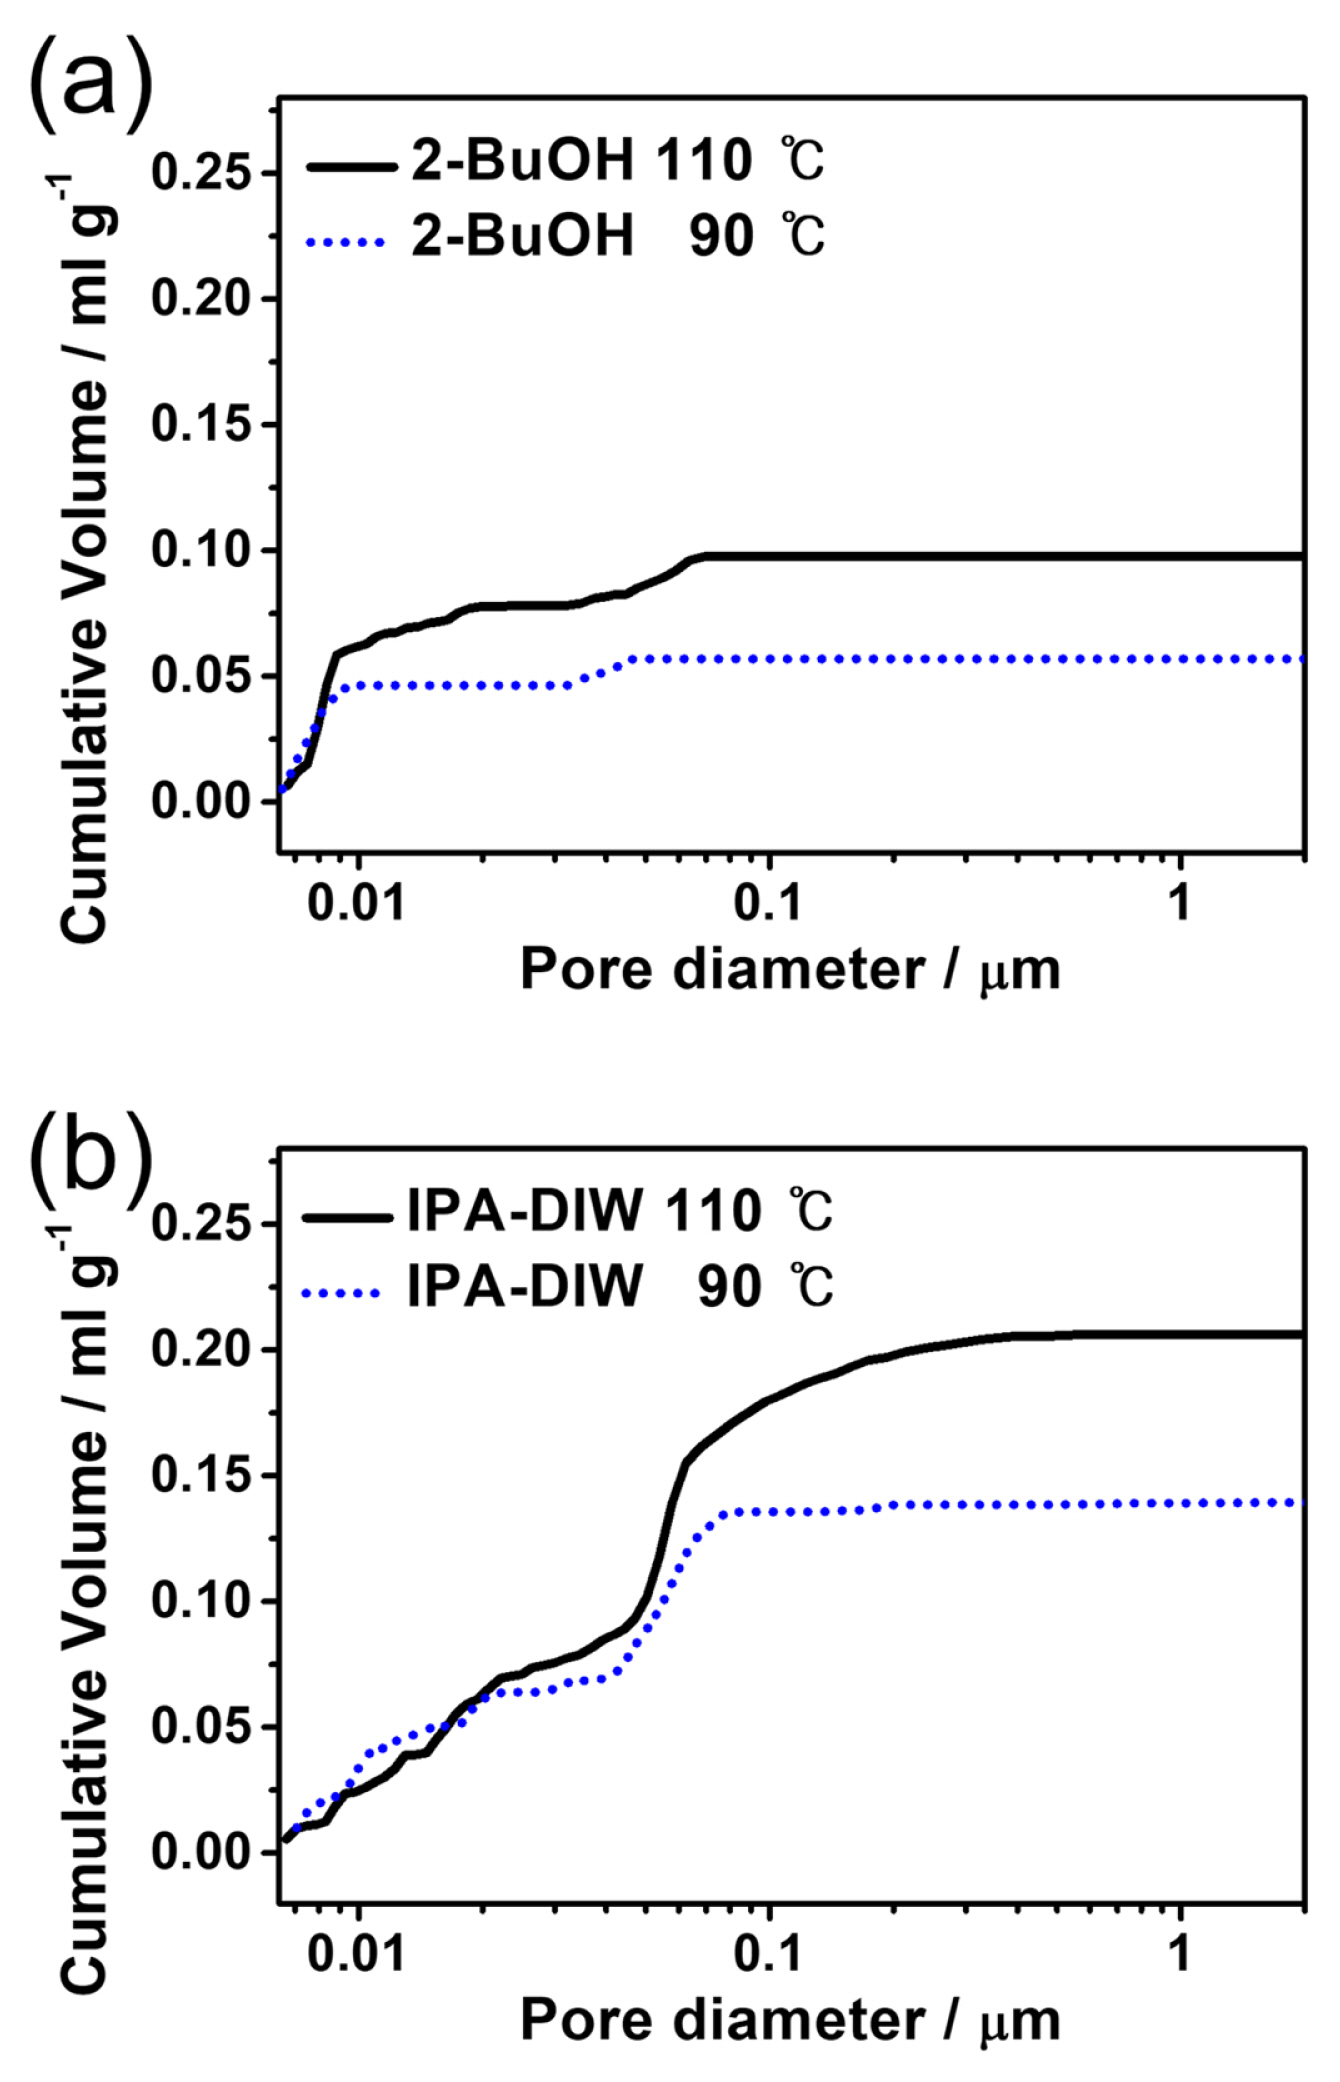
Fig. 7a and 7b present the pore size and volume fraction of the catalyst layers prepared using the 2-BuOH and IPA-DIW inks with 0.53 mg mLã1 ionomer content, as evaluated by mercury porosimetry. At the same drying temperature, the total pore volume of the catalyst layer prepared from the 2-BuOH ink was half of that obtained from the IPA-DIW ink. This tendency might be because of the heterogeneity of the ionomer size in BuOH (Fig. 1b), as it might block the pore effectively. For both solvent cases, the total pore volume of the catalyst layer processed at 110ô¯C was higher than that of the layer processed at 90ô¯C, which could be the reason for the better performances of the electrolysis cells with the anodes dried at 110ô¯C. Notably, in the catalyst layer obtained from the 2-BuOH ink, pores smaller than 10 nm developed more intensely than in the IPA-DIW case. This result might be because the larger particles in 2-BuOH ink (250 nm at 0.53 mg mLã1 ionomer content, Fig. 2b) generated higher number of nanosized gaps between the agglomerated particles compared to the particles in IPA-DIW ink (140 nm).
3.5 ADT for evaluating the electrolysis cell durability
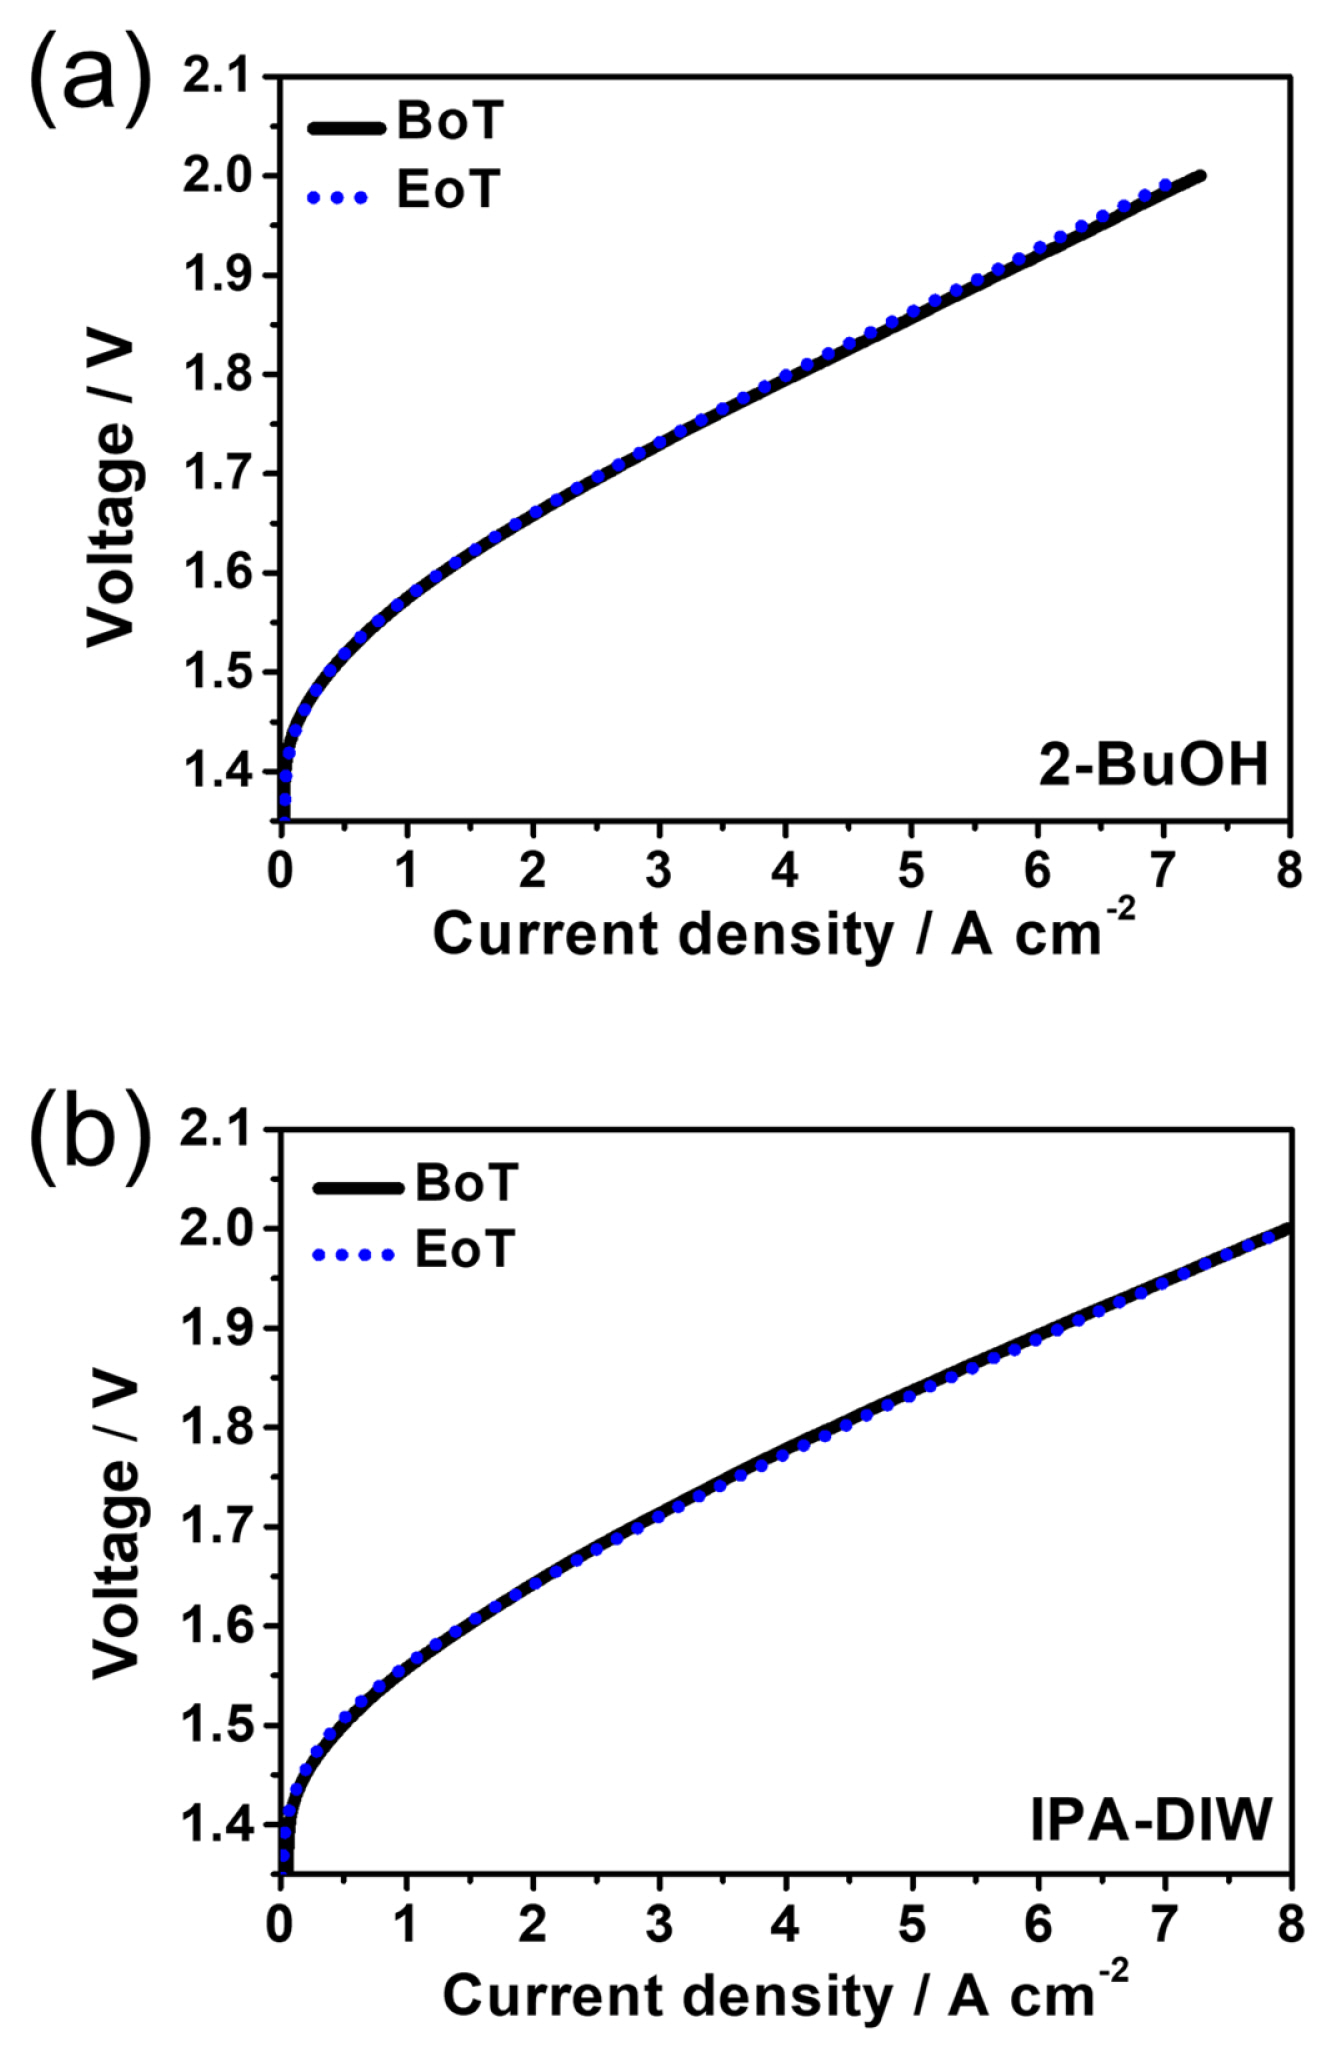
Fig. 8 shows the polarization curves before and after ADT for the MEAs fabricated using 2-BuOH and IPA-DIW inks. After ADT, where triangular voltage scans between 1.60 and 1.90 V were repeated 8000 times, the voltage change at 5.0 A cmã2 was less than 0.5%, indicating that the PEMWE performance was stably maintained under harsh conditions for both 2-BuOH and IPA-DIW solvent.
4. Conclusions
In summary, this study presented pure 2-BuOH as a substitute solvent of spraying ink containing IrO2ãionomer colloids for the fabrication of PEMWE anodes. In the catalyst ink with 2-BuOH, the IrO2ãionomer agglomerate size was twice as large as that in the IPA-DIW ink at 0.53 mg mLã1 ionomer content, and the inks with both the solvents presented a stable dispersion of the colloids with a öÑ-potential of approximately ã40 mV at ionomer contents of 0.21ã3.34 mg mLã1. The electrolysis cell fabricated using the 2-BuOH ink exhibited a current density of 5.7 A cmã2 at 1.90 V, which is ~92% of that of the electrolysis cell fabricated using the IPA-DIW-based ink. This study demonstrates that pure 2-BuOH is a suitable solvent for spray coating the catalyst layer in the manufacturing of PEMWE systems.