Portable Amperometric Glucose Detection based on NiS/CuS Nanorods Integrated with a Smartphone Device
Article information
Abstract
Glucose detection is particularly important for clinical diagnosis and personal prevention and control. Herein, the smartphone-based amperometric glucose sensors were constructed using the NiS/CuS nanorods (NRs) as sensing electrodes. The NiS/CuS NRs were prepared through a facile hydrothermal process accompanied by the subsequent vulcanization treatment. The morphological and structural properties of NiS/CuS NRs were characterized with SEM, EDS, XRD, and XPS. Electrochemical measurements including cyclic voltammetry, chronoamperometry, and electrochemical impedance spectroscopy display that NiS/CuS NRs can act as highly efficient electrocatalyst for glucose detection. The NiS/CuS NRs electrodes present a wide detection range of 1–8000 μM for glucose sensing with the sensitivity of 956.38 μA·mM−1·cm−2. The detection limit was 0.35 μM (S/N=3). When employed in smartphone-based glucose sensing device, they also display a high sensitivity of 738.09 μA·mM−1·cm−2 and low detection limit of 1.67 μM. Moreover, the smartphone-based glucose sensing device also presents favorable feasibility in determination of glucose in serum samples with the recoveries ranging between 99.5 and 105.8%. The results may provide a promising viewpoint to design other new portable glucose sensors.
1. Introduction
Diabetes is one of the major diseases that threaten human life and health. It was reported that there were about 536 million diagnosed diabetic patients in the world in 2021, and this number will increase to 783 million in 2045 [1]. Although there is no effective way to cure diabetes, continuously monitoring blood glucose level has been proved can effectively prevent complications for people with diabetes [2,3]. Therefore, accurate, efficient and rapid blood glucose detection is particularly important for clinical diagnosis and personal prevention and control. In addition, glucose detection is also in great demand in the fields of ecology, food and sustainable energy. Although various technologies including chromatography [4], colorimetry [5], and Raman spectrometry [6] have been developed for glucose detection, the electrochemical method is considered to be one of the most feasible methods due to its high sensitivity, fast response, low cost and easy operation. There are generally two kinds of electrodes used in glucose sensing, namely the commercially available enzymatic electrodes and the developing non-enzymatic electrodes. Although enzymatic electrodes present preferrable selectivity and high sensitivity for glucose detection, they still can’t meet the needs of portability, stability and simple operation due to the intrinsic defects of enzyme such as instability and poor reproducibility. Alternatively, non-enzymatic electrodes have been considered as promising candidates for glucose sensing as they can overcome these disadvantages by directly oxidizing glucose with electrode catalysts.
As the electrode catalysts play a decisive role in glucose sensing performance, various materials have been employed to construct nonenzymatic glucose sensors. As reported noble metals such as Pt [7], Au [8], and Pd [9] display much higher activity for glucose oxidation. However, their further applications are limited by their rarity and high price. Thus, non-noble transition metal oxides attracted more attentions in glucose sensing due to their high activity, good stability, and low cost. For instance, nano-flower-shaped Mn-doped NiO grown on carbon fiber cloth displayed excellent electro-oxidative capabilities in terms of sensitivity and selectivity in glucose sensing [10]. C-doped Co3O4 nanoparticles presented efficient enzyme-mimicking and glucose sensor properties [11]. Due to the poor intrinsic conductivity of transition metal oxides, their catalytic performance is seriously affected. Various nanosized morphologies have been designed to improve their electrocatalytic activities, such as nanotubes [12], nanorods [13], nanosheets [14], and nanowires [15] all presented enhanced electrochemical performance for glucose oxidation. Along with this combining two or more active component is also employed to improve their catalytic performance. For example, NiO-Co3O4/rGO based nanohybrid exhibited promising results for glucose detection [16]. NiO nano layers decorated by MoS2 nanostructures demonstrated enhanced electrochemical performance with dual mode detection of glucose molecule [17]. The size-tunable CuO/NiO hollow hetero-structured nanofibers also exhibited superior electrocatalytic capability for glucose oxidation [18]. However, the catalytic activity of transition metal oxides still needs further improved due to their poor electrical conductivity and charge transfer capabilities.
Recently, transition metal sulfides have received more attention in electrocatalytic application as they have some unique advantages compared with their oxides. Due to the replace of O with S, transition metal sulfides have more flexible structures with an elongation of chemical bonds, which results in outstanding electronic conductivity and abundant redox chemical properties and eventually benefits electron transport [19,20]. Such as bamboo-like Ni3S2@NCNT displayed facilitated electronic transfer and enhanced catalytic performances for glucose oxidation [21]. MOF-derived MoS2@Co3S4 nanoparticles modified with Ag also presented preferable performance for glucose detection [22]. As is known that one-dimensional nanorod structured materials have relatively high specific surface area, which can facilitate defined charge transport pathways and provide abundant reaction sites for redox reactions. Taking all these advantages into consideration, developing nanorod structured Ni/Cu bimetallic sulfides may result in the improved electron/ion transport and electrolyte diffusion in glucose oxidation reaction. To the best of our knowledge, integrating NiS/CuS nanorods with a smartphone device to construct portable amperometric sensors for glucose detection has not been reported yet.
Herein, we present the development of the smartphone-based amperometric sensors integrated with the NiS/CuS nanorods (NRs) electrodes for sensitive glucose detection. The NiS/CuS NRs were prepared through a facile hydrothermal process accompanied by the subsequent vulcanization treatment. Scheme 1 shows the schematic illustration of the preparation and application of NiS/CuS NRs for smartphone-based glucose sensing. NiS/CuS NRs present highly improved sensing performance compared with their oxide counterparts.
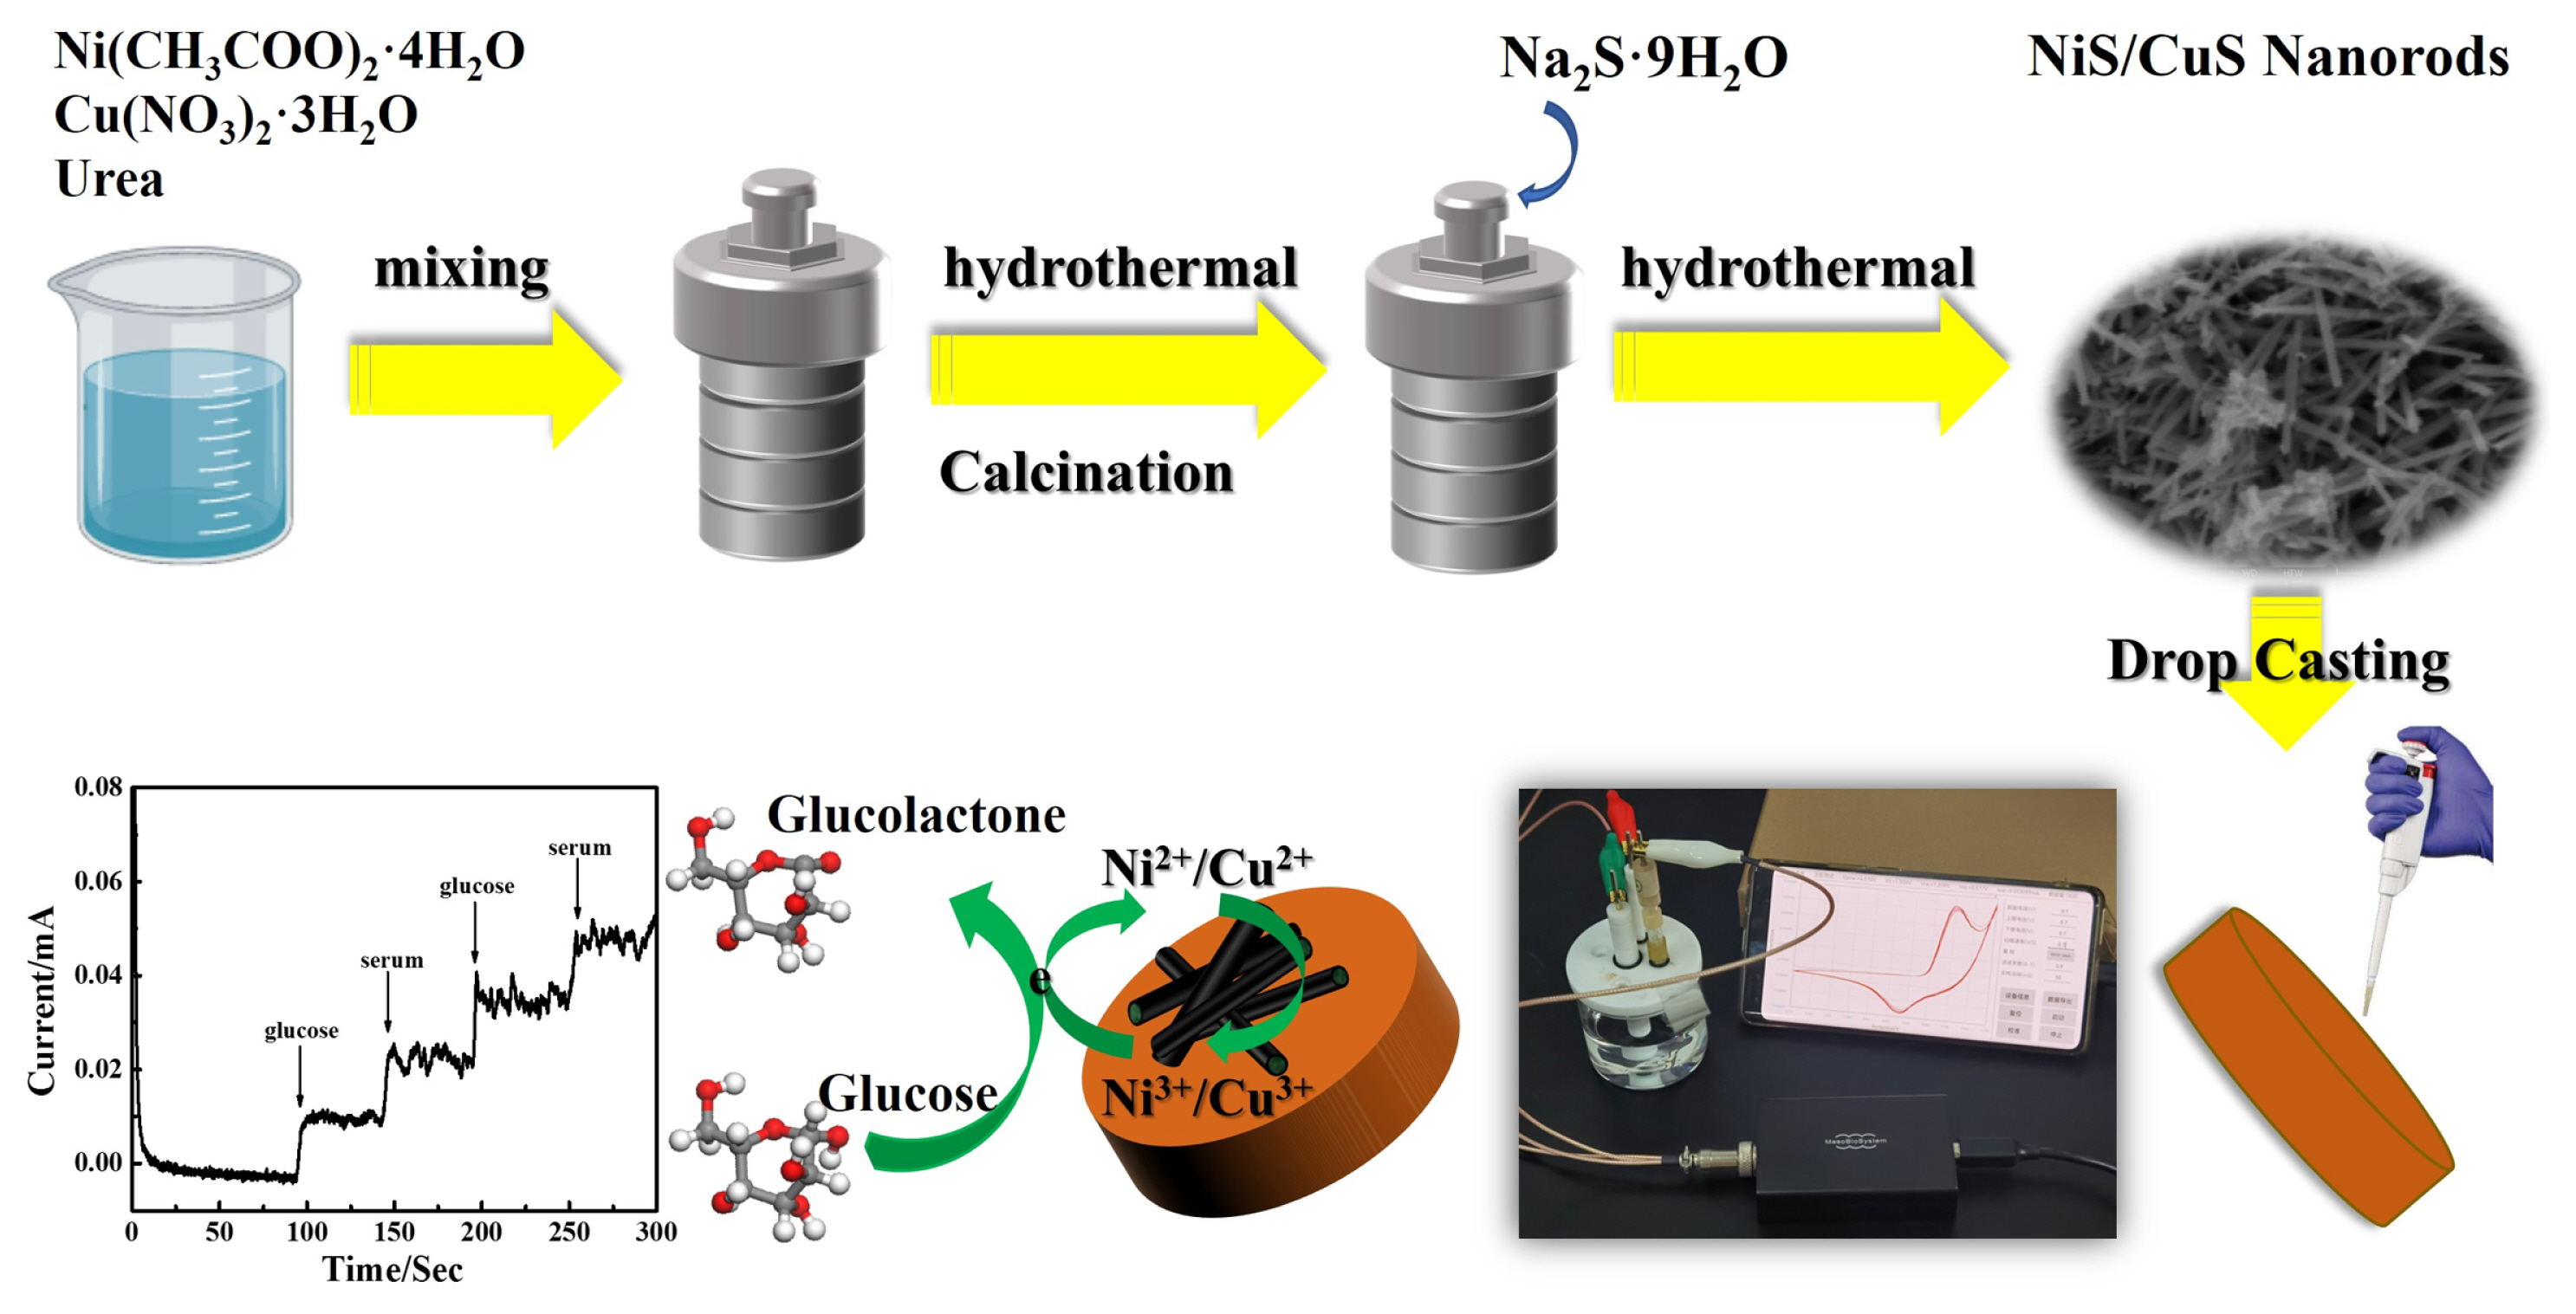
Schematic illustration of the preparation and application of NiS/CuS NRs for smartphone-based glucose sensing.
2. Experimental
2.1 Preparation of NiS/CuS nanorods
Typically, NiO/CuO NRs were firstly prepared through the following process: 0.248 g Ni(CH3COO)2·4H2O and 0.242 g Cu(NO3)2·3H2O were dissolved into 30 ml deionized water, and then 10 ml urea solution (containing 0.3 g urea) was slowly dropped into the above solution under magnetic stirring. After 30 min of stirring the mixed solution was transferred into an autoclave with the hydrothermal treatment performed at 160°C for 12 h. The precipitate was collected and washed several times with deionized water and ethanol, and then dried in an oven at 60°C for 6 h. NiO/CuO NRs can be obtained by calcinating the samples in a tube furnace at 350°C for 2 h with a heating rate of 2°C·h−1. NiO/CuO NRs will be further transferred into NiS/CuS NRs through the following vulcanization process. 50 mg NiO/CuO NRs and 1.6 g Na2S·9H2O were firstly dispersed into 50 mL deionized water and then transferred into an autoclave. The mixture was hydrothermally treated at 160°C for 8 h and then collected and washed with water and ethanol. NiS/CuS NRs were finally achieved after drying at 60°C for 5 h.
2.2 Material characterization
Scanning electron microscope (Zeiss Sigma 300) was used to characterize the morphology of the materials. The energy dispersive spectrometer (Smart EDX) was employed to obtain energy dispersive spectroscopy (EDS) and element mapping results. The elemental composition and chemical valence were performed on X-Ray Photoelectron Spectroscopy (Thermo Scientific K-Alpha). X-ray diffractometer (XRD, Thermo ARL SCINTAG X'TRA) was carried out using CuKα radiation with 2θ ranging from 20° to 80°.
2.3 Preparation of NiS/CuS NRs modified glassy carbon electrodes
Prior to modification the glassy carbon electrode (GCE, φ=5 mm) was firstly treated by polishing it with Al2O3 powder (0.3 μm), then rinsed several times with deionized water and ultrasonicated in deionized water to remove the residual adhesive particles. Finally, the GCE was dried in air naturally. The modification process was carried out as following: Catalyst slurry was firstly prepared by mixing 8 mg NiS/CuS NRs, 10 μLNafion, and 8 mL ethanol under sonification for 10 min. Then 10 μL NiS/CuS NRs slurry was dropped onto the GCE. After being dried naturally in the air, NiS/CuS NRs modified GCE can be obtained by drying it at 60°C for 30 min. All catalyst slurry will be sonicated uniformly prior to use.
2.4 Electrochemical measurements
Electrochemical measurements including cyclic voltammetry (CV), amperometric I-t, and electrochemical impedance spectroscopy (EIS) were performed on the three-electrode system with counter and reference electrodes being platinum sheets (0.5 ×0.5 cm2) and saturated calomel electrode, respectively. Supporting electrolyte is 0.1 M NaOH and the working electrode is the NiS/CuS NRs modified GCE. EIS was performed on Zahner Zennium electrochemical workstation and other measurements were carried out on CHI630D workstation (Shanghai Chenhua Instrument Co. China). CVs were measured in potential range from 0.1 V to 0.6 V with constant scan rate (50 mV·s−1) or various scan rate from 5 mV·s−1 to 200 mV·s−1. The frequency range and amplitude used in EIS measurement is 0.01 Hz–100 kHz and 5 mV, respectively.
The electrochemical performance of smartphone-based glucose sensing devices was also performed in the same three-electrode system using the portable electrochemical workstation. As illustrated in Scheme 1, the ICHY portable electrochemical workstation (HY-1550A, Shenzhen Haoyang Technology Co., LTD) is connected to the smartphone (Huawei Mate40pro) with a data cable. The USB port of the data cable is connected to the workstation Type-C port to the smartphone, which is used for data transmission. The workstation is also powered by the smartphone through the data cable. The electrochemical tests can be performed through the APP operation (HY-1550A.V201210). The test results are ultimately measured and displayed on the smartphone with the android system.
3. Results and Discussion
The formation process of NiS/CuS NRs was illustrated in Scheme 1, which underwent the vulcanization process to transfer NiO/CuO NRs into NiS/CuS NRs. SEM was employed to identify the morphology and microstructure of the materials (Fig. 1). As shown in Fig. 1a, b, NiO/CuO NRs present a typical rod-like structure with a relatively high aspect ratio. After vulcanization, NiS/CuS NRs display similar rod-like structures only with diameter slightly increased with the aspect ratio of the nanorods ranging from 7:1 to 16:1 (Fig. 1d,e). EDS results of NiS/CuS NRs confirm the existence of Ni, Cu, and S elements in the materials (Fig. 1c). EDS element mapping images are presented in Fig. 1f, which further verifies the uniform distribution of Ni, Cu, and S elements and the Ni:Cu atomic ratio from EDS analysis is 26.01:23.18 (inset of Fig. 1c).
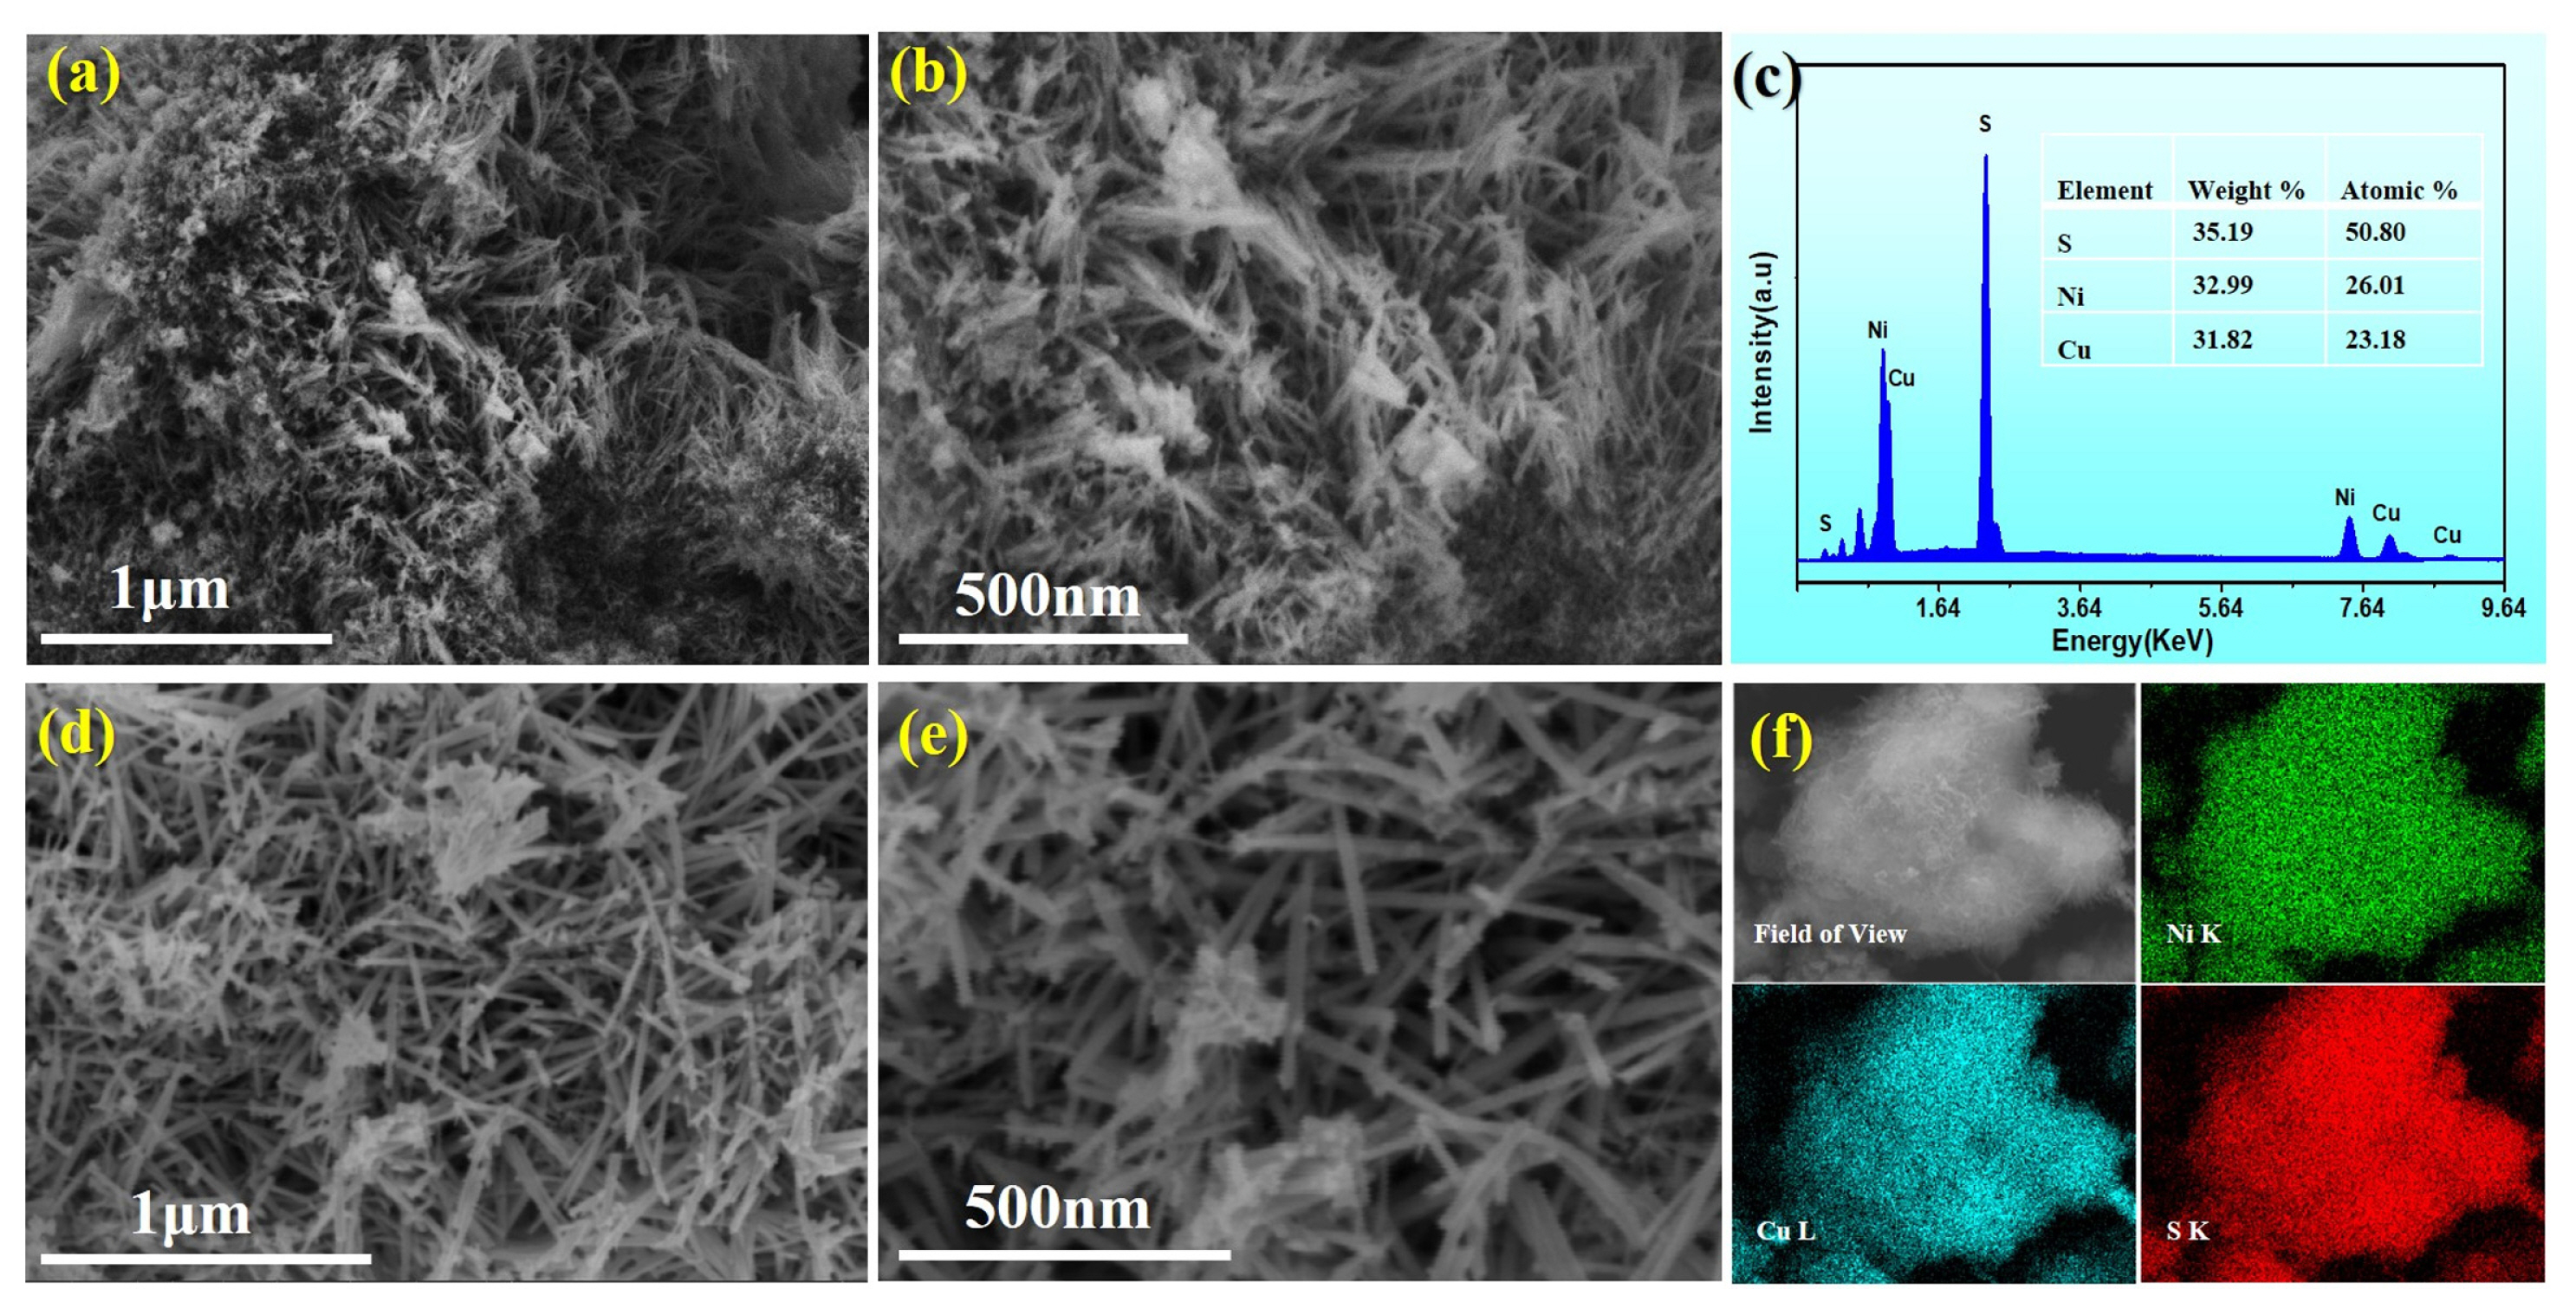
SEM images of (a,b) NiO/CuO NRs and (d,e) NiS/CuS NRs; (c) EDS pattern and (f) elemental mapping images of NiS/CuS NRs.
The phase structures of NiS/CuS NRs and NiO/CuO NRs were characterized by XRD as shown in Fig. 2. As labelled on the XRD pattern of NiO/CuO NRs, it displays typical mixed diffraction peaks of monoclinic phase CuO (JCPDS Card No.: 48-1548) and the fcc structured NiO (JCPDS Card No.: 71-1179). Apparently, the peaks of NiS/CuS NRs appear sharper after the hydrothermal vulcanization process, which may indicate that the crystallinity of the materials was slightly improved. The XRD pattern of the NiS/CuS NRs composites presents two crystal phases of cuprous sulfide and two phase of nickel sulfide. Cuprous sulfide was composed of Cubic phase Cu2S (JCPDS Card No.: 84-1770) and Tetragonal phase (JCPDS Card No.: 72-1071) of Cu2S. Moreover, nickel sulfide consists of Hexagonal phase of NiS (JCPDS Card No.: 77-1624) and Triclinic phase of Ni2S (JCPDS Card No.: 73-0574). The results suggest the formation of NiS/CuS NRs hybrids.
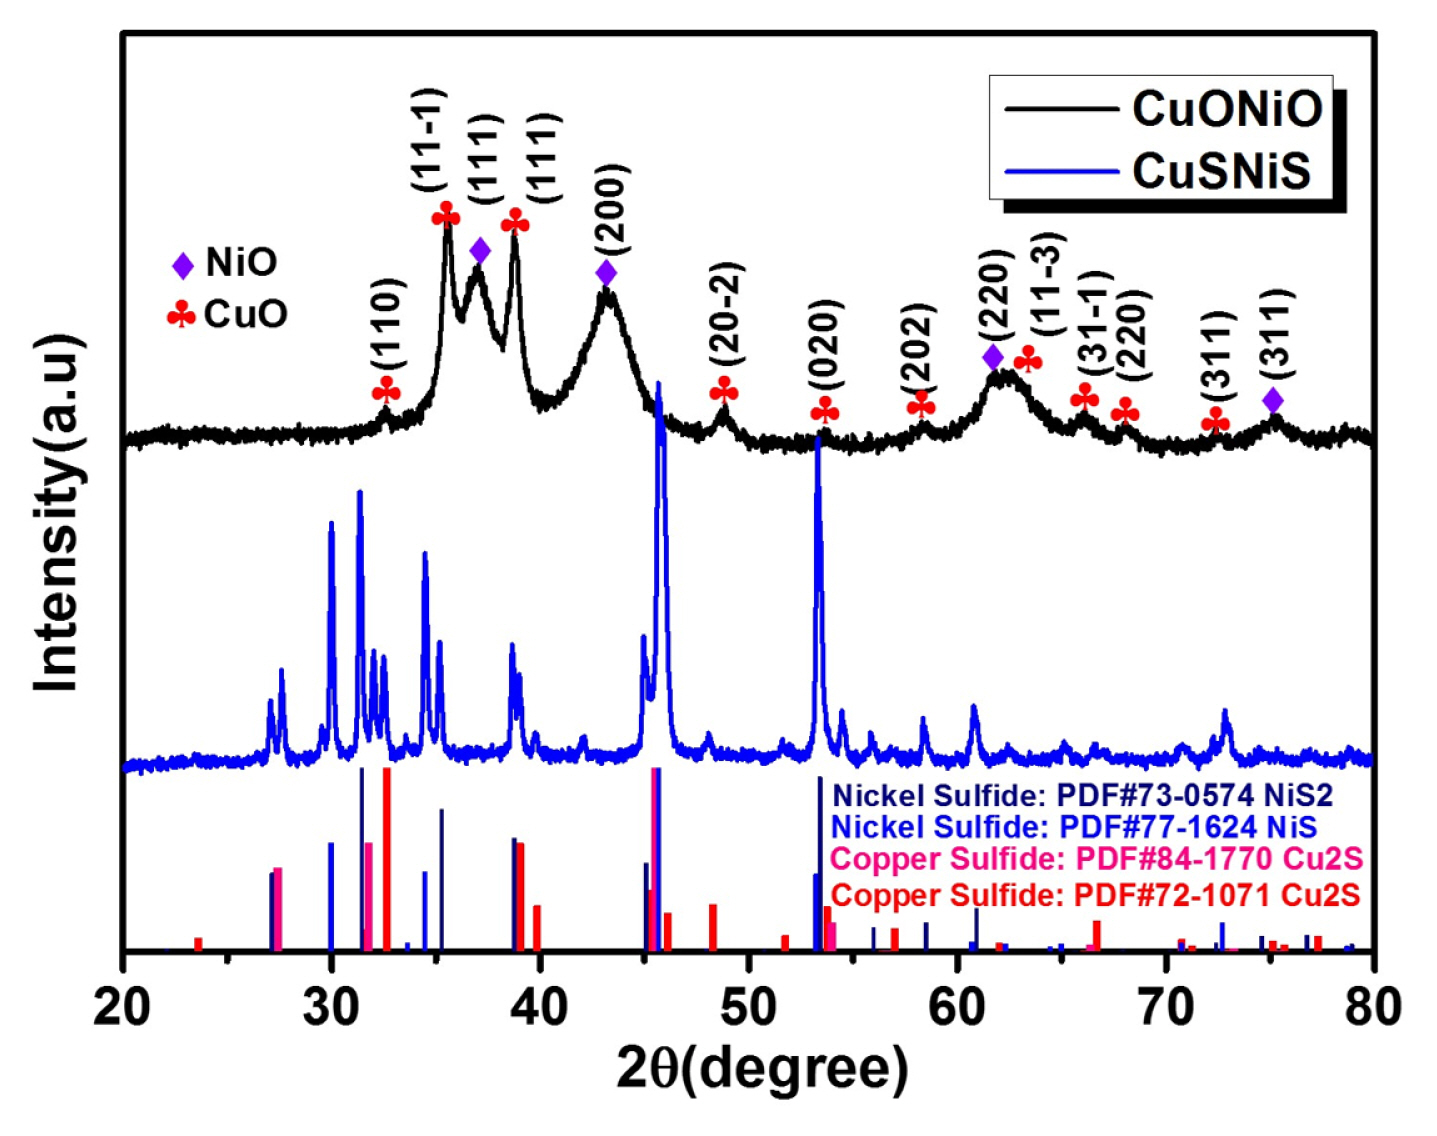
XRD patterns of NiS/CuS NRs and NiO/CuO NRs.
The composition and chemical states of NiS/CuS NRs were further verified by XPS. As showed in Fig. 3a, XPS full spectrum of NiS/CuS NRs confirms the existence of the elements of Ni, Cu, and S agreeing well with the EDS results. Fig. 3b presents the Ni 2p spectrum comprising two distinct peaks corresponding Ni 2p3/2 and Ni 2p1/2 and two satellite peaks. Ni 2p can be divided into the Ni2+ and Ni3+ (surface oxidation) with peaks at 852.6 eV and 870.0 eV corresponding to Ni2+ 2p3/2 and Ni2+ 2p1/2 and peaks at 855.2 eV and 872.9 eV related to Ni3+ 2p3/2 and Ni3+ 2p1/2 [23]. Two main peaks of Cu 2p3/2 and Cu 2p1/2 can be deconvoluted into two pair of Cu 2p peaks (Fig. 3c). The peaks at the binding energy of 931.5 and 951.5 eV correspond to the Cu+ 2p3/2 and Cu+ 2p1/2 and the other two peaks can be attributed to Cu2+ 2p3/2 (933.9 eV) and Cu2+ 2p1/2 (953.2 eV) [24,25]. S 2p spectrum (Fig. 3d) displays the existence of (S2)2− and S2− in NiS/CuS NRs. The peaks at 162.9 and 162.1 eV correspond to (S2)2− 2p1/2 and S2− 2p1/2, respectively. The other peaks (161.6 and 160.8 eV) are belonging to (S2)2− 2p3/2 and S2− 2p3/2 [23,26]. The results further verify the transfer of NiO/CuO NRs to NiS/CuS NRs.
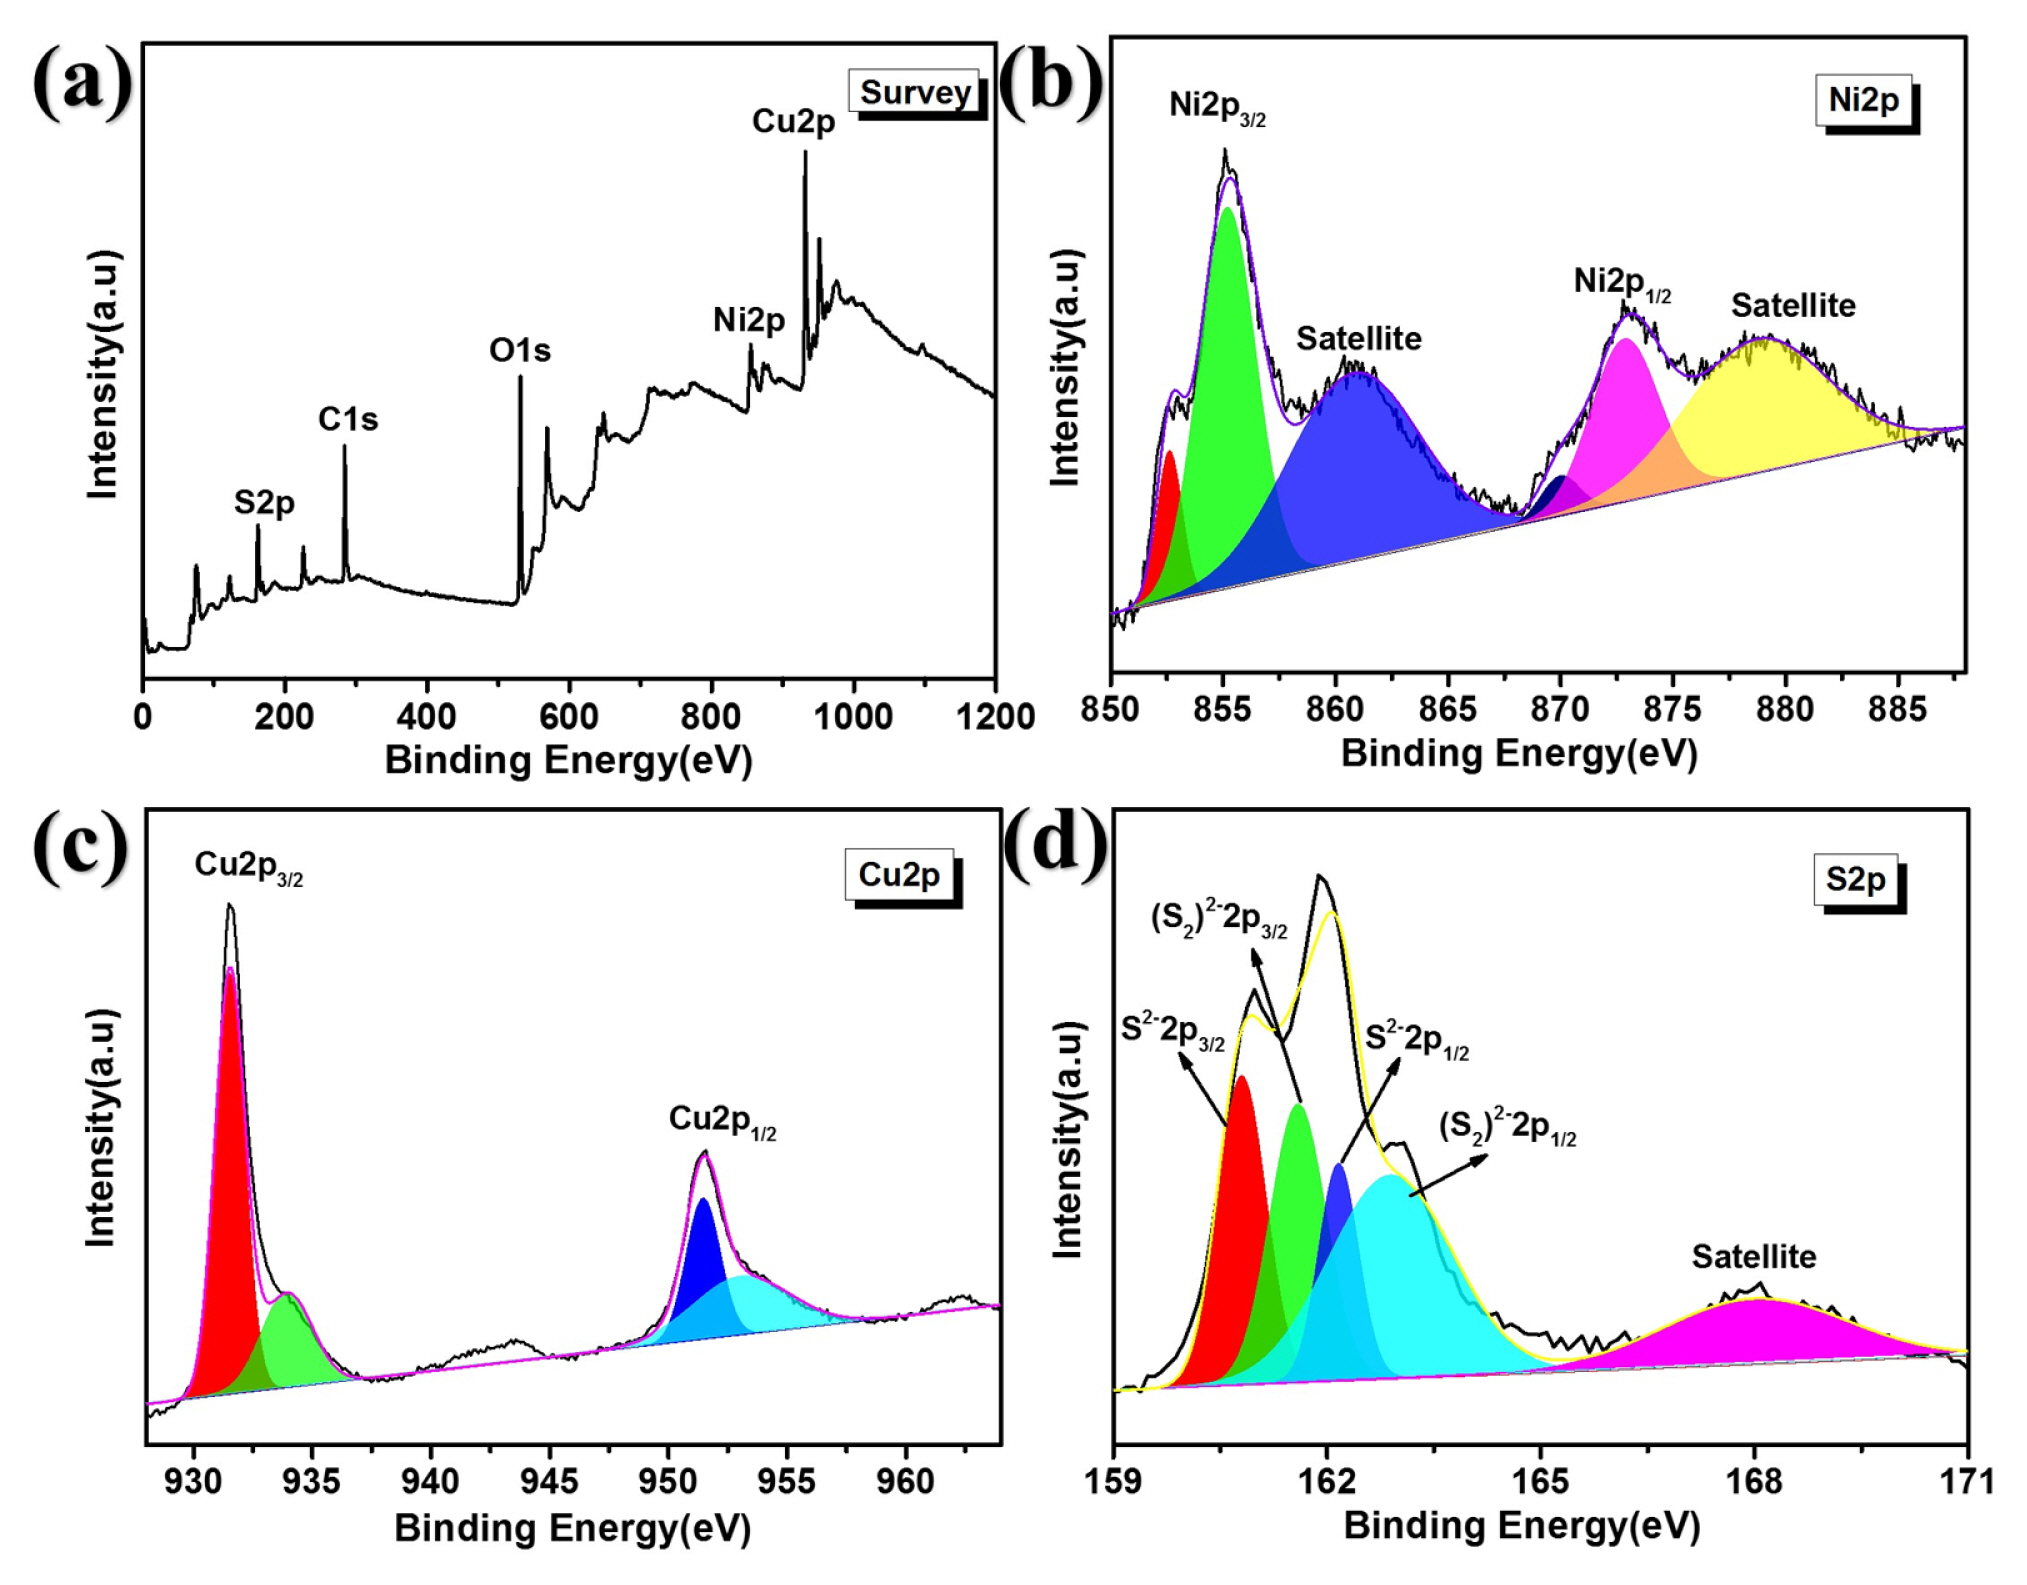
XPS spectra of NiS/CuS NRs: (a) full spectrum; (b) Ni 2p; (c) Cu 2p; (d) S 2p.
The electrochemical performance of NiS/CuS NRs was firstly evaluated by CVs. Fig. 4a presents the comparative CVs of NiS/CuS NRs and NiO/CuO NRs with scan rate of 50 mV·s−1 in 0.1 M NaOH with and without 0.6 mM glucose. Both NiS/CuS NRs and NiO/CuO NRs display distinct redox peaks in alkaline solution. Moreover, with the presence of 0.6 mM glucose both anodic currents increase significantly, suggesting the oxidation of glucose occurring on the electrodes. However, the oxidation current of NiS/CuS NRs is much higher than that of NiO/CuO NRs both in presence and absence of glucose, which indicate the better glucose sensing performance of NiS/CuS NRs. Therefore, CVs of NiS/CuS NRs was further measured in presence of different glucose to evaluate its sensing properties (Fig. 4b). Apparently, oxidation current of glucose on NiS/CuS NRs increases significantly with glucose increasing, suggesting they are promising electrodes catalysts for nonenzymatic glucose sensing.

(a) CVs of NiS/CuS NRs and NiO/CuO NRs in 0.1 M NaOH containing 0 mM and 0.6 mM glucose; (b) CVs of NiS/CuS NRs with various concentration of glucose (0–1 mM).
The kinetics of glucose oxidation on NiS/CuS NRs was evaluated by measuring the effect of scan rate (ν) on CVs in 0.1 M NaOH containing 0.5 mM glucose. As shown in Fig. 5a the anodic peak current (Ipa) and cathodic peak current (Ipc) increase gradually with increasing of ν. Fig. 5b presents the plots of ν1/2 vs. anodic and cathodic current. It can be observed that both anodic and cathodic peak current of glucose oxidation signal increased linearly with increasing the square root of scan rates (ν1/2). Obviously, the oxidation of glucose at the NiS/CuS NRs electrode is a completely diffusion-controlled process. The plot in inset of Fig. 5a is the linear relation of logIpa with logν (logIpa=0.4245 logν - 3.9966, R2=0.9958), which also confirms the oxidation of glucose is diffusion-controlled process from the slope value of 0.4245. As is known that the slope values of the theoretical diffusion and adsorption control process on electrodes is 0.5 and 1, respectively. Moreover, the anodic and cathodic peaks can also be observed to have a slight positive and negative shift on CVs (Fig. 5a), which may suggest the irreversibility of glucose oxidation on NiS/CuS NRs. As illustrated in Fig. 5c, the plot of Epa vs. lnν also presents a good linear relationship. Based on the Laviron’s theory [27,28] the electron-transfer coefficient (α) and electron-transfer number (n) can be estimated.

(a) CVs for NiS/CuS NRs with various scan rates (5–200mV·s−1) in 0.1 M NaOH containing 0.5 mM glucose (inset: plots of logν vs. log Ipa); (b) Plots of ν1/2 vs. Ipa and (c) lnν vs. Epa; (d) EIS Nyqusit plots of NiS/CuS NRs recorded in the electrolyte of 0.1 M NaOH containing 0.5 mM glucose (inset: enlarged Nyquist plot in high frequency and the equivalent circuit).
Where, Eø is standard electrode potential. F, T, and R have their known definitions and take their values as 96485 C·mol−1, 298.15 K, and 8.314 J·mol−1·K−1, respectively. The slope value of the plots (Epa vs. lnν) is 0.0207. Therefore, the values of n and α were calculated to be 2 and 0.38 according to the value of α ranging between 0.3 and 0.7 [29,30]. Thus, according to the literatures, the mechanism of glucose oxidation on NiS/CuS NRs electrodes may be expressed as followings and illustrated in Scheme 1 [20,31,32]:
The kinetics of electrode reactions was further evaluated through EIS to identify the improvement of electrochemical performance on NiS/CuS NRs. Fig. 5d presents the Nyquist plots of NiS/CuS NRs and NiO/CuO NRs, which indicates the similar electron transfer abilities to CVs results. The value of electronic transfer resistance (Rct) can be estimated by fitting the EIS data with the appropriate equivalent circuit (inset of the bottom right of Fig. 5d). Where, Rs and W are the solution and Warburg resistance, respectively. C is a double layer capacitance. The corresponding fitted parameters are listed in Table S1. Obviously, NiS/CuS NRs (7.74 Ω) have lower Rct than that of NiO/CuO NRs (14.21 Ω), suggesting good electrical conductivity of NiS/CuS NRs. The results may imply that NiS/CuS NRs have the rapid electron transfer during the glucose oxidation, which is favorable to the sensing performance.
In order to conduct the sensing measurement, the applied potential was optimized by recording the amperometric current response of NiS/CuS NRs electrodes to glucose with different applied potentials. As illustrated in Fig. 6a, current response can increase gradually along with the potential increasing. However, the background current response at 0.6 V is much higher than that under other potentials (0.45, 0.5, and 0.55 V). Therefore, in the subsequent glucose sensing measurement 0.55 V was employed as the applied potential. The glucose sensing performance was then evaluated by recording the amperometric I-t curves with successive addition of glucose into 0.1 M NaOH. Fig. 6b shows the comparison of i-t curves of NiS/CuS NRs and NiO/CuO NRs, both of which present the regular rising step shape as glucose concentration varying from low to high levels. Moreover, the current response of NiS/CuS NRs is greatly higher than that of NiO/CuO NRs agreeing well with the results of CVs, which implies the better glucose sensing properties of NiS/CuS NRs. The linear plot of glucose concentration vs. current response on NiS/CuS NRs electrode was illustrated in Fig. 6c, which presents a good linear relationship in the range of 1–8000 μM. From the linear equation of I (μA)=187.69 C (mM) + 42.52 (R2=0.995) the sensitivity of NiS/CuS NRs for glucose detection is 956.38 μA·mM−1·cm−2. According to the equation, the limit of detection LOD=3×σ×s−1, where σ is the standard deviation of the blank solution, and s is the sensitivity of the test method. The LOD was calculated to be 0.35 μM (S/N=3). The sensing performance of NiS/CuS NRs was also compared with the recent reported materials (listed in Table 1). NiS/CuS NRs shows satisfactory sensing performance with wider linear range, lower detection limit and higher sensitivity. Moreover, the selectivity of NiS/CuS NRs for glucose detection was also evaluated through recording the amperometric current response to glucose and other interfering compounds (such as urea, glutamic acid, NaCl, L-proline, and L-valine). As shown in Fig. 6d, NiS/CuS NRs shows considerable current response to glucose before and after the addition of interfering compounds, while the current response to interferents is almost negligible, suggesting the good selectivity of NiS/CuS NRs for glucose detection.
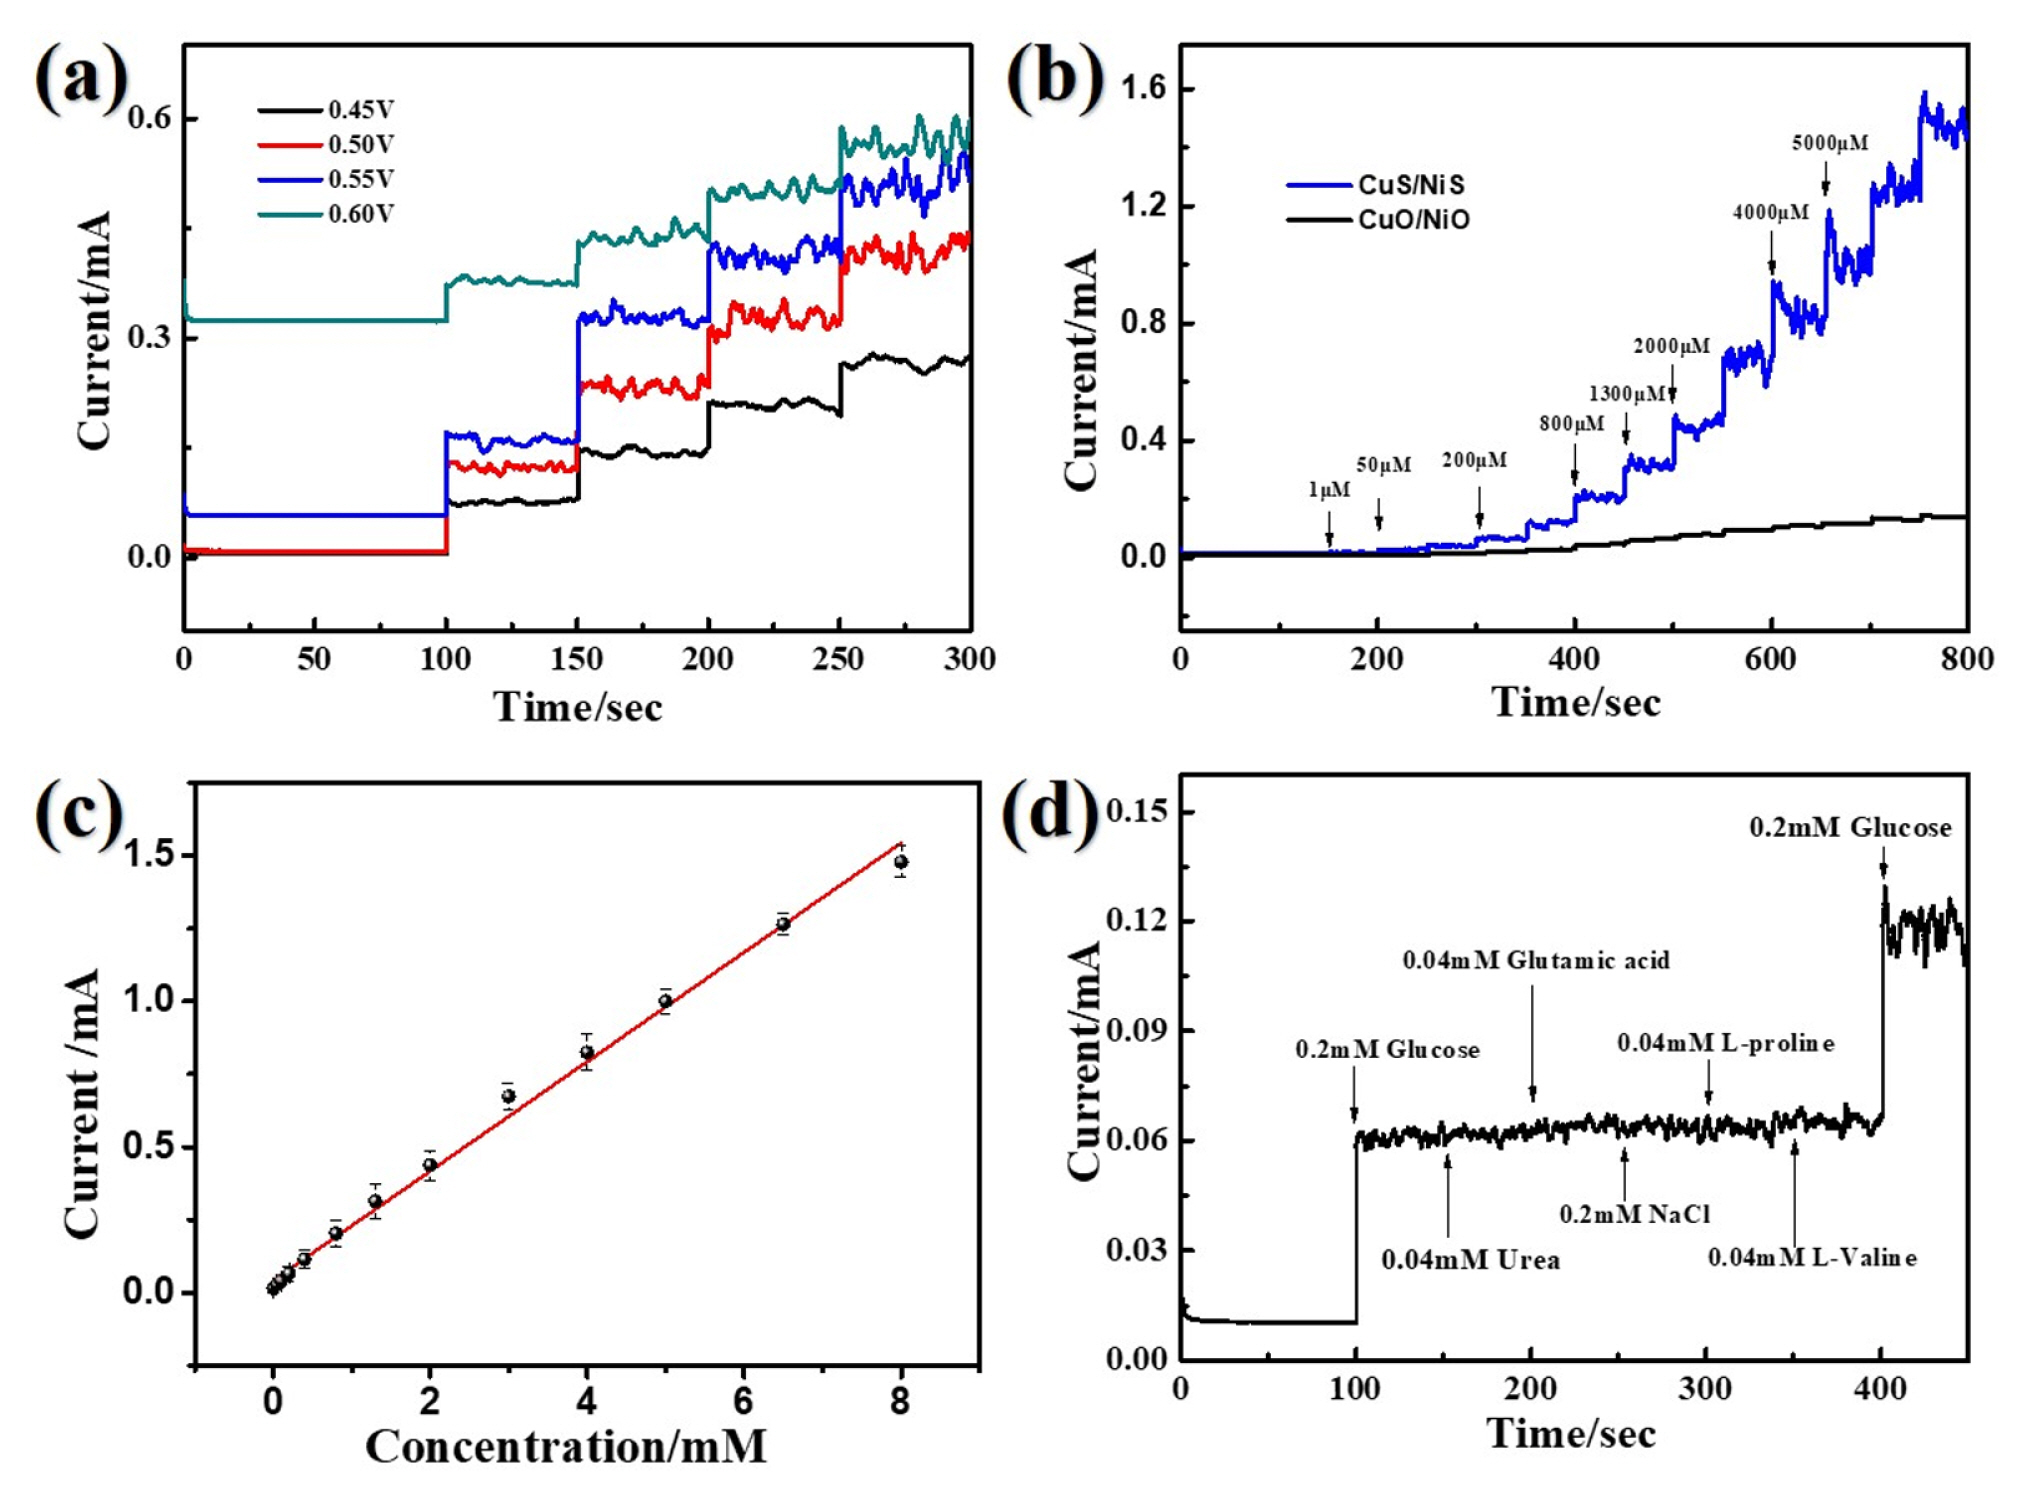
(a) The effect of applied potentials on amperometric response for NiS/CuS NRs; (b) I-t curves of different concentrations of glucose at NiS/CuS NRs in 0.1 M NaOH; (c) The linear plot of currents vs. glucose concentrations. (d) Amperometric response of NiS/CuS NRs to glucose and other interfering compound.
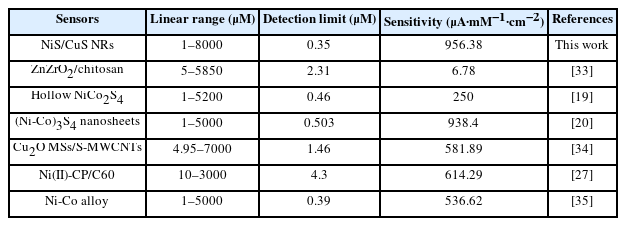
Comparison of NiS/CuS NRs with other gluocse sensors
The performance of the smartphone-based glucose sensing device was also evaluated by recording the amperometric I-t response, which consists of micro-electrochemical workstation, smartphone, and glucose sensors. As illustrated in Fig. 7a, an App was employed as interactive interface between users and the system. The amperometric I-t curves of NiS/CuS NRs electrodes on successive addition of glucose are presented in Fig. 7b. The rapid current response can also be observed with the addition of glucose and immediately arrives a steady state. The plot of current response vs. glucose concentration (Fig. 7c) also displays a good linear relationship in the range of 5–4000 μM. From the linear regression equation of I (μA)=144.85 C (mM) + 20.01 (R2=0.992), the sensitivity was obtained to be 738.09 μA·mM−1·cm−2, which is close to the results achieved on the conventional workstations. According to the equation (LOD=3×σ×s−1), the LOD was calculated to be 1.675 μM (S/N=3). The realistic application of the smartphone-based glucose sensing device with NiS/CuS NRs electrodes was also evaluated by analyzing the glucose levels in serum samples using the standard addition method. The serum samples were obtained from biotechnology company (Zhejiang Tianhang Biotechnology Co., LTD) and the glucose concentration is 4.4 mM. The current responses were recorded by alternately adding standard glucose solution (5 mM) and serum samples. Fig. 7d presents the typical current response to the standard glucose solutions (40 μL) and serum samples (44 μL) on the smartphone-based glucose sensing device. The analyzed results obtained on the smartphone-based sensor were also compared by the results obtained on the CHI potentiostat-based sensor, which is listed in Table 2. The recoveries obtained from smartphone-based sensors were in the range of 99.5–105.8% and the (%RSD) values were from 2.42 to 3.00%, which agree well with the results of CHI potentiostat-based sensor. The high recovery and acceptable relative standard deviations (RSD) confirm that the smartphone-based glucose sensing device has favorable feasibility in determination of glucose in serum samples.
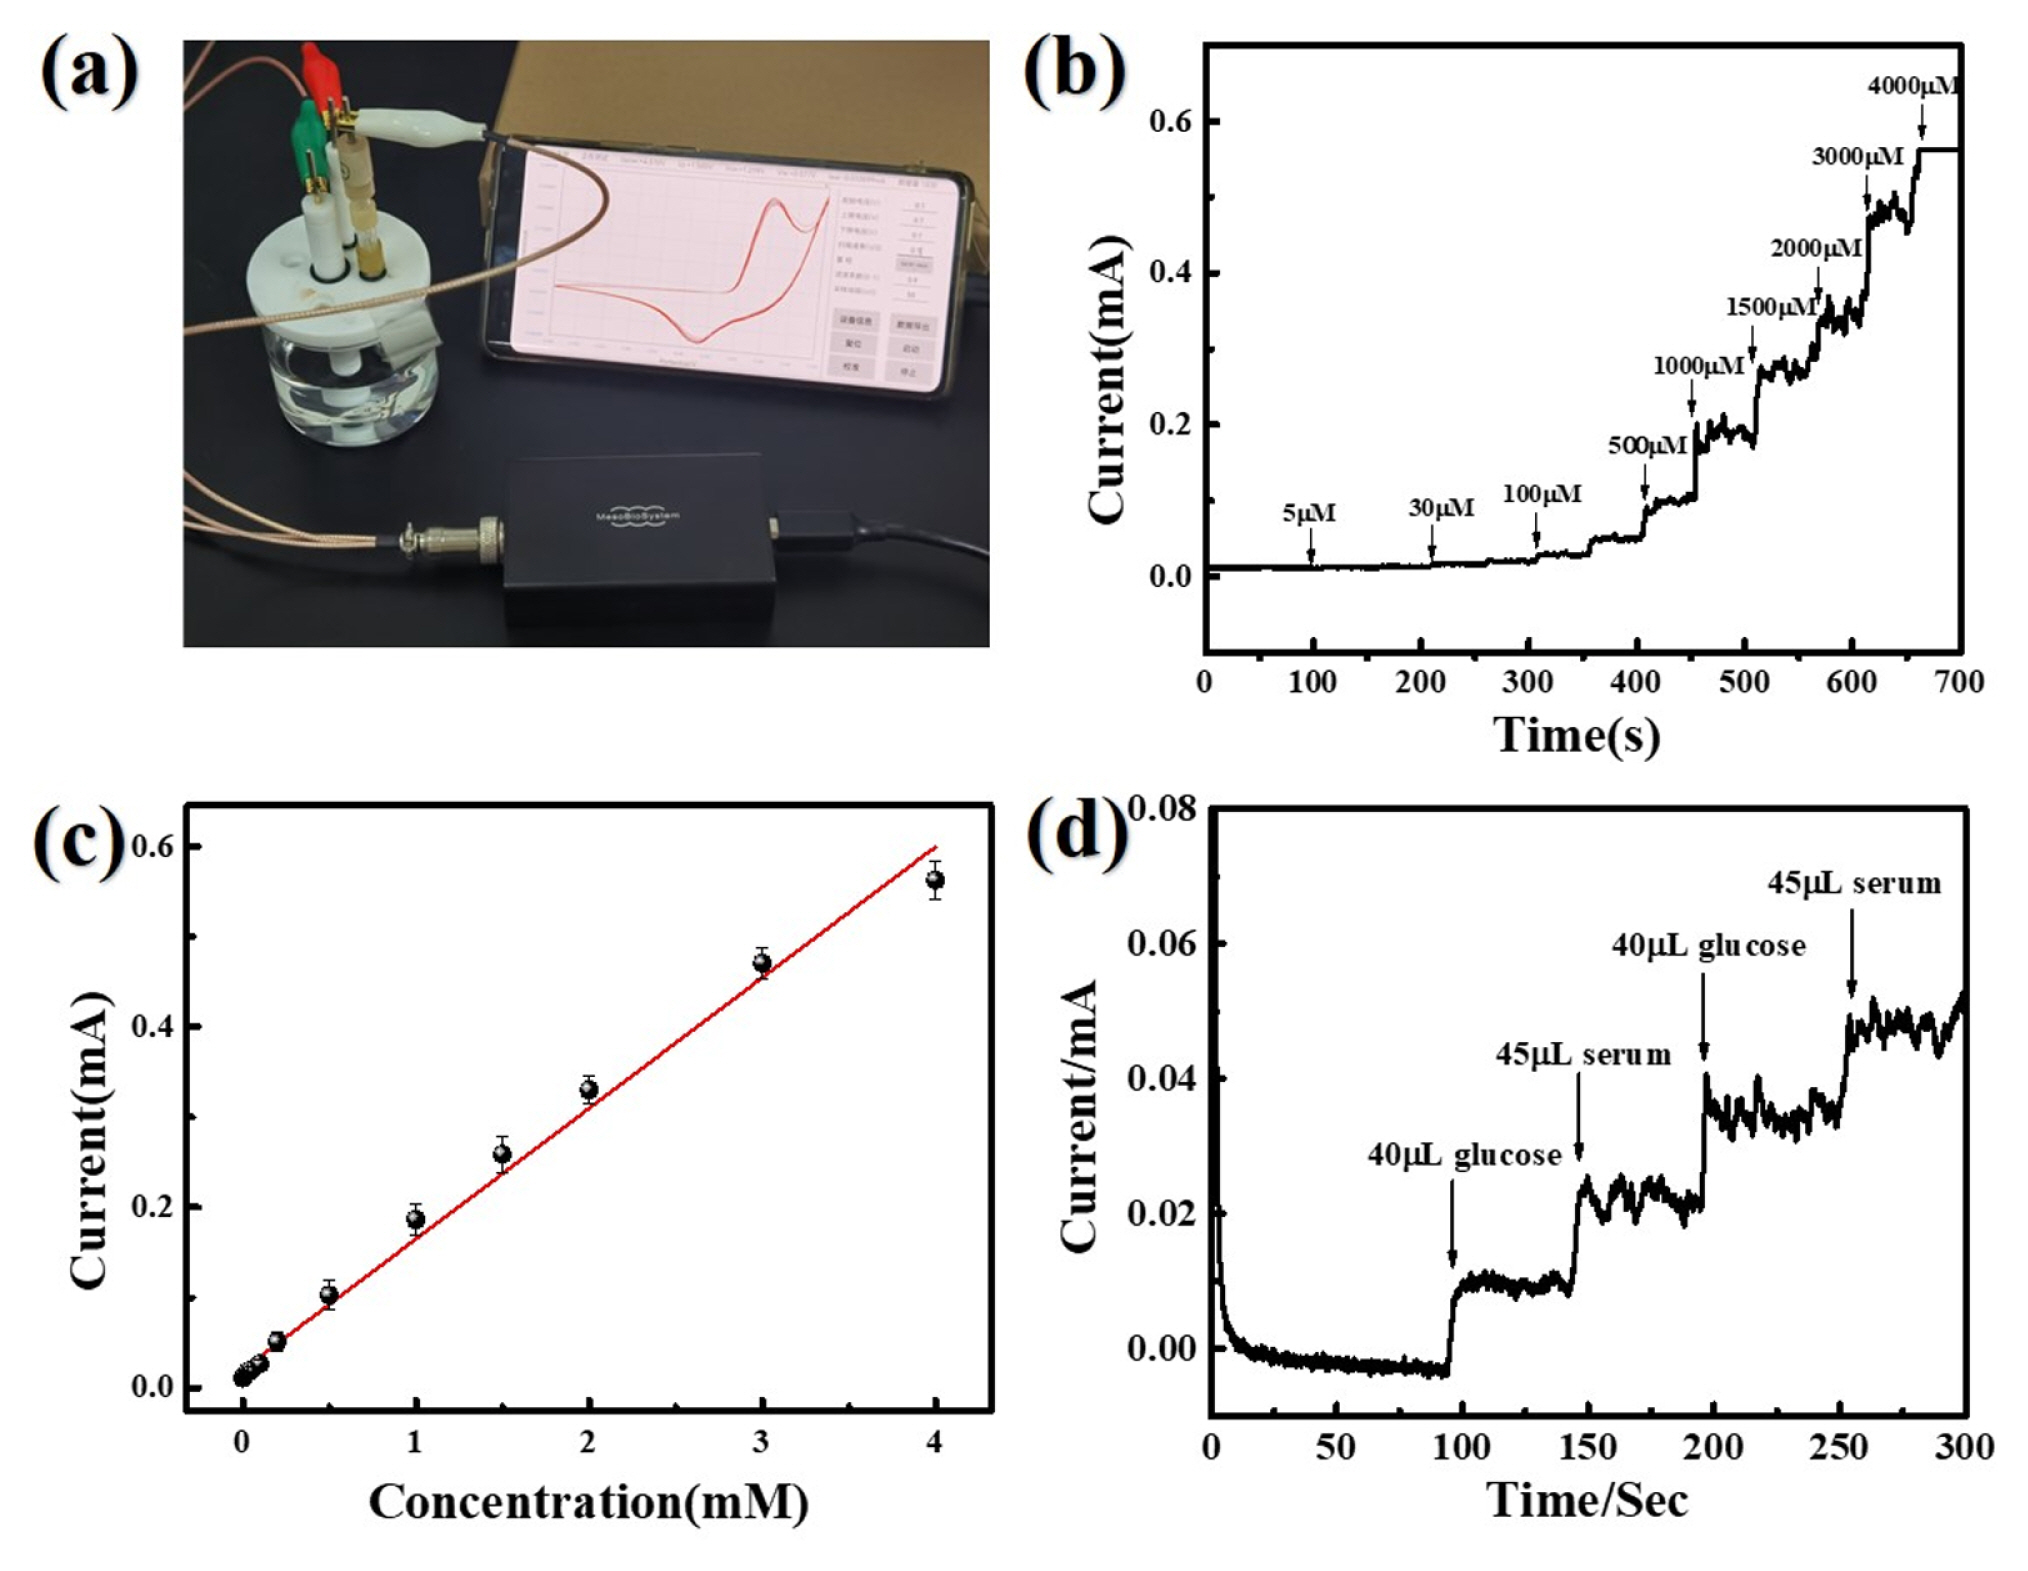
(a) The photograph of smartphone based electrochemical sensing device; (b) I-t curves of different concentrations of glucose at NiS/CuS NRs in 0.1 M NaOH; (c) The linear plot of currents vs. glucose concentrations. (d) Amperometric response of NiS/CuS NRs to glucose and serum samples.

The analytical results of glucose in bovine serum samples using NiS/CuS NRs as electrodes and the comparisons between the CHI potentiostat-based sensor and the smartphone-based sensor
4. Conclusions
NiS/CuS NRs were obtained through a facile hydrothermal and vulcanization treatment process. The electrochemical performance of NiS/CuS NRs was evaluated by CVs, EIS and chrono-amperometric measurement. NiS/CuS NRs present highly improved catalytic efficiency for glucose oxidation comparing with NiO/CuO NRs, which may be due to the rapid electron transfer originating from the vulcanization. The NiS/CuS NRs sensors showed satisfactory sensing properties for glucose detection including high sensitivity (956.38 μA·mM−1·cm−2), wide linear range (1–8000 μM) and low detection limit (0.35 μM). Equipped in the smartphone-based glucose sensing device, they also display a high sensitivity of 738.09 μA·mM−1·cm−2, low LOD of 1.675 μM and favorable feasibility in determination of glucose in serum samples. Moreover, the sensors also have good selectivity for glucose detection. The current results may suggest that NiS/CuS NRs may be promising materials for designing the portable smartphone-based glucose sensors.
Supporting Information
Acknowledgment
This work is financially supported by National Nature Science Foundation of Zhejiang Province (No. Y19E060021).
Notes
Competing interests: The authors declare that there is no conflict of interests or any competing interests.