1. Introduction
2. Experimental
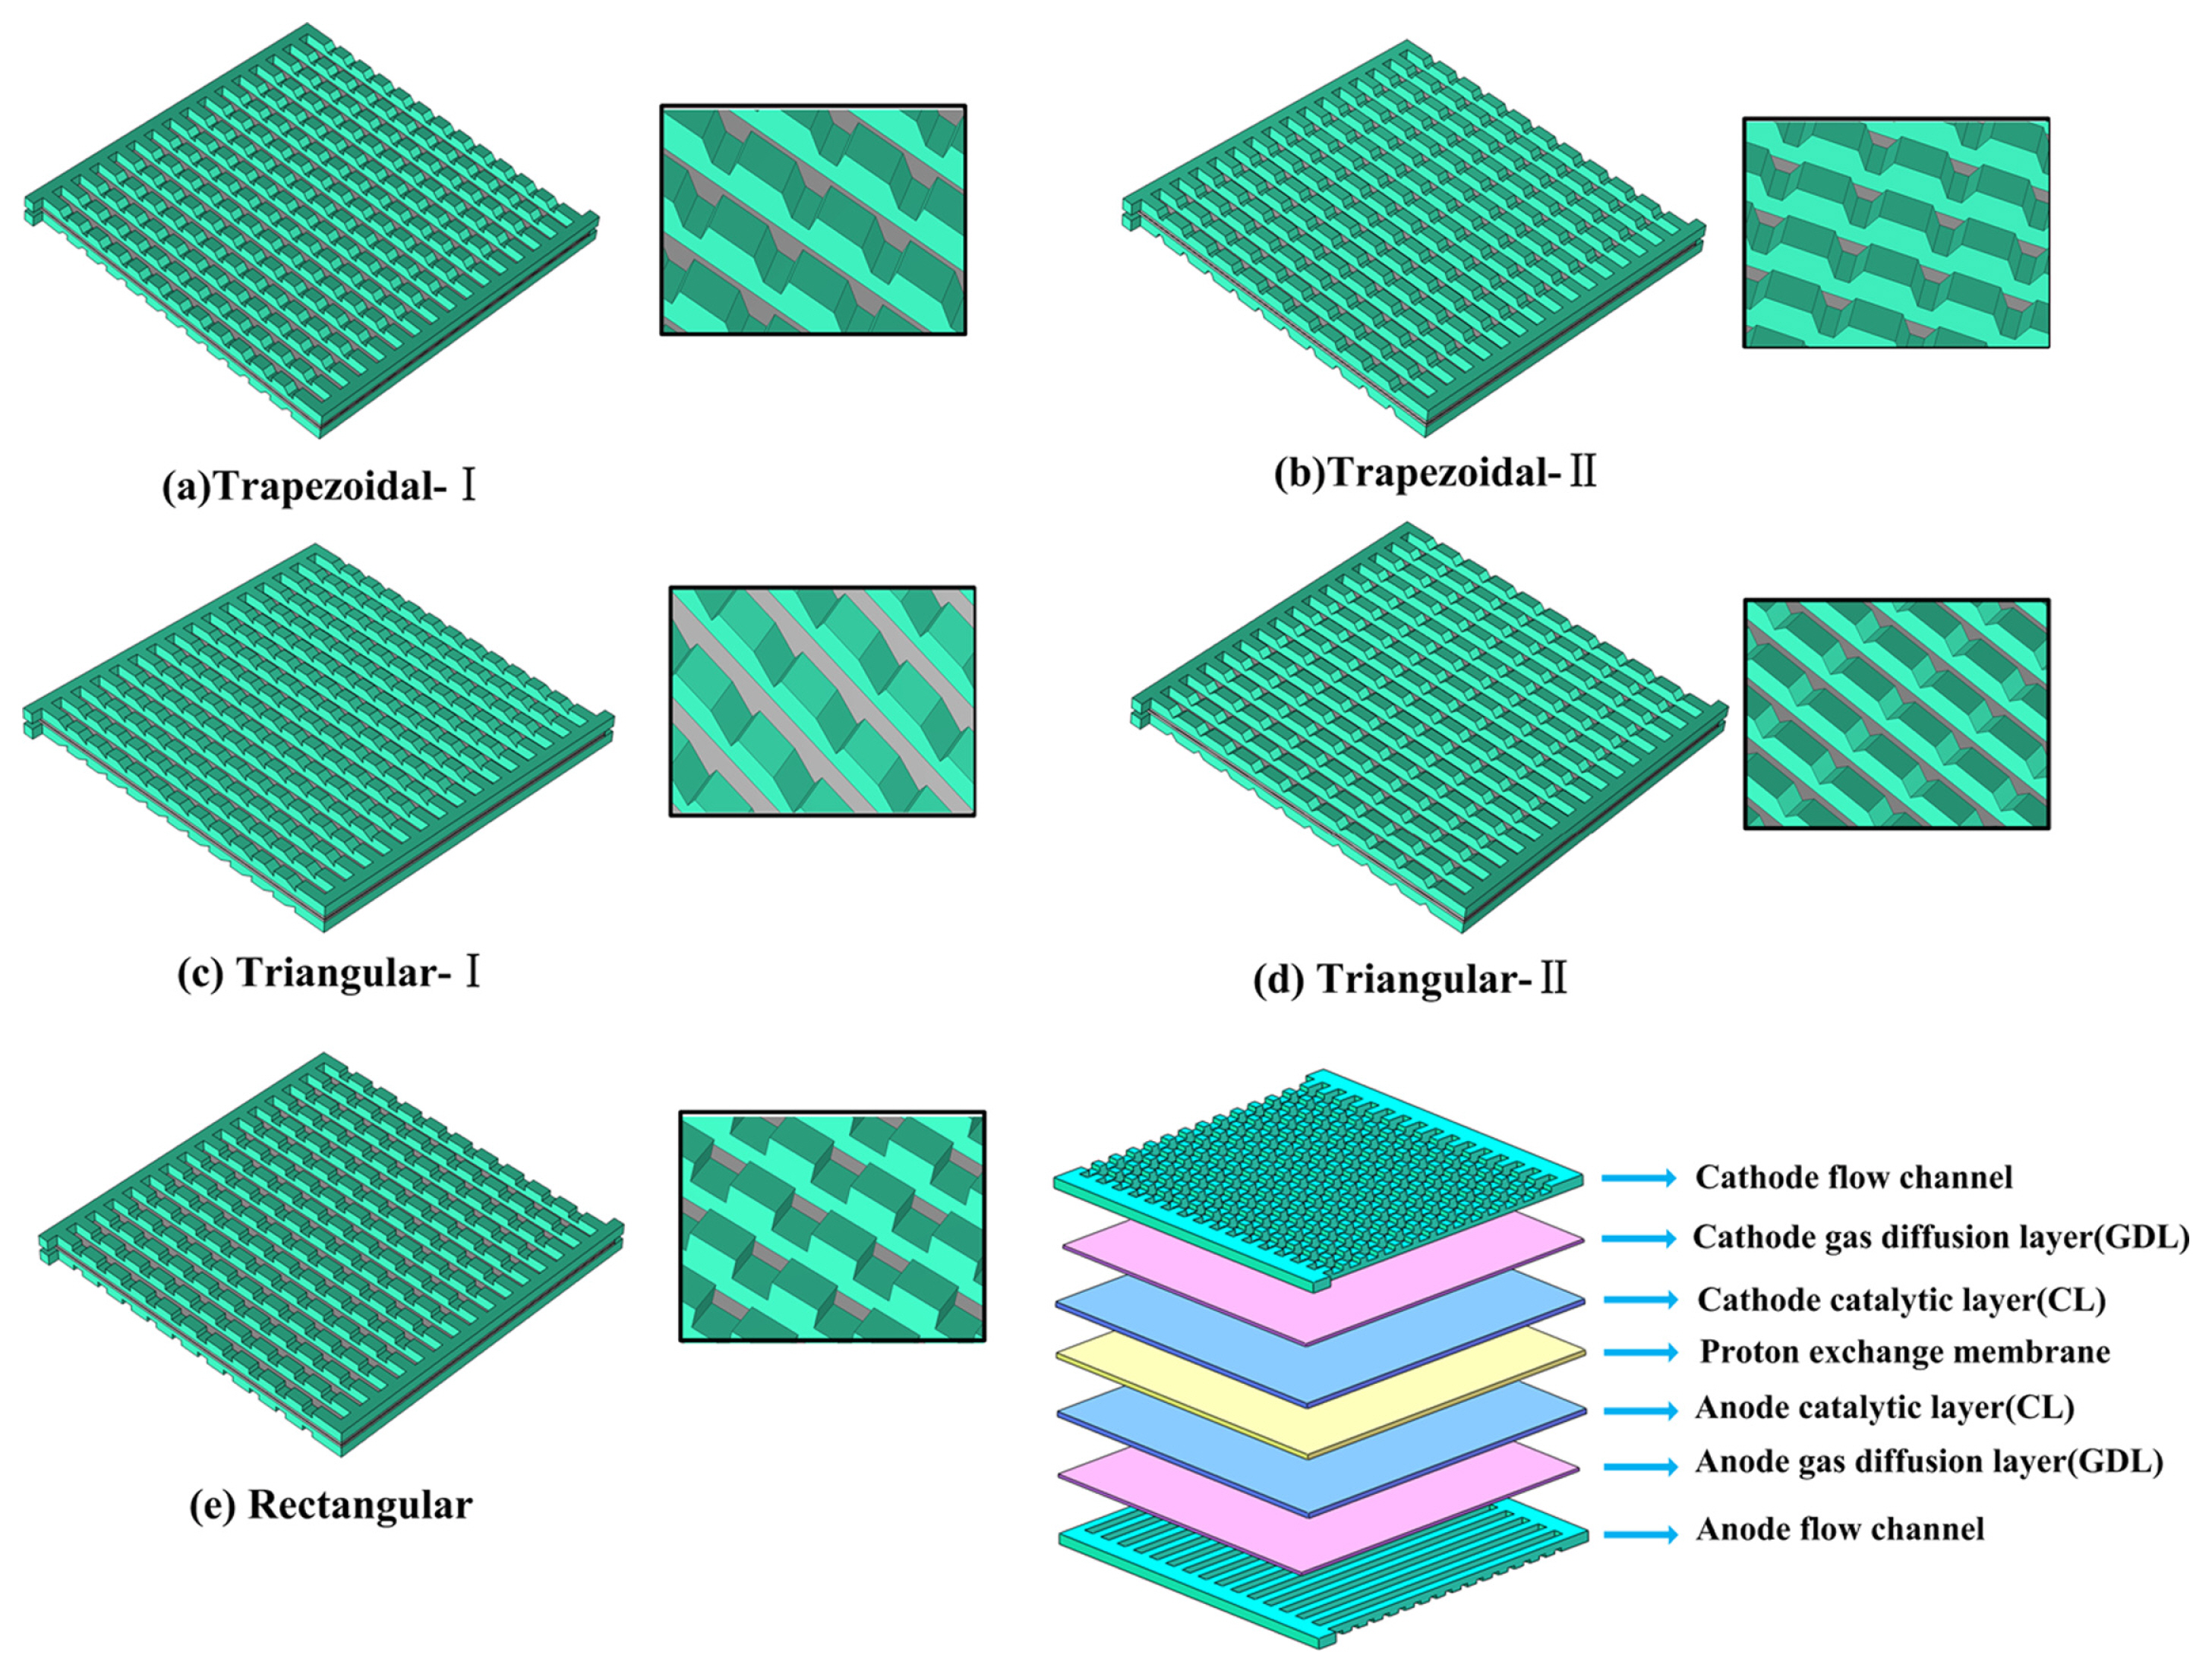
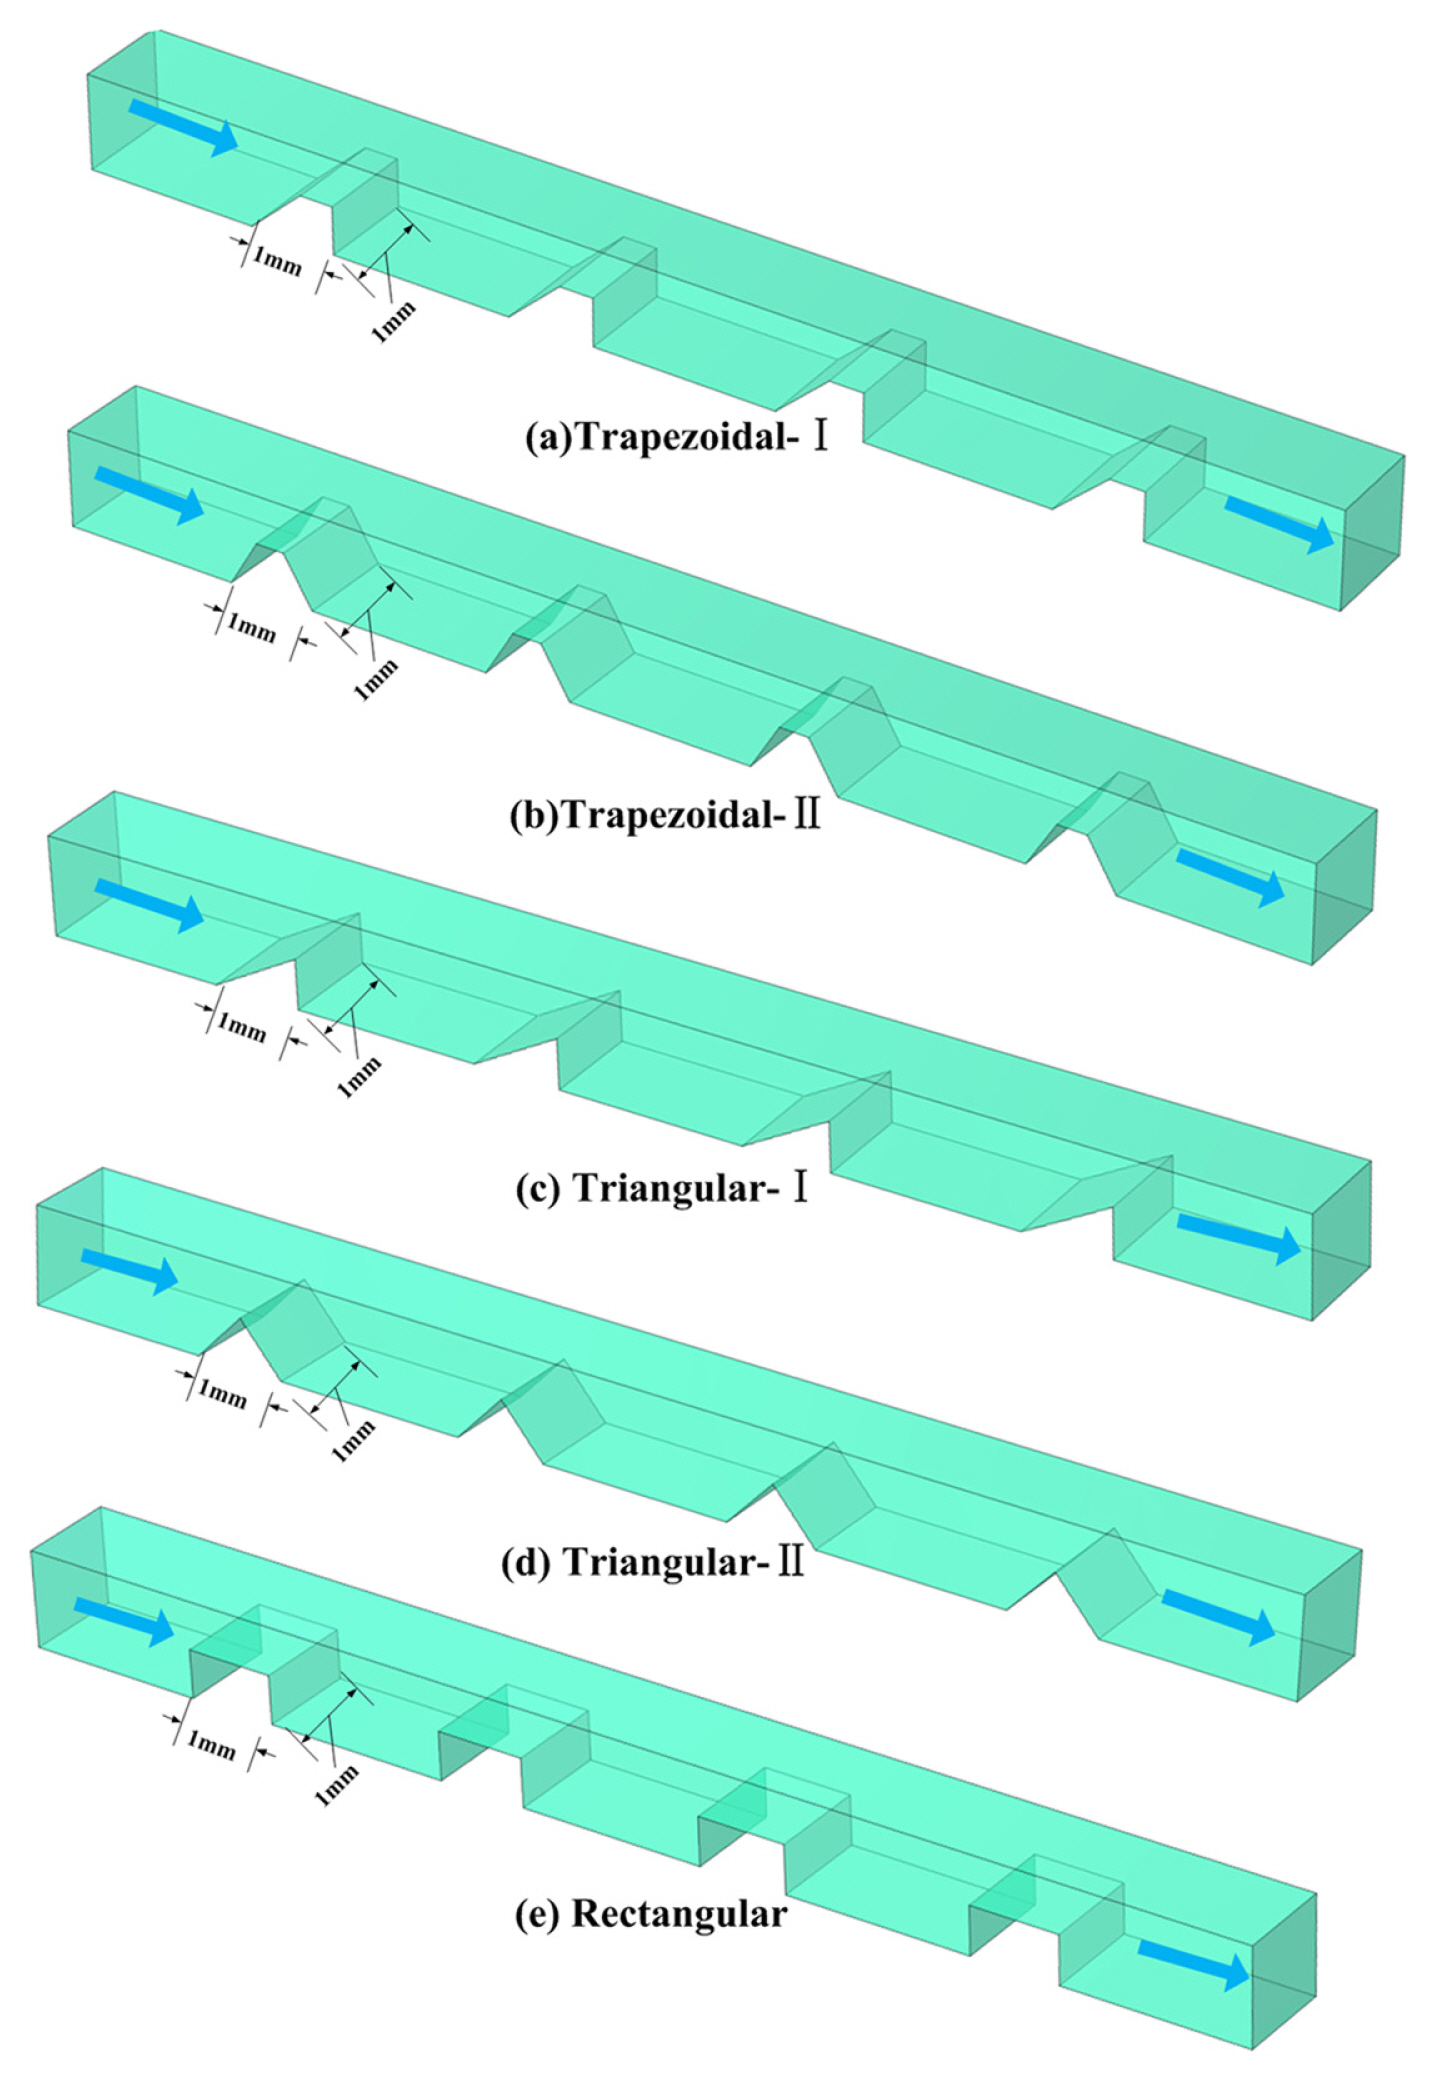
2.1 Physical model
2.2 Mathematical model
2.2.1 Mass conservation
2.2.2 Momentum conservation
2.2.3 Energy conservation
2.2.4 Electric charge conservation
2.2.5 Component conservation
2.2.6 Butler-Volmer equation
2.3 Assumption
2.4 Model verification
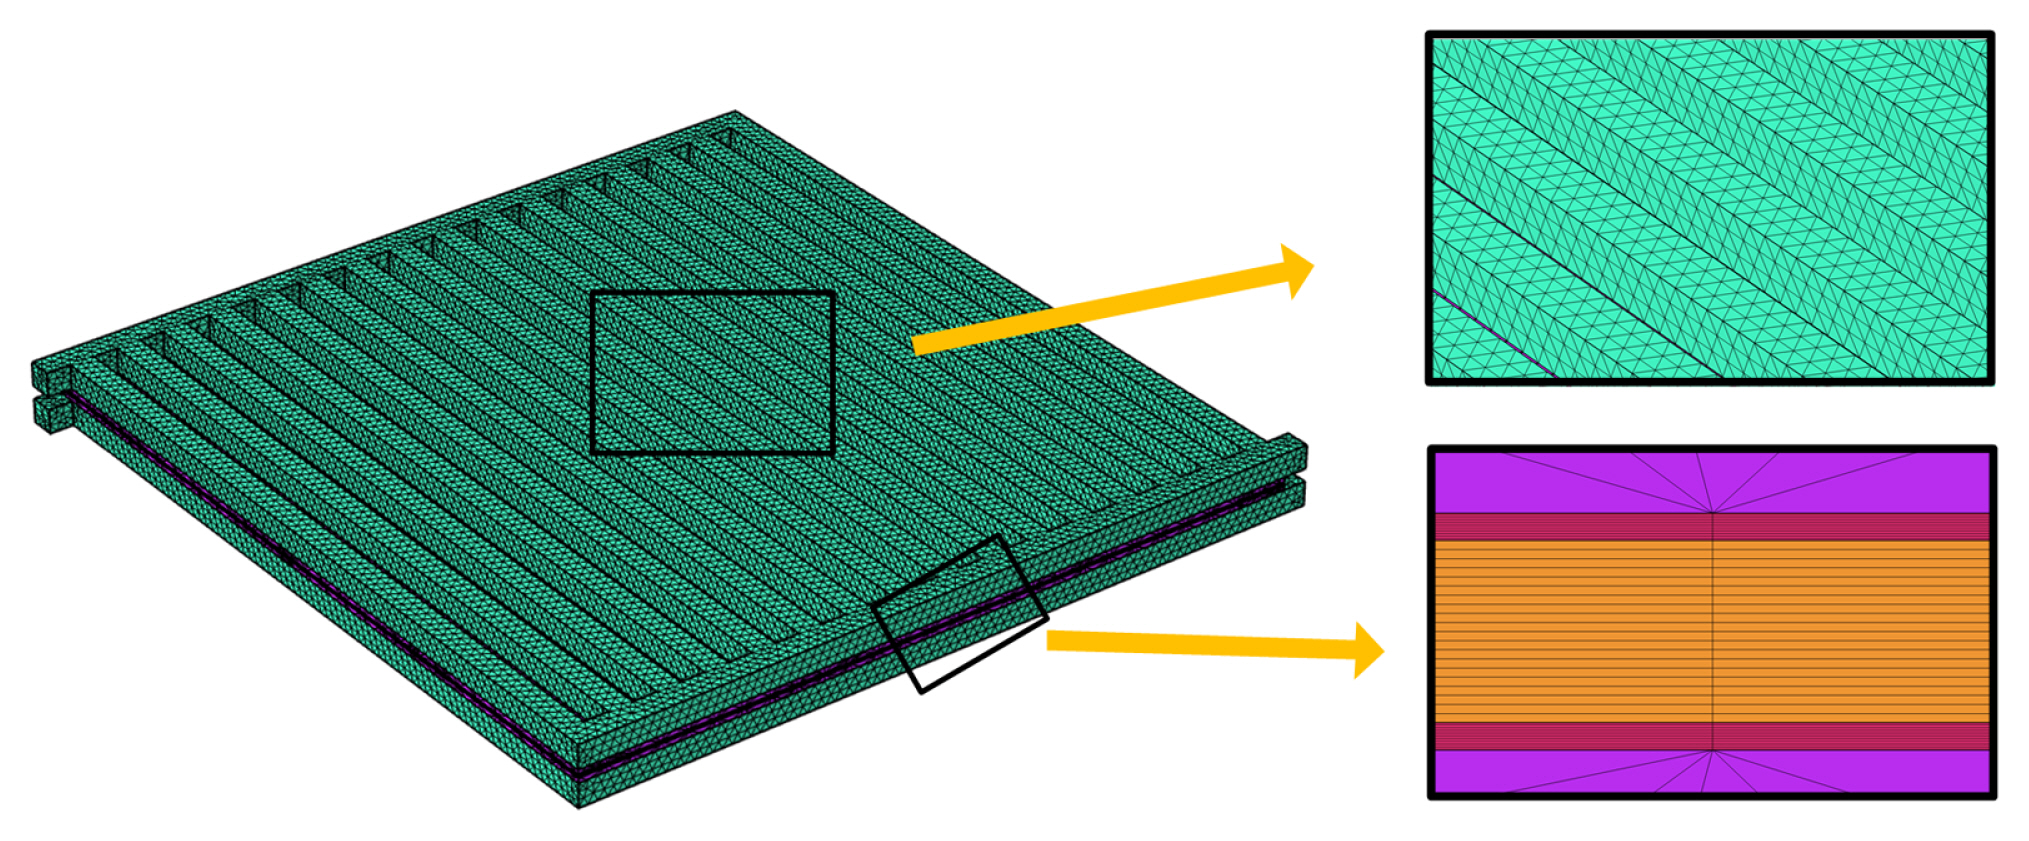
2.4.1 Grid independence verification
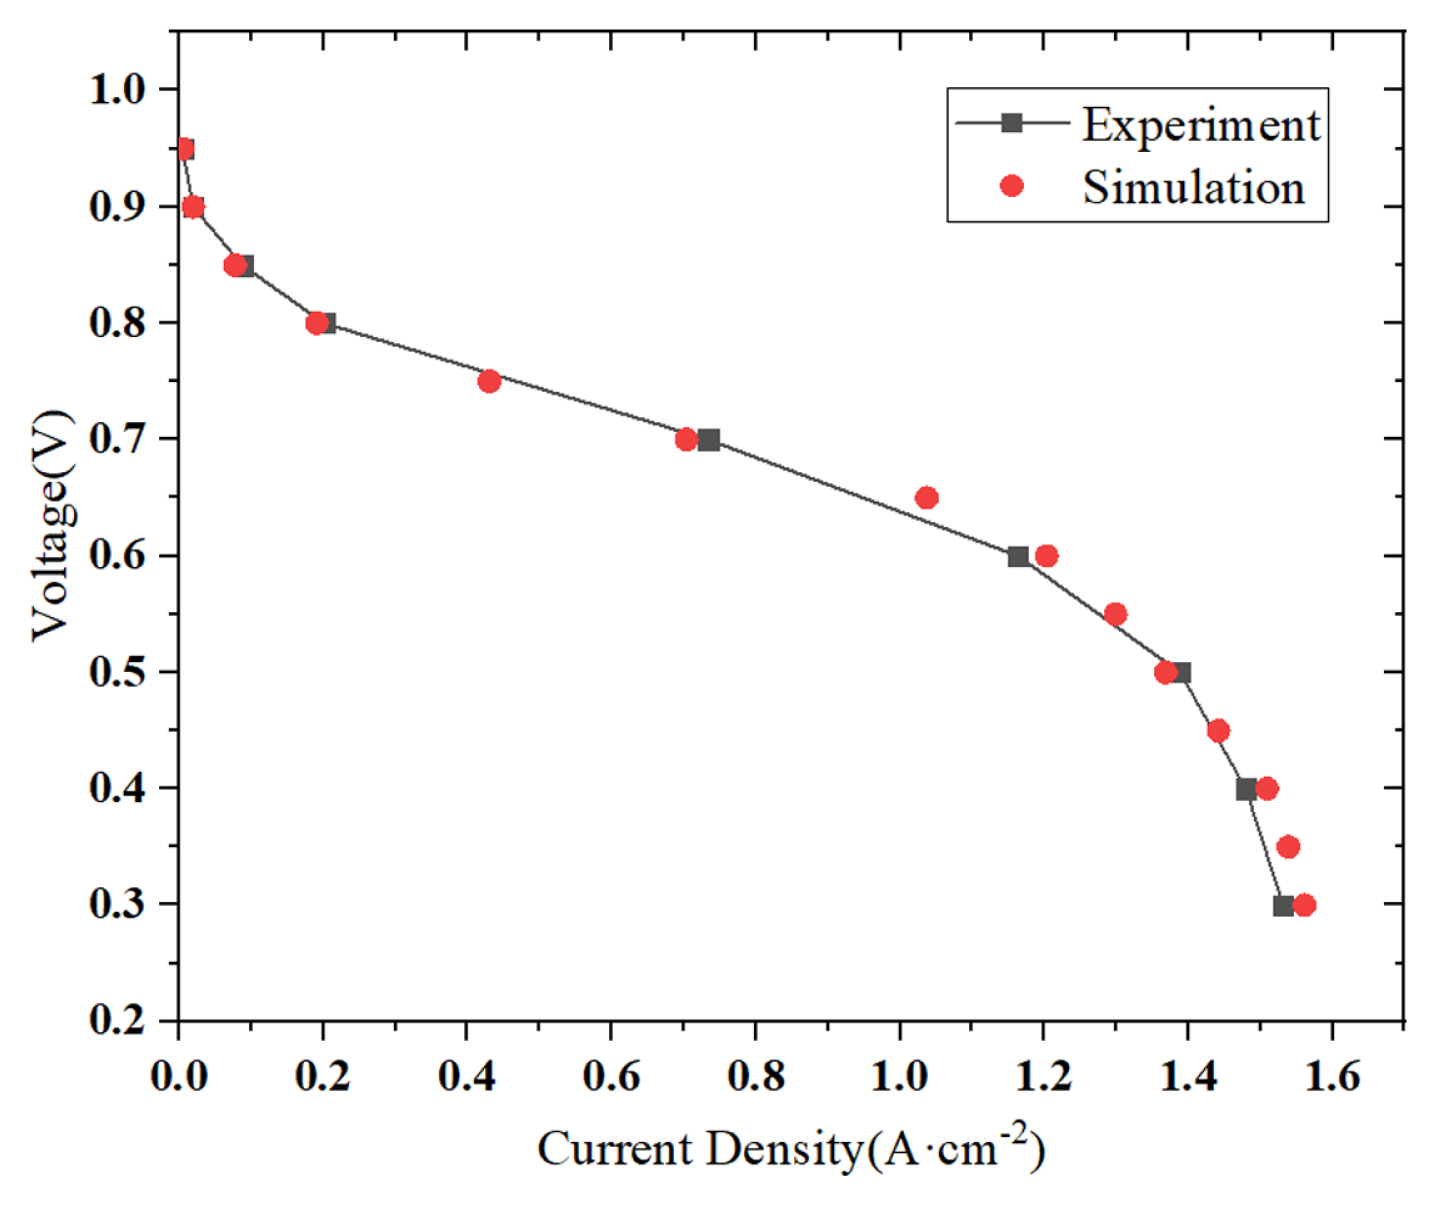
2.4.2 Experimental verification
3. Results and Discussion
3.1 The effect of obstacle number on PEMFC performance
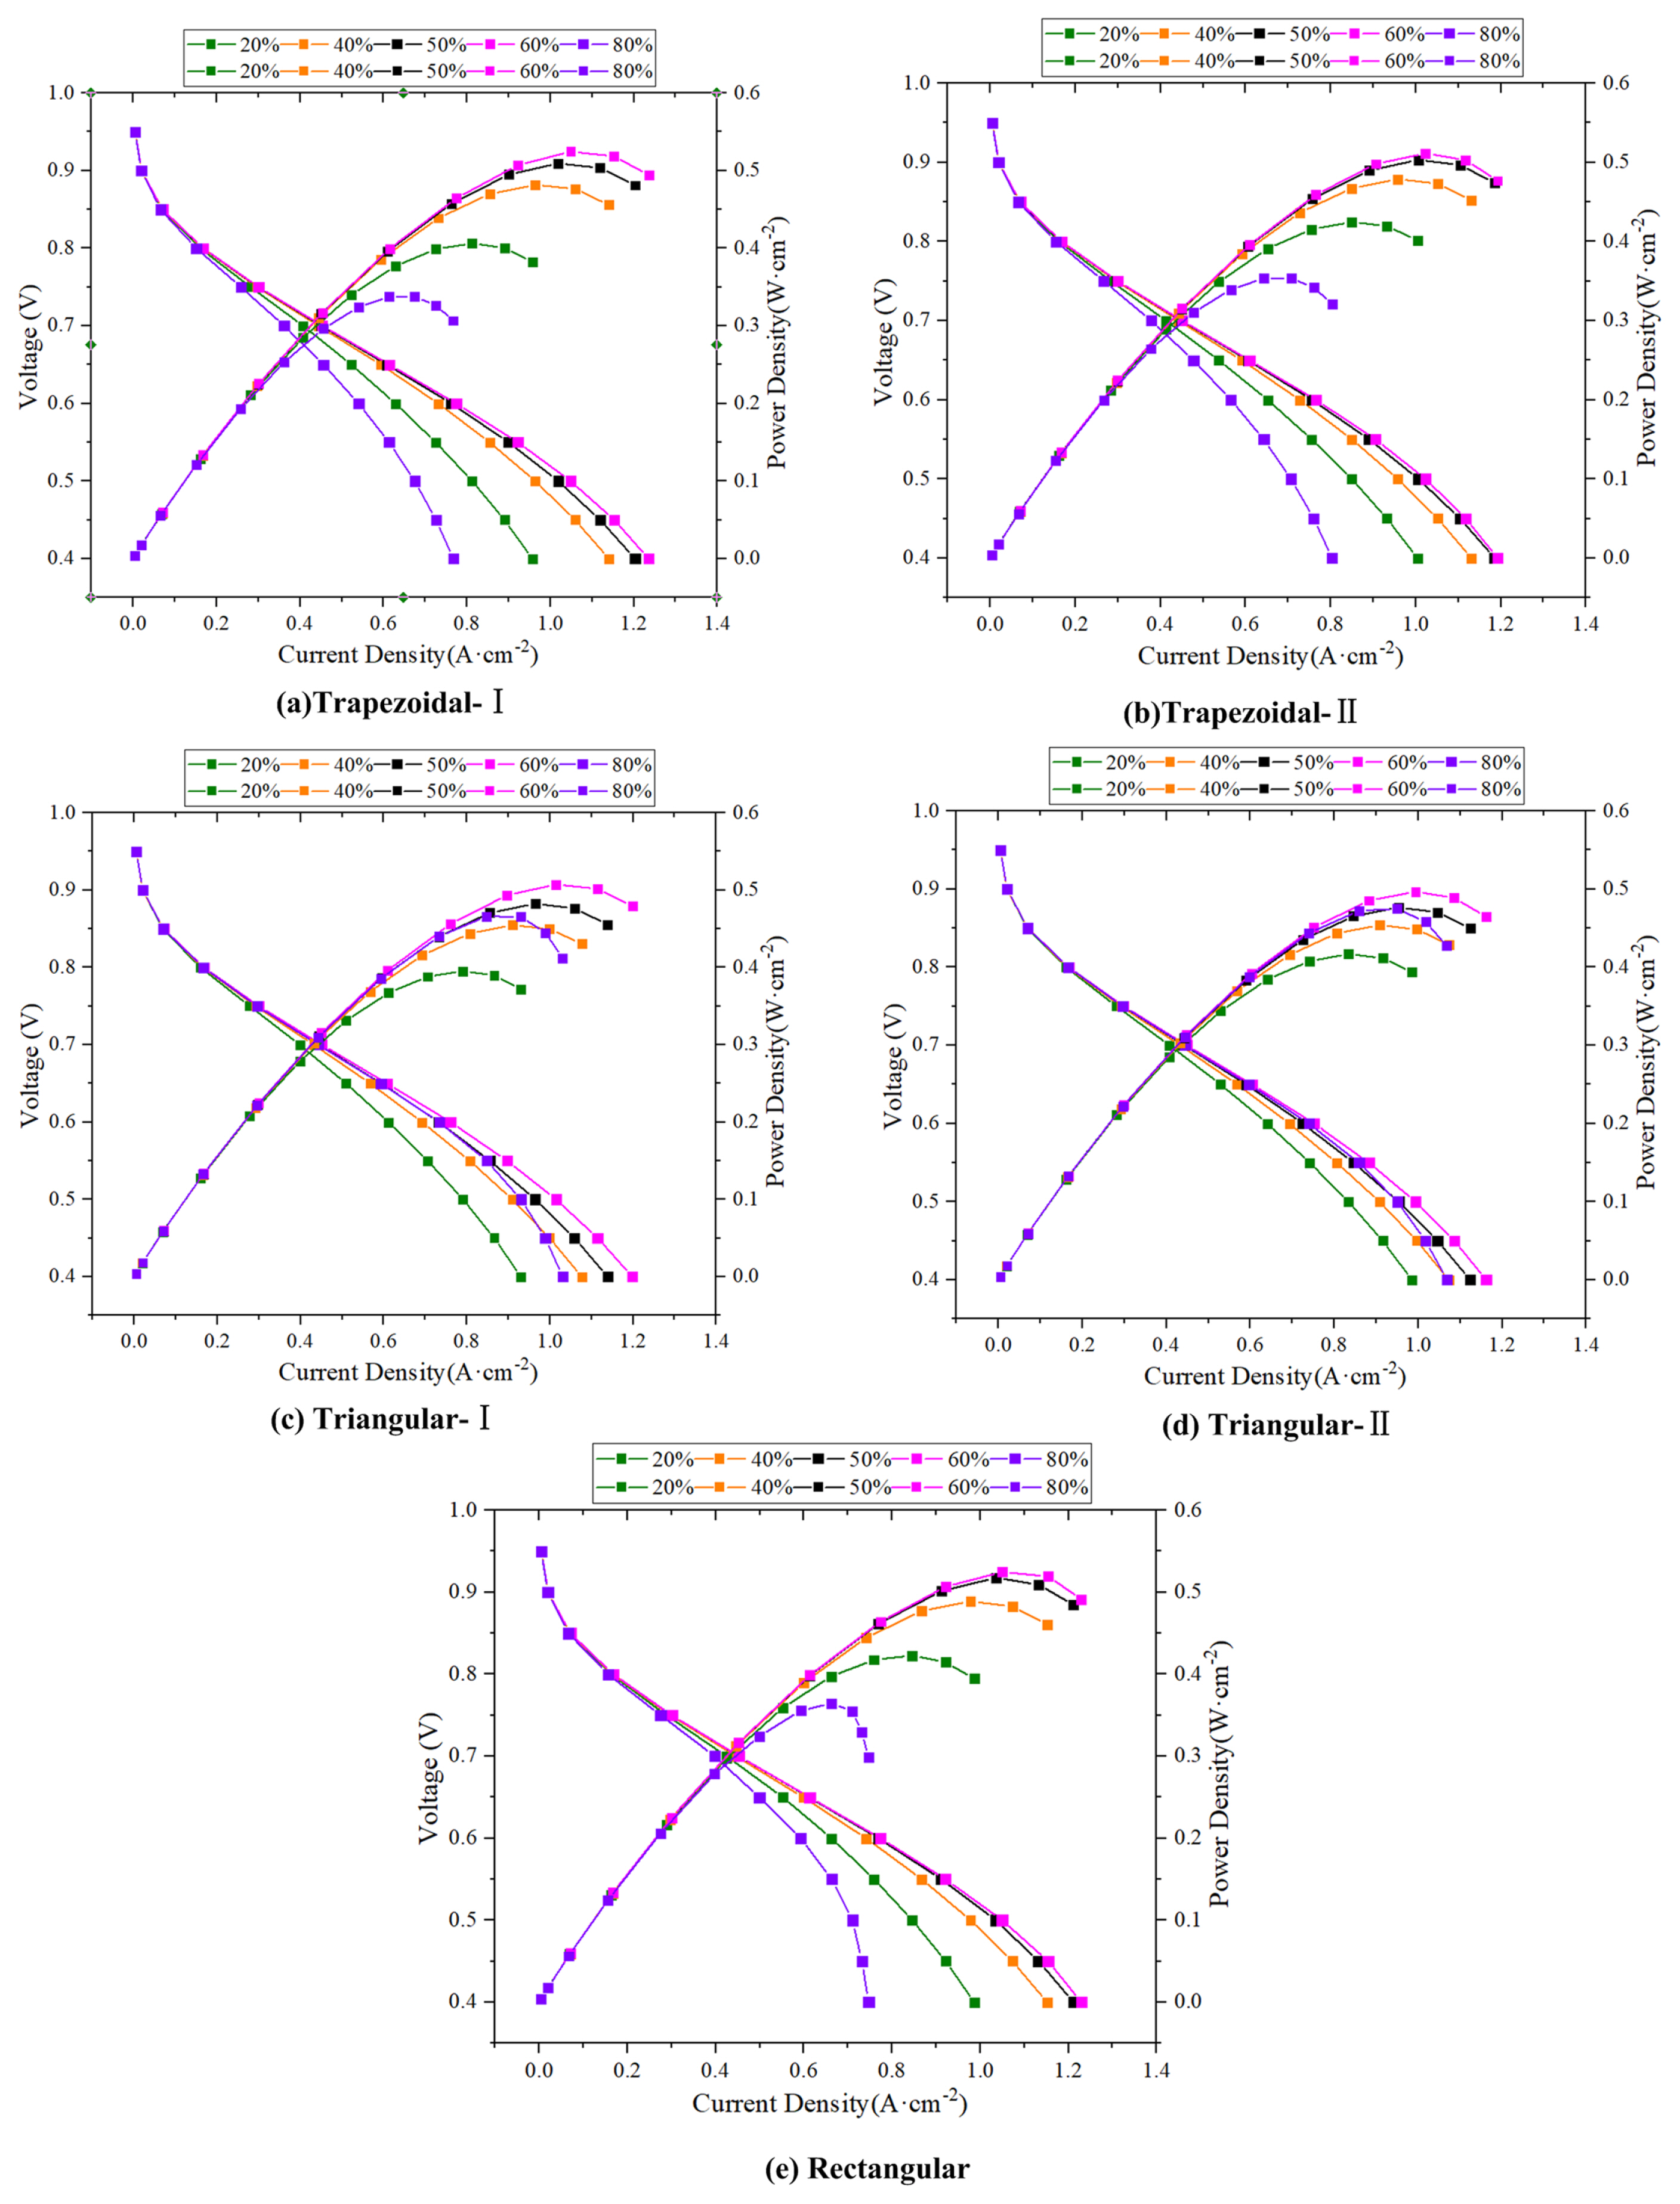
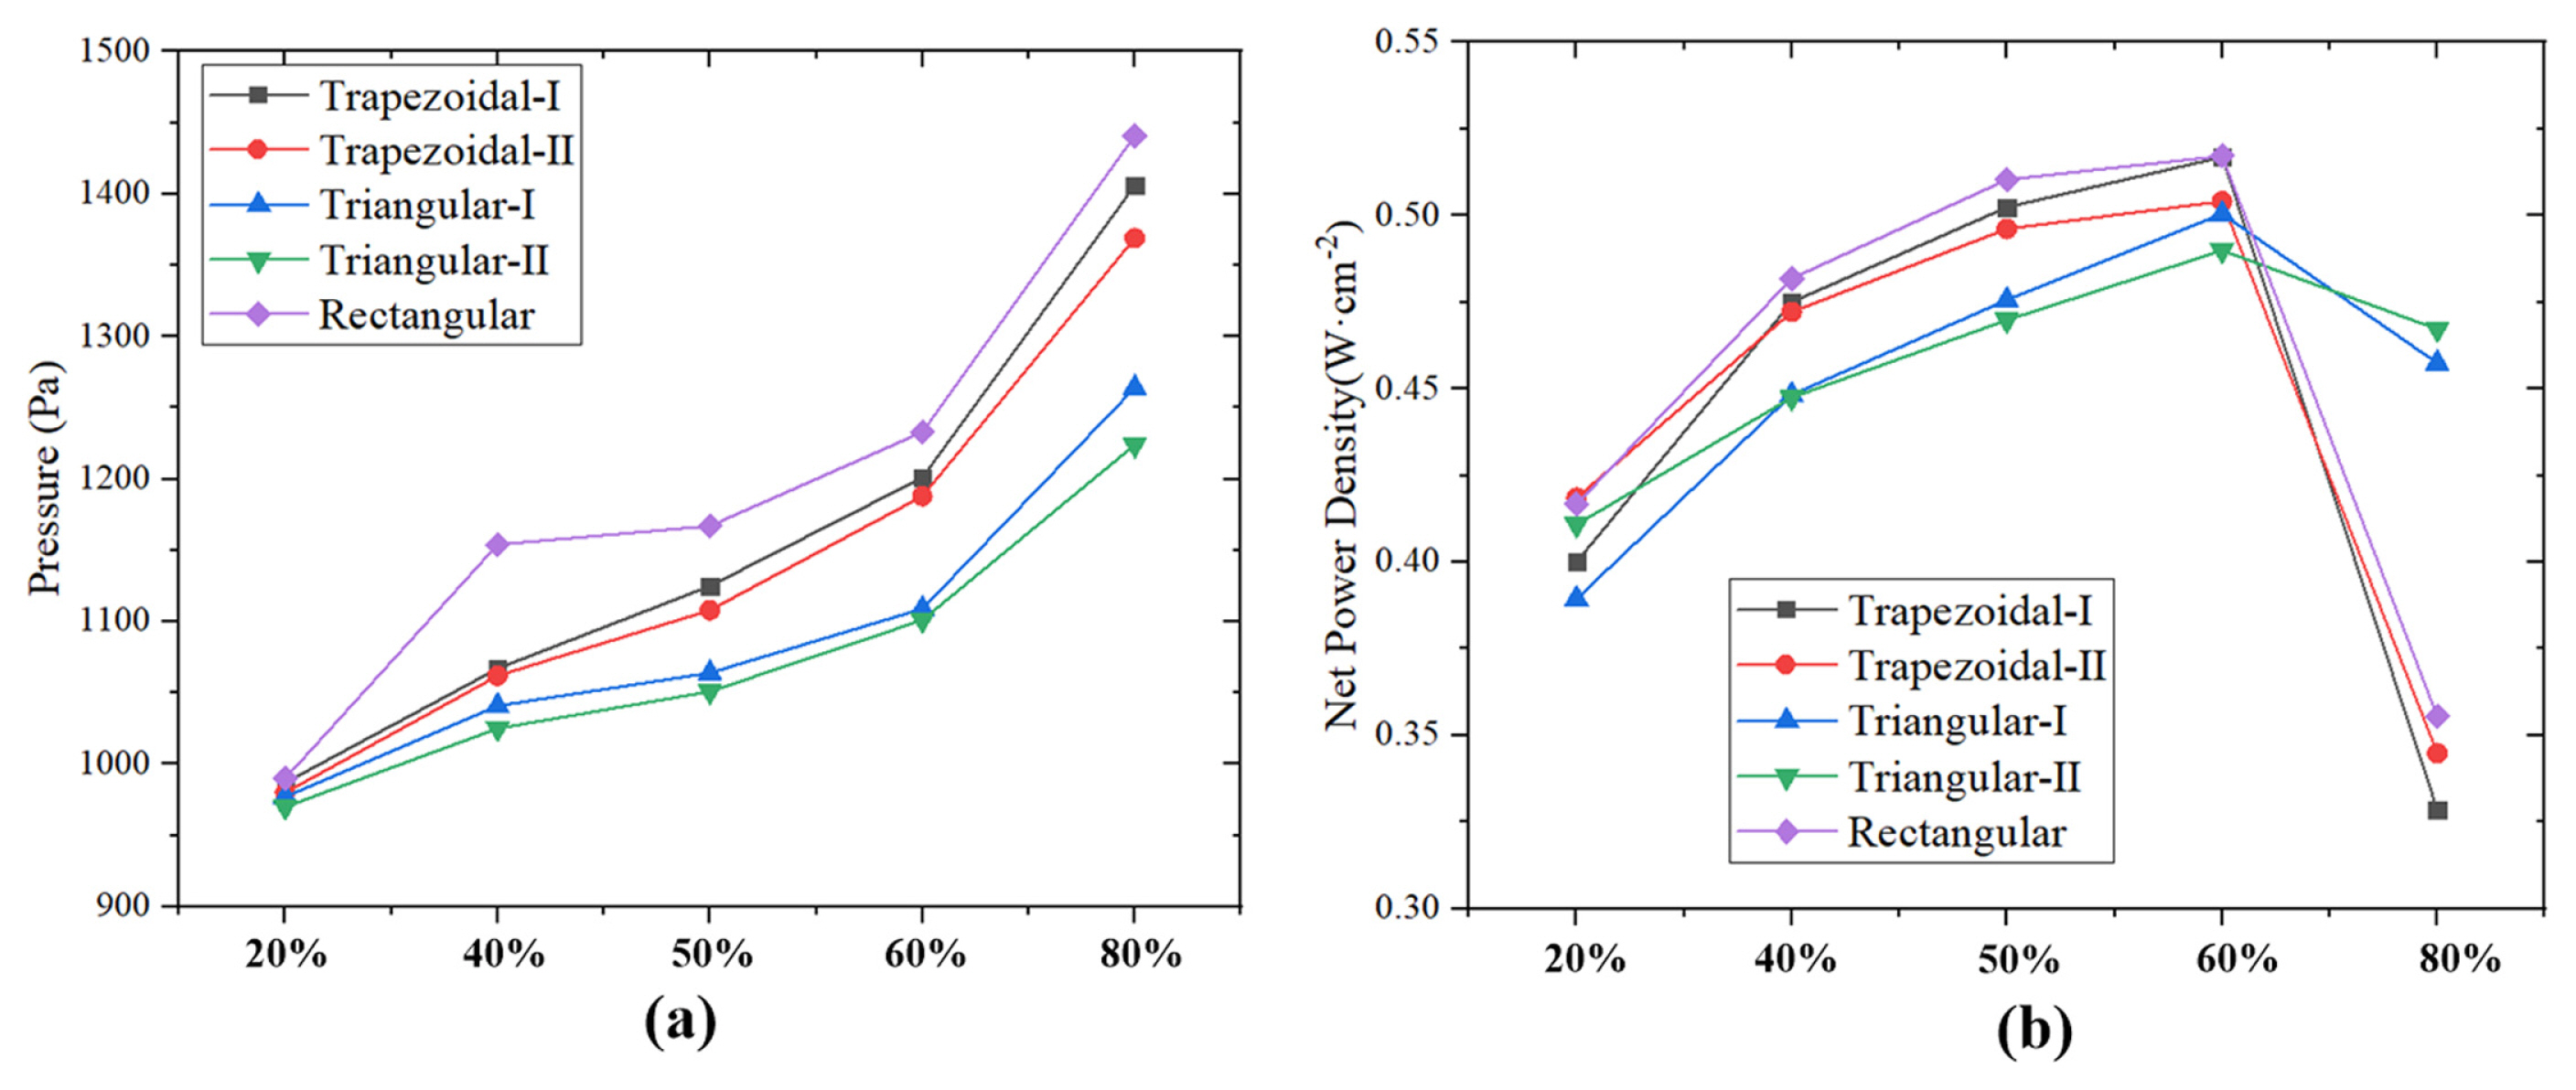
3.2 Channel blockage degree effect on PEMFC performance
3.3 Obstacle shape effect on PEMFC performance
3.4 Blockage degree effect on PEMFC performance
3.5 Relative humidity effect on PEMFC performance
4. Conclusions
Obstacle longitudinally distributed can significantly promote reactants transfer to GDL, compared with obstacle number and shape, the effect of channel blockage degree on PEMFC performance much more significantly.
Obstacle number should be designed reasonably, PEMFC performance first increased as obstacles number increased, when obstacle number reached certain number, the performance improvement reached the bottleneck period. As obstacle number was too large will hinder the transmission process of the reaction gas and reduce PEMFC performance. Considering the processing technology and cost, the optimal obstacle number in this research was 10.
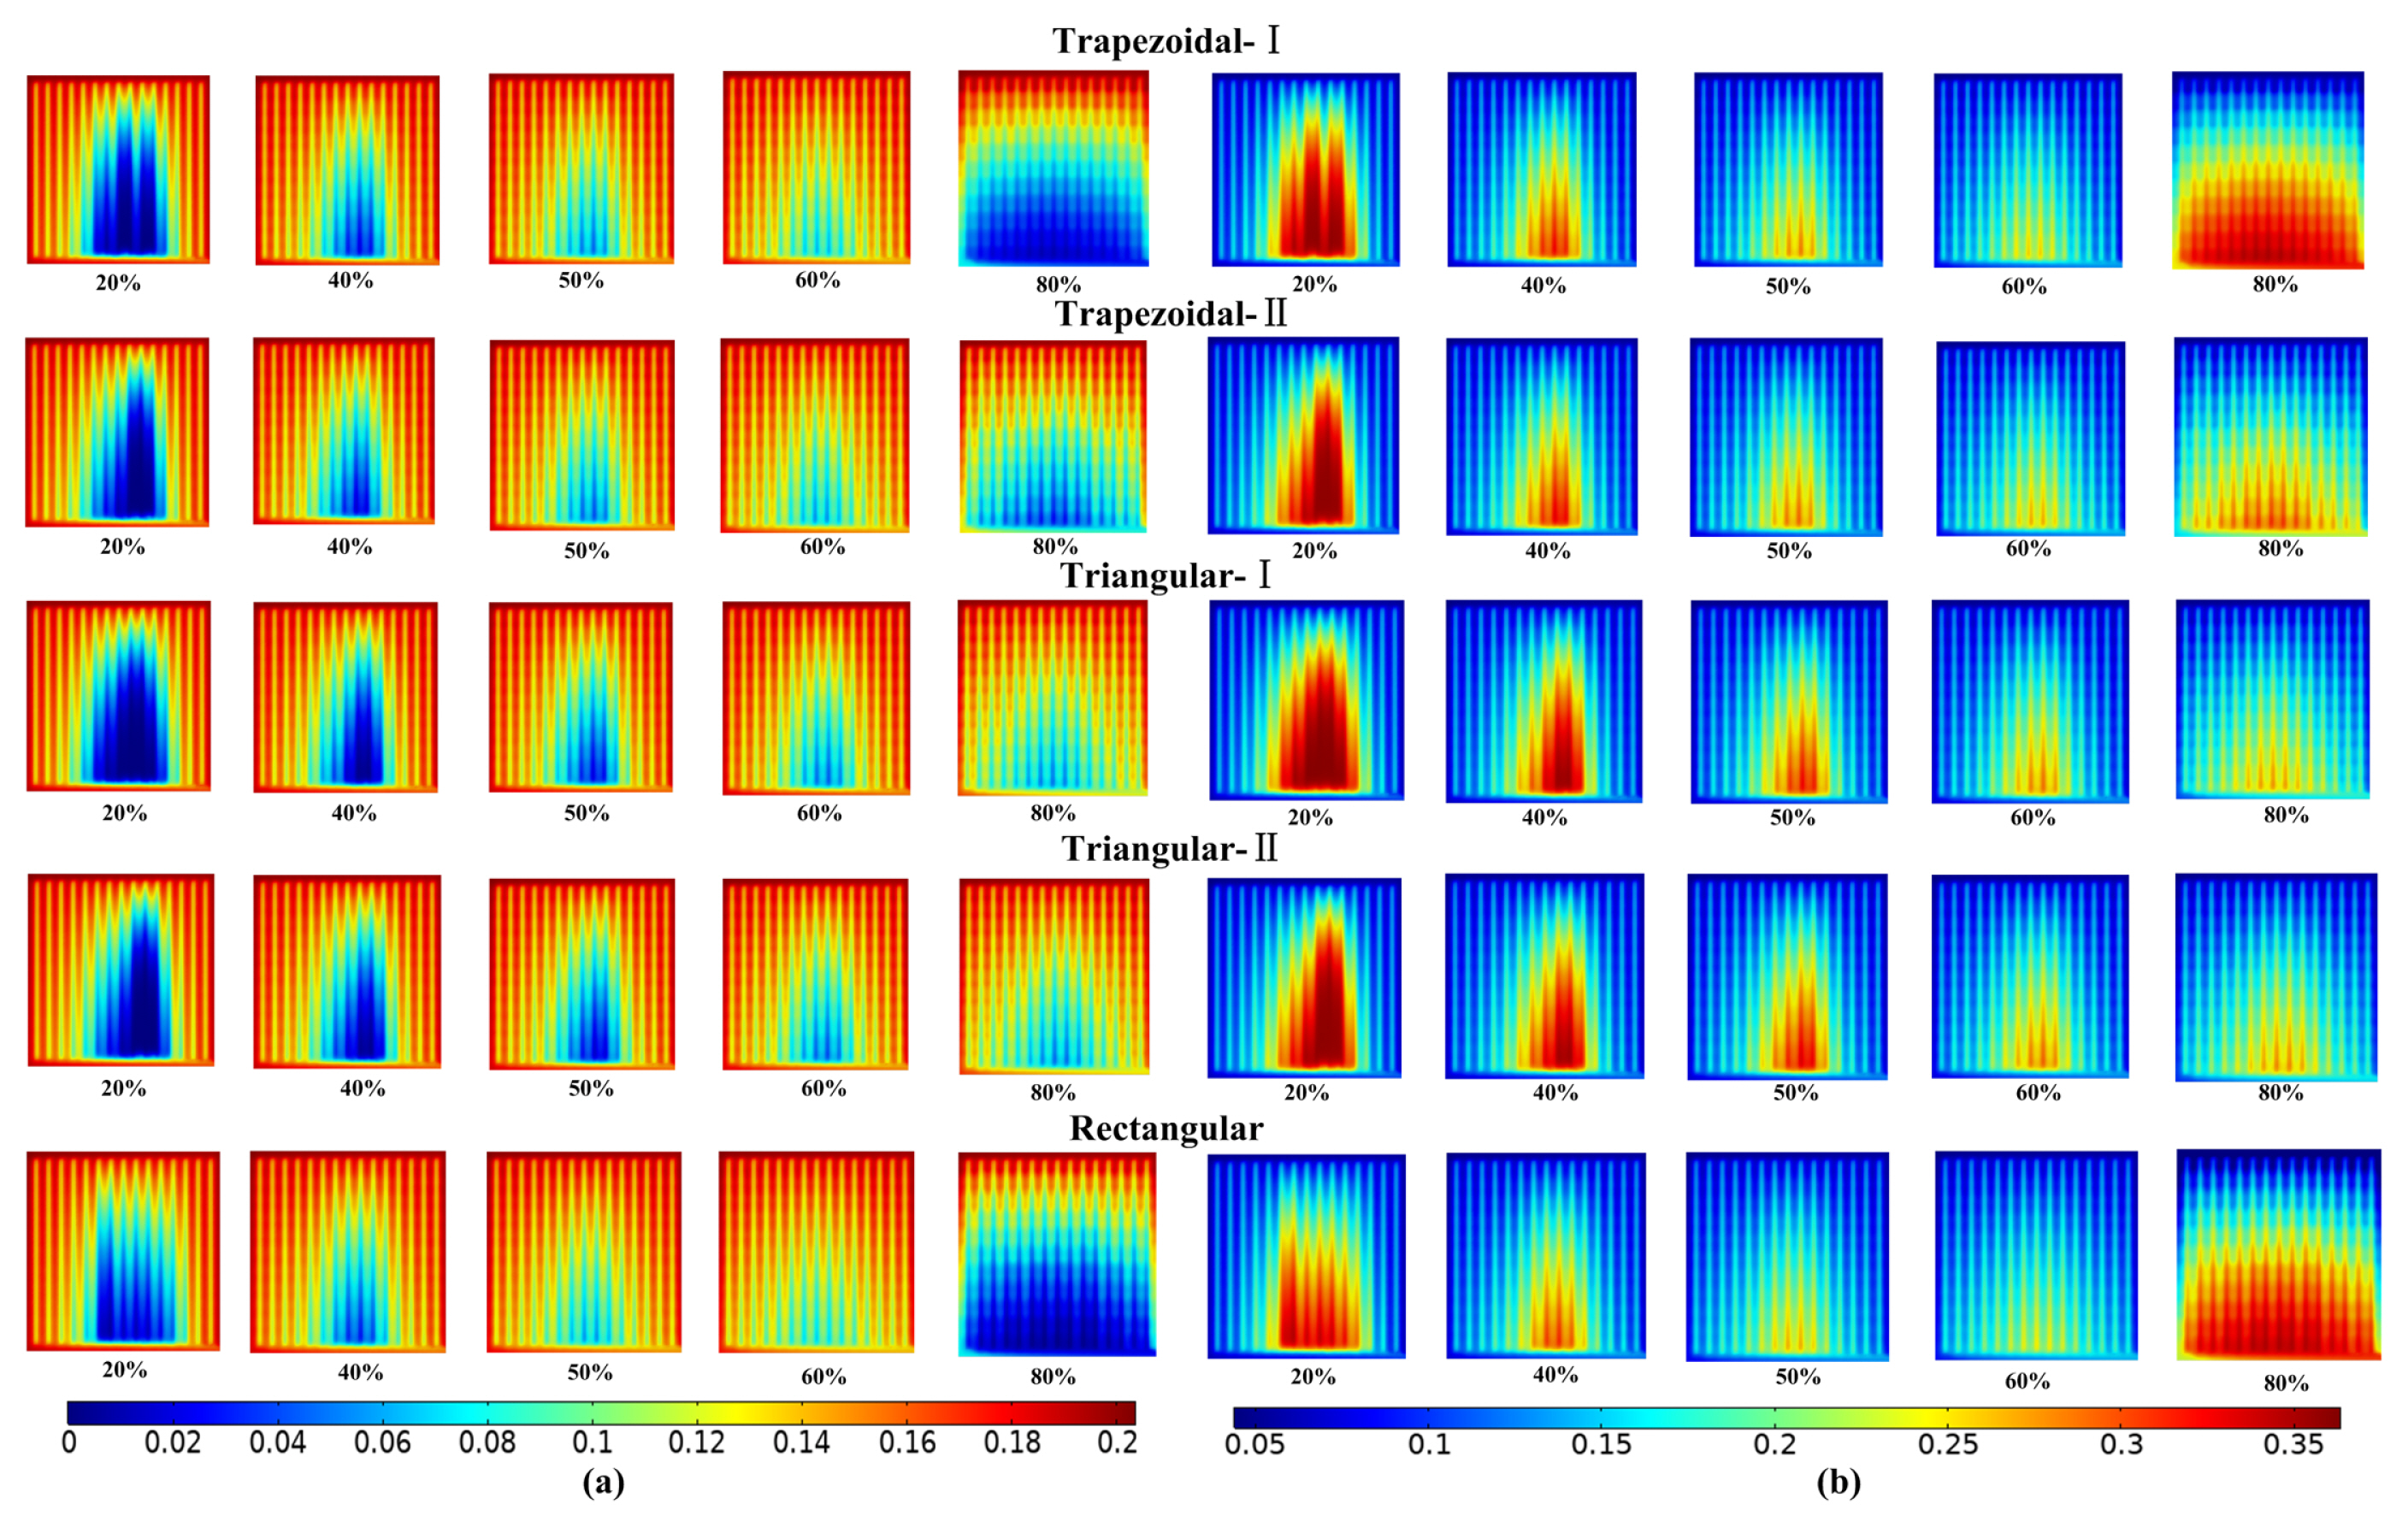
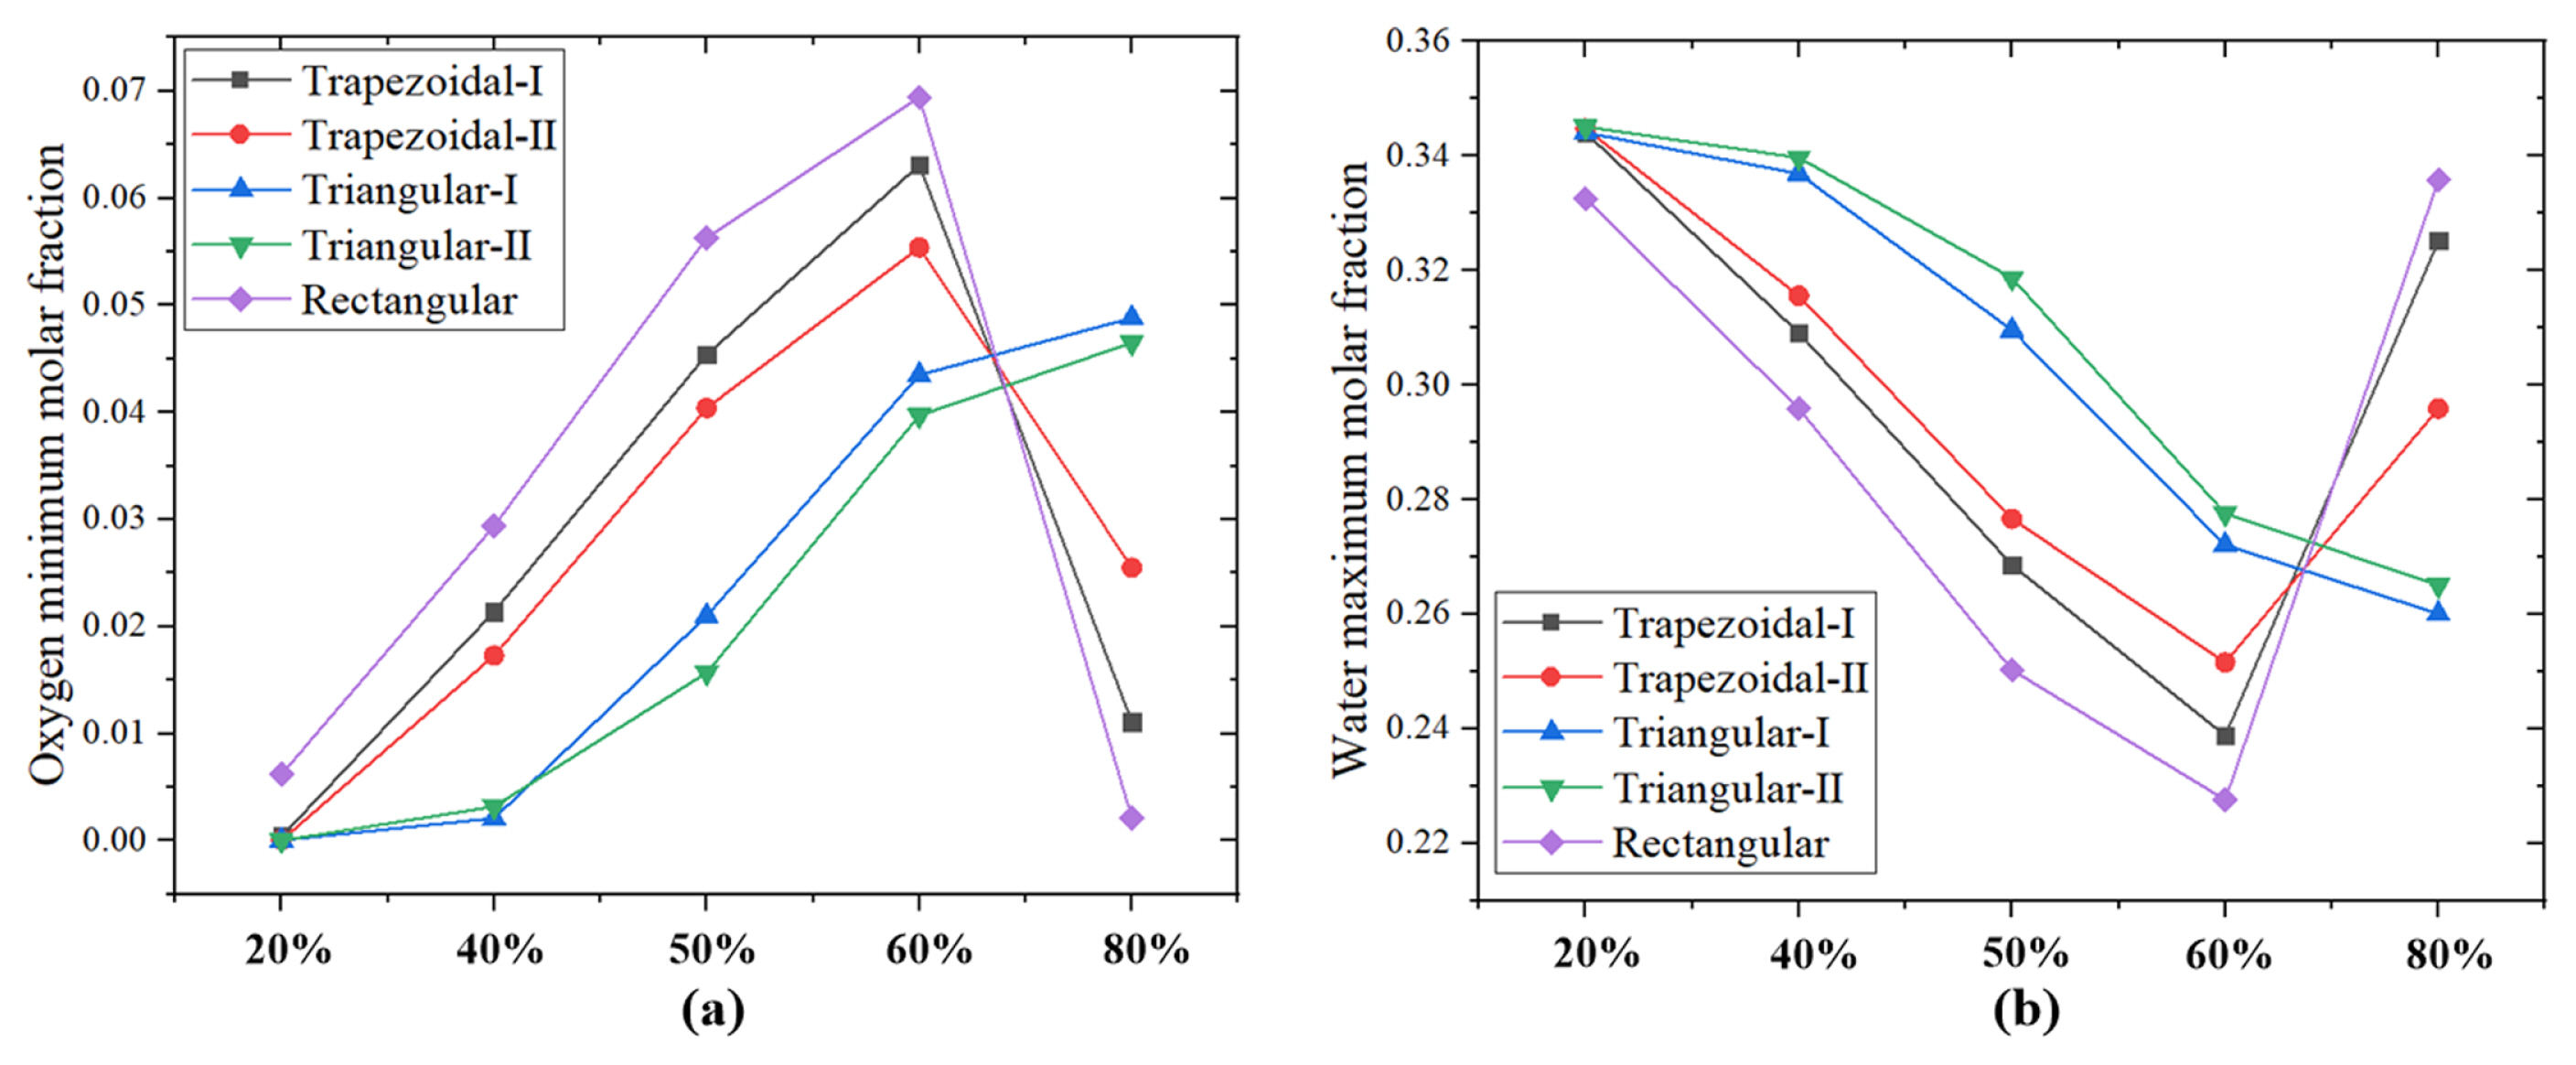
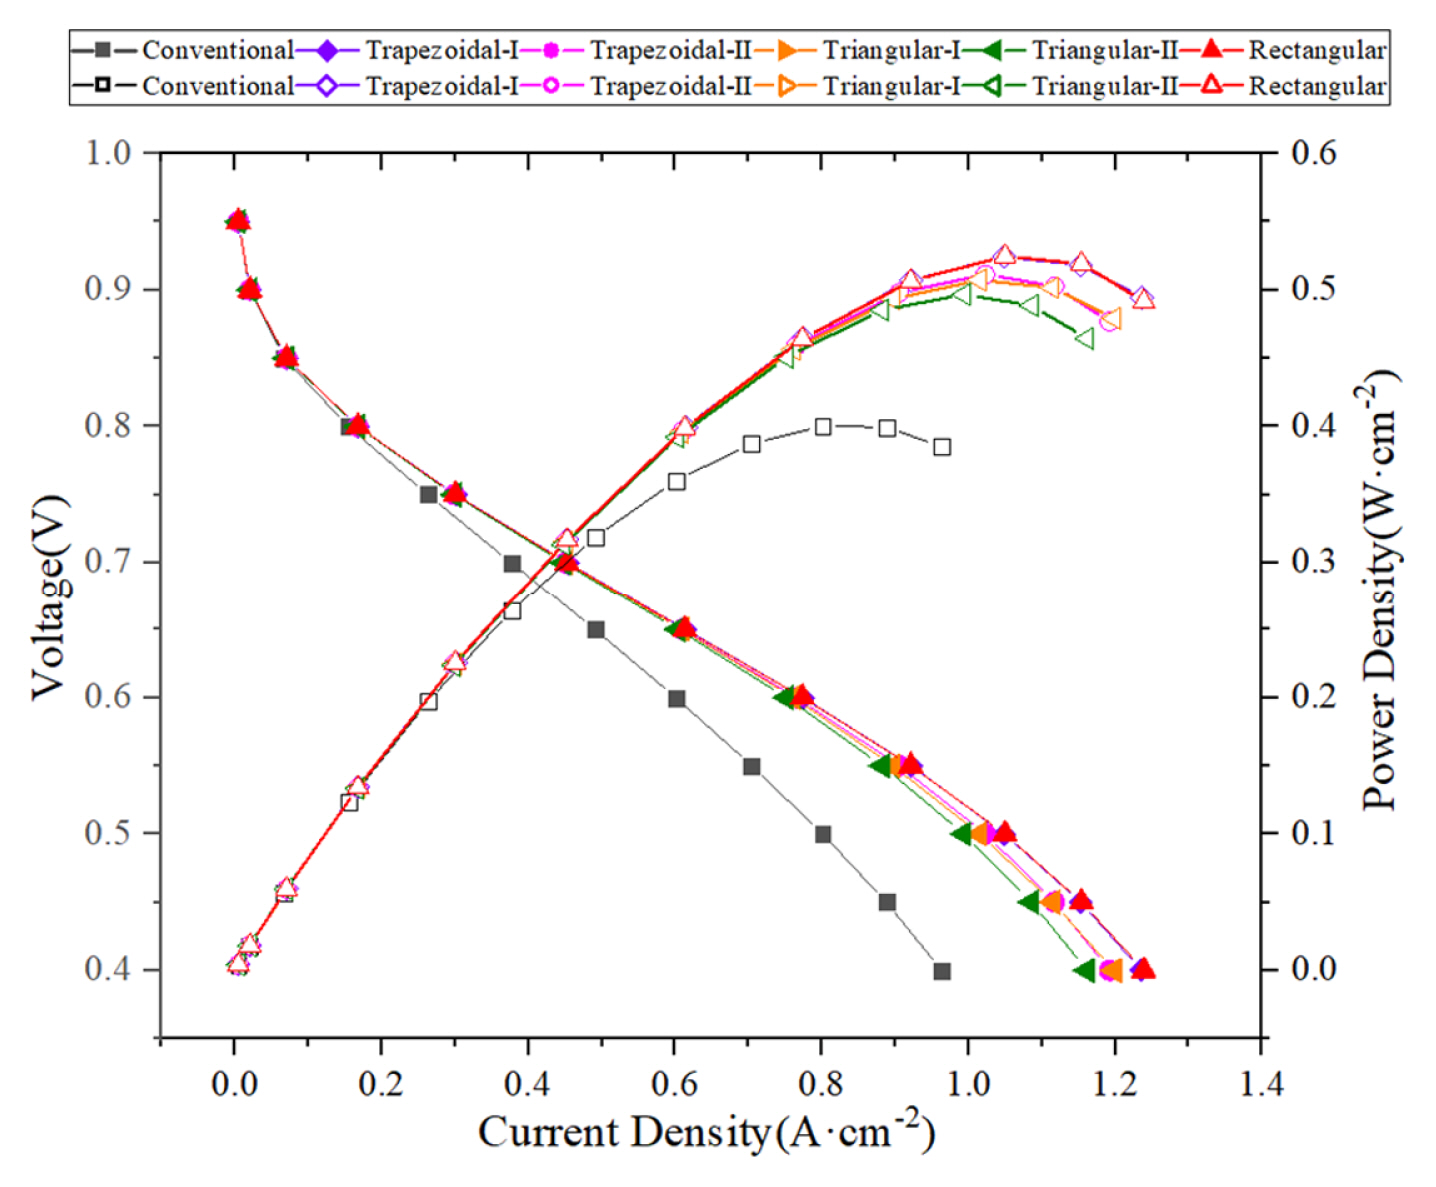
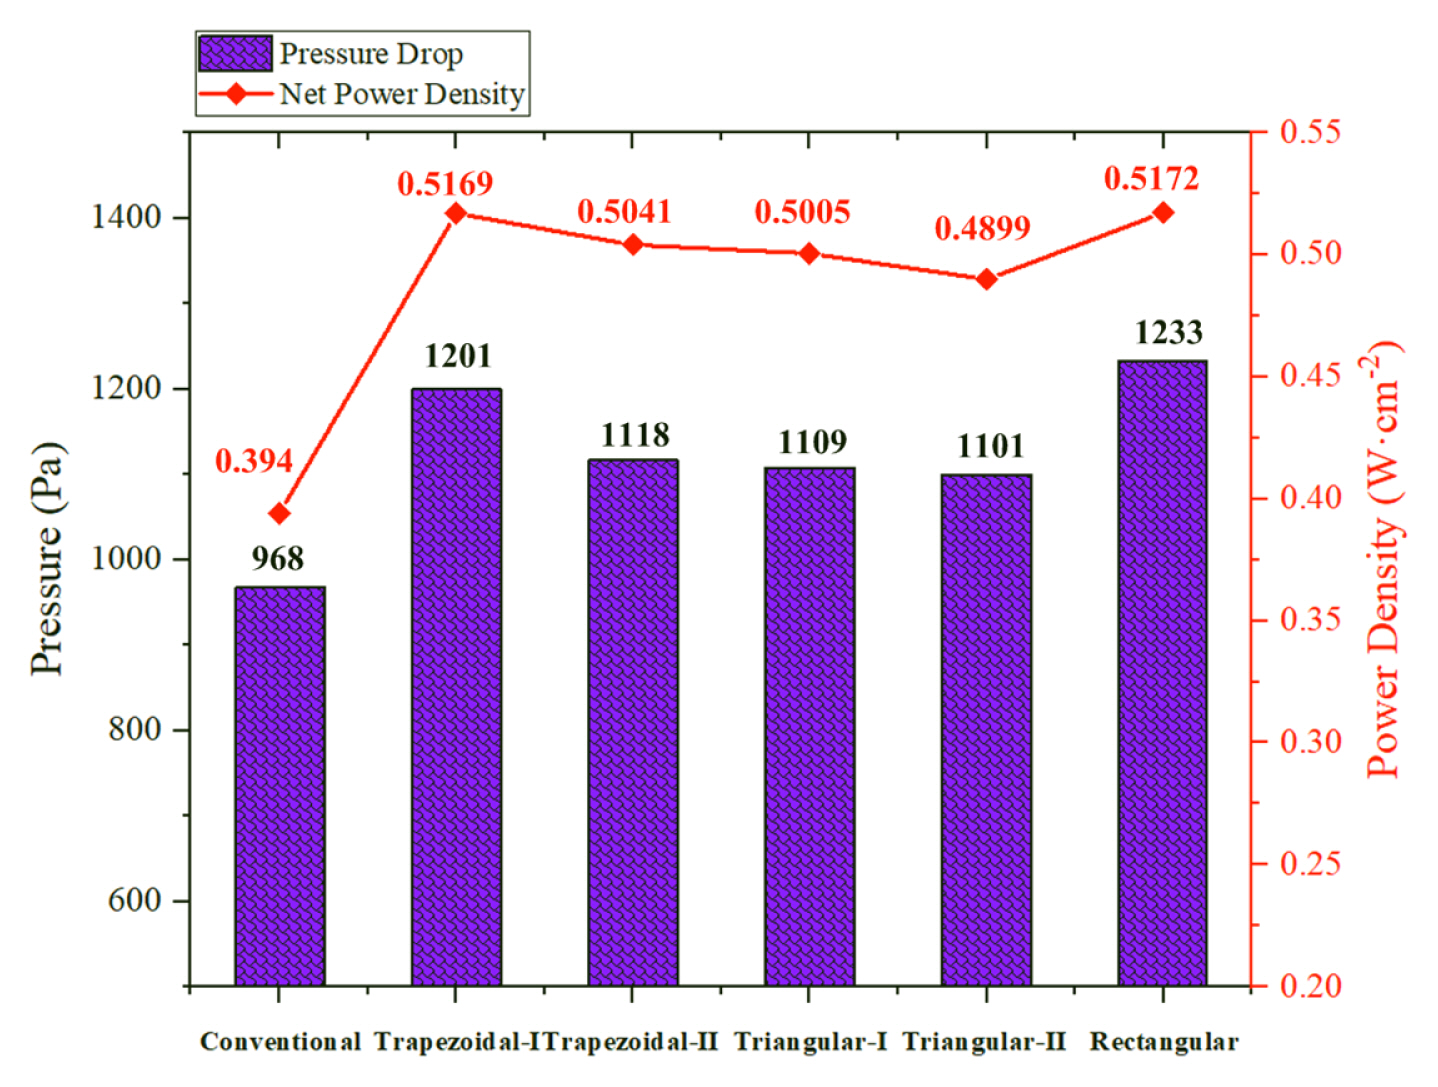
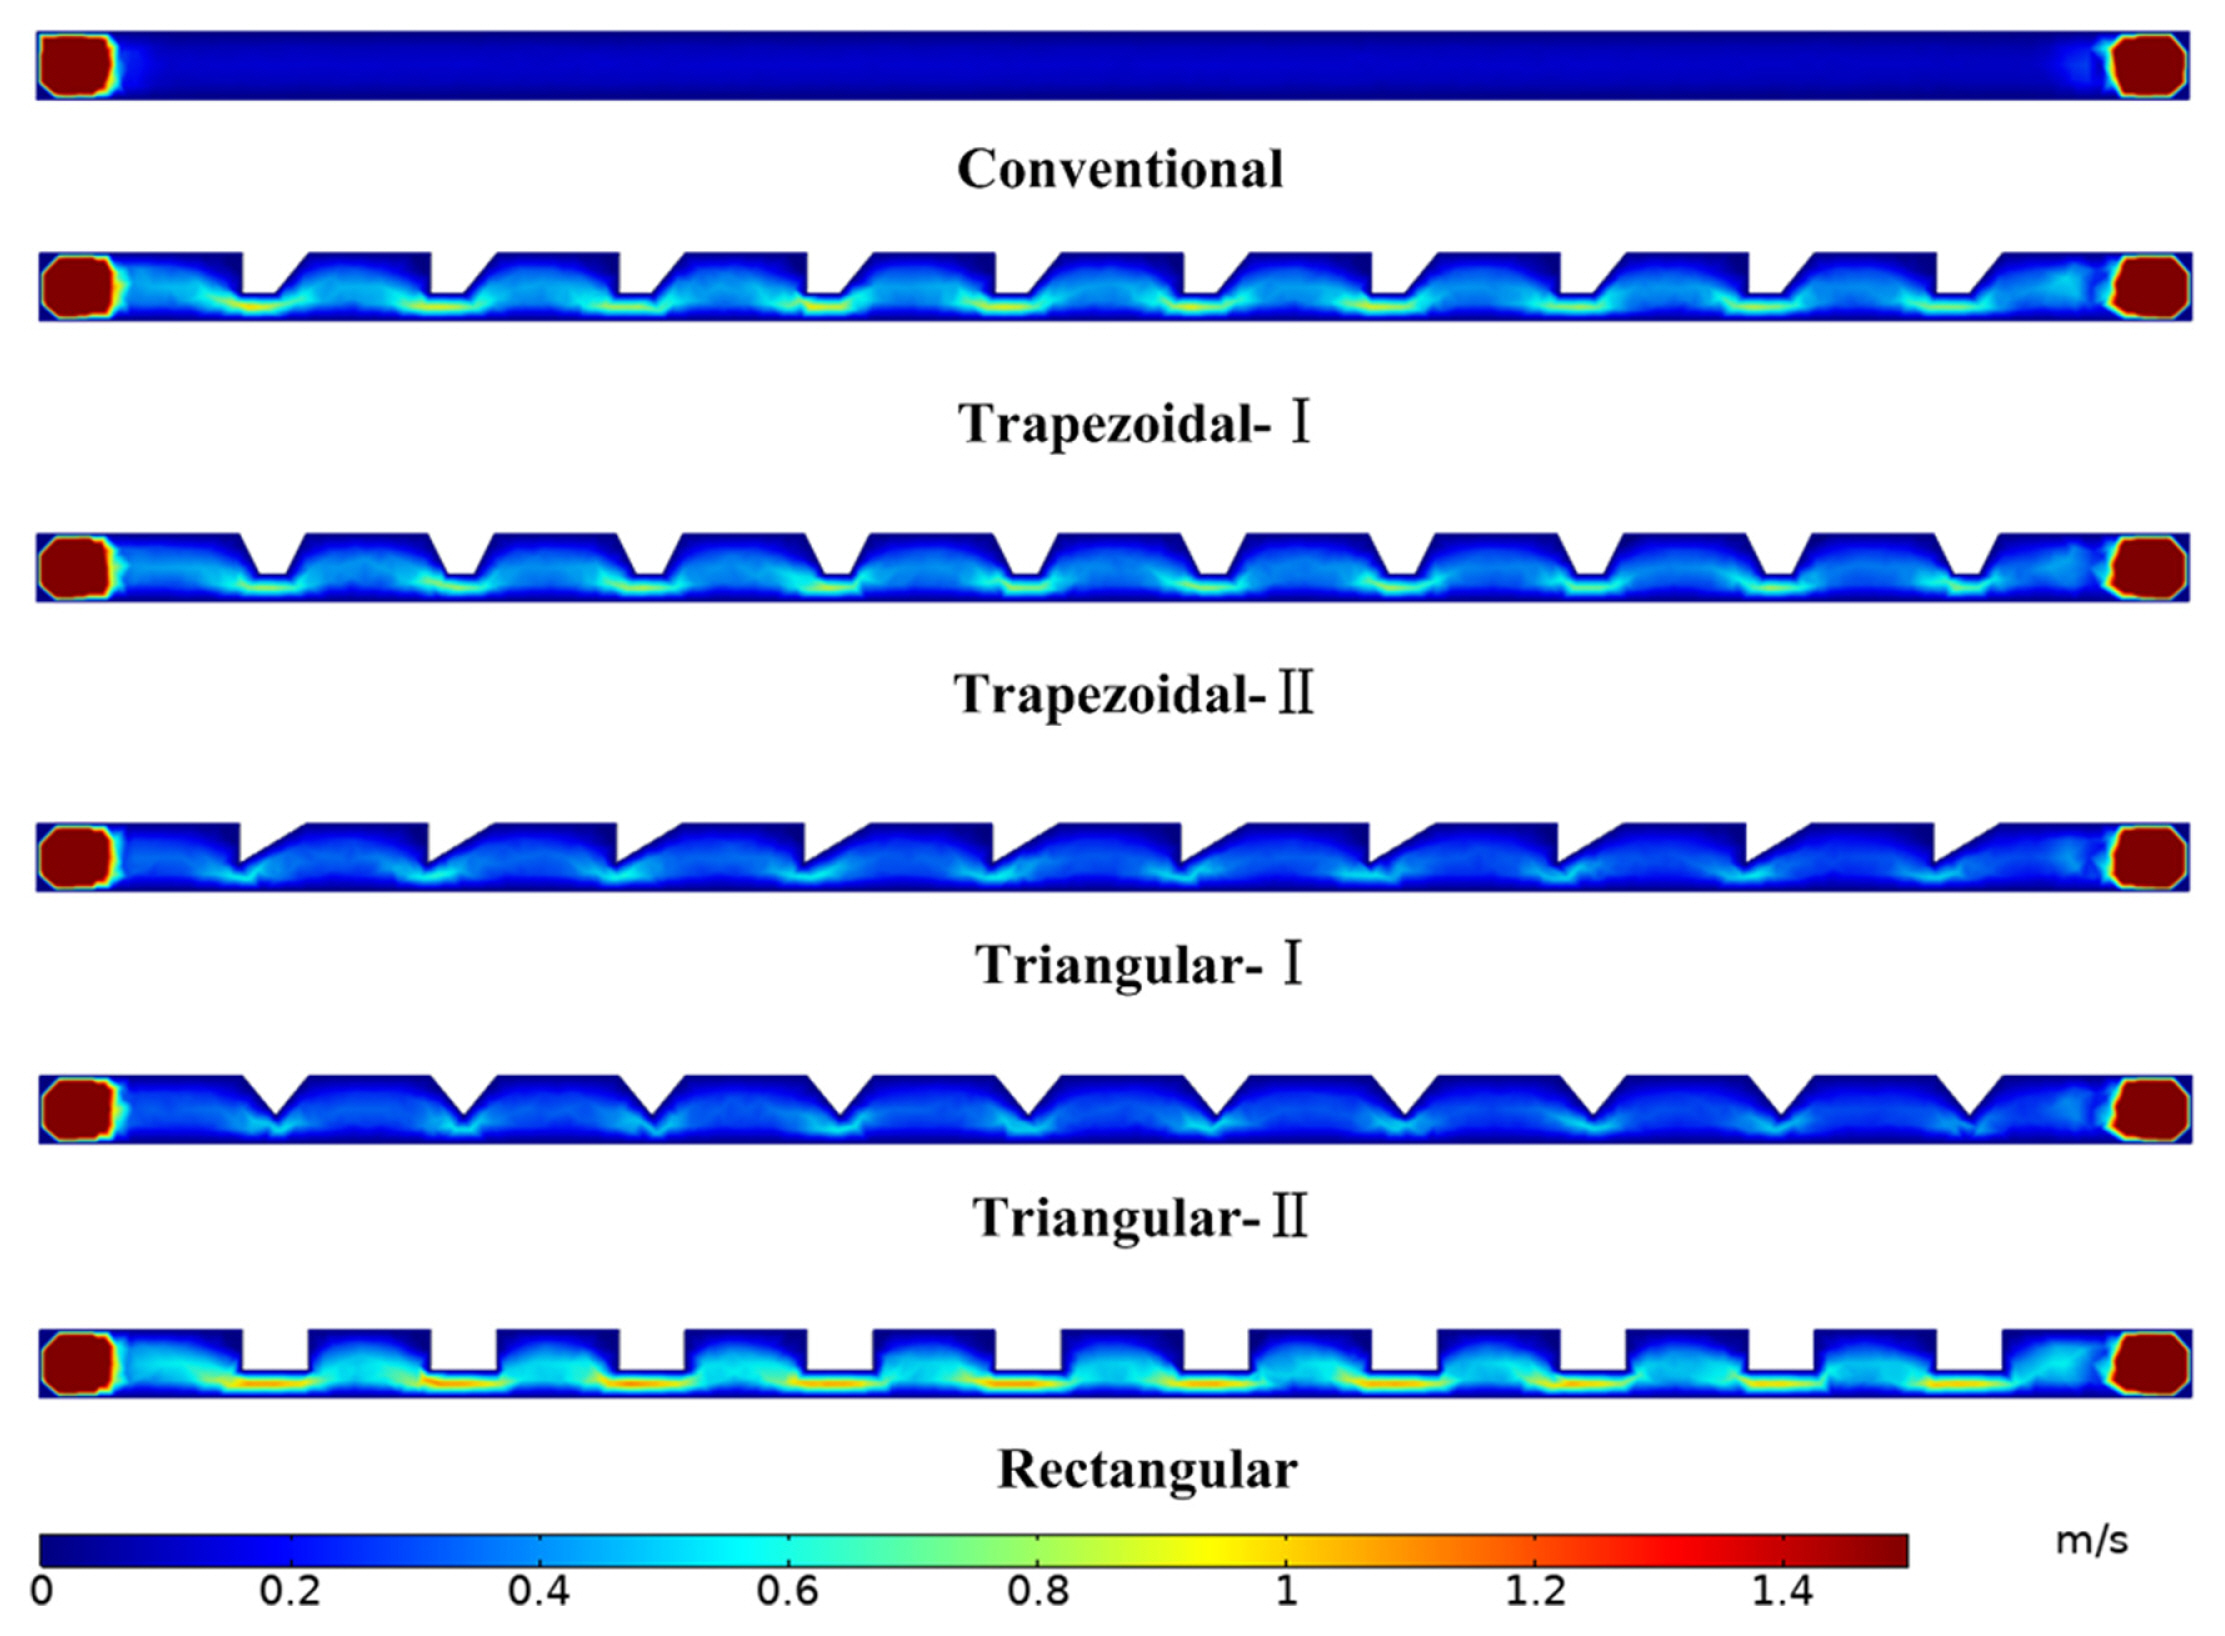
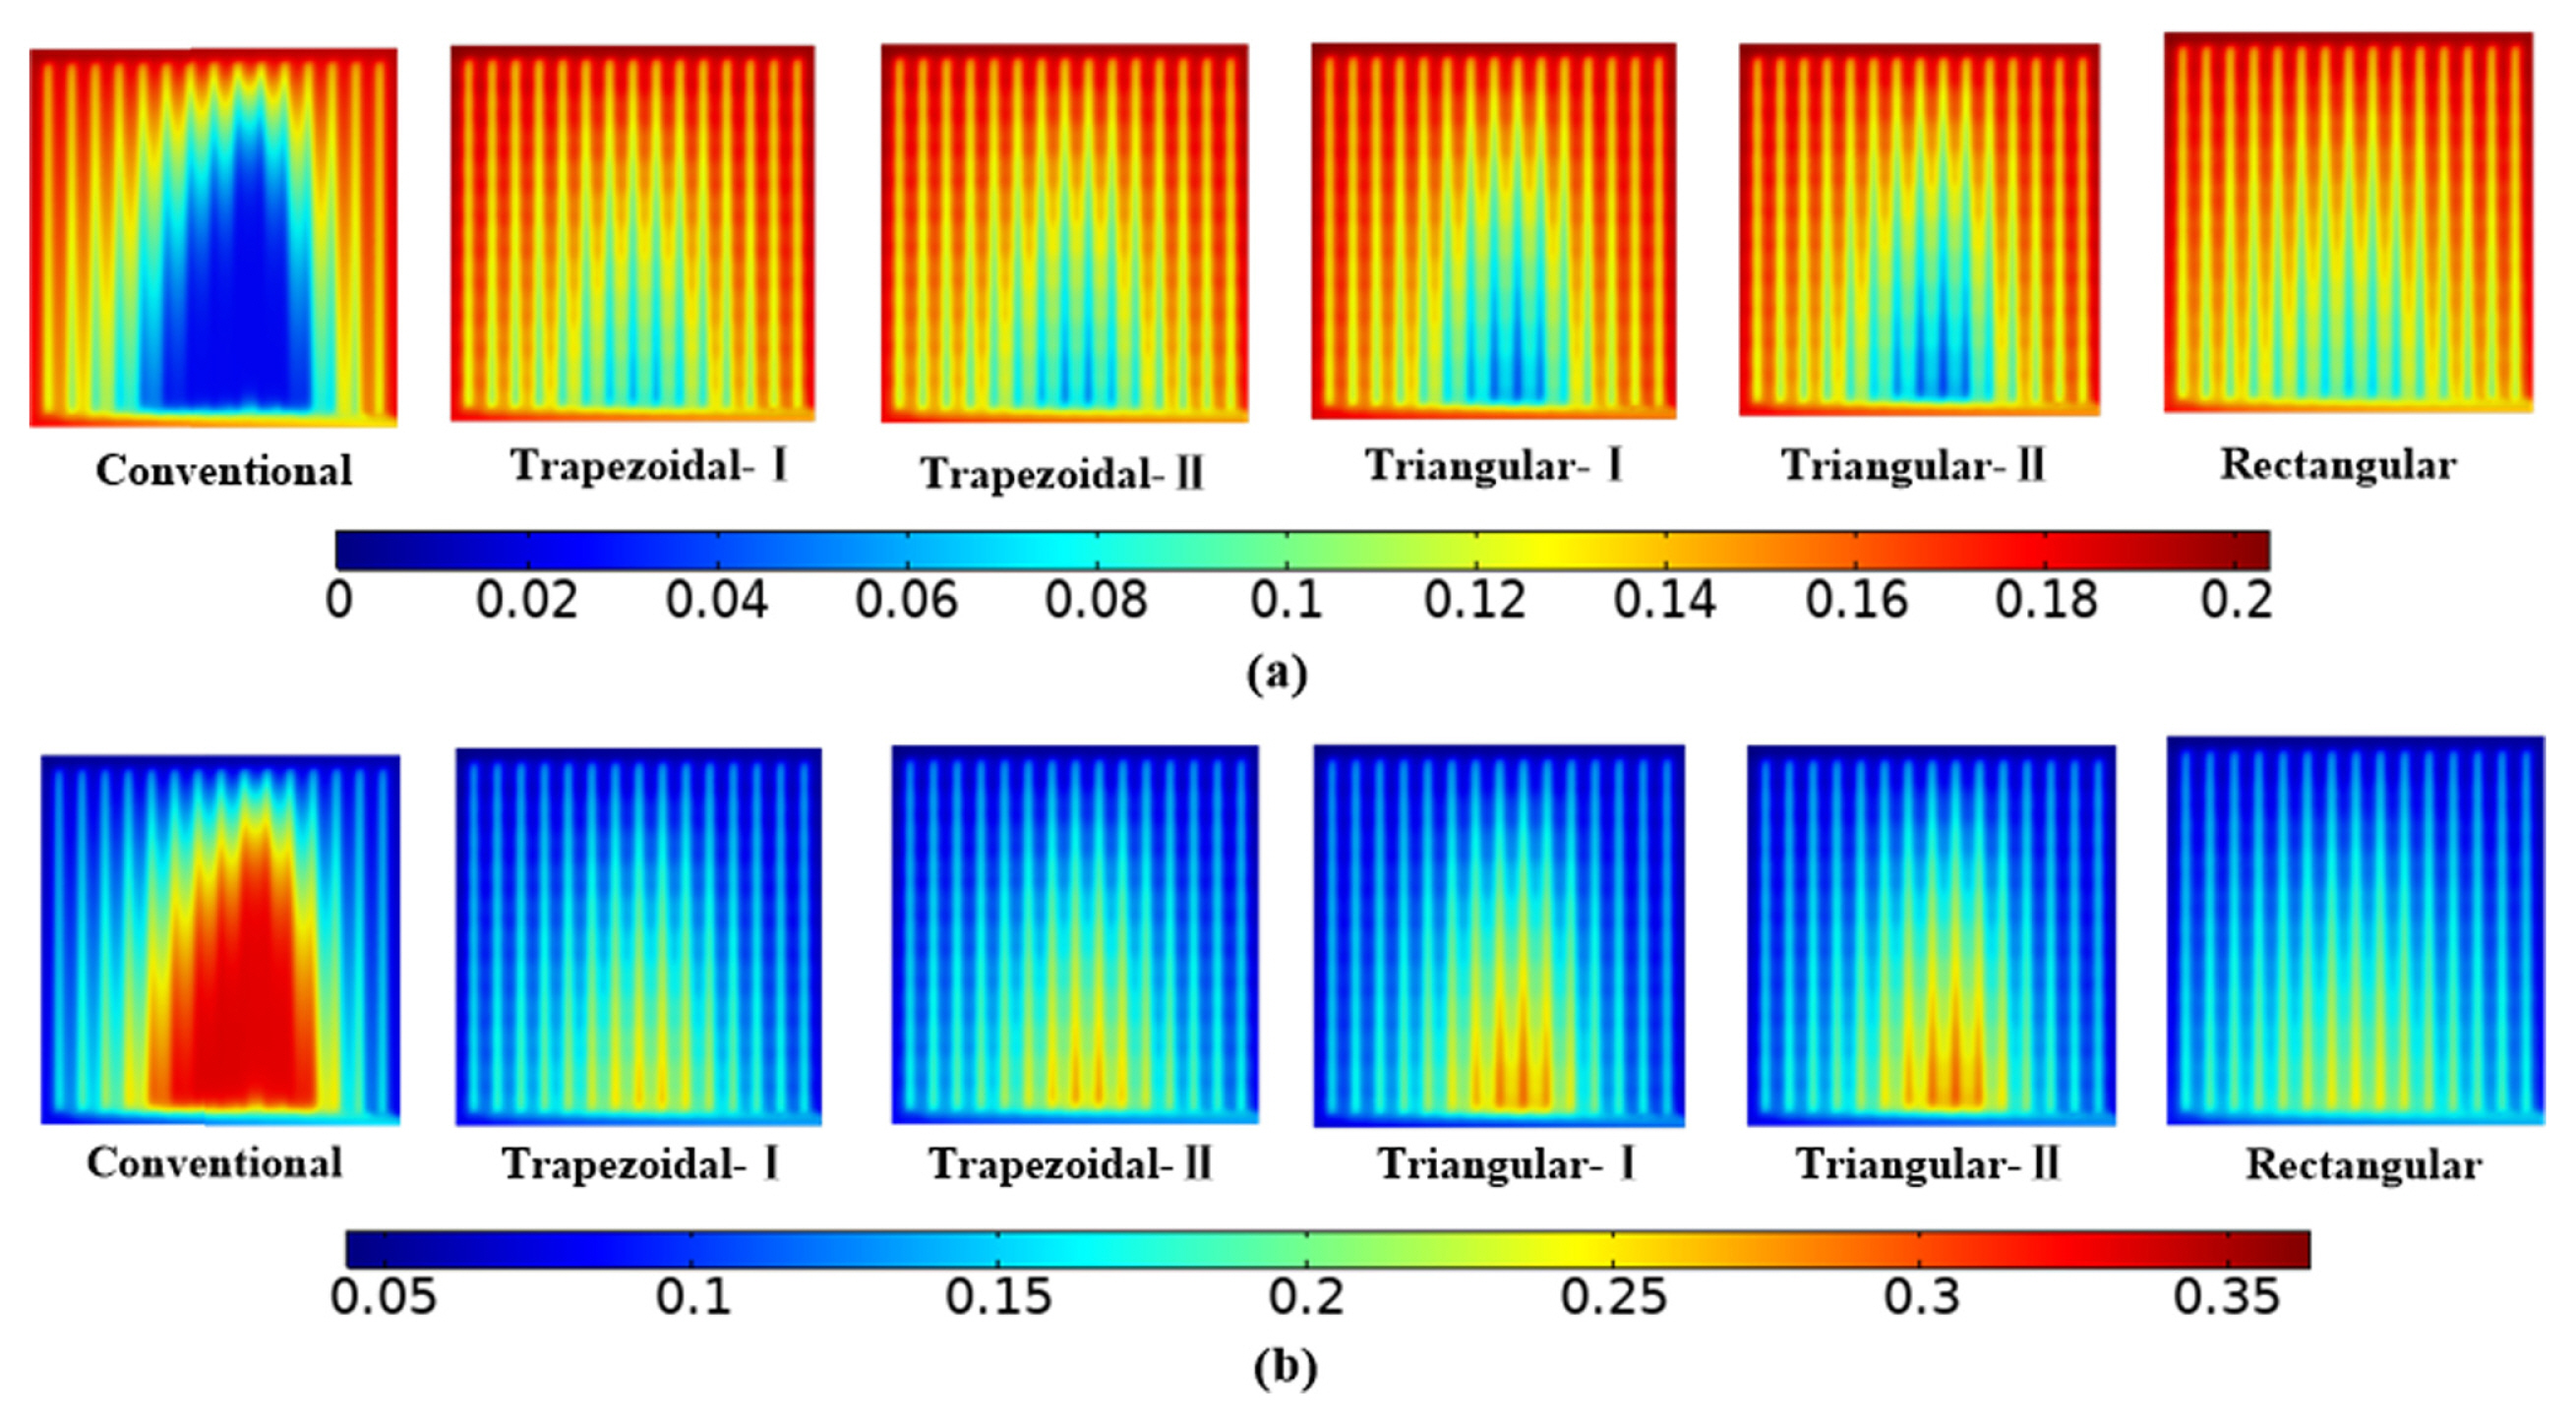
The blocking part of the obstacle was the main factor affecting PEMFC mass transfer. The size of the blocking part was different with the shape of the obstacle. The larger blocking part can make the reaction gas produce larger normal velocity, so that more reaction gas enters CL through GDL to react. Among the shape schemes in this research, rectangular scheme had the highest output performance and the most uniform distribution of reactants and products, followed by the trapezoidal scheme and the triangular scheme.
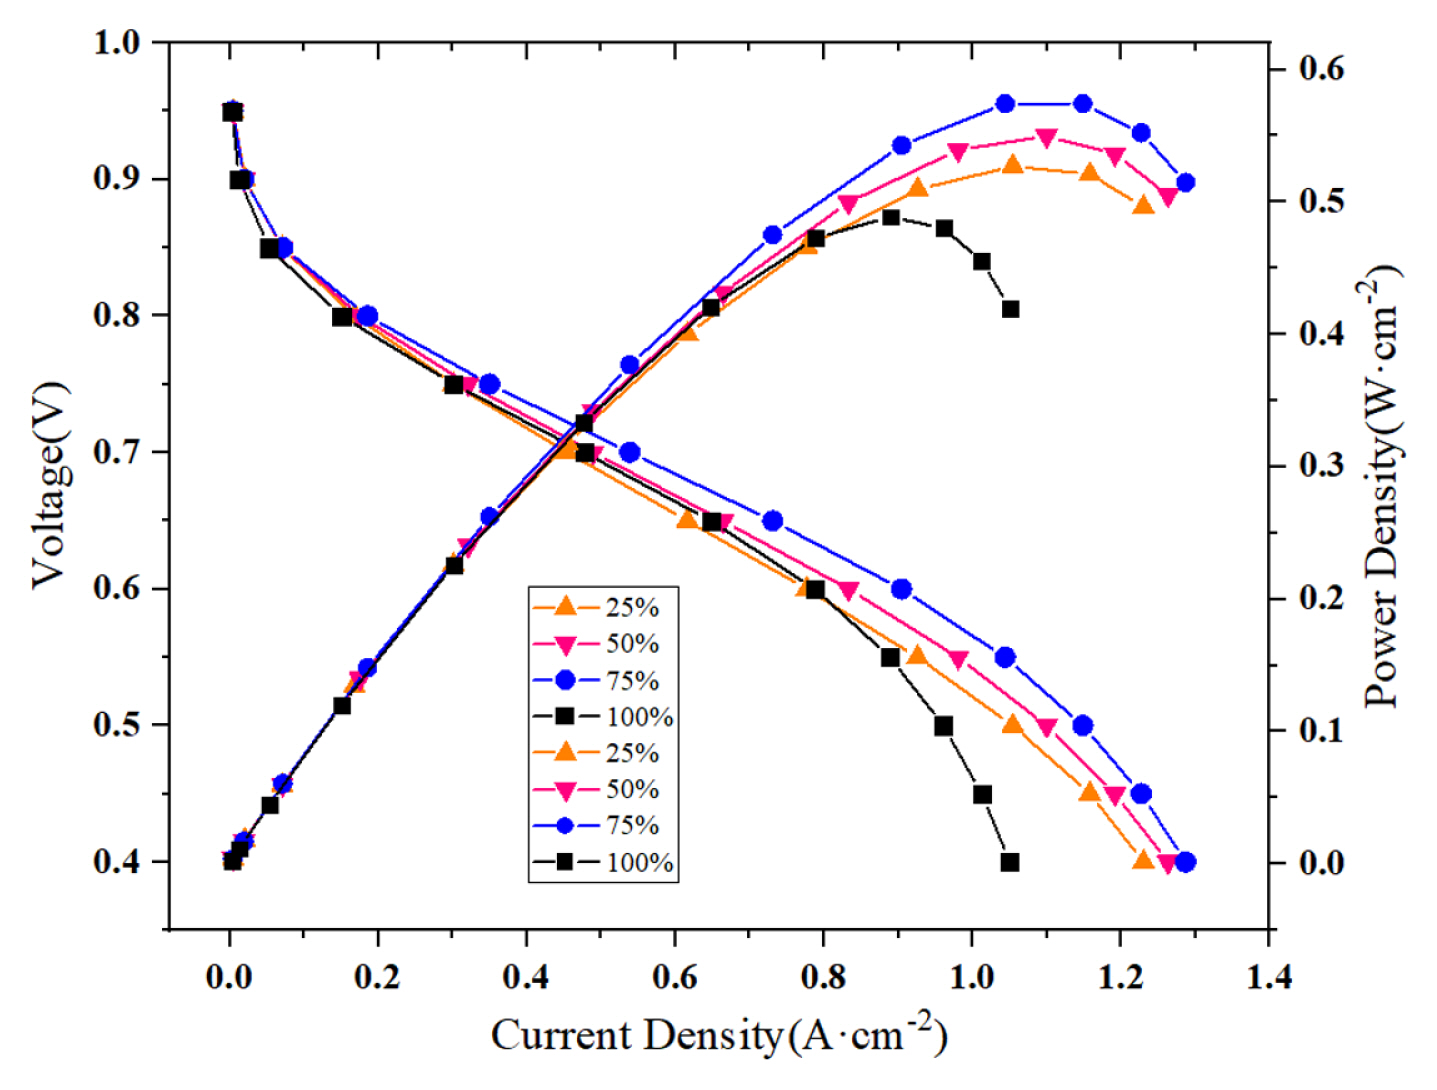
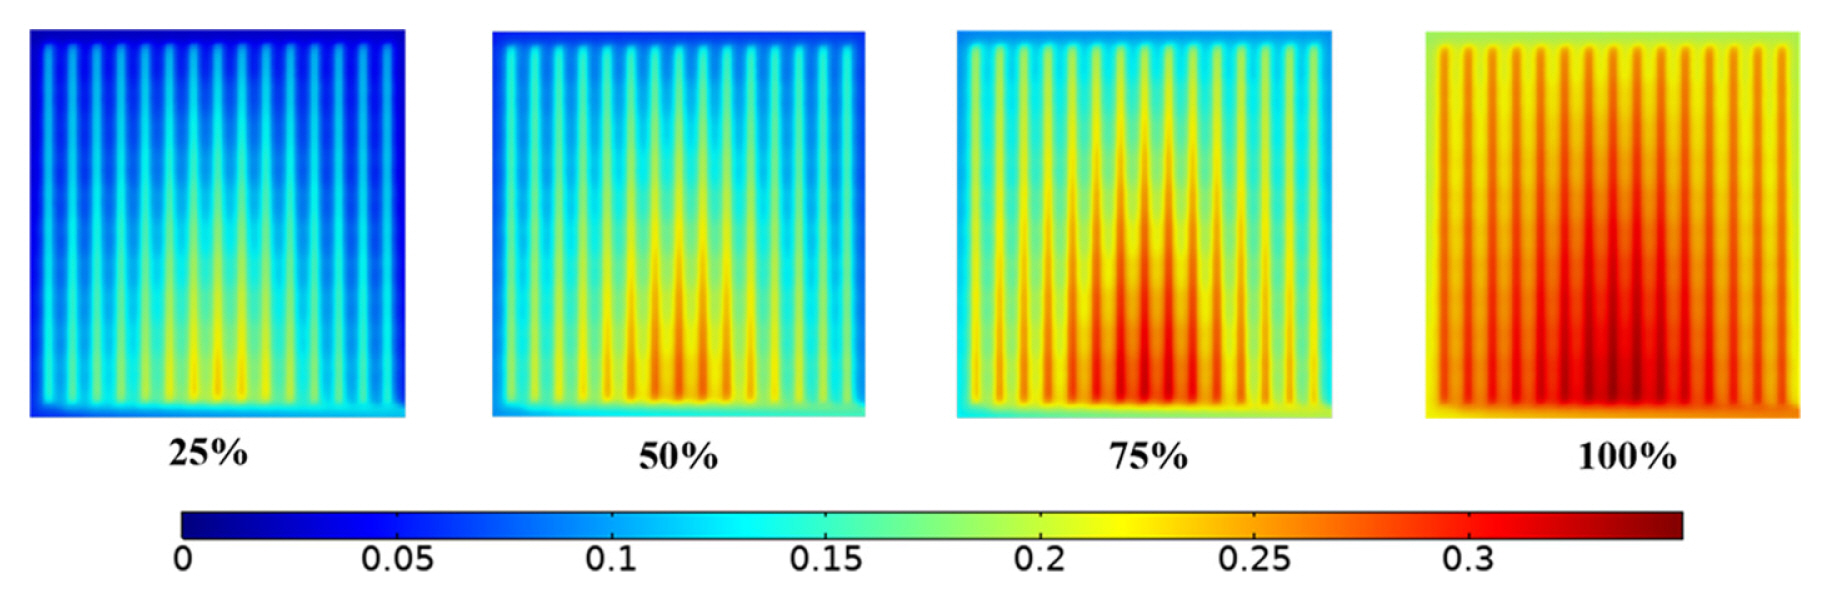
The degree of channel blockage significantly affects PEMFC performance, appropriate blockage of channels by obstacles will significantly improve PEMFC performance. However, excessive blockage will not only reduce the performance, but also damage MEA. In this paper, all obstacle schemes had the best performance when the degree of blockage was 60%, rectangular and trapezoidal obstacle scheme was obviously worse when the degree of blockage reached 80%. Although fuel cell output characteristic decreased when the triangle obstacle was blocked by 80%, the mass transfer effect improved. Rectangular obstacle scheme had the best output performance when the channel was blocked by 60%, which was 29.2% higher than traditional scheme.
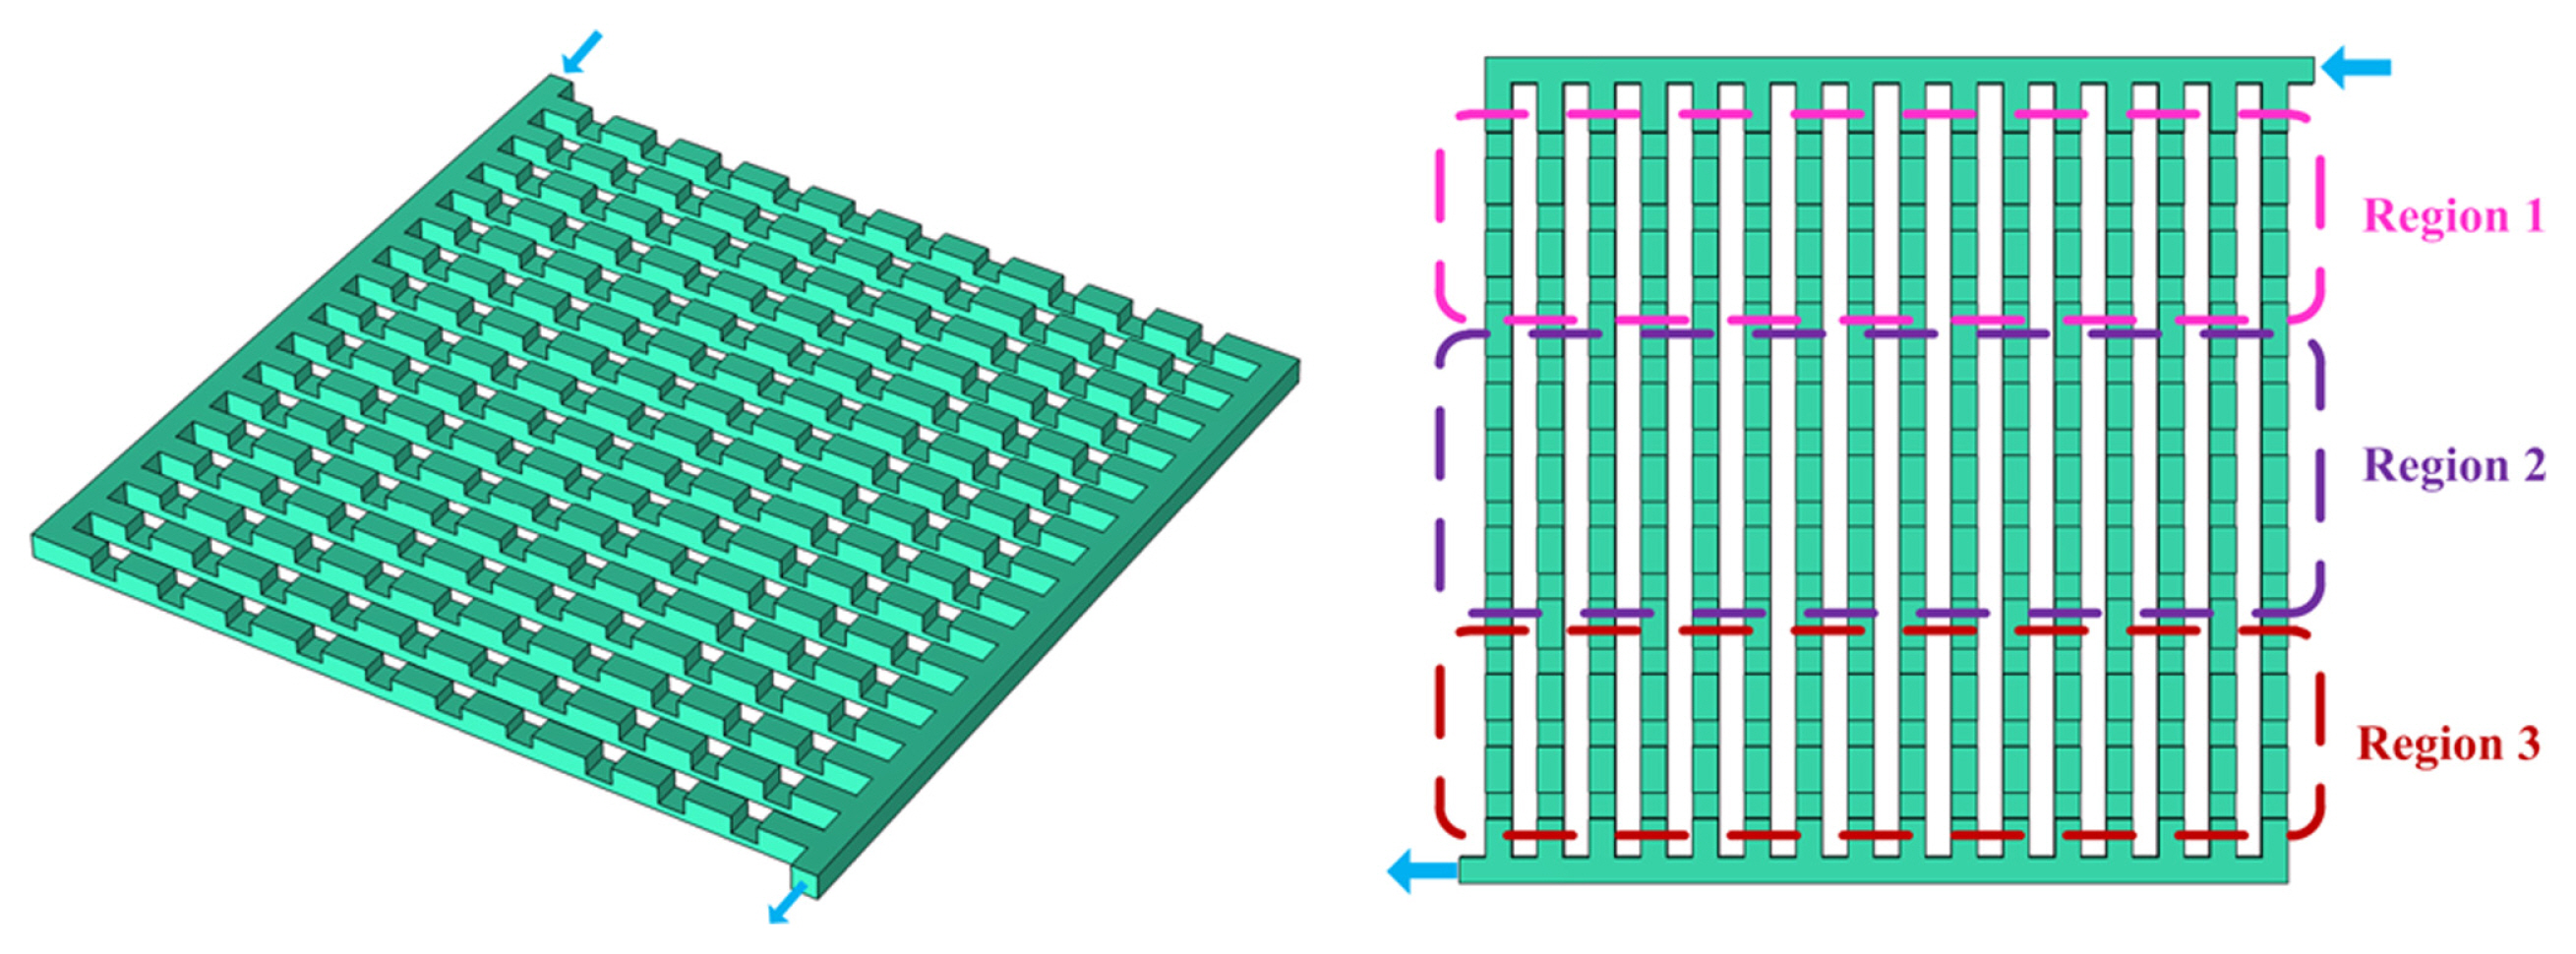
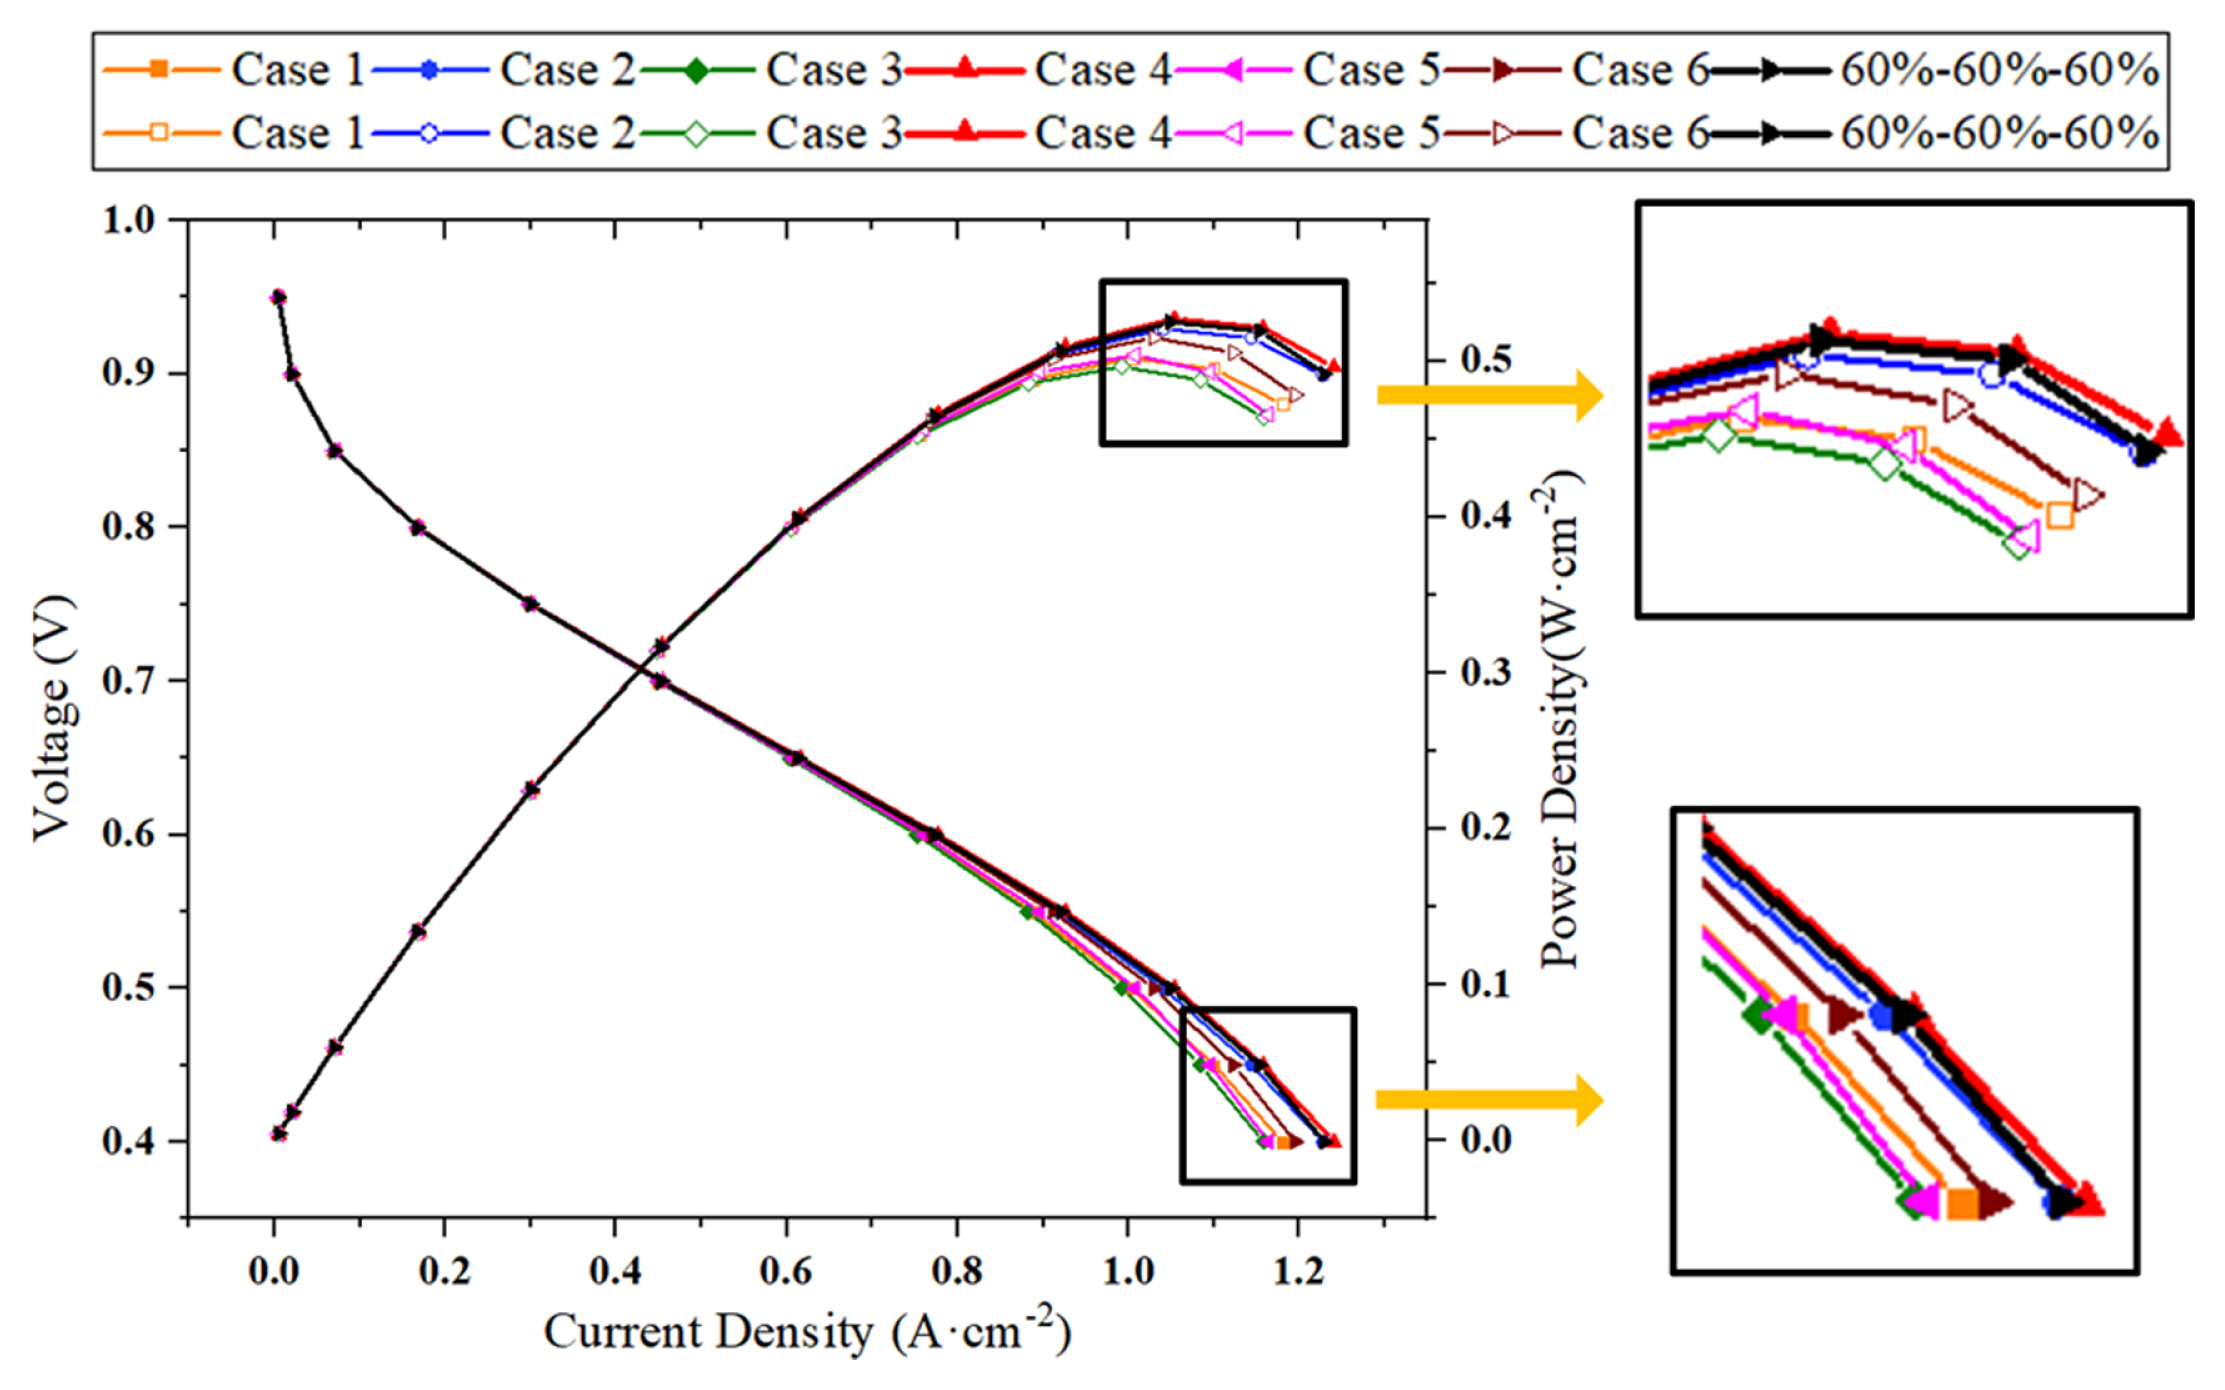
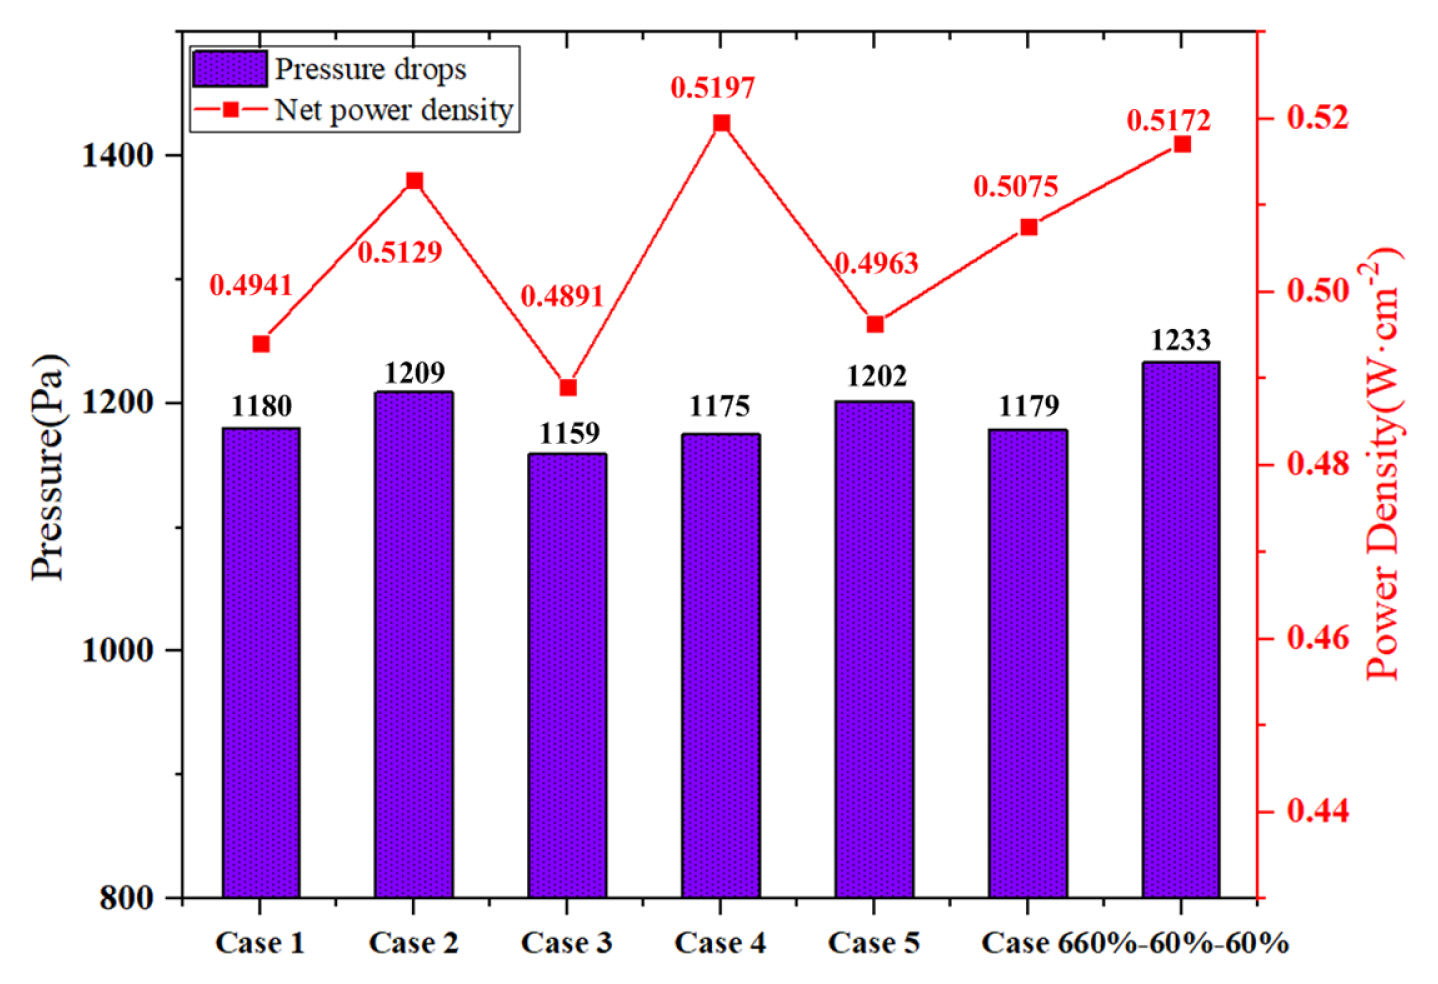
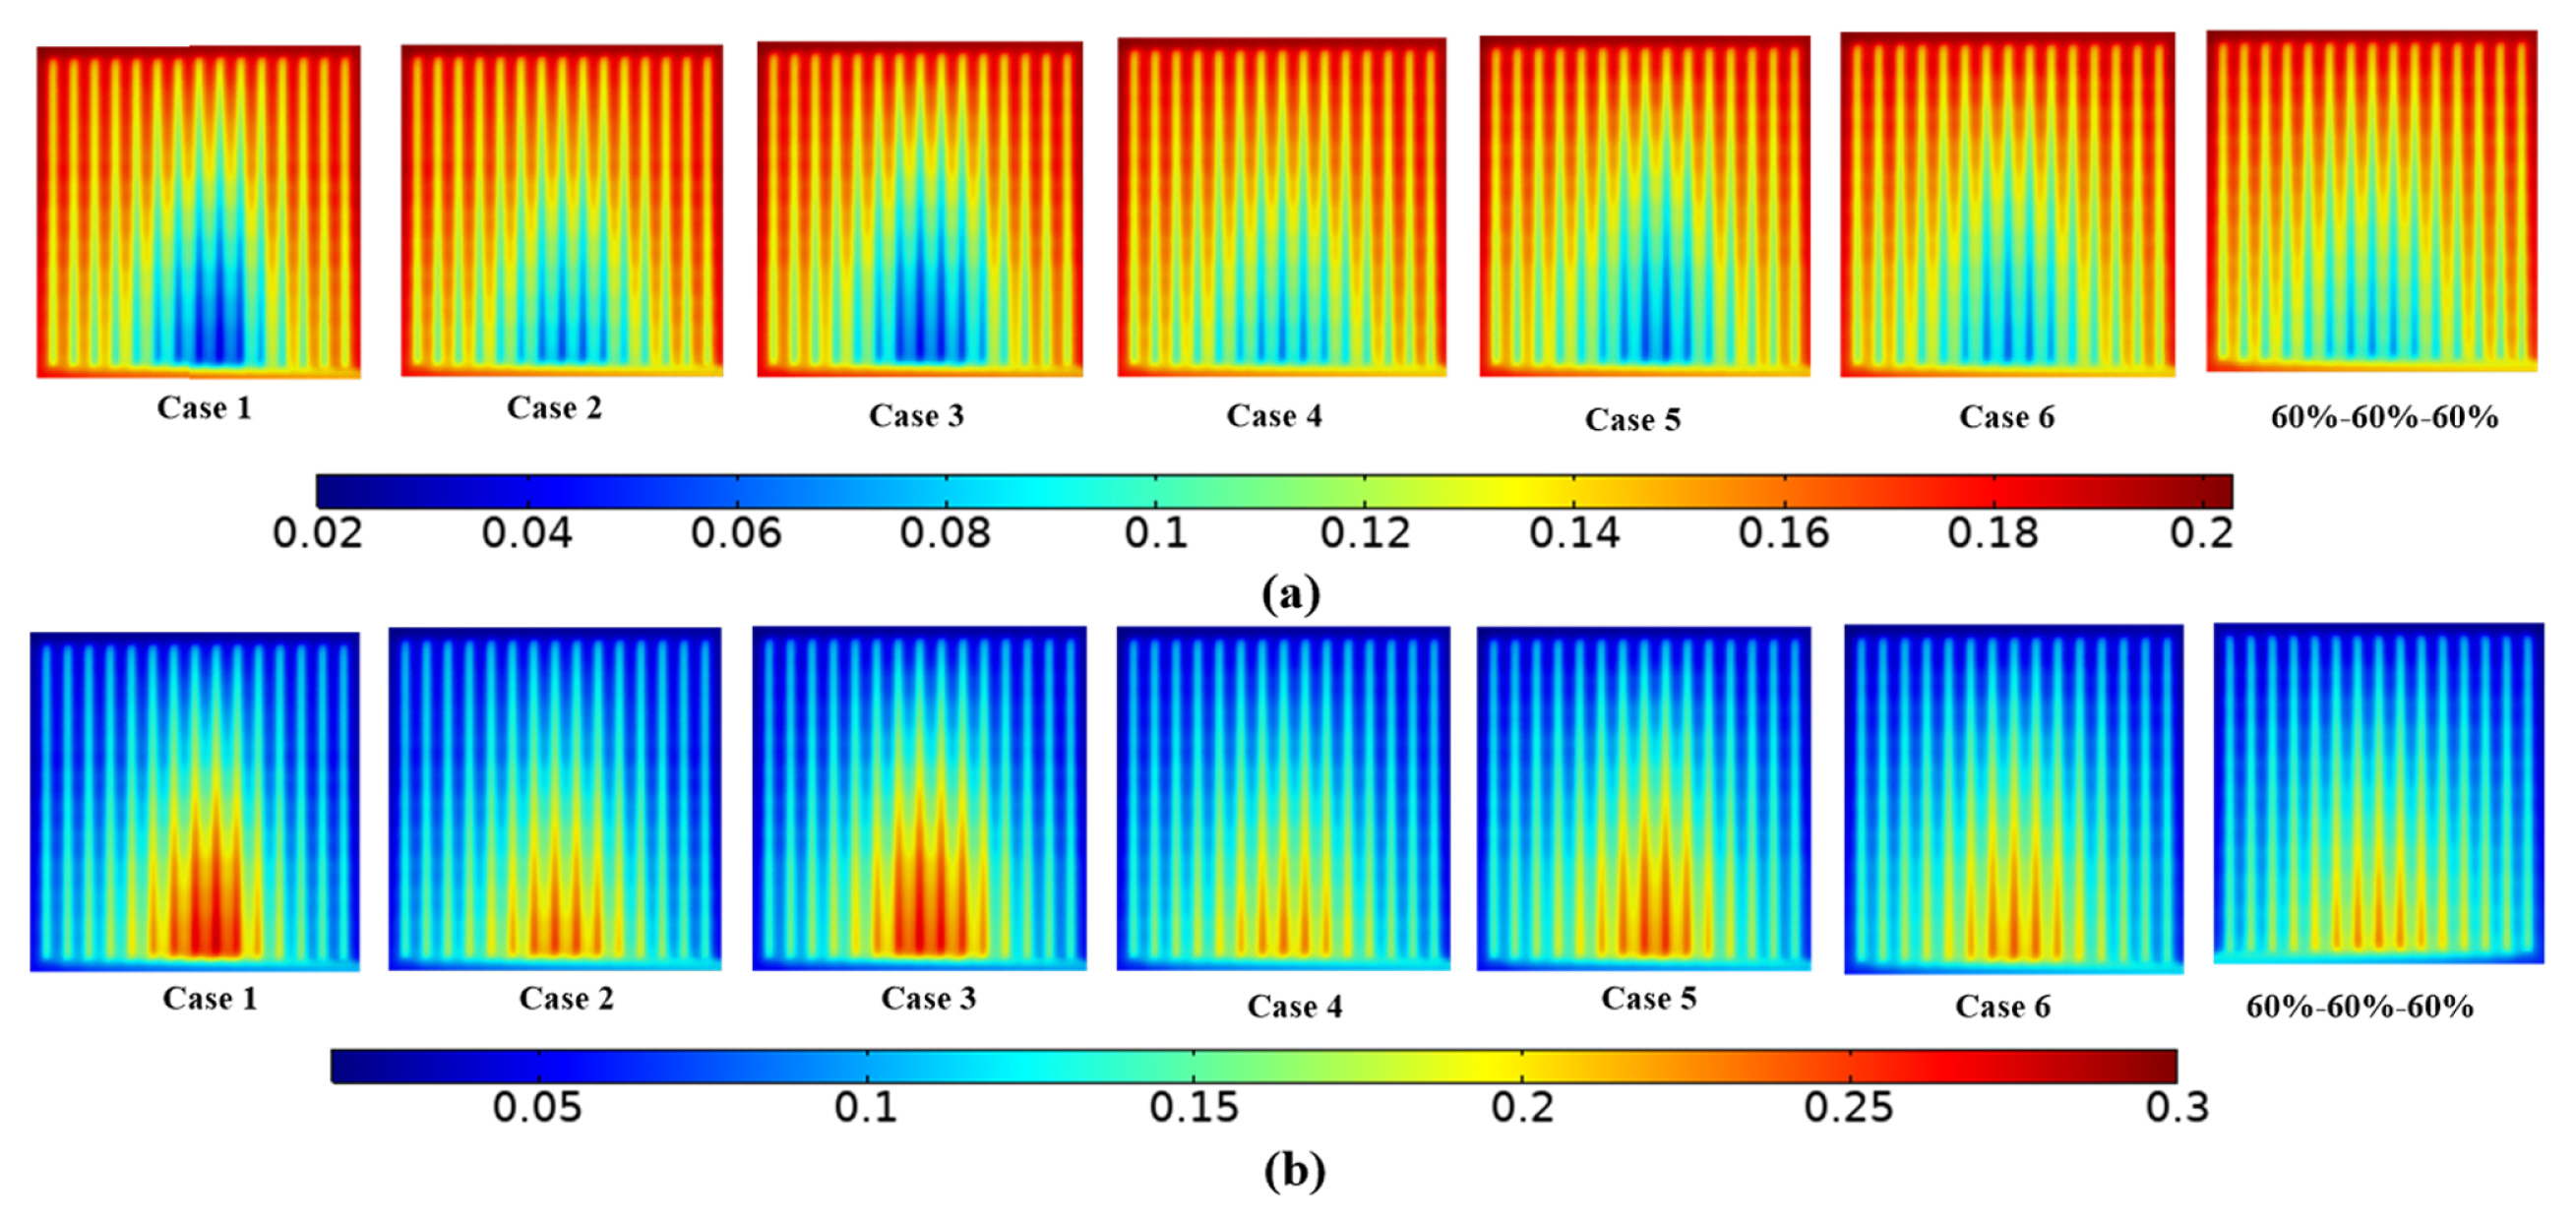
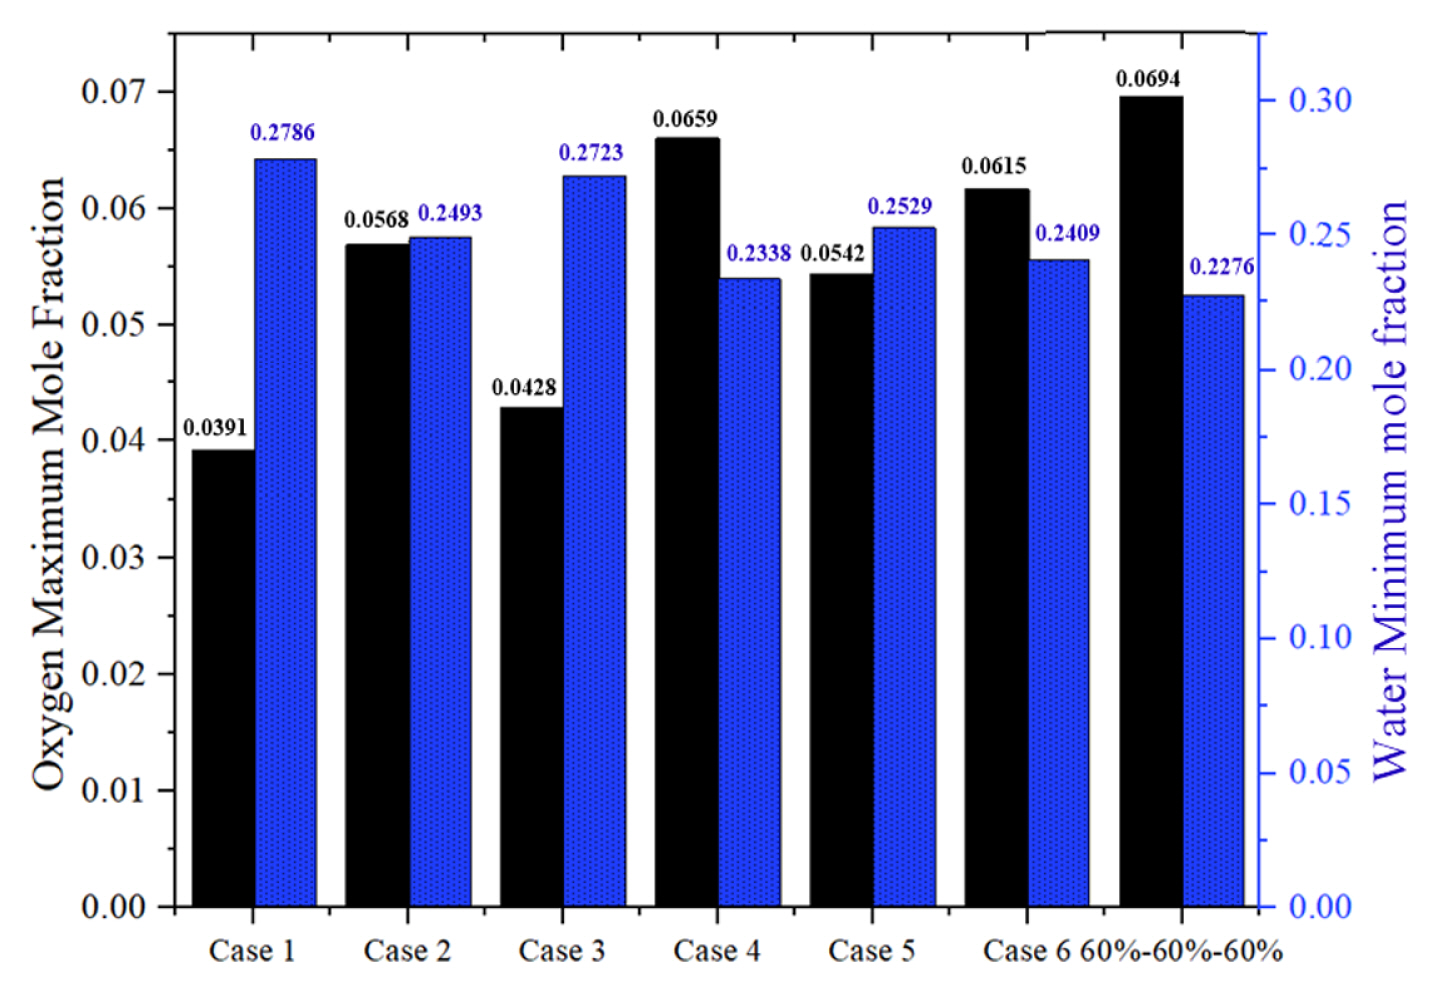
The regions of the obstacle height had certain influence on PEMFC performance. The regions that determined PEMFC electrochemical performance were mainly region 2 and region 3. The 60% blockage degree in region 2 and region 3 can obtain higher net power density and better mass transfer. The region 1 was close to inlet end, so the gas flow rate in region 1 relatively large, and the reaction gas can fully react, so the degree of blockage in region 1 had little effect on the electrochemical reaction process. On the whole, the mass transfer effect of region 1 with 40% blockage degree was better than that of 60% blockage degree. The best PEMFC performance was obtained with the blockage degree of 40%, 60% and 60% in region 1, region 2 and region 3, respectively. The net power density was 29.8% higher than traditional scheme and 0.6% higher than that of the whole basin with 60% blockage degree.