1. Introduction
Chloramphenicol (CAP) has been employed in many applications since it discovery and artificial synthesis in 1947 [1]. Currently, CAP remains versatile, which has enabled its extensive use to cure bacterial infections affecting humans, vegetarians, or livestock. However, the overuse of CAP can cause many fatal side effects, including blood dycrasias, leukopenia, and gray skin [2,3]. Owing to its toxicity to humans, CAP is banned from agricultural products. Although CAP is extensively restricted worldwide, it is still found in seafood imported into Europe [4].
Numerous sensing methods have been developed to determine the concentration of CAP in food, including liquid chromatography [5], biosensors [6], and electrochemical techniques [7]. Among these methods, electrochemical techniques have the advantages of low cost and simplicity. Many materials have been studied and used to modify the electrode surface of electrochemical sensors to detect CAP, such as MnSe2 nanoparticles dispersed on multi-walled carbon nanotubes [8], graphene oxide/hydroxysuccinimide/ gold nanoflowers [9], and silver nanoparticles/ carboxylic multi-wall carbon nanotubes [10]. Although the sensitivity and selectivity of these materials are excellent, drawbacks, such as their high cost and complicated fabrication procedures, limit their potential for use in electrochemical sensing applications. Therefore, a simple and affordable material for determining CAP concentration in food is desirable.
Compared with carbon-based materials, precious metals, or complex materials, as mentioned above, spinel oxide nanomaterials possess more edges, including their excellent electrocatalyst characteristics and simple fabrication process [11]. Among the spinel materials, ZnCo2O4 is being investigated and utilized as an electrode material in electrochemical sensors to detect many substances. In 2021, Amiri et al. synthesized a ZnO/ZnCo2O4 nanocomposite via a hydrothermal method and used the material to detect bisphenol A. The sensor had a good linear range of 0.06 to 200 ╬╝M and a limit of detection (LOD) of 0.01 ╬╝M [12]. Similarly, a ZnCo2O4 nanoplate arrays/ carbon fiber was demonstrated to have good sensing performance toward dihydroxybenzene isomers, with a linear range of 2ŌĆō500 ╬╝M and low LOD (0.03 ╬╝M for hydroquinone, 0.06 ╬╝M for catechol, and 0.15 ╬╝M for resorcinol) [13]. This noticeable performance in electrochemical sensing originates from the multiple oxidation states and the presence of transition metal oxides. Accordingly, ZnCo2O4 offers better electrical conductivity and electrochemical activity than unitary cobalt oxide (Co3O4) and zinc oxide (ZnO) [14]. Crystallinity and surface area also play an important role in the detection performance of the electrode material. Therefore, in this study, we prepared ZnCo2O4 nanoparticles and investigated the influence of annealing temperature on the sensing performance of ZnCo2O4 toward CAP.
2. Experimental
2.1 ZnCo2O4 synthesis
2.1.1 Material
Cobalt(II) nitrate hexahydrate (Co(NO3)2.6H2O), zinc chloride (ZnCl2), ammonia solution (NH4OH), ethyl alcohol (C2H5OH), potassium chloride (KCl), sodium phosphate dibasic (Na2HPO4), potassium phosphate dibasic (K2HPO4), and sodium chloride (NaCl) were purchased from Daejung Chemical & Metal (South Korea). Chloramphenicol and potassium ferricyanide (III) (K3Fe(CN)6) were purchased from Sigma-Aldrich (USA). The screen-printed electrode (SPE) was purchased from Metrohm Dropsens (Spain).
2.1.2 Synthesis of ZnCo2O4
ZnCo2O4 was synthesized via the coprecipitation method. First, 4.8 mL of 12% NH4OH was added dropwise into 16 mL of Co(NO3)2 (0.2M). The solution was sonicated for 10 min, and then 8 mL of 0.2 M ZnCl2 was injected into the above solution under vigorous stirring. After 2 h, the solution was washed several times via centrifugation with ethyl alcohol to eliminate all by-products. The black precipitate was then extracted from the solution and annealed at 200┬░C, 400┬░C, 600┬░C, and 800┬░C, and labeled as ZCO2, ZCO4, ZCO6, and ZCO8, respectively.
2.2 Preparation of the ZnCo2O4 ink
ZnCo2O4 was prepared by dissolving ZnCo2O4 powder in a mixture of ethyl alcohol and water (volume ratio of 1:9) at a concentration of 3 mg┬ĘmLŌłÆ1. The solution was then sonicated in a sonicator bath for 30 min. All deposited large particles were removed from the solution. Subsequently, ZnCo2O4 was more carefully dispersed using a probe sonicator for 10 min. The ink was then preserved in a centrifuge tube at room temperature and sonicated before coating.
2.3 Electrode modification
The SPEs were washed via sonication in ethyl alcohol for 30 s and dried in a vacuum chamber. Subsequently, the working electrode of the SPEs was modified using 2 ╬╝L of pre-prepared ZnCo2O4 ink via drop-coating and drying in a vacuum chamber.
2.4 Material characterization
X-ray diffraction (XRD) analysis was conducted using an automated multipurpose X-ray diffractometer Ultima IV (Rigaku) with Cu-K╬▒ (╬╗ = 0.154056 nm) as the source. Scanning electron microscopy (SEM) images were obtained using an Ultra-High Resolution Scanning Electron Microscope SU8200 Series operating at 5 kV. All electrochemical experiments were conducted using the multichannel potentiostat, VSP (Biologic).
3. Results and Discussion
3.1 Structure and morphology characterizations
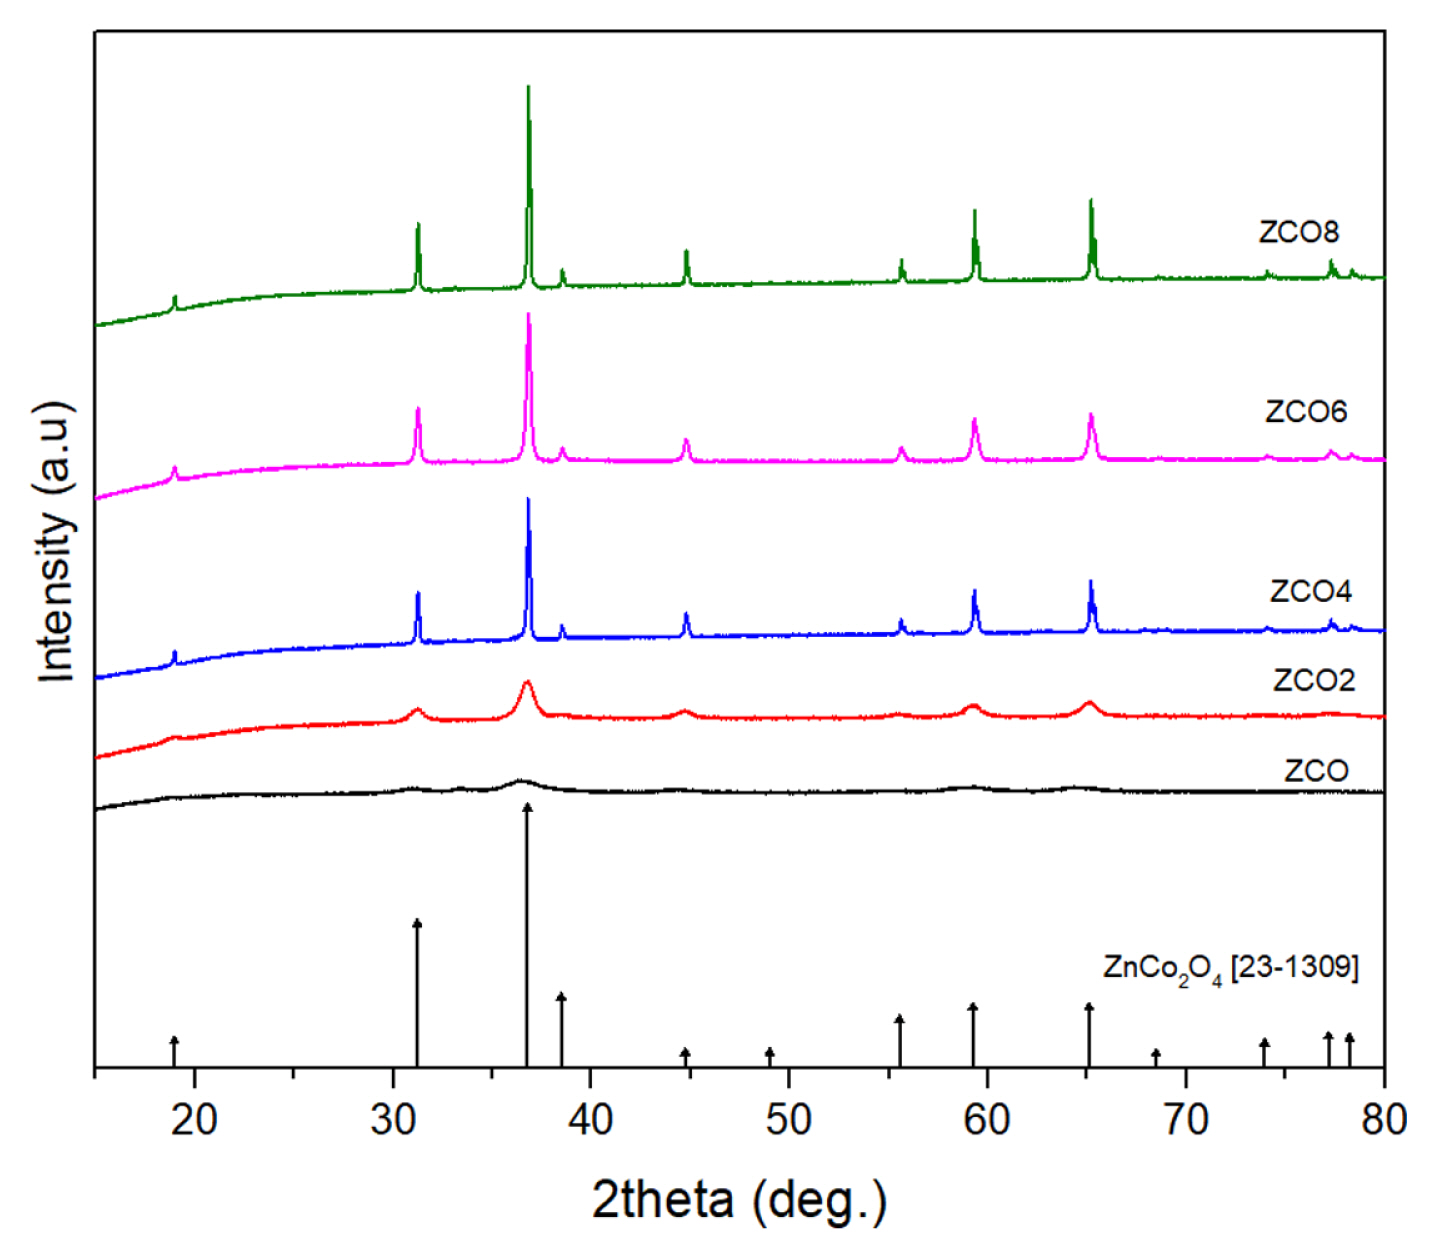
Fig. 1 shows the XRD patterns of the ZnCo2O4 nanostructures synthesized at various treatment temperatures. The fabricated samples exhibited diffraction peaks at 31.20┬░, 36.77┬░, 59.22┬░, and 65.09┬░, which were attributed to indexes of (220), (311), (511), and (440) planes of the single-phase cubic spinel structure of ZnCo2O4 (JCPDS card No. 23-1390). Interestingly, the obtained patterns did not have other peaks, indicating that the synthesized powder samples consisted of ZnCo2O4 without any by-products.
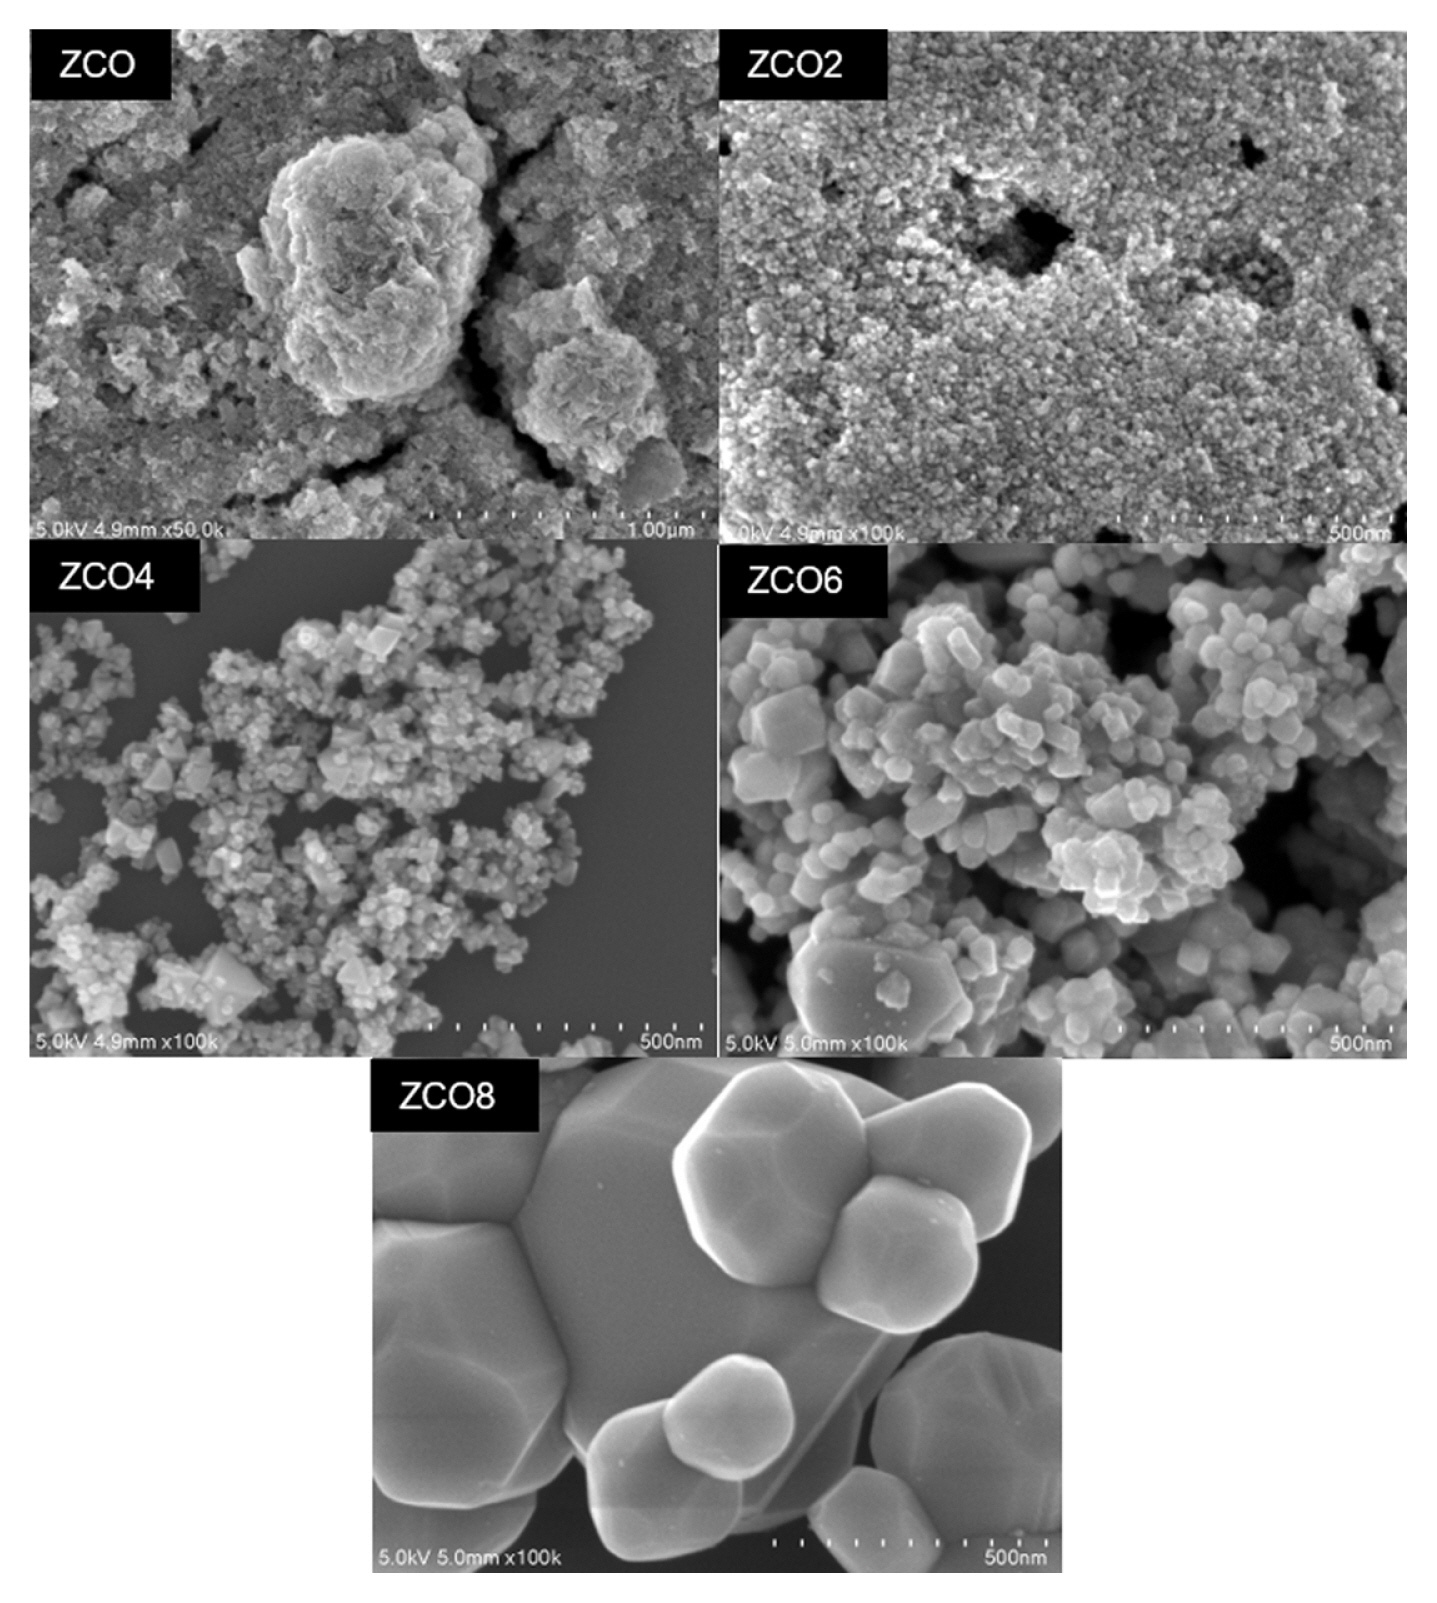
The morphology of the ZnCo2O4 samples was investigated using SEM images as shown in Fig. 2. The SEM images (Fig. 2) revealed a range of morphology types of ZnCo2O4. As shown in Fig. 2, the morphology of ZnCo2O4 without calcination was amorphous, aligning with the XRD results. When the annealing process was performed at 200┬░C, nanoparticle formation was clearly observed. The morphology of these nanoparticles was spherical, with a homogeneous diameter of 10 nm. The morphology of the material changed significantly when the temperature reached 400┬░C. The sample consisted of octahedral nanoparticles with sizes ranging from 20 to 50 nm. At 600┬░C and above, the particles transformed into a polyhedral. Furthermore, owing to the diffusion of atoms through the grain boundaries at high temperatures, the grain sizes also remarkably increased to 100 nm and 300 nm on average at treatment temperatures of 600┬░C and 800┬░C, respectively.
3.2 Electrochemical characterizations
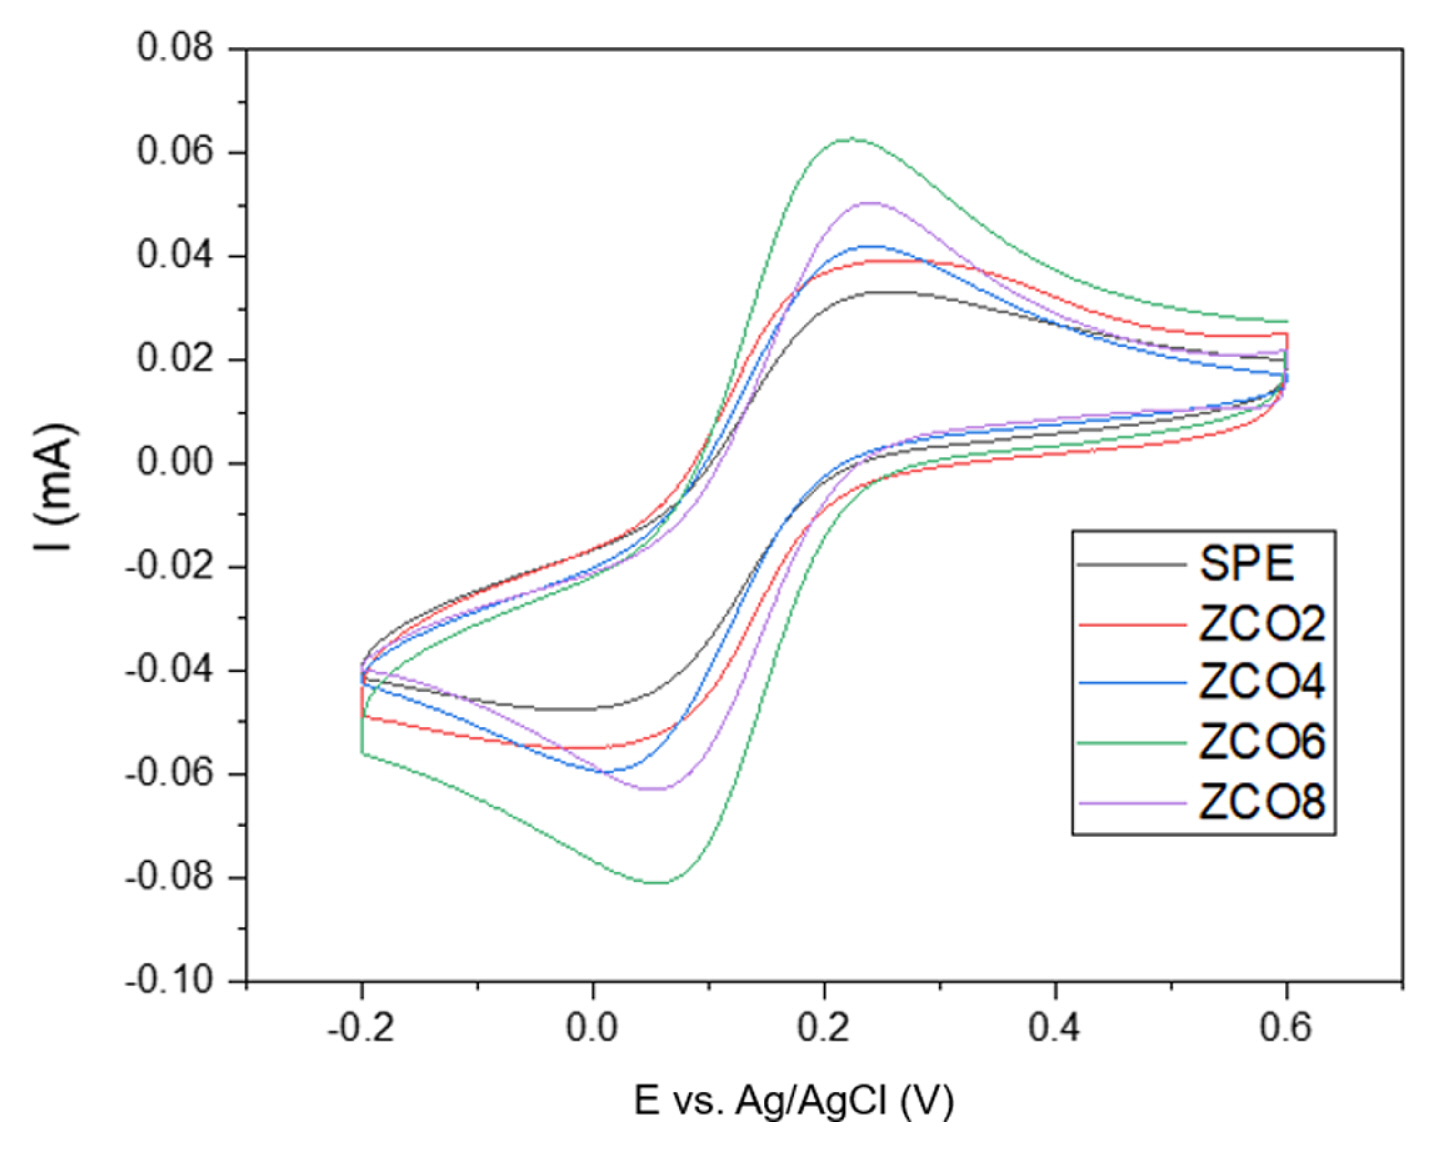
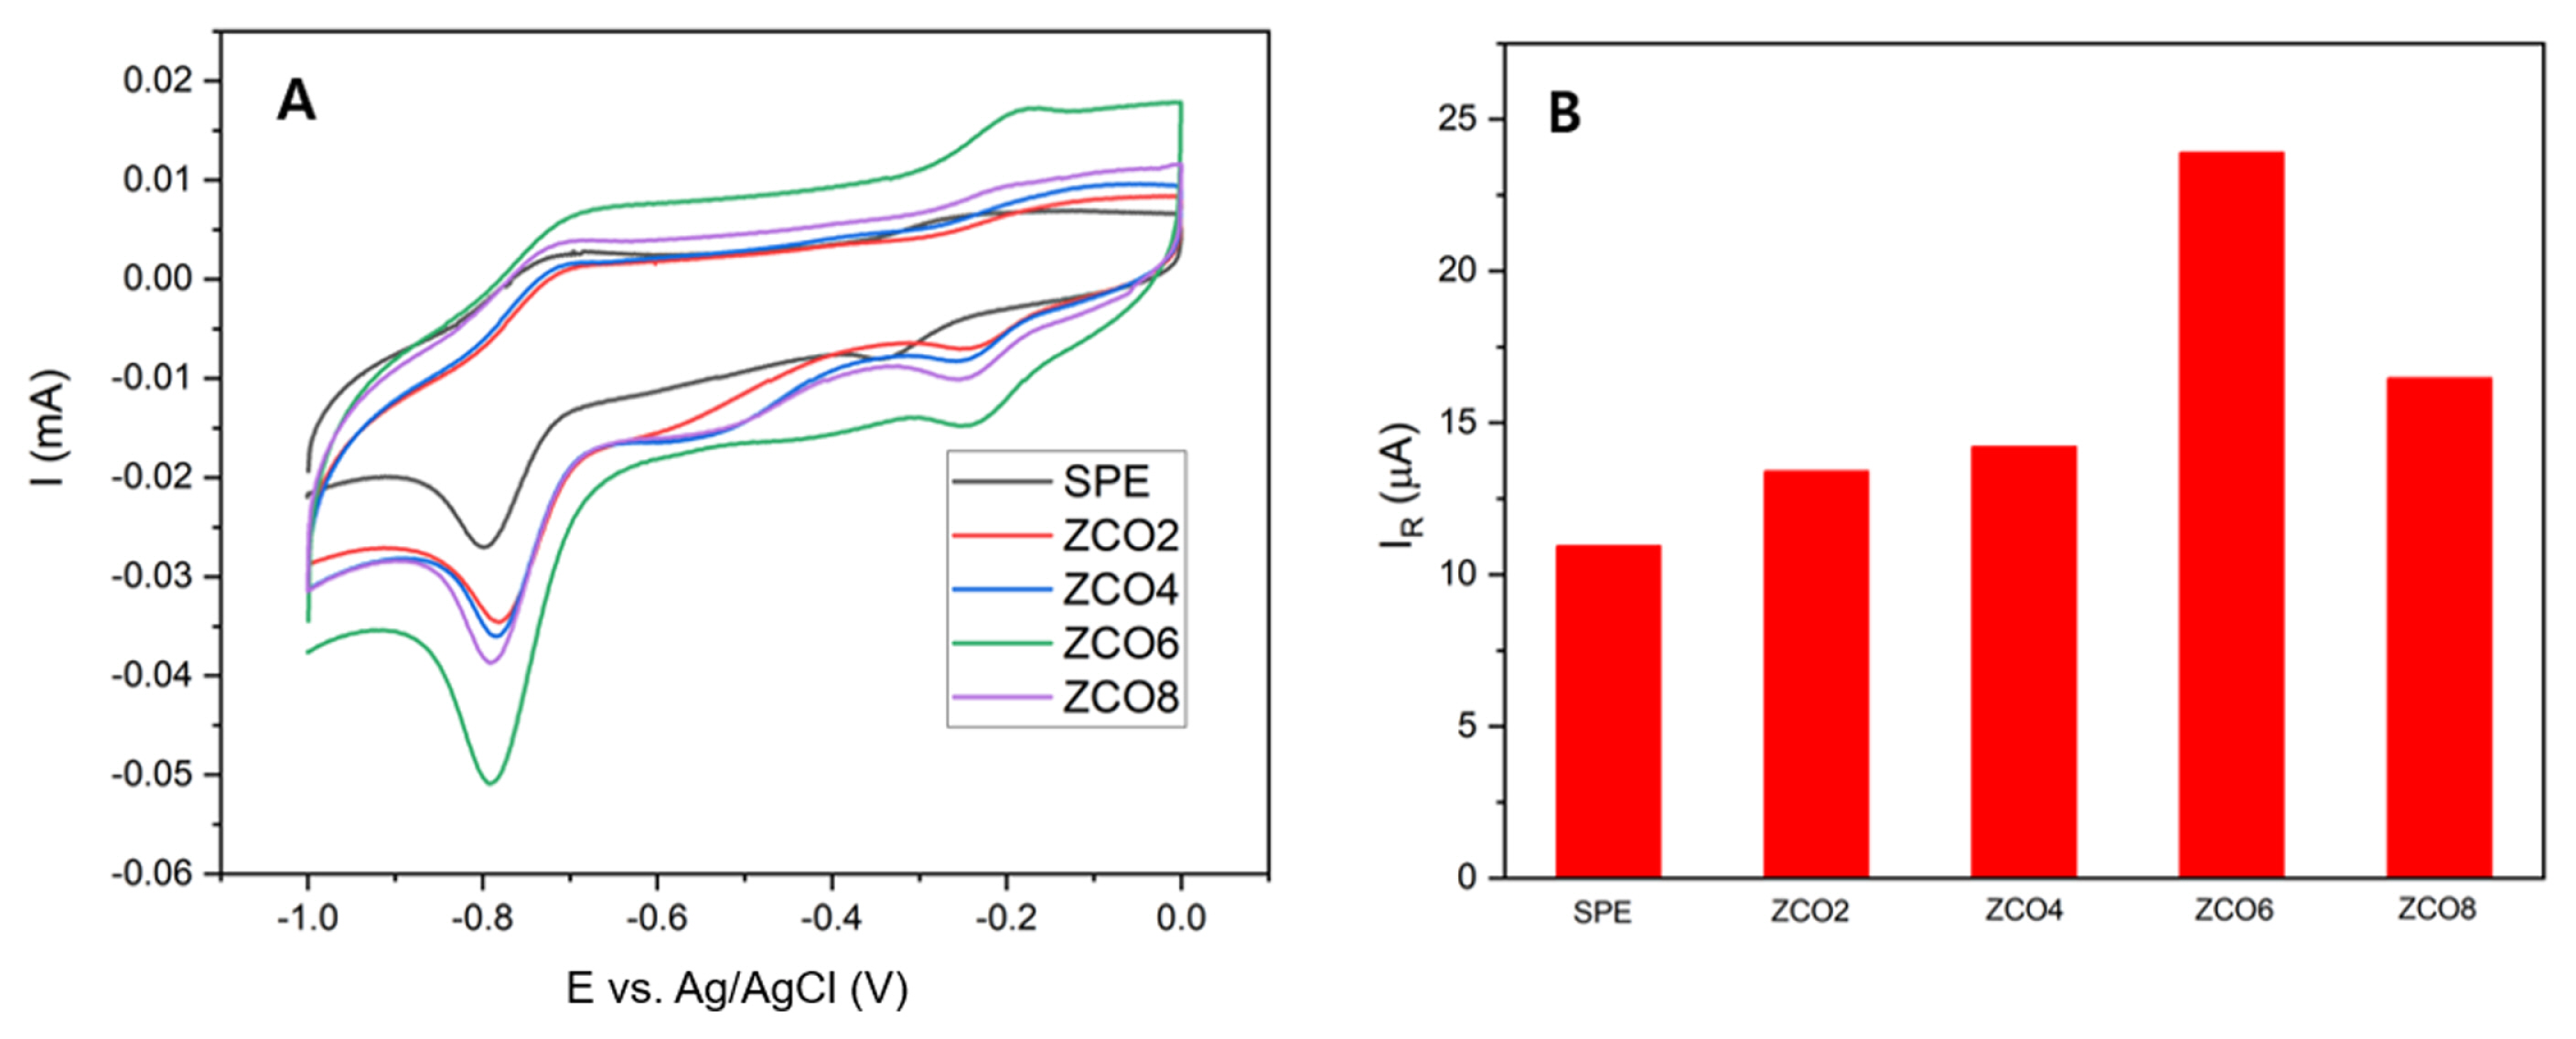
Initially, to investigate the impact of materials on the surface area of electrodes, cyclic voltammetry was conducted on the bare electrode and the electrodes modified with ZCO2, ZCO4, ZCO6, and ZCO8 in a solution containing 0.5 mM ferricyanide and 0.1 M KCl at a scan rate of 50 mV┬ĘsŌłÆ1. Fig. 3 presents the electrochemical behaviors of the different electrodes, where pairs of redox peaks are clearly recorded in all samples corresponding to the oxidation of Fe2+ to Fe3+ and the reverse process. As shown in the images, every modified electrode showed a remarkable increase in the intensity of the redox peak compared to the initial SPE electrode. The largest calculated peak current belonged to the electrode modified with ZCO6, which reached a value of 66.82 ╬╝A, doubling that of the bare electrode. In particular, the order of the peak current was ZCO6 > ZCO8 > ZCO4 > ZCO2 > SPE. This result can be explained by the surge in the surface area of the working electrodes and the electrical conductivity enhancement due to the use of metal oxide nanoparticles [15].
The electrochemically active surface areas were calculated using the Randles-Sevcik equation at room temperature and are listed in Table 1.
Owing to modification of the materials, the electrodes showed higher electrochemically active surface area (EASA) values. In particular, the EASAs of the electrodes that improved with ZCO8 and ZCO6 were approximately 0.18 and 0.22 cm2, 1.7- and 2.0-fold larger than that of the pristine electrode. Overall, the current response and EASA of the electrodes were improved by the addition of ZnCo2O4 with heat treatment at different temperatures. Based on the XRD results, high temperature played an important role in enhancing the crystallinity of ZnCo2O4. Furthermore, the size and morphology of the material were driven to suitable values by an annealing temperature of 600┬░C. Based on the results obtained through electrochemical measurements in KCl/ K3Fe(CN)6, the electrode with ZCO6 was expected to outweigh the other sensors in terms of CAP detection performance.
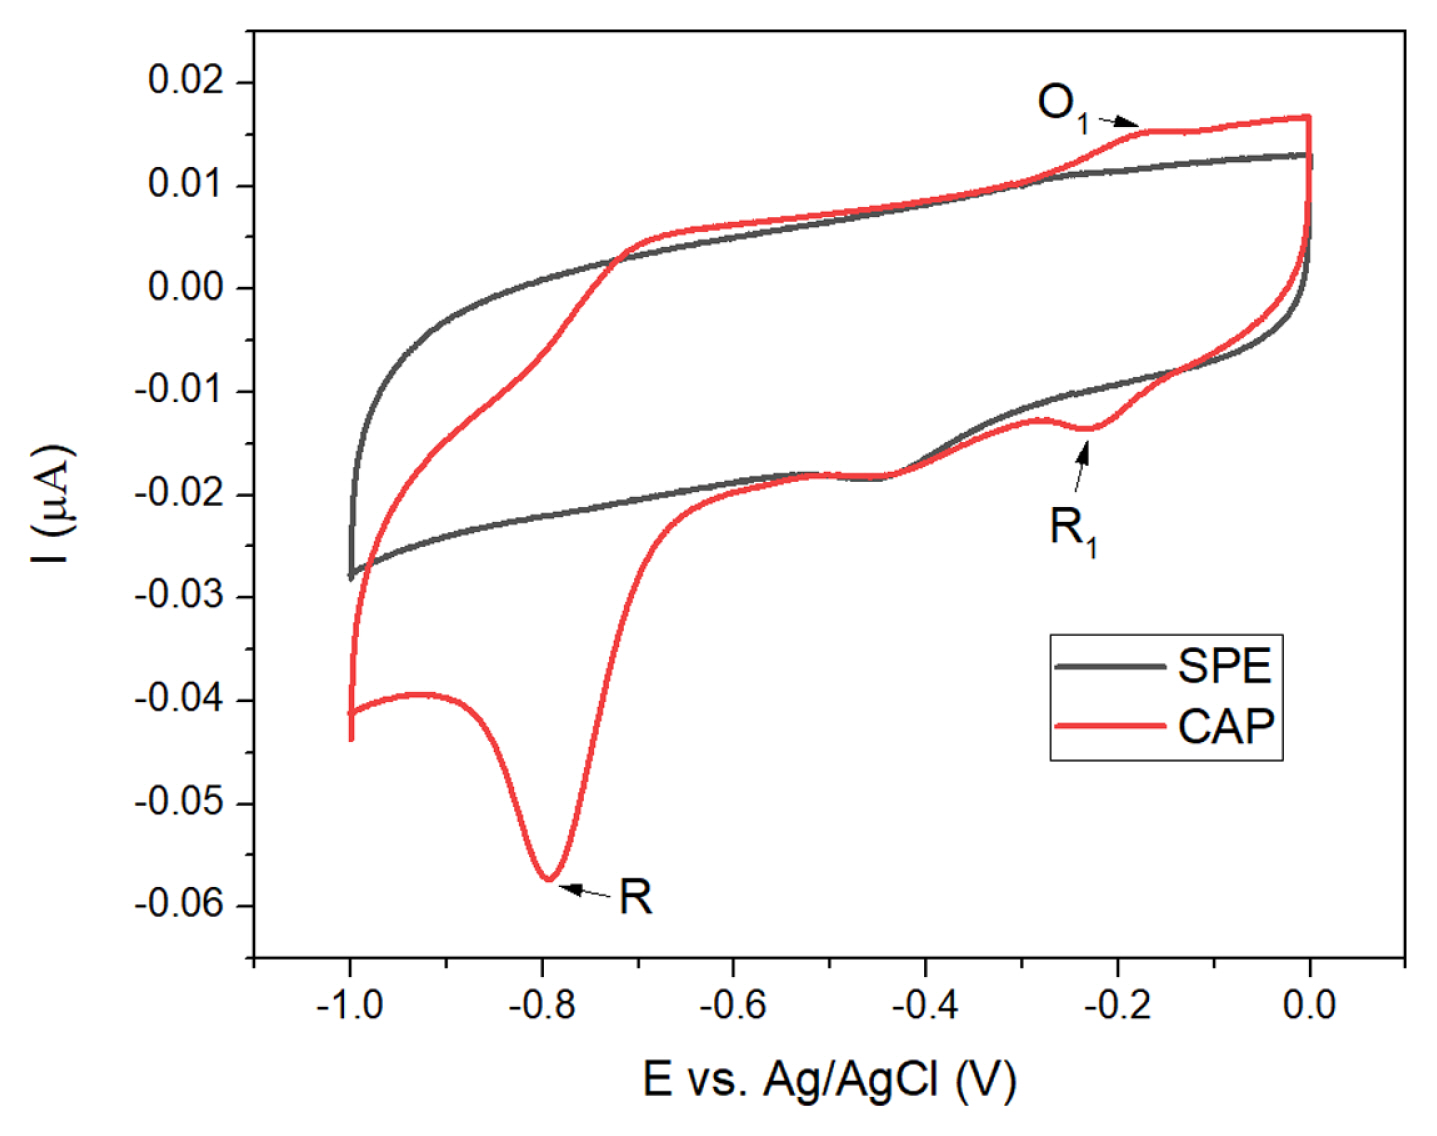
To determine the redox peaks of CAP under experimental conditions, the electrode modified with ZCO6 was tested in two solutions: PBS solution and PBS solution containing 100 ╬╝M CAP. As depicted in Fig. 4, in the black line, which represents the characteristic of the electrode in PBS solution, a reduction peak appeared around ŌłÆ0.45 V. This reduction peak was reported to be generated by the reduction of oxygen in the measuring solution in previous investigations [16,17].
When 100 ╬╝M CAP was injected into the PBS solution, the CV curve showed an irreversible reduction peak at ŌłÆ0.79 V, which was initially attributed to the reduction of the ŌłÆNO2 group of CAP by the hydroxylamine group (ŌłÆNHOH). A pair of reversible peaks at ŌłÆ0.23 V and ŌłÆ0.17 was also recorded, which could represent the oxidation of the ŌłÆNHOH group in the previous reduction process into a nitroso group (ŌłÆNO) and the reversal process, respectively. The numbers of electrons transferred in each process are 4 for the irreversible and 2 for the reversible process, corresponding to many previous studies on the redox reactions of CAP on the surface of electrochemical sensors [18,19]. Although three peaks appeared when CAP was present in the PBS solution, the current response of the irreversible peak at ŌłÆ0.79 V was more sensitive and outweighed the others. Accordingly, this peak could be selected to detect the existence of CAP in solution.
To determine the best performance among the samples, CV measurements were conducted with the bare sensor and the sensors modified with ZCO2, ZCO4, ZCO6, and ZCO8 in the same manner as previous measurements.
As shown in Fig. 5A, among the sensors, that with ZCO6 dominated the others in terms of the current response. Owing to the presence of ZCO6 on the surface of the working electrode, the current calculated from the CV curve was 23.84 ╬╝A, which doubled that of the pristine sensor (10.96 ╬╝A). In contrast, the sensors modified with other samples underwent slight improvements in current response. This sensitivity of ZCO6 can be explained by the high crystallinity of the material under a suitable treatment temperature and the appropriate particle size, which is the key factor contributing to the large electrochemical active area highlighted in the previous calculation. Owing to the outstanding current response to CAP, the sensor modified with ZCO6 was selected for further measurements.
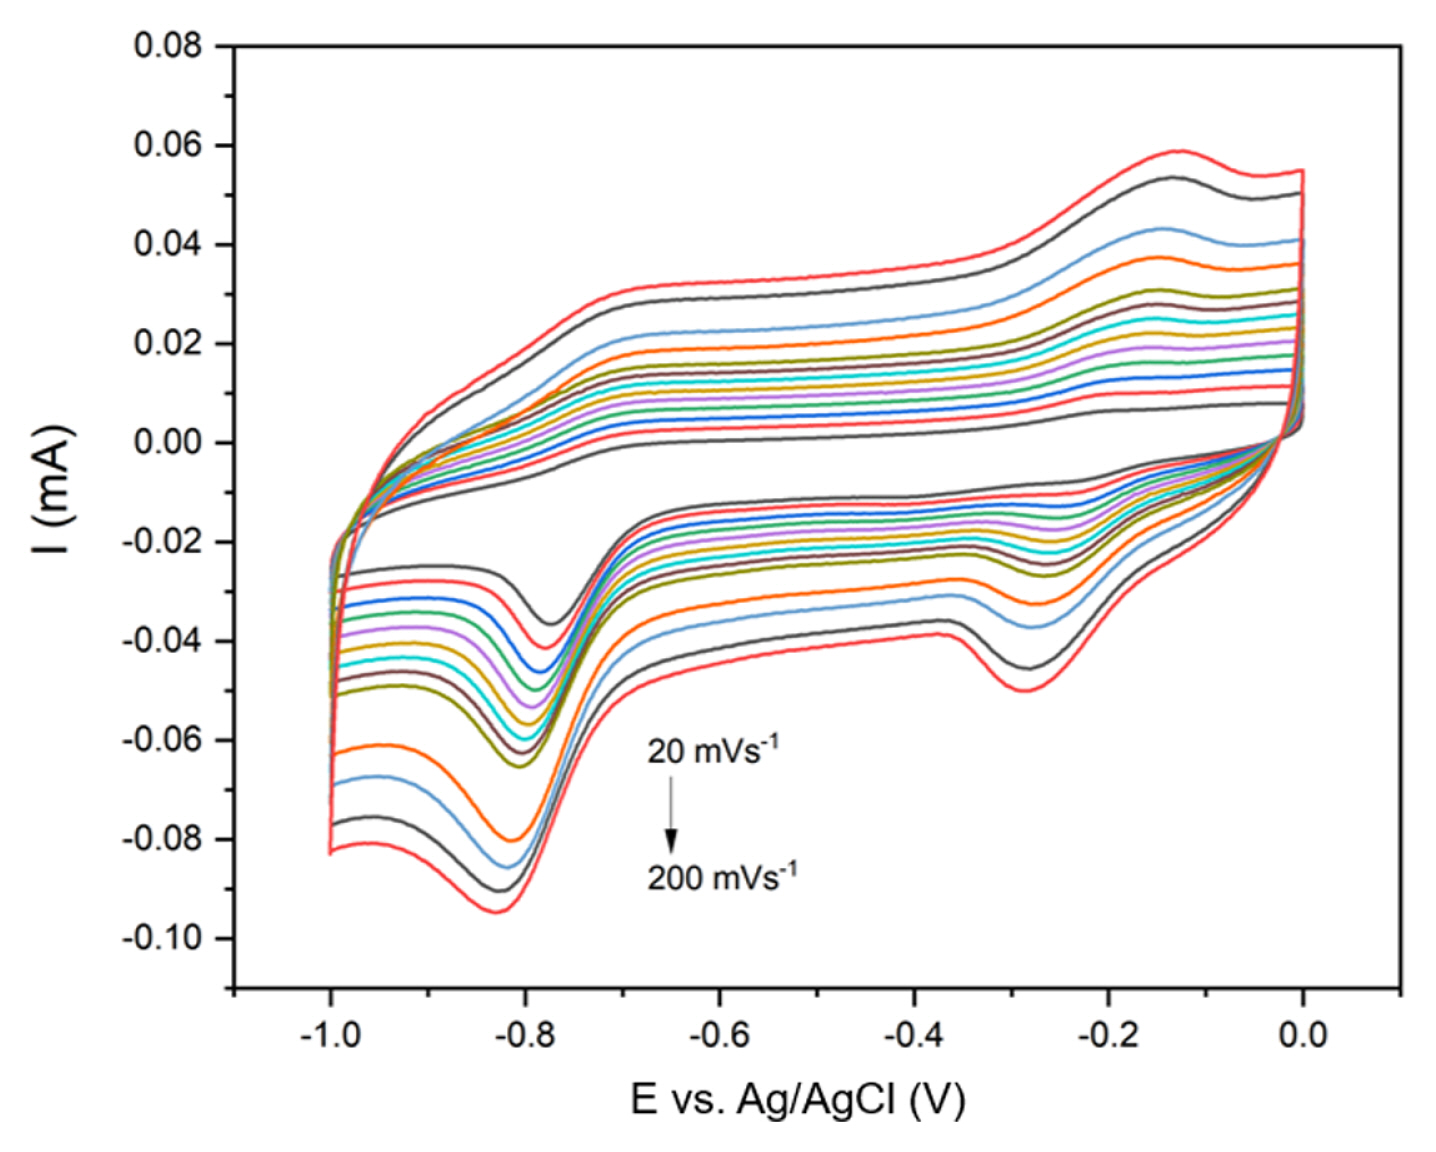
We proceeded to investigate the mechanism of redox reactions occurring on the surface of the working electrode using the CV technique in PBS solution containing 100 ╬╝M CAP with a scan rate ranging of 20 mV┬ĘsŌłÆ1 to 200 mV┬ĘsŌłÆ1. As depicted in Fig. 6, when the scan rate decreased, the current response of all three redox peaks gradually decreased. Notably, the peak position of the reduction peaks shifted toward the negative direction as the scan rate increased, while the oxidation peak position shifted toward the opposite direction as the scan rate increased.
The current response of the three redox peaks was calculated and compared to the square root of the scan rate, as shown in Fig. 7a; the line of the peak current versus the square root of the scan rate showed great linearity, demonstrating that the process on the surface of the electrode was diffusion-controlled. To further understand the reaction mechanism, the positions of the reduction peak at ŌłÆ0.79 V and the oxidation peak at ŌłÆ0.17 V are depicted versus the natural logarithm of the scan rate in Fig. 7b. The graph displays a strong linear relationship between the potentials of the peaks, which is expressed by the equations below:
Based on these equations, combined with the Laviron equation:
where ╬▒ is the transfer coefficient of the redox reaction (0.3 < ╬▒ < 0.7).
R is the gas constant (R = 8.314 J┬ĘmolŌłÆ1KŌłÆ1)
T is the room temperature in Kelvin (T = 300 K)
ks is the electron transfer rate constant
F is the Faraday constant (F = 96480 C┬ĘmolŌłÆ1)
n is the number of electrons transferred
The number of electrons transferred in each reaction was 4 for the irreversible reduction reaction, confirming the proposed mechanism of redox reactions in the previous section, where the irreversible peak is created by the reduction of the ŌłÆNO2 group to the -NHOH group, and the reversible oxidation ŌĆō reduction peaks are due to the transformation between the ŌłÆNHOH and ŌłÆNO groups.
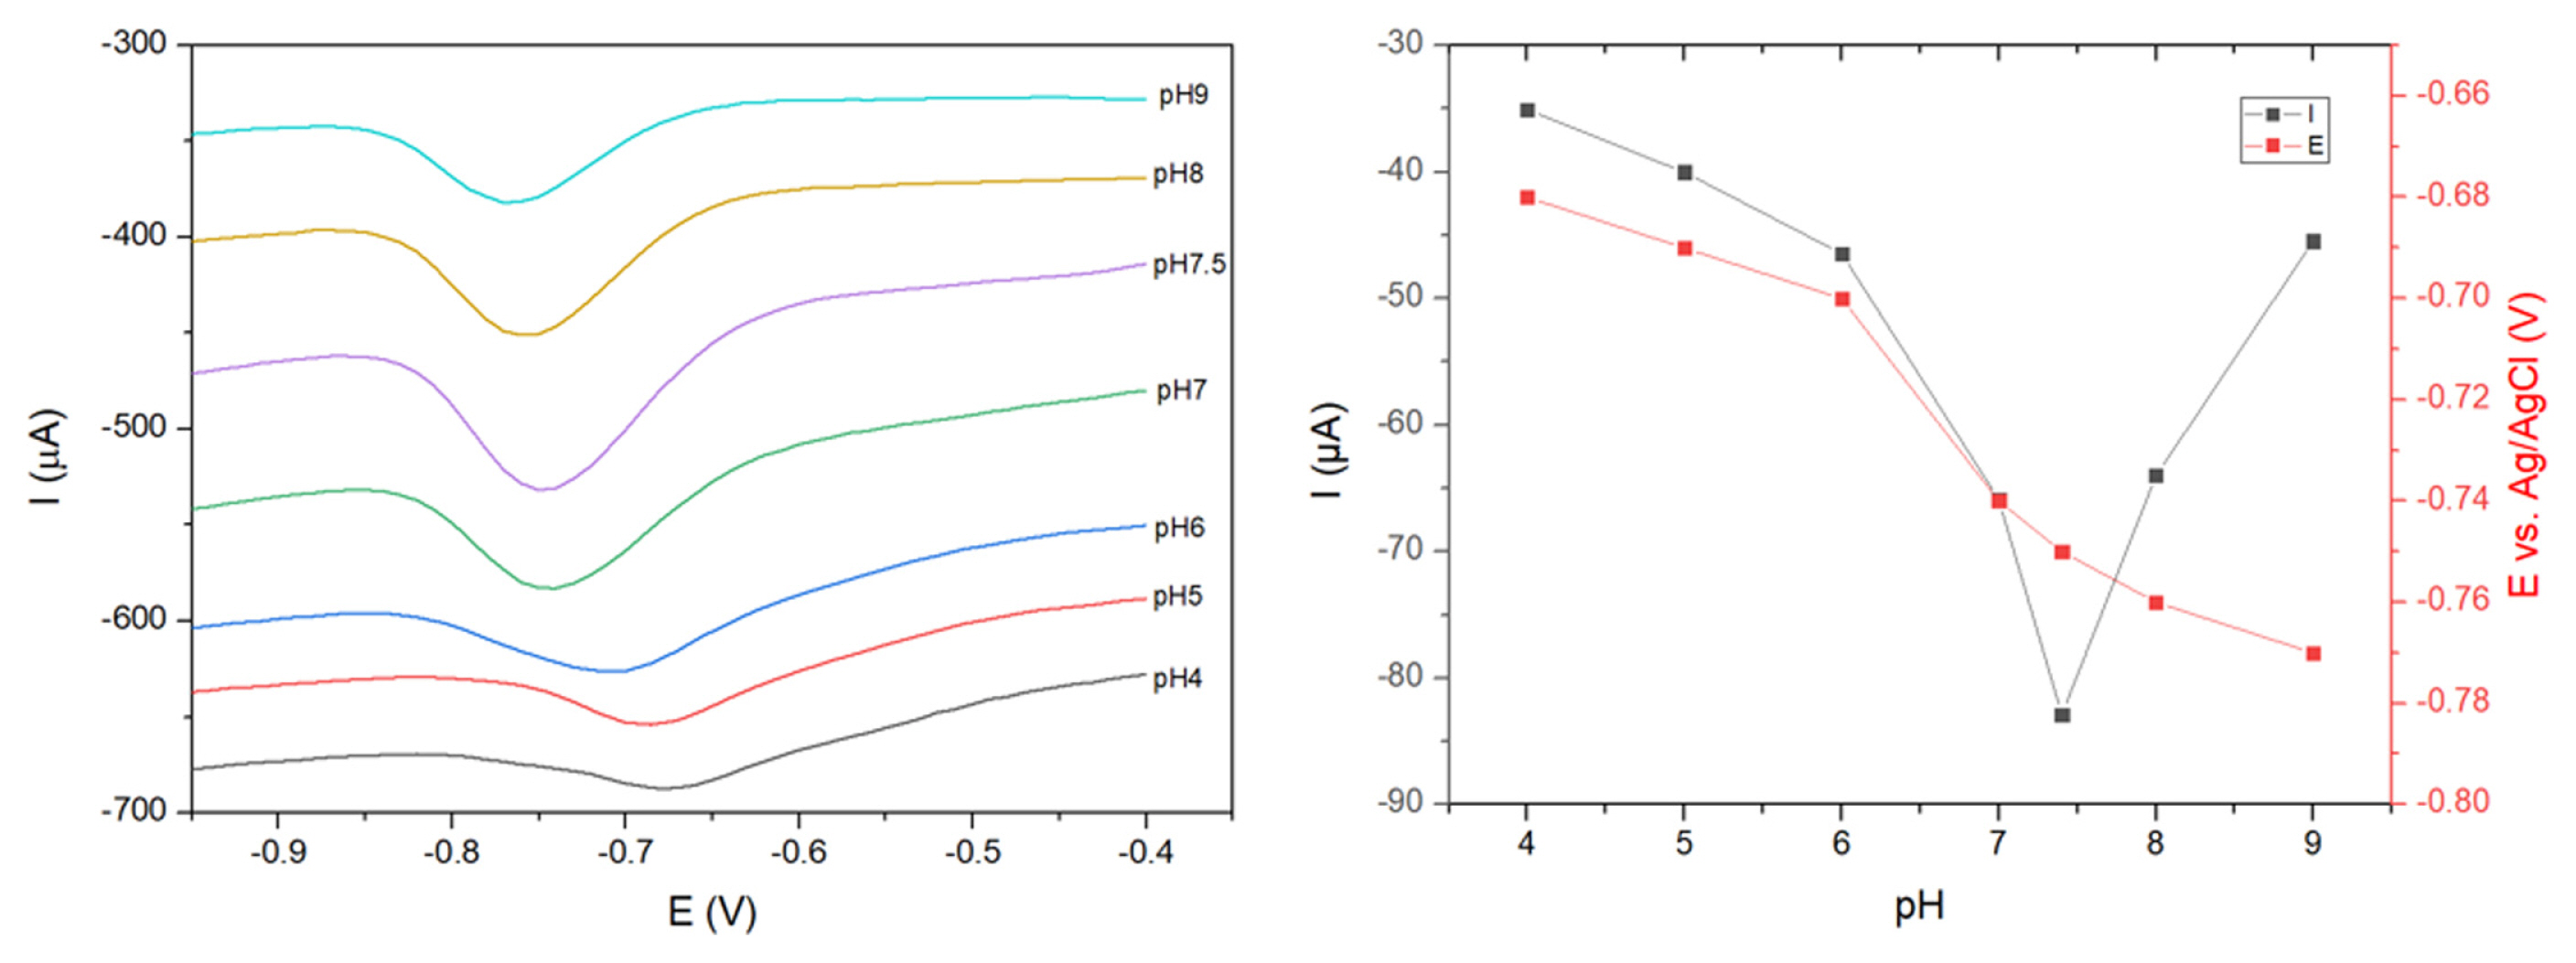
The electrochemical response of the sensor under different pH conditions was investigated using DPV measurements. The electrode was tested in PBS solutions containing 100 ╬╝A CAP, with pH values varying from 4 to 9; the results of the peak potential and peak current are shown in Fig. 9. Based on Fig. 9a, when the pH value increased from 4 to 7.4, the peak potential shifted strongly toward the negative direction. More interestingly, the peak current of the reduction peak increased markedly and reached the highest value at pH 7.4. This value was markedly higher than the current in acidic or basic solutions. This phenomenon can be explained by the instability of ZnCo2O4 in an acidic environment and the decrease in proton concentration in the basic solution, leading to the restriction of the electrochemical reduction of CAP on the surface of the electrode [16]. Due to the extraordinary current response, pH 7.4 was selected as the optimal pH value for further electroanalytical measurement.
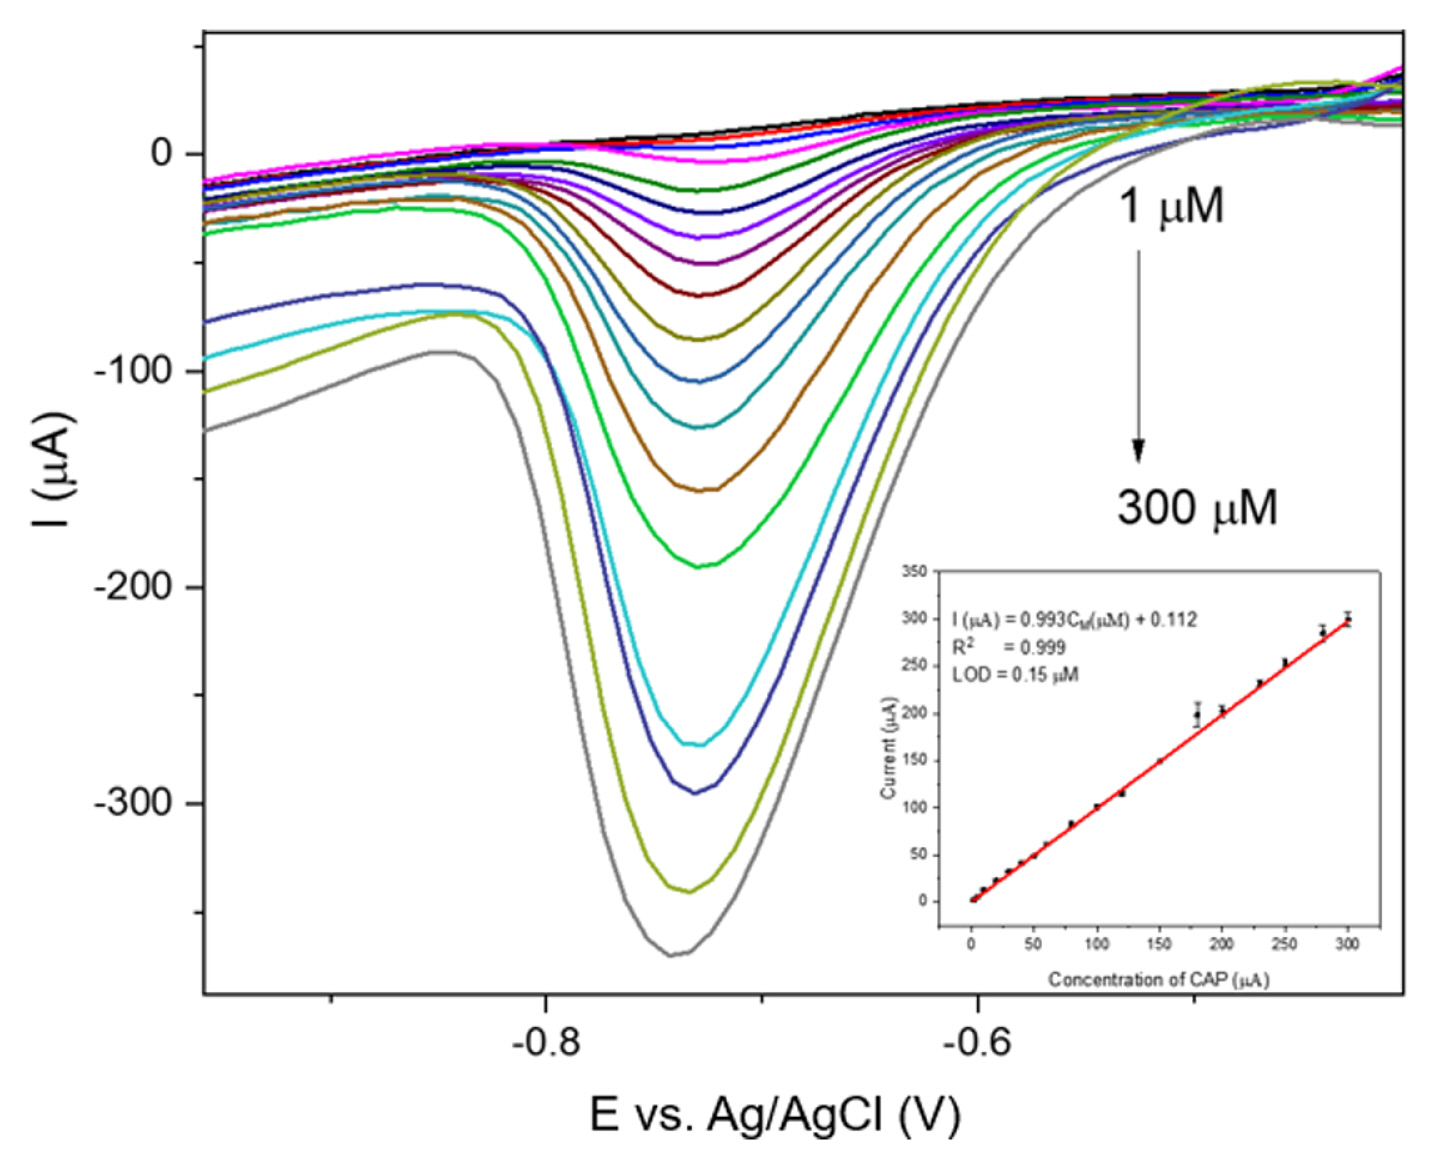
Under the optimal conditions determined above, DPV was conducted to evaluate the performance of the sensor with different concentrations of CAP. Fig. 10 illustrates the DPV curves of the sensor when the CAP concentration varied from 1 ╬╝M to 300 ╬╝M; the inset shows the linear relationship between the peak current and concentration of CAP. The intensity of the reduction peak was found to increase gradually with the increase in CAP concentration, indicating that CAP was adsorbed on the electrode following Langmuir adsorption [18].
As shown in Fig. 10, the peak position shifted slightly toward the positive direction when the concentration decreased. This phenomenon was due to the change in pH inside the solution when adjusting the CAP concentration. According to the peak current at different concentrations of CAP, the calibration line was established; this line indicated great linearity, with a coefficient of determination of 0.999, demonstrating that the sensor had a great response to CAP in the concentration range of 1ŌĆō300 ╬╝M. The following regression equation was calculated: I (╬╝A) = 0.993CM (╬╝M) + 0.012. Based on the regression equation, the LOD was 0.15 ╬╝M using the standard formula: LOD = 3╬┤D/╬┤ (╬┤ is the calibration slope and ╬┤D is the standard deviation).
Interestingly, compared to other modified electrodes reported before (Table 2), the material displayed great potential as a candidate for modifying electrodes; this is because a wide linear detection range and acceptable low LOD were provided by its simple nanostructure. This material is also abundant in nature.
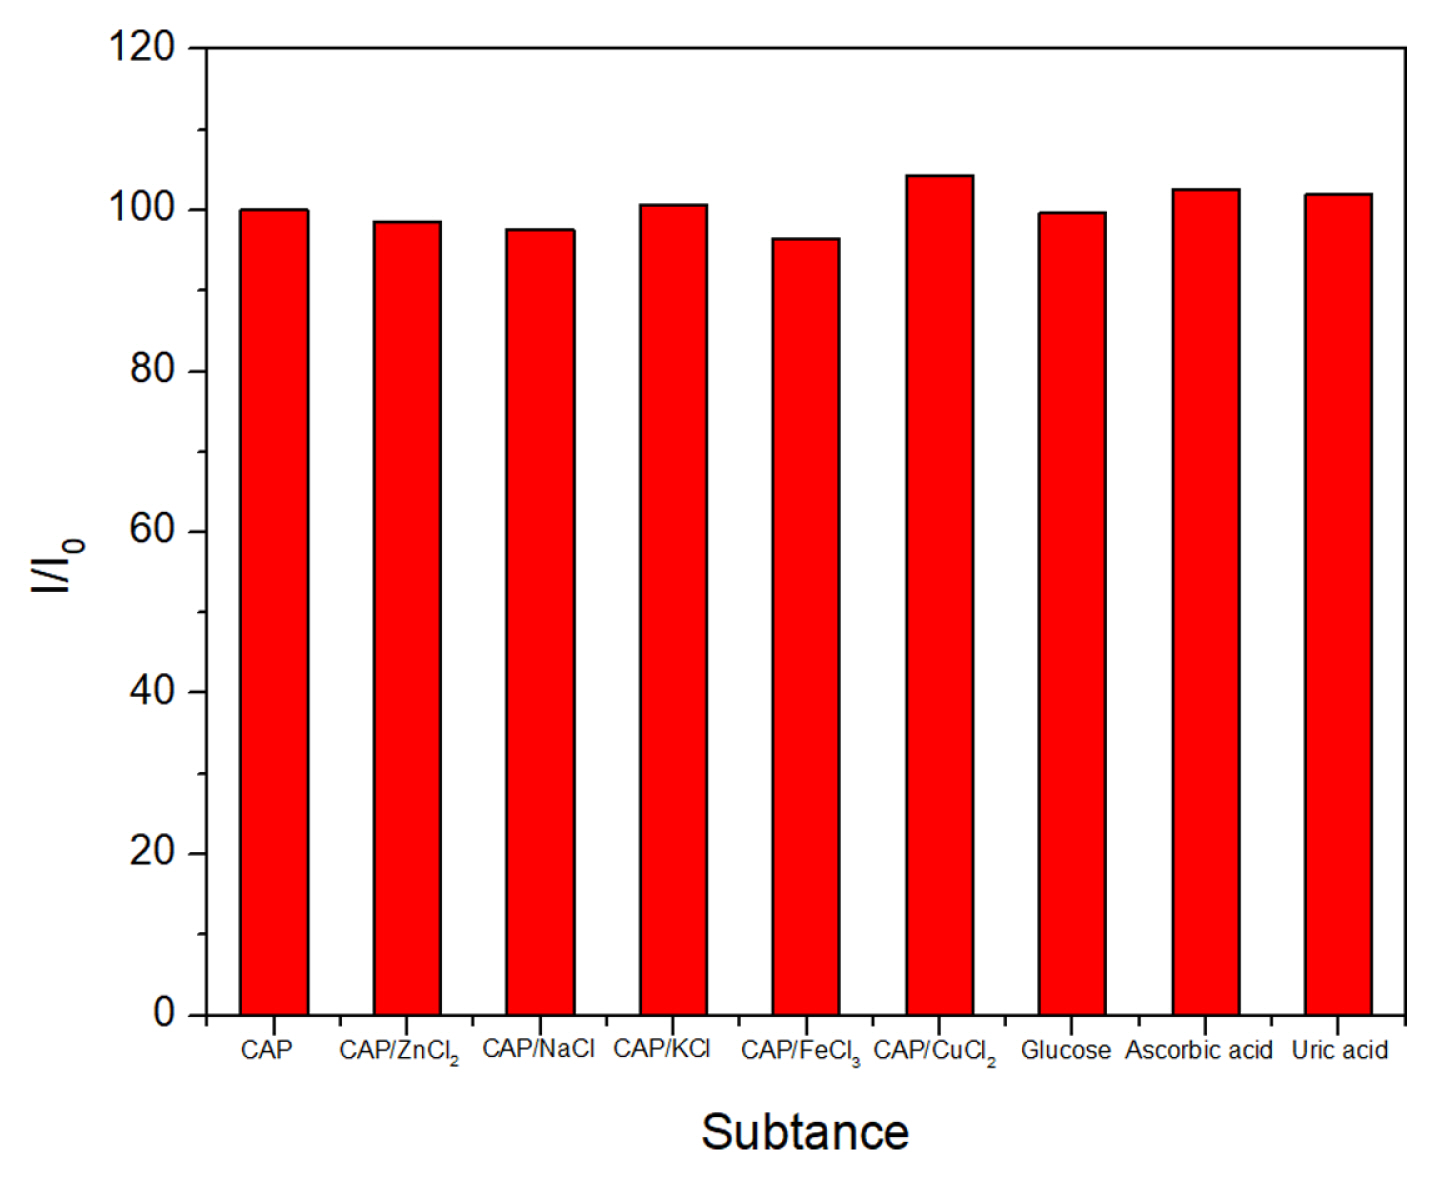
The selectivity of the sensor was evaluated via measurements in PBS/CAP in the presence of different compounds and ions, such as Zn2+, Na+, Fe3+, glucose, ascorbic acid, and uric acid. Fig. 11, compares the current response with and without the compounds. The intensity of the reduction peaks did not change by more than 5%, indicating that the peak current of CAP was stable even in the presence of various compounds.
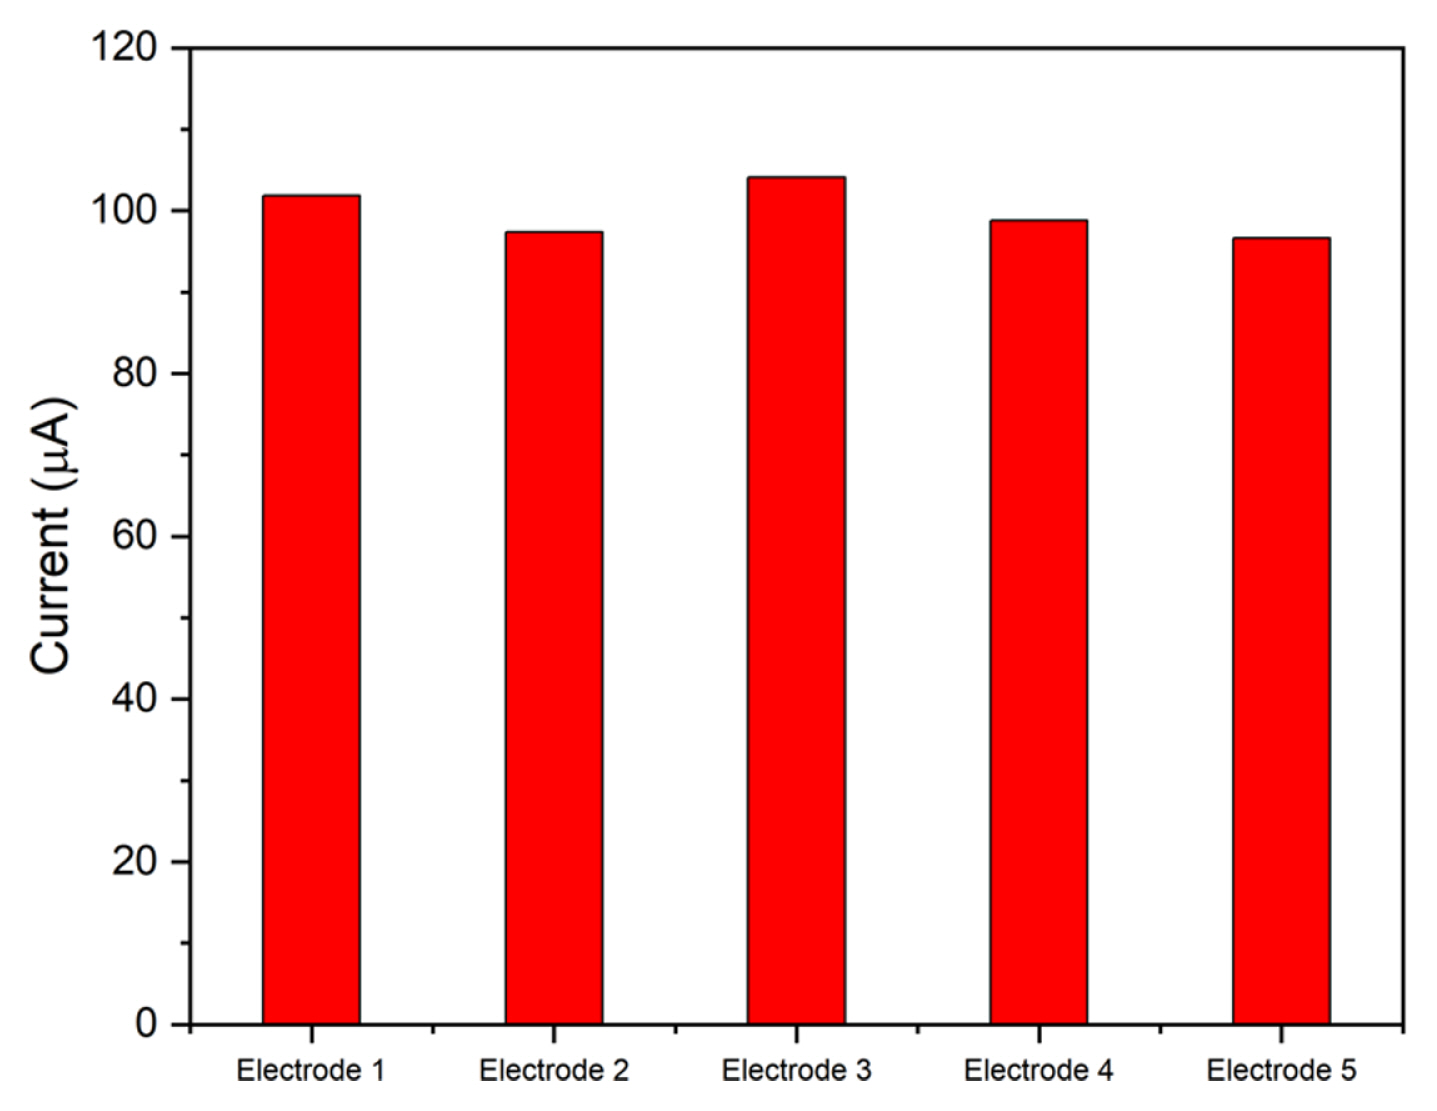
To determine the reproducibility, five electrodes were modified with the same amount of ZCO6 and tested with DPV under the same conditions. After the measurements, the average deviation was found to be below 3%, suggesting excellent reproducibility of the material.
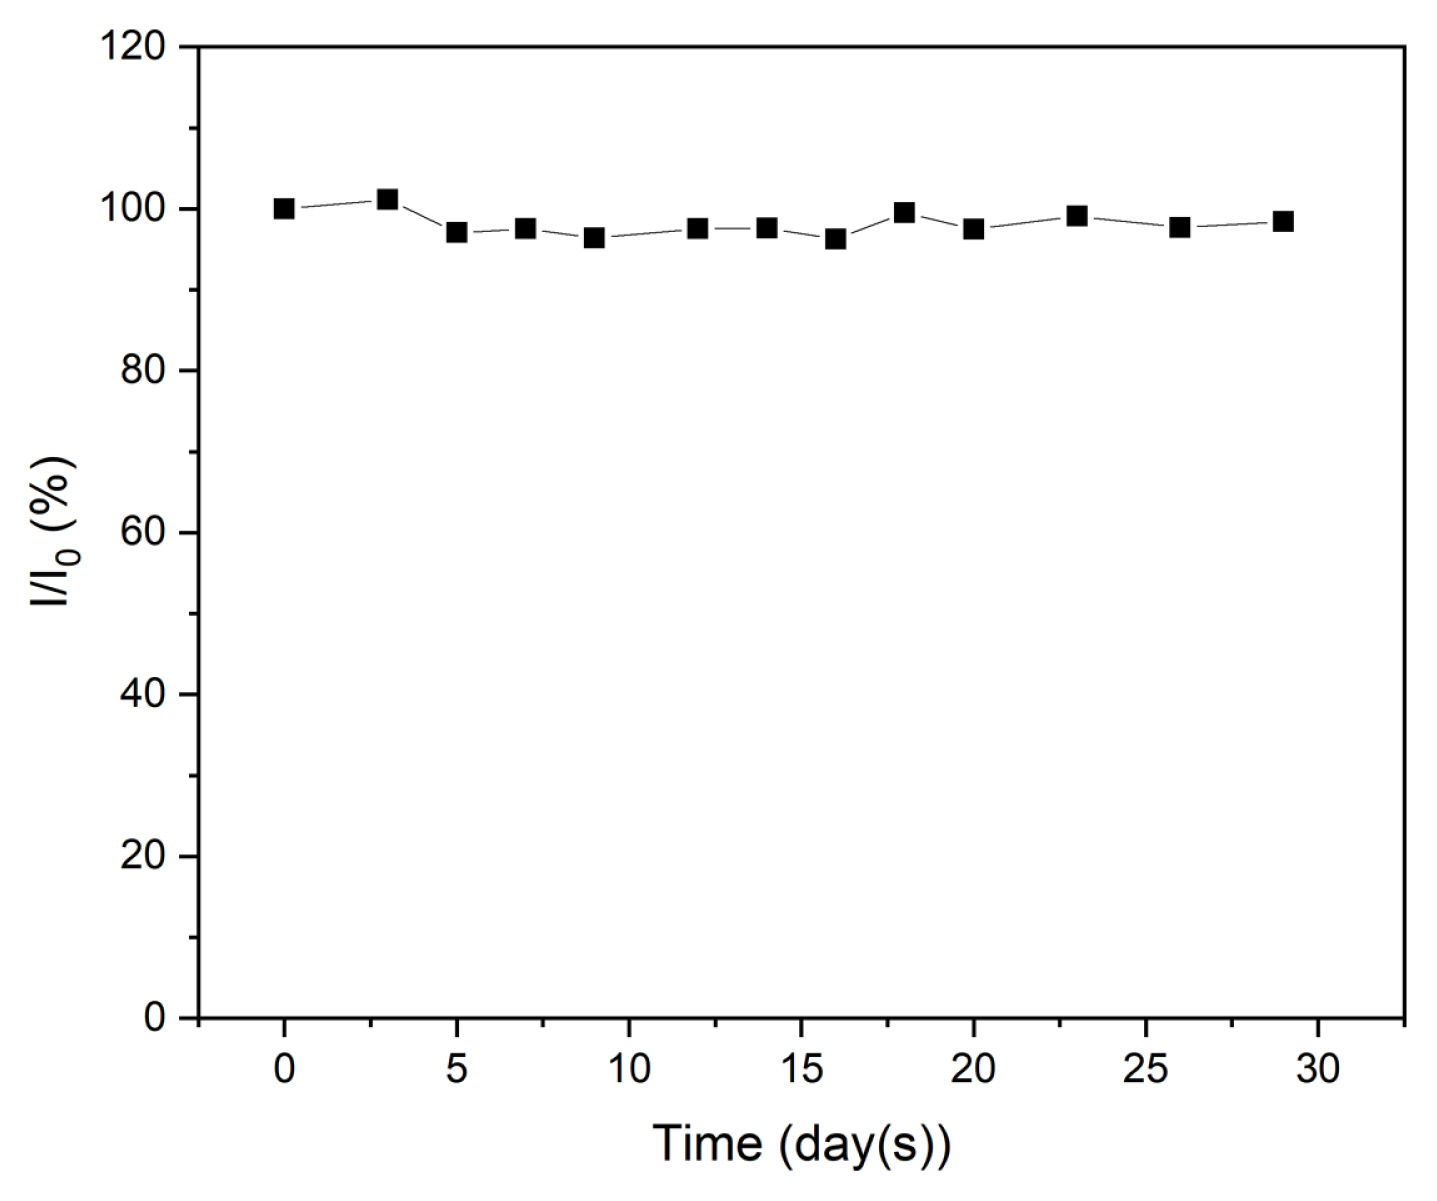
The stability of the sensor was evaluated by exposing it to ambient air for 30 days and performing several measurements of the reduction current in CAP. Fig. 13 shows the current response of the electrode over a period of 30 days. As depicted in the figure, the current did not change significantly throughout the process. The current response fluctuated and remained at 98.3% of the initial intensity, indicating outstanding stability despite tolerating the influence of ambient air for a long time.
The utility of the sensor was investigated by testing its detection performance in a real sample. Milk from the local market was selected as the real environment. First, the milk was diluted 10 times using 0.1 M PBS solution (pH 7.4). Thereafter, a known amount of CAP was added to the diluted milk solution. Subsequently, the sensor was used to determine the concentration of CAP in the solution, as listed in Table 3.
The calculated results using NVIDIA DGX Station (Future Automotive Intelligent Electronics Core Technology Center, Cheonan, Republic of Korea) indicated the excellent response of the sensor, with recovery always above 97% compared to that in PBS solution. The results revealed the promising potential of the material for determining CAP in real samples, particularly milk.
4. Conclusions
In conclusion, a simple and efficient method was developed to fabricate ZnCo2O4 nanoparticles with diameters ranging from 20 to 500 nm according to the temperature of the heat treatment process. The application of ZnCo2O4 nanoparticles for detecting CAP in PBS solution was investigated using the electrochemical sensing method and a material that could modify the surface of the working electrode of the SPE sensor. The sensor modified with ZnCo2O4 annealed at 600┬░C exhibited extraordinary performance for CAP detection, with a detection range of 1ŌĆō300 ╬╝M, corresponding to the calibration line that had a coefficient of determination of 0.999 and LOD of 0.15 ╬╝M. Furthermore, the sensor showed great selectivity to CAP, with negligible response to some other compounds in the measuring solution. The electrode displayed excellent stability when the detection performance did not change significantly after 30 days of exposure to ambient air. The performance of the sensor in relation to a real sample was also investigated by analyzing the current response in a solution of fresh milk. The sensor demonstrated its ability for application in real samples as a recovery above 97% was obtained compared to that in PBS solution. Based on our results, the material could serve as a promising material for detecting CAP in food and beverage products.