1. Introduction
Different electrochemical devices have been developed to benefit from the energy and responsiveness of the redox reactions of different compounds. Devices such as organic LEDs have been developed based on the ability of certain polymers to emit light after certain redox reactions at the metal/material-organic interface [1]. In recent works, thin films composed of mixed metal oxides such as vanadium V and tungsten W have been deposited and electrochemically characterized to study electrochemical performances for applications in electrochromic and electrochemical energy storage [2]. Due to the nanostructured shape of such oxides, ion diffusion into and out of the films is promoted, which can facilitate charge storage during polarization. In addition to the fact that nanostructured oxide materials have turned out to be a new energy storage medium due to their electrochemical properties, they have also proved to be useful for generating electrical energy due to the high amount of surface area due to the inherent porosity. For this purpose, solar cells sensitized by pigment (DSSC) or quantum dots (QDSSC) have been developed. It should be noted that in other recent works, the performance of a QDSSC and a supercapacitor (built using electrochromic oxides) have been optimally coupled, resulting in a composite device capable of transforming solar energy, storing charge and generating charge indicators due to the color of the electrochromic material [3]. DSSCs have a lower efficiency than silicon cells, but the materials for their development are inexpensive and environmentally friendly [4,5]. Ruthenium complexes were commonly used as sensitizers in DSSCs leading to highest reported efficiencies. However, due to concerns about their environmental impact and potential toxicity, alternative approaches had been developed using natural organic pigments (NOPs) from leaves, seeds, flowers, insects, etc. [6,7]. Although NOPs-based DSSCs are less efficient, they are environmentally friendly. Platinum is the most efficient catalyst in the counter electrode due to its inherent catalytic properties; however, the cathode is covered with carbon since this also has catalytic properties but at lower cost.
For the reasons mentioned above, a device such as the NOPs-based DSSC and carbon-based electrode offers a promising eco-friendly inexpensive solution, aiming to enhance the sustainability and safety of DSSCs as an alternative to inorganic and fossil fuel solar cells, striving for comparable performance. Studies carried out to determine the performance and efficiency of synthetic pigment-based DSSCs reveal that they depend on several factors such as the molecular structure of pigment [8ã11], the type of ions in the redox couple [12], the grain boundary conditions and the TiO2 film [13,14], etc.
The different techniques used for characterization enhance the different electrochemical parameters involved in the operation of a DSSC. The photoelectrochemical impedance technique (PIT), is one of the most used techniques in DSSCs characterization, as it allows to obtain information on the electrochemical parameters of each electrode and electrolyte of the DSSCs in the illumination state, this is done by imposing a sinusoidal signal in the steady state of illumination on the carriers:: n(x,t) = n + ûÝ, where n is the steady state electronic concentration and ûÝ is the sinusoidal excitation of amplitude 10 mV approx. [15]. The technique is mainly ün = 1/krec, based on Fickãs laws with a certain recombination term related to the carrier lifetime. The PIT technique also allows determining the electronic concentration in the film by the chemical capacitance parameter, typical of a porous electrode system [16,17]: Cö¥ = Cö¥, cb + Cö¥, ss. This is a consequence of the distribution of the trap states and conduction band states from the oxygen vacancies at the grain boundaries (Ti3+).
Fig. 1 shows the electronic distribution in the conduction band in dark stage A and in light stage B. Two different trap state distributions are also shown: The first one with a lower slope, and the second one with a higher slope in the exponential distribution. When a DSSC is operating in dark (distribution A Fig. 1) and light (distribution B Fig. 1), electrons are trapped and released with certain velocities (average trapping velocity: vtrapp and average de-trapping velocity: vdetrapp) until they reach the collector.
Such rate constants will depend on the ability to neutralize the charge in the trap states by the cations (Na+, K+, Li+) in the electrolyte. Therefore, a factor that will determine the average detrapping rate is the ease of the counterion to penetrate the TiO2 film and neutralize the trap states by forming an ionic pair in the pores and immobilizing the charge, which is why the size of the cation has an influence. As can be seen in Fig. 1, another factor that also influences the average rate of detrapping is the distribution of trap states, the average energies or depth of the trap states mc are higher in distribution 1 than in distribution 2, thus it will be easier to release an electron in a semiconductor oxide film that presents a distribution of trap states of type 1. When the trapped electrons are affected by either of the two factors mentioned above, vdetrapp tend to decrease, which causes the carriers to increase the time to reach the collector (TCO) üc.
In order to study separately the factor that represents the neutralization of charge in the trap states through the insertion of cations (Na+, K+, Li+) in the film and the consequent decrease in the rate of detrapping, electrodes with the same particle size and heat treatment at the same temperature have been prepared, therefore it can be considered that in the ratio of electron collection time üc and short circuit current density Jsc, mc remains constant in each electrode [18]:
Where
a = k B T m c
It should be noted that from Eq. (2), it is understood that when Dn is maximum, üc is minimum and Jsc is maximum. Moreover, if mc is constant, the short circuit current will depend on the diffusion coefficient Dn or the adsorption and desorption velocities (va and vd) of the counterions in the film.
The steady-state chemical capacitance is crucial since it is related to the effective electron diffusion coefficient Dn by the generalized Einstein relation. There are reports that the concentration of trap states in a porous TiO2 anatase electrode is of the order of 1015 cmã3 [20]; and there is large distribution throughout the film, both indicating that the effective electron diffusion coefficient Dn(n), is dependent on the electronic concentration in the film, and therefore on its illumination or dark state. As mentioned before, the PIT technique also provides information about the impedance of the electrolyte and the counter electrode, which are very often modeled using Warburg impedance ZW and a circuit CCERCE, respectively [21].
The photoelectrochemical impedance technique, by providing a frequency sweep, imposes a steady state for each frequency that allows obtaining the electrochemical parameters in steady-state illumination. The electrochemical parameters during the transition from the dark to the illuminated state are crucial in the full operation of DSSCs. In that transient, the current or voltage delivered by the cell can be affected by the connected load, due to the impedance coupling related to the maximum power transfer to the load [22]. The impedance coupling between the DSSC and the load can, at times, lead to inefficiencies or even prevent the cell from functioning optimally due to poor connections. To address this issue, our study focuses on understanding and analyzing the transition from the dark state to the illumination state of a NOPs-based DSSC with a carbon-based counter electrode. The transient phenomenon is studied by measuring the photocurrent density during the incidence of square pulses of light applied to the DSSC.
In order to know the electron diffusion coefficients in the light-dark transition and the behavior of the chemical capacitance with ions added to the electrolyte, Fickãs second law was applied and adjusted to a system of this nature, obtaining a model for the determination of the diffusion coefficient given by a nonlinear partial equation of second order, which tends to be complex to solve in comparison with the model of Dn = const [23]. To avoid the nonlinearity of the equation, the current dark stage and the illumination stage have been treated separately, assuming different electron diffusion coefficients in both stages.
Likewise, a hybrid carrier source model was considered for t ãË 0 and t ãÊ 0, where t = 0 s the onset of the luminous part of the pulse.
2. Methodology
When a DSSC undergoes an abrupt dark-to-light transition, the performance of the cell is influenced by the electron diffusion coefficient, Dn(n). It depends on the electron density and the characteristics and concentration of the added ions; these produce important variations on the magnitude and shape of the photocurrent profiles. The diffusion coefficients of both, the transient and steady states in dark and illumination conditions, were obtained by Cyclic Voltammetry (CV). The chemical capacitance for each ion in illumination condition,
C ö¥ i o n ã ( C ö¥ L i + , ã C ö¥ N a + , ã C ö¥ K + )
The photoelectrochemical impedance technique was used to determine the diffusion coefficients for each added ion:
D n s s , . l i g h t L i + = 5.59 û 10 - 4 ã cm 2 ã s - 1 , D n s s , . l i g h t N a + = 3.46 û 10 - 4 ã cm 2 ã s - 1 D n s s , . l i g h t K + = 1.33 û 10 - 4 ã cm 2 ã s - 1 D n s s , . d a r k L i + = 38.1 ã cm 2 ã s - 1 û D n s s , . d a r k N a + = 9.86 ã cm 2 ã s - 1 D n s s , . d a r k K + = 12.41 ã cm 2 ã s - 1 D n t r a n s . L i + = 1.86 û 10 - 5 ã cm 2 ã s - 1 , D n t r a n s . N a + = 2.494 û 10 - 5 ã cm 2 ã s - 1 D n t r a n s . K + = 6.598 û 10 - 3 ã cm 2 ã s - 1
2.1 Theoretical considerations
Due to the morphology of the photoelectrode, it is possible to neglect drift currents because the particle size (assuming spherical) of the anatase used is èr ã 102. This implies that the potential difference is less than the energy of the thermal potential
k B T = 45 o q
2.2 Modeling the electron diffusion coefficient
As it is known, in a DSSC, electrons are generated through the dye molecules and diffuse throughout the film via the surface trap states and conduction band, moreover, the generated electrons can recombine with the oxidized species at the TiO2/E interface [16,25]. Such processes can be modeled by the electrochemical impedance proposed by Bisquert et al. [15]. For the study of the transition from the dark state to the light state, a hybrid model of the carrier source is given by:
Such a model consists of a Heaviside step function H(t) in time for which a constant function in time has been taken for t ãË 0 in the illumination state, but dependent on the position given by the Lambert-Beer absorption law. Here öÝ represents the effective adsorption coefficient of the pigment molecules distributed on the film of thickness L, and I0 is the irradiance or the coefficient of the effective flux of incident photons. Thus, the model describing the system is given by:
Where C2 represents the concentration of carriers in the solid phase (2), (electrons), C20 is the initial concentration of the same species in the same phase, k is the recombination frequency, and Dn the effective electron diffusion coefficient in the film.
However, during the dark-to-light transition, which is when the electronic charge is injected in an order of femtosecond [26], the recombination can be neglected since it is of the order of 101ã102 Hz in this case. Therefore, Eq. (4) can be rewritten in the transient state as:
In reported studies [27], it has been shown that the electron diffusion coefficient is highly dependent on the same electronic concentration C2:
Where l ã2ã3, is a parameter related to the distribution of the trap states [28]. Then, the model is a nonlinear partial differential equation with no analytical solutions. At Ref. [23], solutions were determined by numerical methods for illum,ination pulses of Eq. (5), but those results do not fit the experimental results. Therefore, in the study of dark-illumination transients proposed in this work, an approximation is used in which Dn is time-dependent rather than electron concentration-dependent:
Where
D n ãý
Where the carrier source given by Eq. (3) has also been used. On the other hand, the boundary conditions when measuring the photocurrent generated by the DSSC in short circuit will be given by:
The first condition implies that in TCO the concentration is only time-dependent and is proportional to the concentration gradient evaluated in x = 0, where the proportionality constant is given by the ratio of the electron extraction rate kext. at the TCO contact.
At x = 0, due to the low charge generated by the NOP used [29], it is considered that there is no electrical or transport impediment for the electrons to reach the collector, this is reflected due to the low screening of the electrons arriving at x = 0 and that there is a maximum in the concentration gradient in that region. Therefore, at this boundary, it can be considered that the charge control is first-order kinetic (Arrhenius type) and consequently the diffusion coefficient in that region will be given by
At the other boundary, in x = L, at the mixed-phase electrode boundary (MPEB) and the bulk of the electrolyte was determined with the electron flow completely blocked, thus the concentration gradient is minimal and equal to zero and hence there is no electron diffusion in that zone.
The solution for the model C2 (x, t) is given by:
That through the continuity conditions of the carrier density: ntãÊ0(0,0) = ntãË0(0,0) and the current density in the whole film: JtãÊ0(x,0) = JtãË0(x,0), it is obtained the parameter relationship with the coefficients: c1, c2, c3 and Bn
Parameters of model the DSSC for Li+; c4 and c5 are parameters determined by fitting experimental results.
As it can be observed Eq. (10b) for t ãË 0 is a summation of different exponentials, which could represent the contribution of each of the charge species contributing to the current in phase (2). Each species is identified by its diffusion frequency given by:
Where ün is the diffusion frequency of the umpteenth component of the current.
Up to this point, it has been considered in the model that the charge transfer at the bottom, i.e., at the phase (1) or TCO/electrolyte (TCO/E) interface of the pore is zero, however, sometimes the photocurrent measured at the TCO (x = 0) is affected by the charges accumulated at the bottom of the pores of the mixed electrode and in the steady state can be taken into account by means of the impedance ZB of Fig. 2. When this area is exposed directly with the electrolyte both recombination and charge accumulation can arise [13]. Since both processes demand charge in that region, they can modify the photocurrent profile measured in the transient.
In these cases, the model is modified if it is initially assumed that a quantity of carriers: öÇ(x)[C2|t ãÊ 0(x = 0, t = 0)], is injected into the TCO from the sensitized TiO2 layers at the TCO/TiO2 + dye interface; where C2|t ãÊ 0 indicates that the evaluation is done in part of the solution when t ãÊ 0. Once the charge is injected into the TCO, some carriers tend to return to the mixed-phase electrode by a new reinjection at the TCO/E interface but in a different direction (from the TCO to the electrolyte). As discussed above, the movement of carriers in the opposite direction is due to the accumulation of ions of different signs at the TCO/E interface and may cease until their steady state impedance ZB in direct current is obtained. Since charge neutrality tends to be preserved in the film, it is equivalent to thinking that in x = L, a number of holes has been injected equal to the quantity of electrons injected in x = 0, and that the concentration in the same region is zero. One way to guarantee this boundary condition is to establish a charge of equal magnitude, but different sign at x = ãL, the other condition will be given by the blocking of electrons at x = L. Considering that the same model of Eq. (8) for t ãË 0 and the initial condition mentioned above we have that the electron concentration will be given by:
Since the measured current density is given by:
J = q D n ã C 2 ã x | x = 0
For the part of t ãÊ 0 the solution will be given in the same way by Eq. (10) respectively.
3. Experimental
3.1 DSSCs construction
The semiconductor oxide film was prepared based on a clay of TiO2 anatase at 99.99% particle size < 10 nm (Sigma-Aldrich) and 99.99% glacial acetic acid (Sigma-Aldrich), the film was deposited by the doctor-Blade technique on a conductive FTO glass from
8 - 10 ã öˋ s q u a r e
Complementarily, the electrolyte employed for filled the three studied DSSCs was a 5:95% v/v solution of 3-methoxypropionitrile (Sigma Aldrich, 99%) and acetonitrile (Sigma Aldrich, 99%) containing 1 mM of LiI, KI, and NaI, in the presence of I2 to promote the formation of triiodide ions
I 3 -
3.2 Experimental model
As it has been determined, the behavior of the issued photocurrent depends on the diffusion coefficient Dn, which, as stated above, depends on the electronic concentration in the mesoporous given by: n = ncb + nt, the electronic concentration in the conduction band states and the electronic concentration in the trap states. Therefore, it is crucial to determine both the electronic structure and the presence and distribution of trap states in the TiO2 film used as electrodes.
Micro-Raman experiments were performed using a DXR Thermo Scientific dispersive Raman microscope to confirm the anatase structure of the TiO2 films which were covering the surface of the FTO photoanodes, as well as the graphitic (G band) and the amorphous (D band) composition of the carbon-based counter electrodes (see Fig. 3).
In order to gain an understanding on the presence and distribution of trap sites in the anatase TiO2 films, cyclic voltammetry (CV) experiments were performed using an Epsilon BAS potentiostat-galvanostat which was connected with a three-electrode cell (see Fig. 4) where a silver (Ag) and a platinum (Pt) wire were used as pseudo-reference and counter-electrodes, respectively. Complementarily, FTO plates coated by anatase TiO2 films were employed as working electrodes. The electrochemical cell was filled by a 5:95% v/v solution of 3-methoxypropionitrile (Sigma Aldrich, 99%) and acetonitrile (Sigma Aldrich, 99%) containing 1 mM of LiI, KI, and NaI, in the absence of I2 to inhibit the formation of triiodide ions I3ã.
The photoelectrochemical response of the DSSC was studied under visible light illumination (10 mW cmã2 - light power provided by an MR16 GE 12Vã50W halogen lamp equipped with a dichroic reflector) by performing photo-electrochemical impedance spectroscopy (PEIS) experiments using an IM6 BAS-Zahner potentiostat-galvanostat where the frequency was scanned from 1 MHz to 50 mHz, whereas D.C. (equals to the open-circuit potential of the photocells) and A.C. signals (amplitude of ôÝ10 mV) were applied under the steady-state of the DSSC.
For the study of the dark-light transient state, a dark-light time-varying amplitude step with an intensity of 100 mW cmã2 and a rising slope of 250 mV sã1 was applied on the electrode side of each DSSC using a 50 W halogen lamp, overlying a hot mirror lens (Edmund Optics model 47303) between the DSSC and the lamp to reduce heat transfer. The photocurrent obtained from each DSSC as a function of time was measured by the Keithley 2400 Source-Meter, using a KUSB-488B data acquisition interface and LabView v. 2014 based Software.
4. Results and Discussion
4.1 Micro-Raman spectra
The composition of both films was determined by the micro-Raman spectra of both electrodes. Fig. 3a shows the spectrum of the photoelectrode, which presents a greater orientation in the crystallographic plane (101) anatase. On the other hand, the counter electrode shows a concentration of graphite, identified by means of the G band, Fig. 3b.
In the mesoporous film, a higher concentration of crystallographic plates (101) has been determined, which is a crucial factor in the injection of electrons and the presence of trap states in the gap. In the activated carbon film, a concentration of graphite is found which allows catalysis at the counter electrode.
4.2 Trap states for each ion
Trap states are a determining factor in the variations of the diffusion coefficient Dn during a transient. Another important factor is the ions present in the electrolyte that can recombine and form ionic pairs with the electrons of the occupied trap states. Therefore, the presence and distribution of these ions were determined. In Fig. 5,ã12, the trap states that can be neutralized by different ions Li+, Na+ and K+ using the cyclic voltammetry (CV) technique.
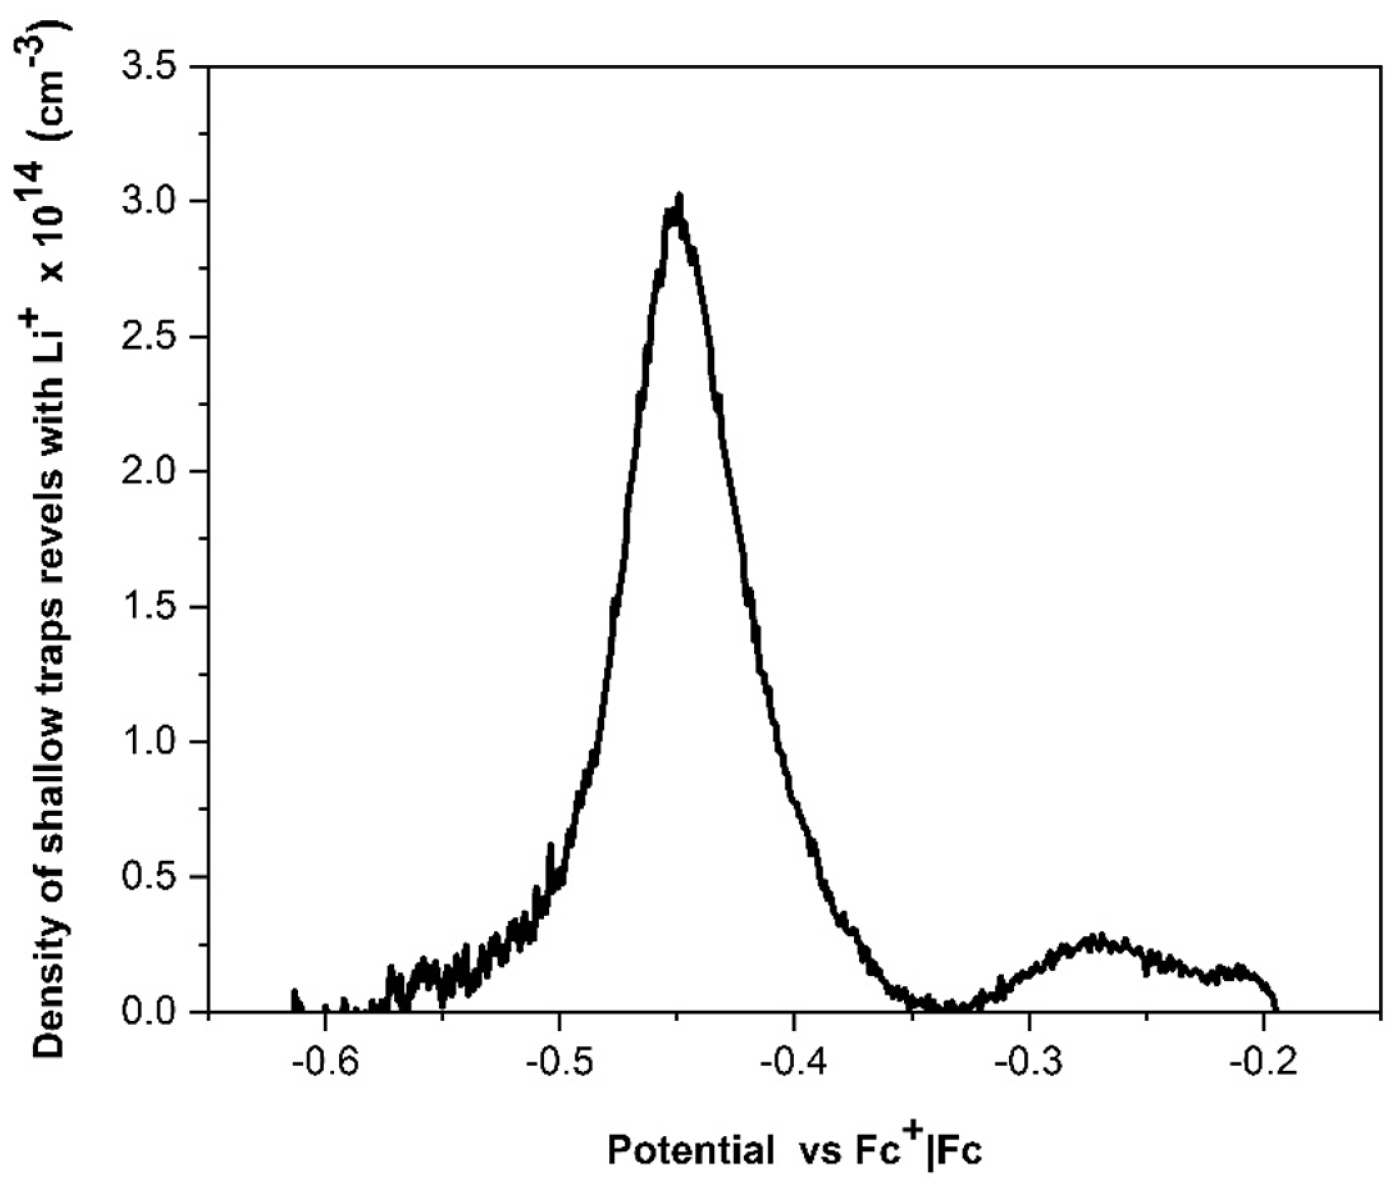
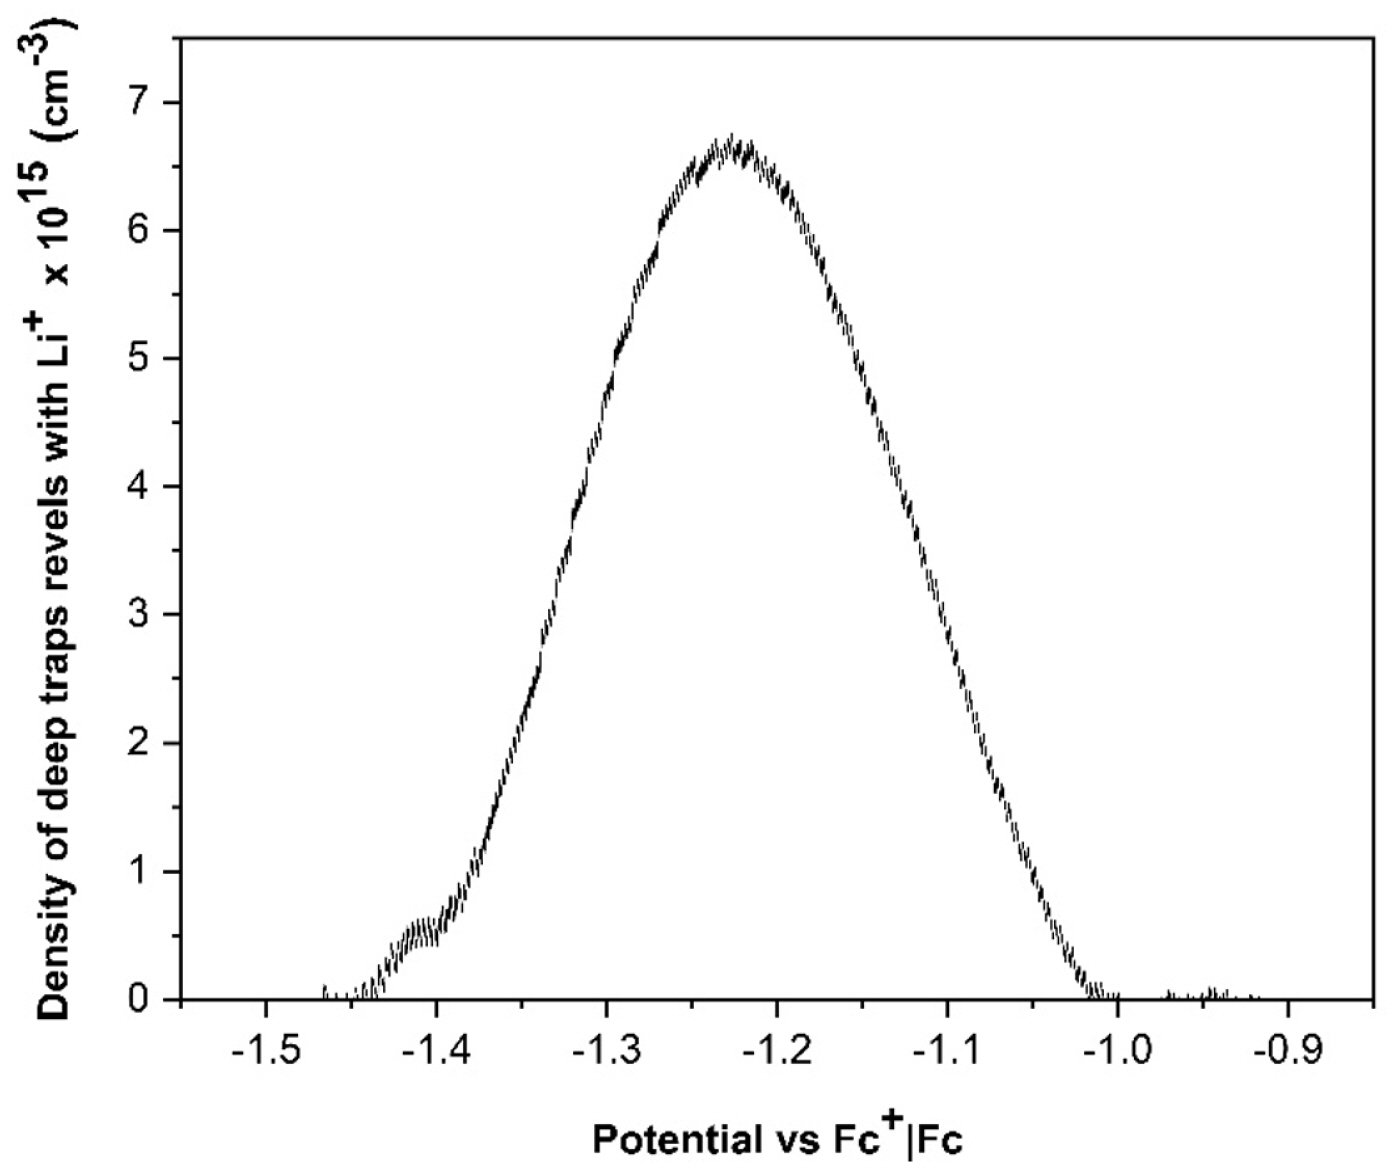
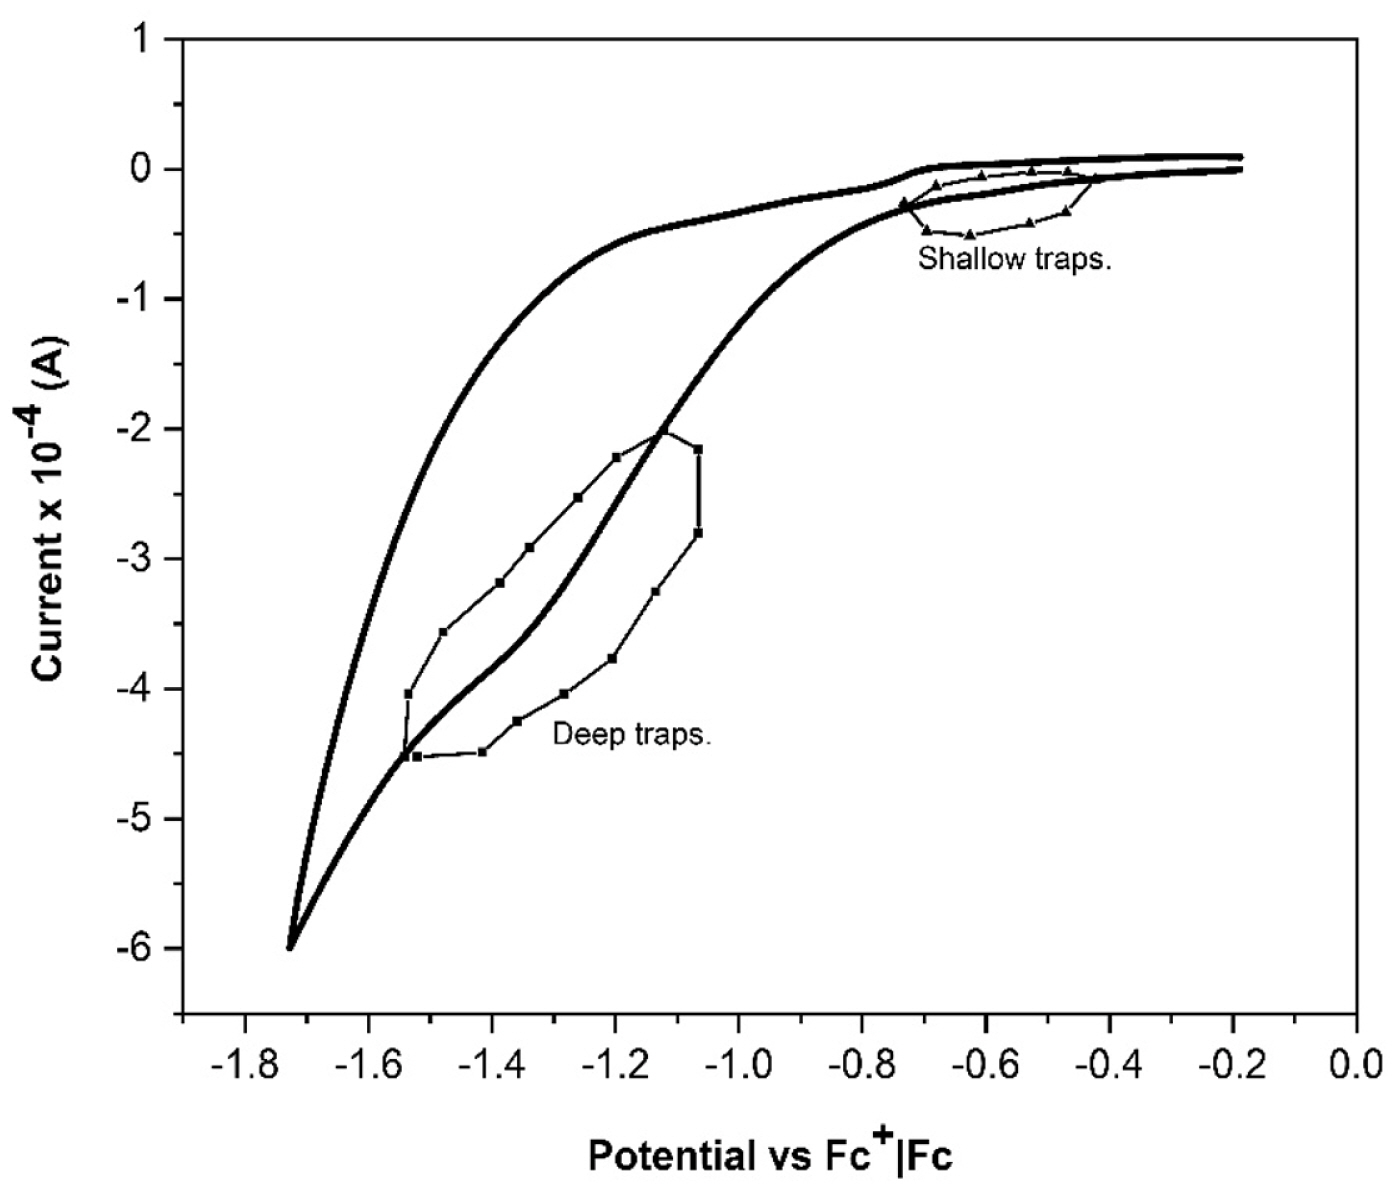
Fig. 5 shows the voltammogram that allows determining the presence and location of the trap states that can neutralize the Li+ ion; the peaks in the voltagram in the interval [ã0.579, ã0.335] Potential vs. Fc+|Fc are evidence of the presence of surface trap states on the photoelectrode [30]. The presence of trap states at deeper levels neutralized by the same ion is also determined in the interval [ã1.469, ã0.986] Potential vs. Fc+|Fc.
Fig. 6 shows the distribution of the surface trap states neutralized by the ion Li+. These states are due to the crystallographic concentration (101) in the film which gives rise to states at the grain boundaries, then, it is also an important factor in the chemical capacitance. Ti3+ at the grain boundaries, and it is also an important factor in the chemical capacitance Cö¥, cb at the TiO2/E interface [31]. Since the pores in the photoelectrode allow the passage of a certain number of cations.
The distribution of the deepest trap states is shown in Fig. 7, it is also an important factor in the variations of the electron diffusion coefficient and chemical capacitance Cö¥, ss of the surface states in the solid phase of the mixed-phase electrode.
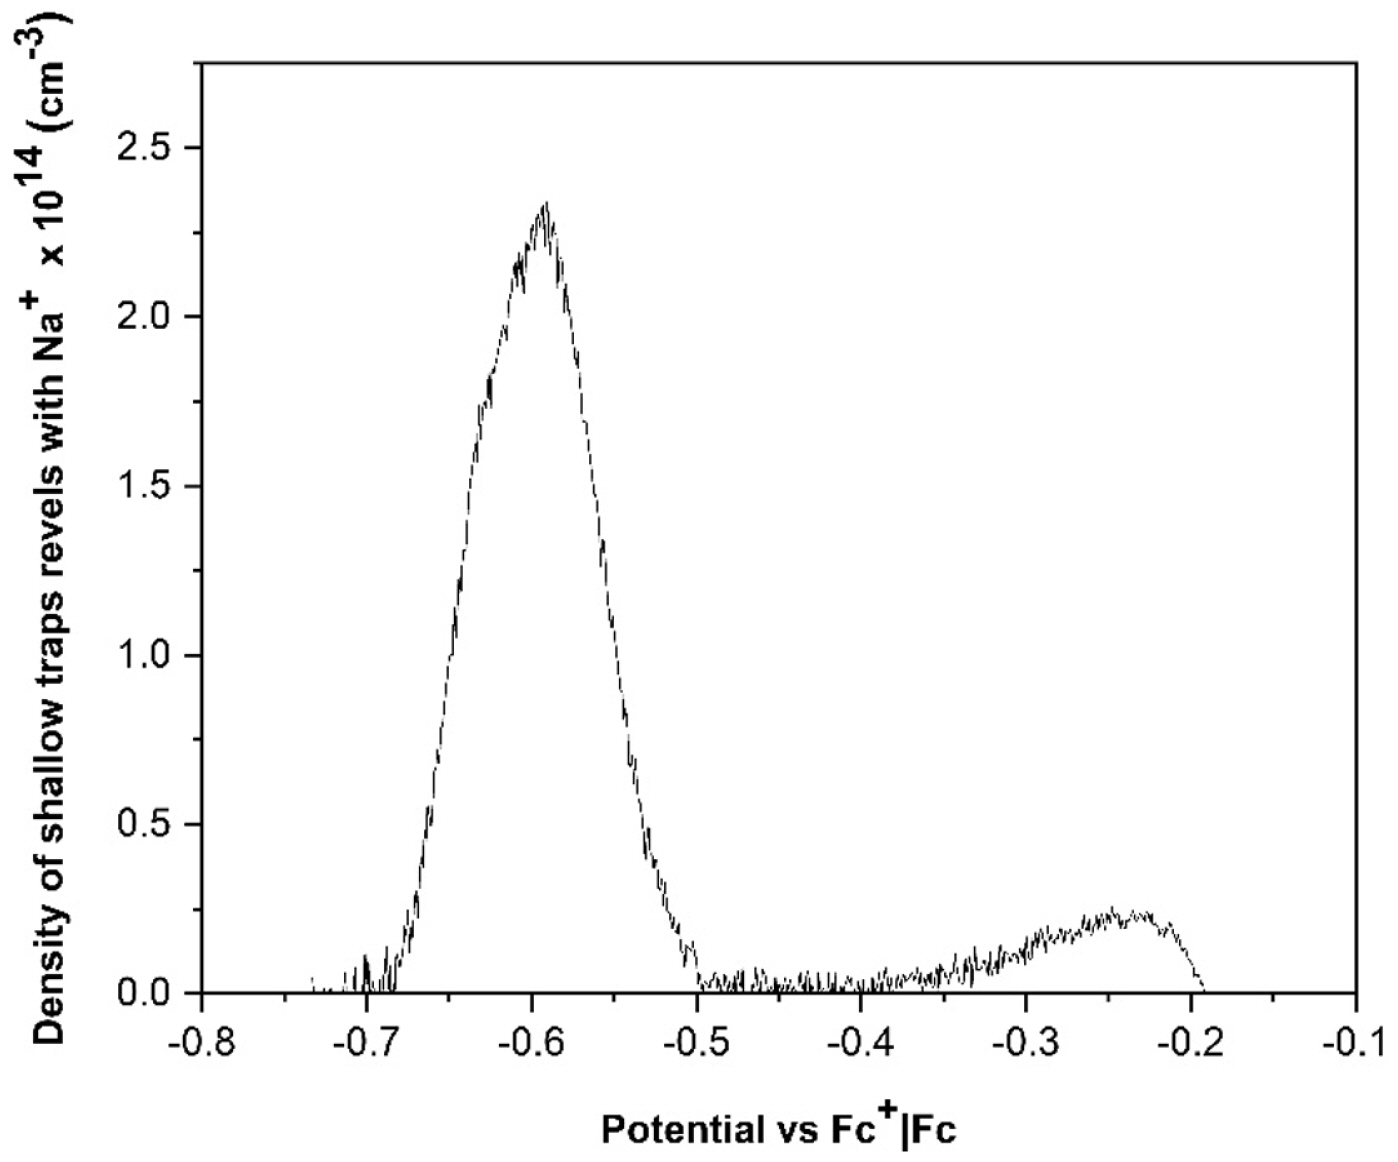
In Fig. 8, the voltammogram that allows determining the presence and location of the trap states that can neutralize the Na+ ion; in the interval [ã0.672, ã0.539] Potential vs. Fc+|Fc the presence of shallow trap states has been determined and in the interval [ã1.548, ã1.118] Potential vs. Fc+|Fc the deep trap states have been determined.
In this case, as can be seen in Fig. 9, the surface trap states neutralized by the cation Na+ are less than those neutralized by the cation Li+ shown in Fig. 6.
For the deep trap states neutralized by the same cation, a lower population is determined than those neutralized by the ion Li+, which reflects a lower diffusion of ions into Na+ in the pores of the photoelectrode, this could be attributed to its size, Fig. 10.
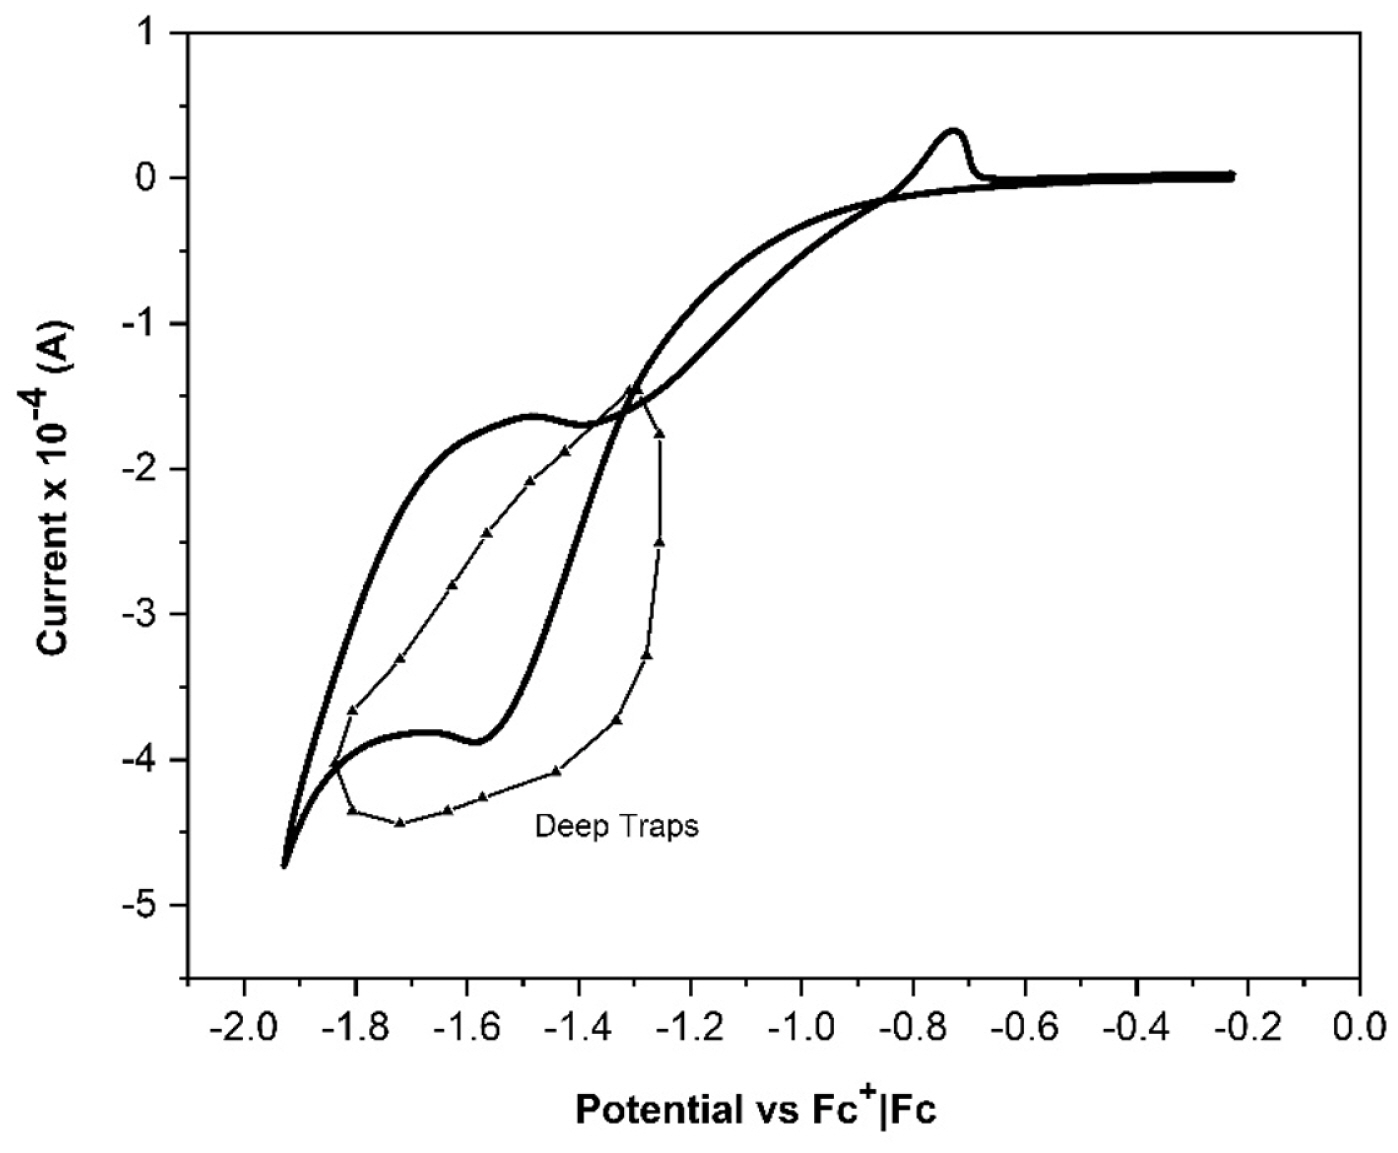
As can be seen in Fig. 11, the ions of K+ fail to diffuse in the film in the same way as ions of Li + or Na+, this is reflected in the null neutralization of shallow trap states. The states that do manage to neutralize are the deep states in the interval [ã1.829, ã1.304] Potential vs. Fc+|Fc The Fig. 12 shows the distribution of the states neutralized by the ion K+, which, as can be seen, neutralizes a larger number of deep trap states. It should be noted that the cyclic voltammetry (CV) technique was performed with a scanning speed of 25 mV sã1, a speed with which the system is polarized, which allowed the distinction and distribution of trap states that manage to neutralize each ion.
4.3 Photoelectrochemical impedance spectroscopy (PEIS)
The trap states occupied during DSSC operation, in the illuminated state, as well as other parameters were estimated by PEIS, which also allows for estimating the steady state illumination diffusion coefficient. Fig. 13 shows the impedance behavior Z(ü) of the different DSSCs with different cations. Here, are determined: üK+ = 89.047 sã1, üNa+ = 186.74 sã1 and üLi+ =353.3568 sã1 additionally, diffusion frequencies were estimated in the TiO2 film anatase of üK+ = 689.6551 sã1, üNa+ = 988.0495 sã1 and yüLi+ =2,500 sã1.
Using the Software Zview v.3.2b, an adjustment of Bisquert model DX1-Bisquert # 2 was performed [13,25], electrochemical parameters in the illuminated state of the different DSSC were estimated and are listed in Table 1.
Where Rpore = rpore û L is the resistance to the ionic transport in the phase (1), Ret = ret û Lã1 is the resistance to the electronic recombination at the TiO2/E interface, Cö¥, cb = cö¥, cb û L is the chemical capacitance due to the occupied states of the conduction band, Cö¥, ss = cö¥, ss û Lã1 is the chemical capacitance due to the occupied trap states, Rtr = rtr û L is the electron transmission resistance in the phase (2). In addition, it was determined Rt = Rsubs + Rce that is the total resistance of the counter electrode and Rsubs = 196.1 öˋ, 146 öˋ and 207.6 öˋ for the DSSC with Li+, Na+ and K+ respectively, the substrate resistance or the measured FTO.
On the other hand, it was also determined the electron diffusion length LD given by the relation [32]:
Table 2 shows the values of steady state diffusion coefficients in illumination for the different ions added to the DSSCs:
4.4 Light-dark transients
To determine the diffusion coefficient in the transition from the dark steady state to the illumination steady state, the photocurrent signal emitted by each of the DSSCs was fitted to the model expressed by Eq. (10a,b) for the DSSC with the Li+, Na+ and K+ ions. By taking in each part of the model eãC2(0,0) and the boundary conditions, the DSSC with Li+ ions yielded the following values of the fit parameters, shown in Tables 3 and 4:
For the case of DSSCs with Na+ and K+ ions, she density of injected electrons was considered to be given by
C 2 t ãÊ 0 ( 0 , 0 )
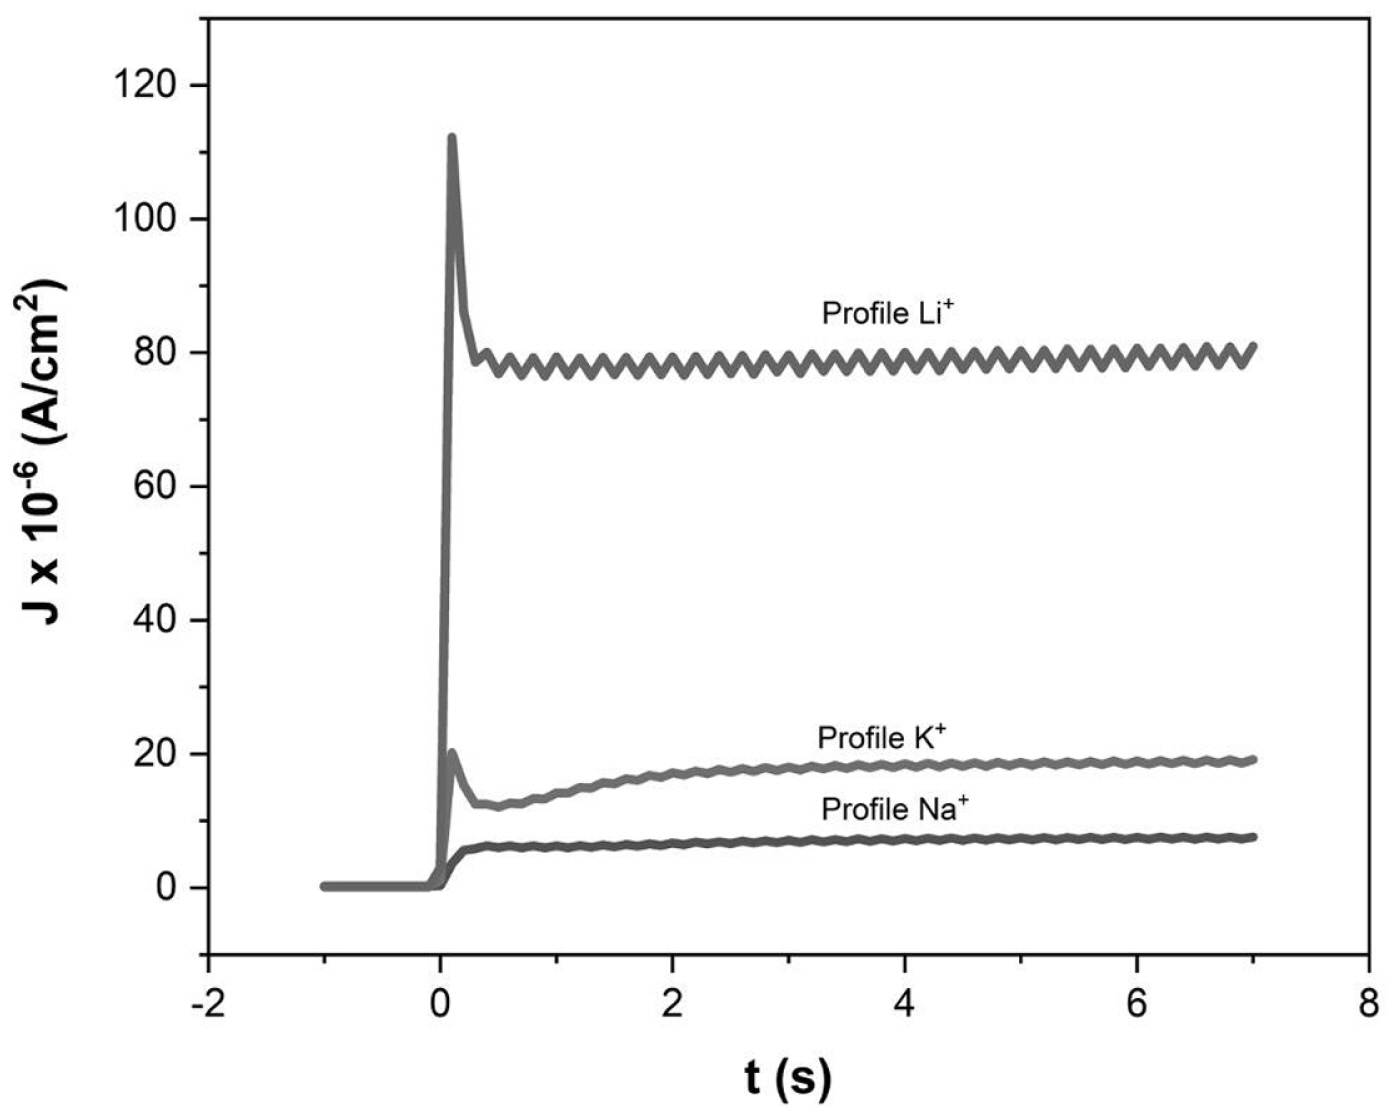
In Fig. 14, signal of the transients in each DSSC is observed, as can be seen, the profile depends both on the ions used that can modify the model and the different electrochemical parameters.
Tables 7 and 8 were obtained the model parameters for Na+ ion at the same dark-light, transitory and steady state conditions.
The revealed trap states can be observed in the voltammograms, since Li+ are the smallest ions with access to shallow and deep trap states, therefore, they tend to neutralize those states beneficially promoting a decrease in the available charge at the TiO2/E interface and of the shallow trap states as can be seen in the Cö¥,cb and Cö¥,ss values for each DSSC. In the case of the DSSC with K+ ion due to null neutralization of the shallow states, presents a higher charge concentration at the TiO2/E interface than the DSSC with Li+ but not higher than the DSSC with Na+, because Na+ ions are smaller and diffuse in greater quantity in the pores of the film.
From the Table 2 to Table 4 for DSSC with Li+ ions, the change in the electron diffusion coefficient during a light step can be determined. It is observed that in the dark state, the electron diffusion coefficient is higher, this is due to the majority of unoccupied states in the gap and conduction band, which facilitates the movement of carriers trapping and releasing from one state to another, which as can be seen from the same tables in the dark stage the concentration is 1.36699 û 10ã7 C cmã3. This relatively large value of the diffusion coefficient also explains why a large amount of charge is incorporated during injection. During the dark phase due to a relatively large electron diffusion coefficient, the dark current density takes a value of: 1.9852 û 10ã7 C sã1cmã2, this is due to the low population of carriers in such a state. On the other hand, it is observed that during the transient, the electron diffusion coefficient is lower, this is due to the charge that has been injected in the trap and conduction states. In addition, the electron diffusion coefficient has decreased since the ions of phase (1) of the mixed electrode perceive the electric charge injected in x = 0.
For DSSCs with Na+ and K+ ions that partially and completely neutralize the shallow states, a differently modeled photocurrent profile is presented, due to a part of the ions are not in the TiO2/E interface, and remain active in phase (1) and being in contact at the bottom of the pore with the FTO promotes the diffusion of holes in the photoelectrode with a diffusion coefficient Dh respectively for each ion. This causes that when electrons are injected in x = 0, an instantaneous displacement of the holes occurs by diffusion in the photoelectrode to the same position causing the photocurrent to drop by recombination, which gives rise to the profile of the photocurrent signal in both cells. Moreover, due to the ion concentration at the TCO/E interface, the overvoltage in that region can be modified, so the extraction rate kext. can be affected since it depends on the voltage [33].
In addition, an effective absorption coefficient was estimated for each DSSC, which, as can be seen in the tables above, has different values for each DSSC. In the tables, the lowest value is for the DSSC with Na+ ion, which could explain why it emits lower photocurrent density as can be seen in Fig 14. This could be due to the interaction of the Na+ ion with the carminic acid molecules of the pigment.
Fig. 15 shows that the size of the ion negatively influences the diffusion coefficient Dn, which could be due to the variation of the velocities va and vd in each ion according to the following situations:
Jsc could decrease if va is large, which could be happening with larger cations adsorbing faster (easier) than smaller ones, leading to a decrease in the rate of electron detrapping from the trap states.
Jsc could decrease if vd is small, which could be due to the fact that once the cations are adsorbed it is very difficult to desorb them, which causes the electrons to stay longer in the trap states and requires more energy to be released, also causing a decrease in the detrapping rate of the electrons from the trap states.
Therefore, if the open circuit voltage Voc is considered to remain constant, a variation in the short circuit current density Jsc or the diffusion coefficient Dn will be reflected in a variation of the DSSC efficiency:
öñ = J s c A V o c P l i g h t
5. Conclusions
In this study, it has been possible to model and experimentally determine the evolution of the electron diffusion coefficient from the dark steady state to the light steady state in DSSCs sensitized with carminic acid and a counter electrode based on activated carbon. The different DSSCs used in this work had different cations in the electrolyte solution: Li+, Na+, and K+ which allow revealing the trap states used to quantify the chemical capacitance in the pores of mesoporous TiO2. A strong dependence of the magnitude and shape of the profiles of the photocurrent sent by the DSSCs during the same transient on the cations used has been established since the trap states neutralized by the cations affect the electrochemical parameters in the DSSCs such as the diffusion coefficient itself and the rate of extraction kext. at the contact x = 0.
In addition, it has been possible to estimate an effective value of the absorption coefficient öÝ for each incorporated cation, using a hybrid model for the source of charge carriers in DSSCs excited with a light step, thus having a better understanding of the electrochemical parameters involved in the dark-to-light transition in DSSCs.