1. Introduction
Electrogeneration of hypochlorite ion (ClO−) from aqueous solutions of sodium chloride on modified electrodes is a relevant topic of study, since this specie participates in various processes of technological interest, such as the electrochemical disinfection of water or the electrooxidation of organic matter in the wastewater treatment [1,2]. Electrochemical oxidation is a promising electrochemical procedure for the remediation of wastewater capable of reducing the organic load and degrading recalcitrant compounds [3]. The use of dimensionally stable anodes (DSA) in the electrooxidation process has been shown to give good results due to their electrocatalytic properties and electrochemical stability [4]. DSAs are electrode materials that consist of a mixture of metal oxides coated on a metal substrate, usually titanium [4]. Electrooxidation with DSAs involves two fundamental mechanisms: direct and indirect electrochemical oxidation [5,6]. In the direct mechanism, electrons are exchanged between the contaminant and the electrode surface, whereas in the indirect mechanism, electrogenerated intermediates drive the oxidation of pollutants in the solution. The materials used as anodes can promote a direct and/or indirect mechanism depending on the oxygen evolution overpotential [5]. The chloride ion plays an important role in the indirect mechanism because its oxidation generates intermediates such as chlorine, hypochlorous acid and hypochlorite ion (Cl2, HClO, ClO−), known as active chlorine species or free chlorine, with the amounts of these species generated depending on the pH [7,8]. Cl2, HClO, ClO− are the main electrogenerated intermediates that drive the oxidation of contaminants in the bulk solution, and have a high capacity to oxidize various organic and inorganic contaminants [9]. However, in addition to these active chlorine species, other reactive chlorine species such as ClO2−, ClO3−, and ClO4− [7,8], as well as chlorine radicals, can be generated at the anode surface and can selectively oxidize some specific contaminants [10]. Although chloride ions have great potential in wastewater treatment by electrooxidation, the electrooxidation process also produces biotoxic derivatives (oxychlorides) with a high risk of affecting human health [11,12]. Thus, when performing indirect electrochemical oxidation, the experimental conditions should be carefully selected not only to maximize the removal of organic pollutants, but also to minimize the formation of potentially toxic chlorinated byproducts [3]. In the present work, the electrogeneration of hypochlorite ions during the electrolysis of NaCl solutions using a Ti/PtPd(10%)Ox DSA was analyzed using UV-Vis spectroscopy.
2. Experimental
2.1. Reactants
Sodium chloride (Merck AR) was used as the supporting electrolyte. Aqueous solutions of sodium chloride with different concentrations (2.5 to 4.5 g/L) were prepared with deionized water obtained from a Milli-Q system (18 MΩ cm). Aqueous solutions (1% w/w) of sodium hydroxide (Merck AR) and hydrochloric acid (Merck AR) were prepared and used to adjust the pH of the NaCl solutions. A commercial sodium hypochlorite (NaClO) solution (0.81 M; pH 12.9) was used as a hypochlorite source to generate a calibration curve for active chlorine species (HClO/ClO−) via UV-Vis absorption spectroscopy.
2.2. Electrodes
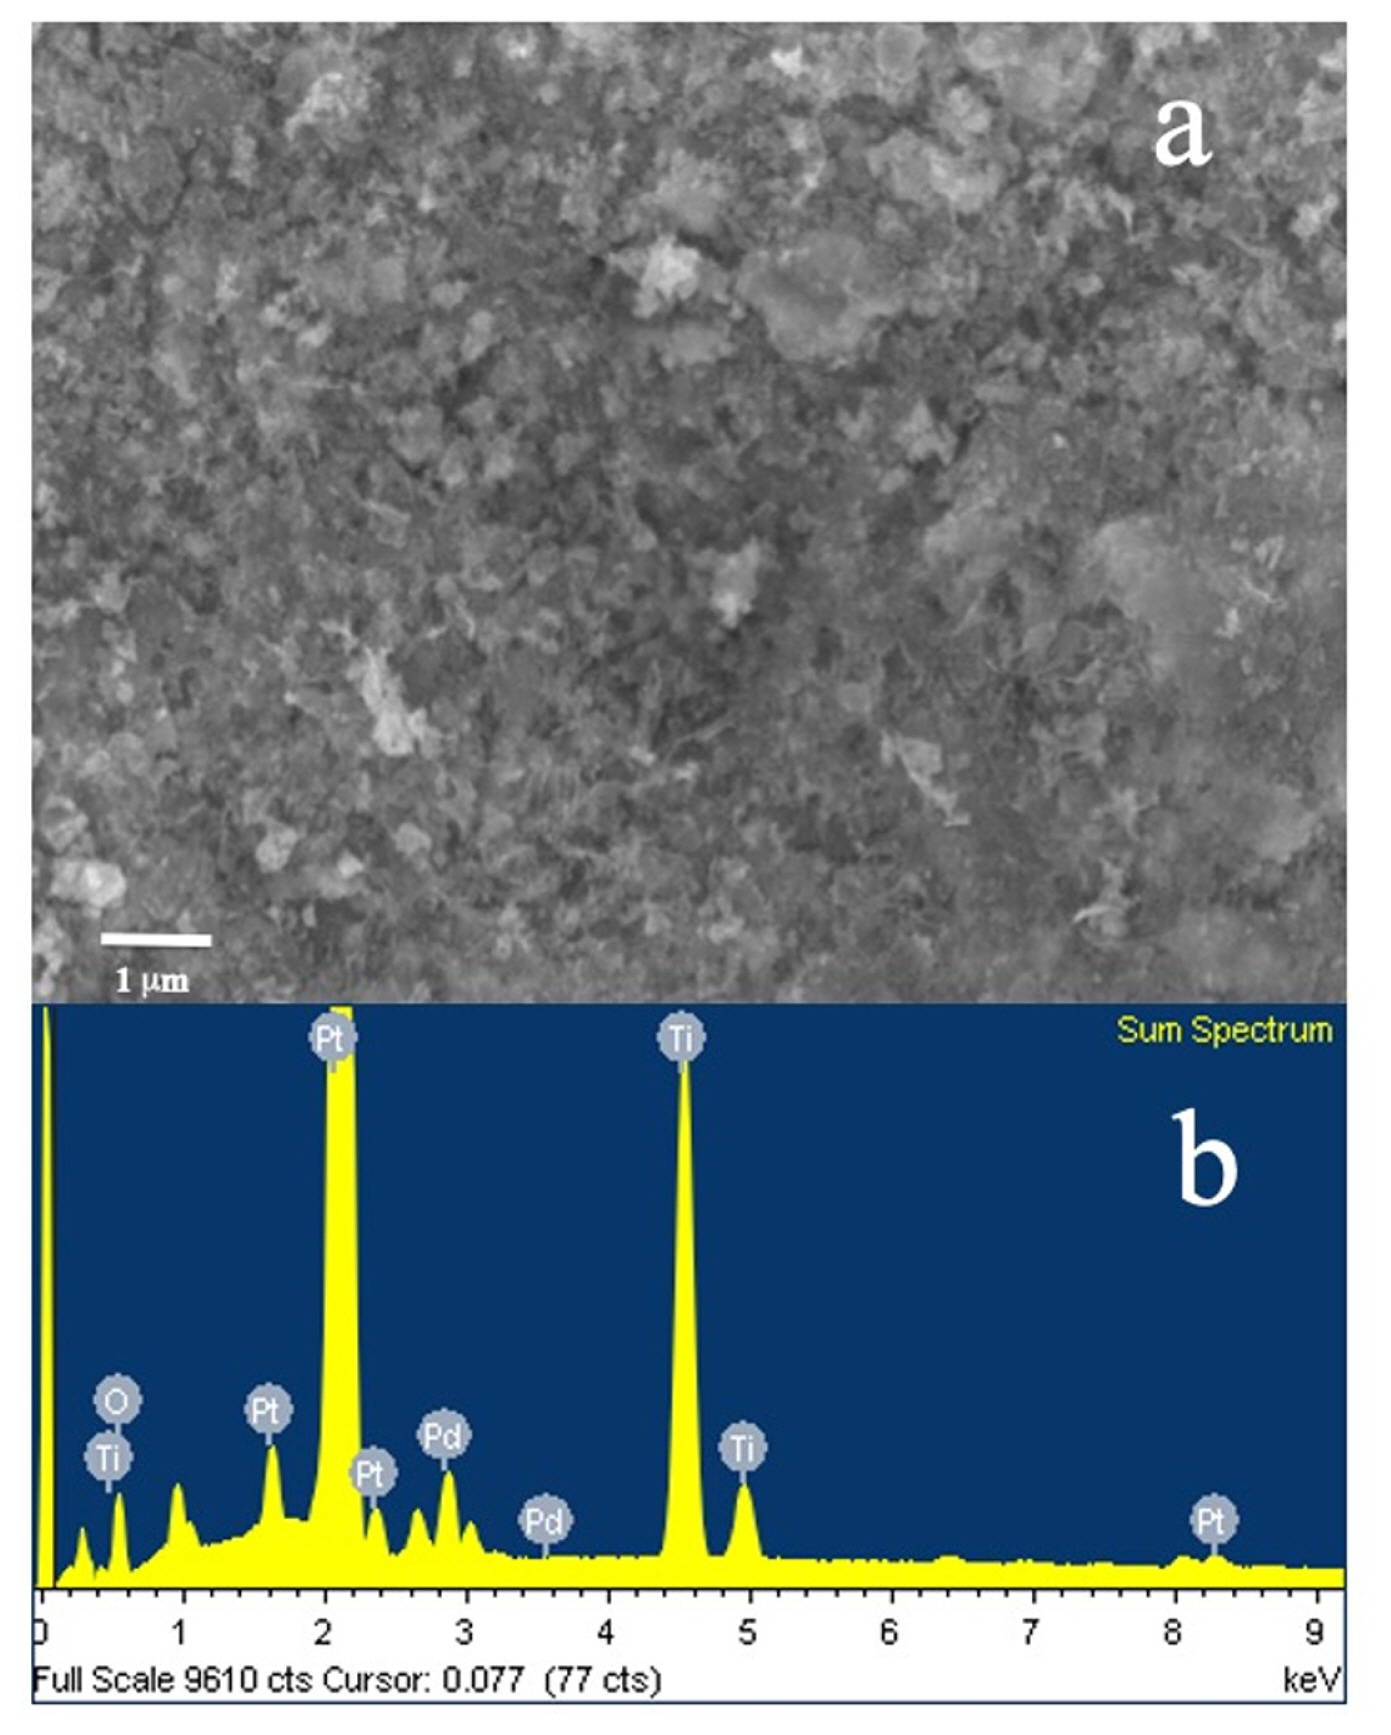
A PtPd(10%)Ox-coated titanium electrode was used as the anode, and a RuO2-coated titanium electrode was used as the cathode. These electrodes were prepared in our laboratory and were DSA-type electrodes. A titanium mesh (ASTM grade 2) was used to support the oxide layers. The mesh was prepared by thermally decomposing the precursors in an alcoholic solution and then brushing the mixture onto the metallic support. The solvent was evaporated at a low temperature (100°C) and the electrode was annealed for 1 h at 450°C to form the metallic oxide phase. The elemental content in the film (Pt and Pd) corresponded to the nominal molar percent composition of the precursor solution. The exposed electrode area was 42.5 cm2 considering both faces of the electrode (2×5.0 cm×4.25 cm). The electrodes were characterized using scanning electron microscopy (SEM) and energy dispersive X-ray spectroscopy (EDS) using a JEOL JSM-7600F instrument operated at a voltage of 15 keV.
2.3. Electrochemical methodology
The electrochemical system consisted of an electrochemical cell with a capacity of 150 mL and a sample volume of 100 mL. The Ti/PtPd(10%)Ox anode and Ti/RuO2 cathode were placed vertically in the cell in a parallel configuration with a gap of 3 mm. Active chlorine species were electrogenerated by the electrolysis of aqueous solutions of sodium chloride. The study variables were the concentration of chloride ions, initial pH, cell potential difference and electrolysis time. The cell potential difference (6–8 V) was applied from an external power source (model 1745a, BK Precision), and the current and voltage were measured using a conventional multimeter. The NaCl concentration and cell potential difference were set based on preliminary experiments on the formation of active chlorine species.
2.4. Analytical control
pH was measured using an Oakton model 510 potentiometer. Quantitative evaluation of hypochlorite ions electrogenerated during the electrolysis of NaCl solutions was performed via UV-Vis spectroscopy using a Perkin Elmer Lambda 20 model spectrophotometer. The calibration curve to determine the hypochlorite ion concentration was generated by taking the absorbance values of commercial sodium hypochlorite solution with different concentrations at 292 nm [13]. The commercial sodium hypochlorite solution was diluted with deionized water to the required concentration immediately prior to use.
3. Results and Discussion
3.1. SEM and EDS analysis of the Ti/PtPd(10%)Ox electrode
Fig. 1a,b show an SEM micrograph and the EDS spectrum of the PtPd(10%)Ox-coated titanium electrode prepared by thermal decomposition, respectively. The SEM image (Fig. 1a) shows that a rough heterogeneous surface was generated during thermal decomposition. The EDS spectrum (Fig. 1b) confirms the presence of Pt and Pd oxides on the Ti substrate, as well as the presence of the Ti substrate.
3.2. UV-Vis spectroscopy of an aqueous solution of NaClO
The commercial sodium hypochlorite solution (0.81 M) was diluted to produce free chlorine samples and to identify by UV spectroscopy the absorption bands corresponding to HClO and ClO−. When placed in aqueous solution, sodium hypochlorite is hydrolyzed to form hypochlorous acid according to the equation [14]:
Hypochlorous acid is a weak acid with the following acid-base balance:
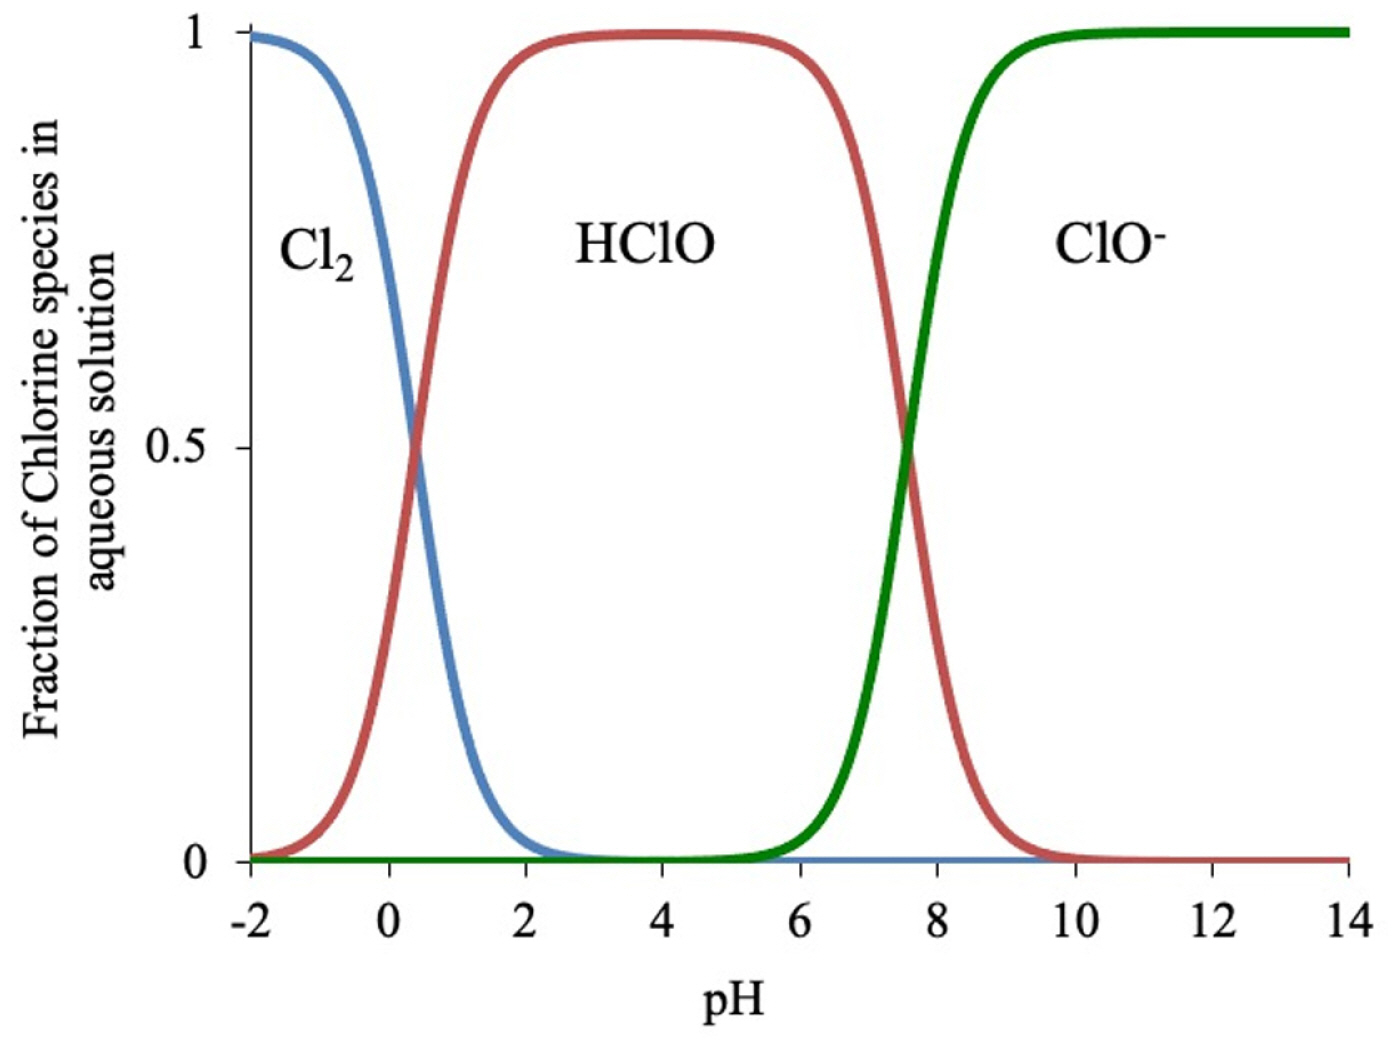
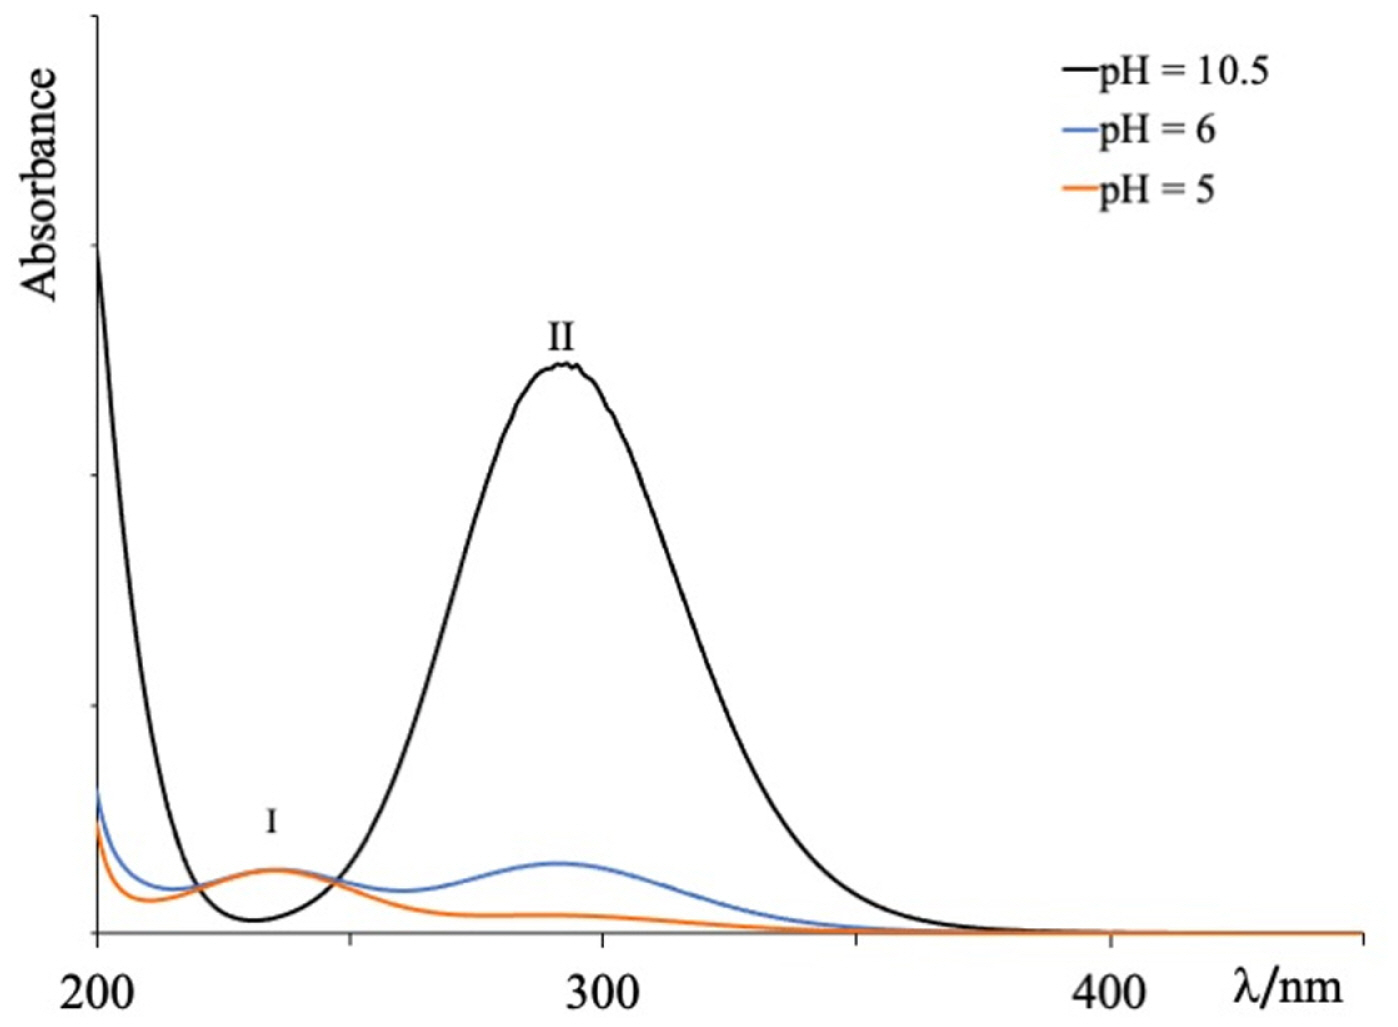
Fig. 2 shows the distribution diagram of active chlorine species (Cl2, HClO, ClO−) in a 1.0 mM NaClO solution as a function of pH at 25°C. According to the distribution diagram, the predominant species is Cl2(aq) up to pH 3, HClO at pH 3–8 and ClO− at pH > 8.0 [16]. Fig. 3 shows the UV-Vis absorption spectrum of the commercial NaClO solution (0.81 M) at different pH values. When the pH is 5 or 6, the absorption spectrum shows two peaks, one at 235 nm (peak I) and the other at 292 nm (peak II). These absorption peaks are associated with the presence of HClO and ClO−, respectively [17–19]. At pH 10.5, by contrast, only a single intense absorption peak is observed at around 292 nm (peak II) that corresponds to the hypochlorite ion (ClO−) as predominant species [17–19].
3.3. Correlation between maximum absorbance at 292 nm and ClO− concentration
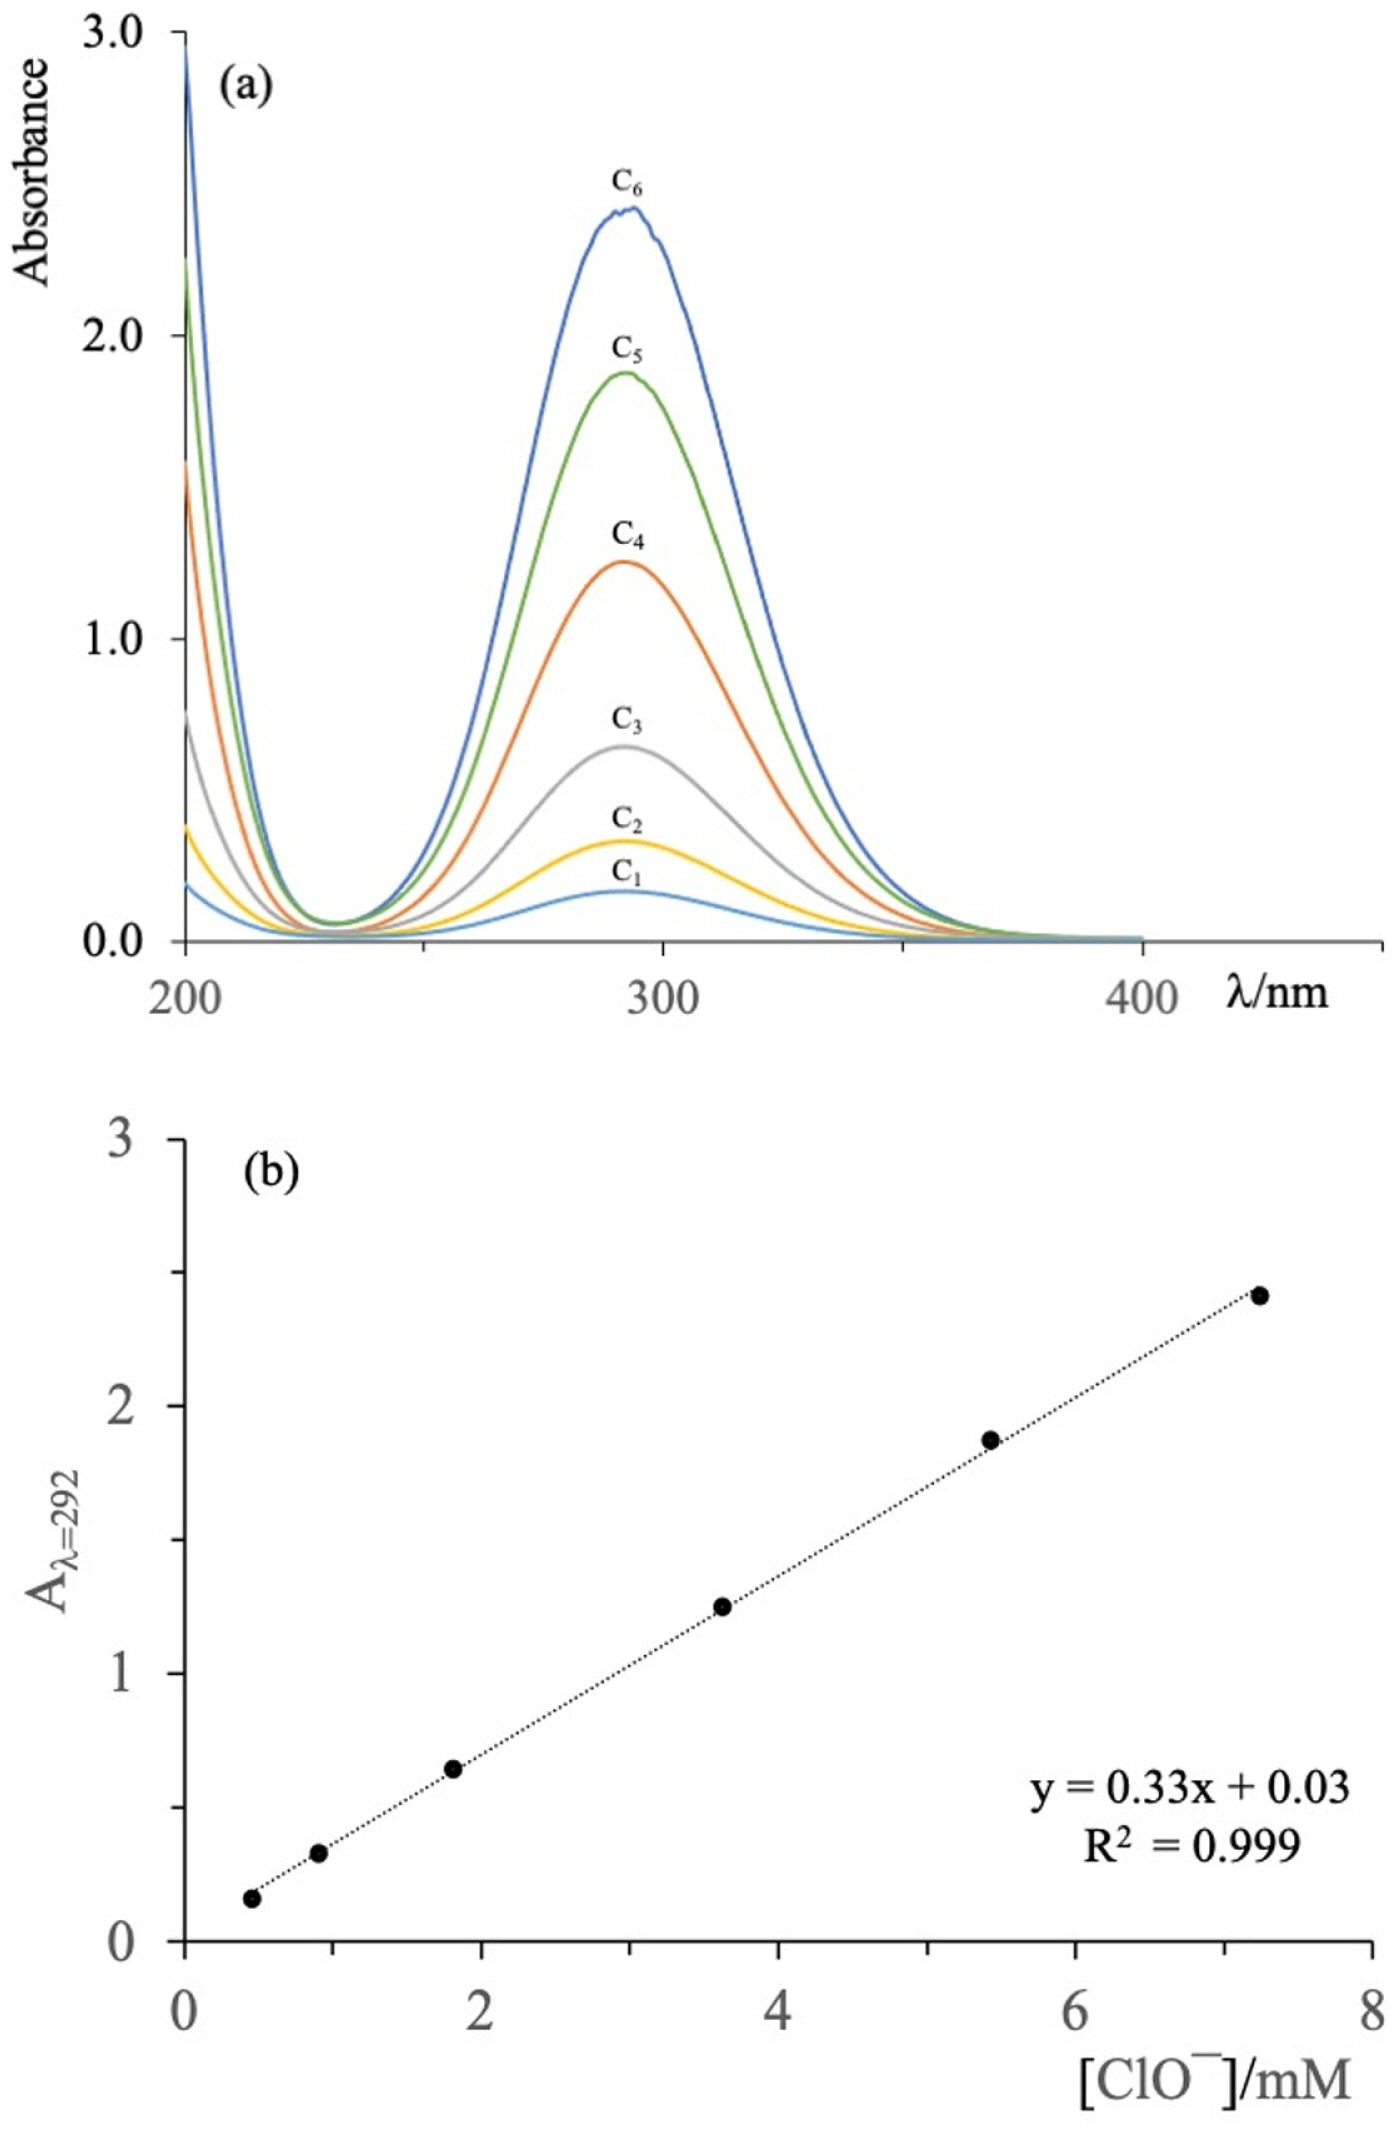
A calibration curve of absorbance at λ = 292 nm as a function of hypochlorite concentration was constructed to determine the hypochlorite concentration generated by electrolysis of aqueous NaCl solutions. Aqueous solutions with different concentrations of NaClO were prepared from the commercial solution of sodium hypochlorite (0.81 M; pH 12.9), and the UV-Vis spectrum of each solution was recorded. Fig. 4a shows the UV-Vis spectra of the NaClO solutions with different concentrations at constant pH (11), where the intensity of the ClO− absorption peak at 292 nm increases with increasing NaClO concentration. The curve of the absorbance of the solution (Aλ=292) vs. the millimolar (mM) concentration of NaClO satisfies a linear relationship in the range from 0 to 8.0 mM, as seen in Fig. 4b.
3.4. Electrogeneration of hypochlorite ion by electrolysis of aqueous NaCl solutions using a Ti/PtPd(10%)Ox anode
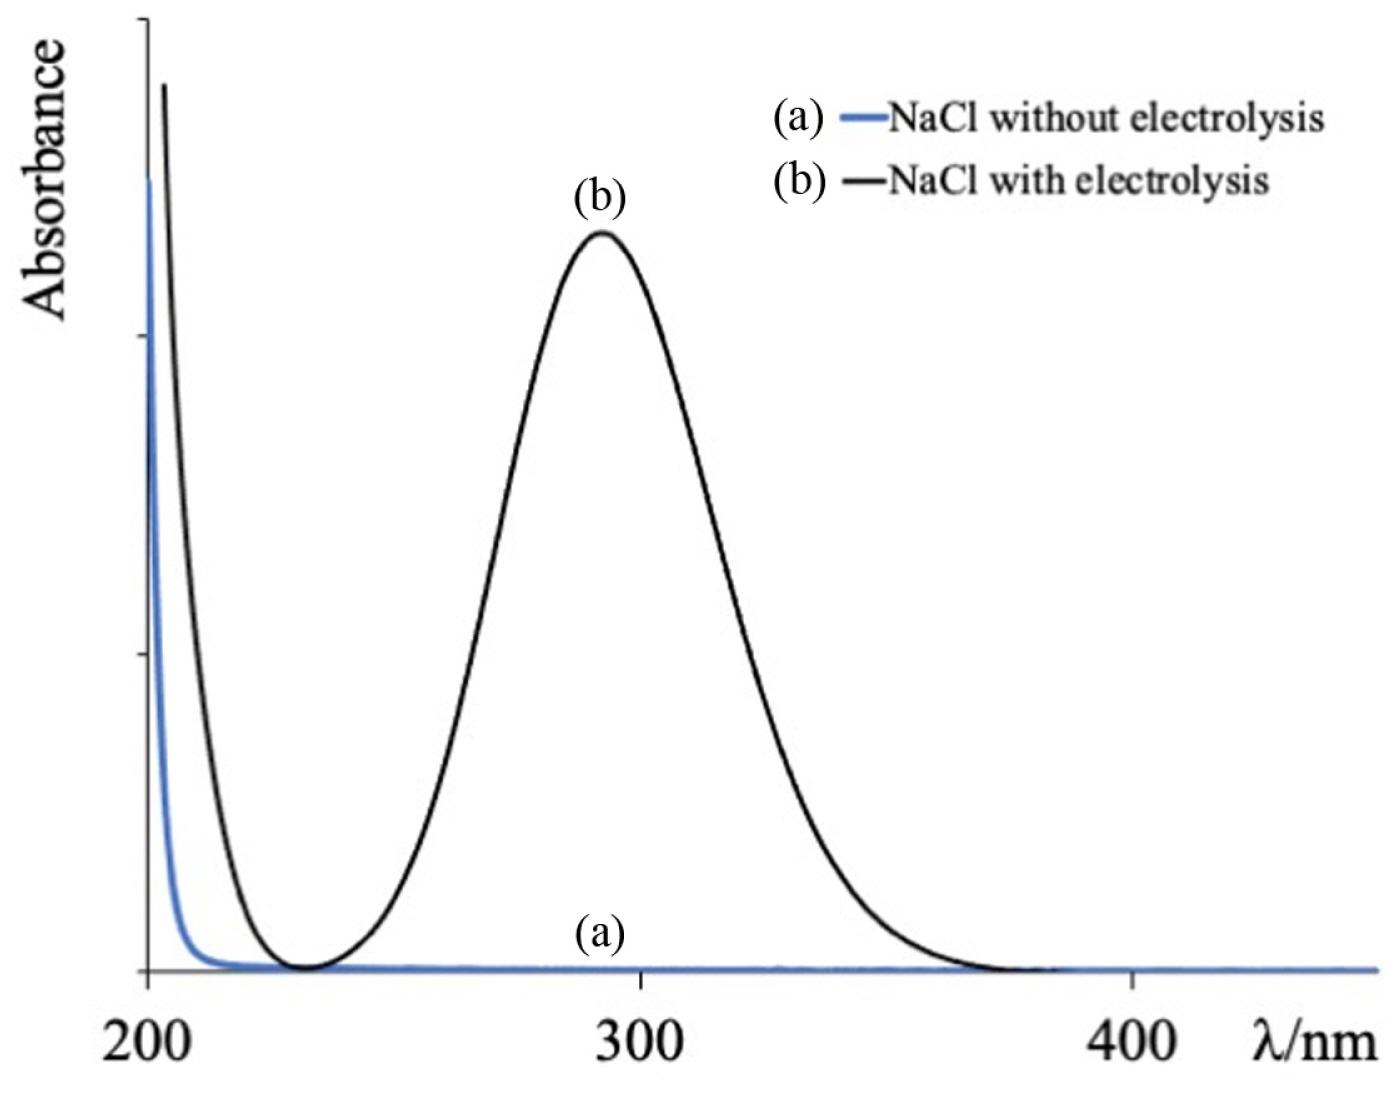
The electrogeneration of active chlorine species was carried out through electrolysis of aqueous NaCl solutions using the Ti/PtPd(10%)Ox anode. Fig. 5 shows the UV-Vis absorption spectra of a NaCl solution (2.5 g/L, pHinitial 6.7) without (curve a) and with (curve b) electrolysis treatment using the Ti/PtPd(10%)Ox anode with a potential difference of 7 V for 60 min. For the untreated NaCl solution, the UV-Vis spectrum does not exhibit absorption bands, whereas the spectrum of the NaCl solution subjected to electrolysis exhibits a well-defined peak at 292 nm corresponding to ClO−. This behavior confirms that hypochlorite ions are generated during the electrolysis of the NaCl solution, as has been observed with other DSA electrodes [20].
The direct oxidation of chloride ions (Cl−) on the Ti/PtPd(10%)Ox anode gives rise to active chlorine oxidants according to Eq. 3–5, as has been discussed previously [11,21,22]:
Through these reactions, Cl− is oxidized to molecular chlorine, which is then hydrolyzed to give hypochlorous acid (pKa = 7.55 at 25°C). The hypochlorous acid then dissociates to give the hypochlorite ion, which is detected through its UV absorption peak at λ = 292 nm, as observed in curve b of Fig. 5.
3.5. Generation of the hypochlorite ion by electrolysis of aqueous NaCl solution under different experimental conditions using the Ti/PtPd(10%)Ox anode
3.5.1 pH effect
Aqueous solutions of NaCl (2.5 g/L) with different initial pH values (2, 6, 7 and 10) were subjected to electrolysis using the Ti/PtPd(10%)Ox anode and a constant potential difference of 7 V for 60 min. The UV-Vis spectra obtained for the NaCl solutions are shown in Fig. 6a. The intensity of the peak at 292 nm varies with the initial pH of the solution, with the highest peak intensity at pH 10 and the lowest at pH 6. This trend can be explained by the pH dependence of the equilibrium of the HClO/ClO− conjugate acid-base pair [14], in agreement with the species dominance diagram in Fig. 2.
The amount of hypochlorite ions generated by the electrolysis of NaCl (2.5 g/L) solution at different pH values was estimated from the calibration curve (Aλ=292 vs. [ClO−]) (Fig. 4b). The variation of the hypochlorite ion concentration as a function of initial pH is shown in Fig. 6b. The hypochlorite ion concentration ([ClO−]) increases linearly from pH 2 to pH 7 with values less than 2.0 mM; however, at pH 8 there is a sharp increase in the hypochlorite ion concentration, after which the concentration reaches a maximum value at pH 10 (6.2 mM). The absence of the HClO absorption peak (λ = 235 nm) in the UV spectrum at pH < 7 is related to the fact that the initial pH changes to values ≥ 8 during the electrolysis process.
3.5.2 Effect of cell potential difference
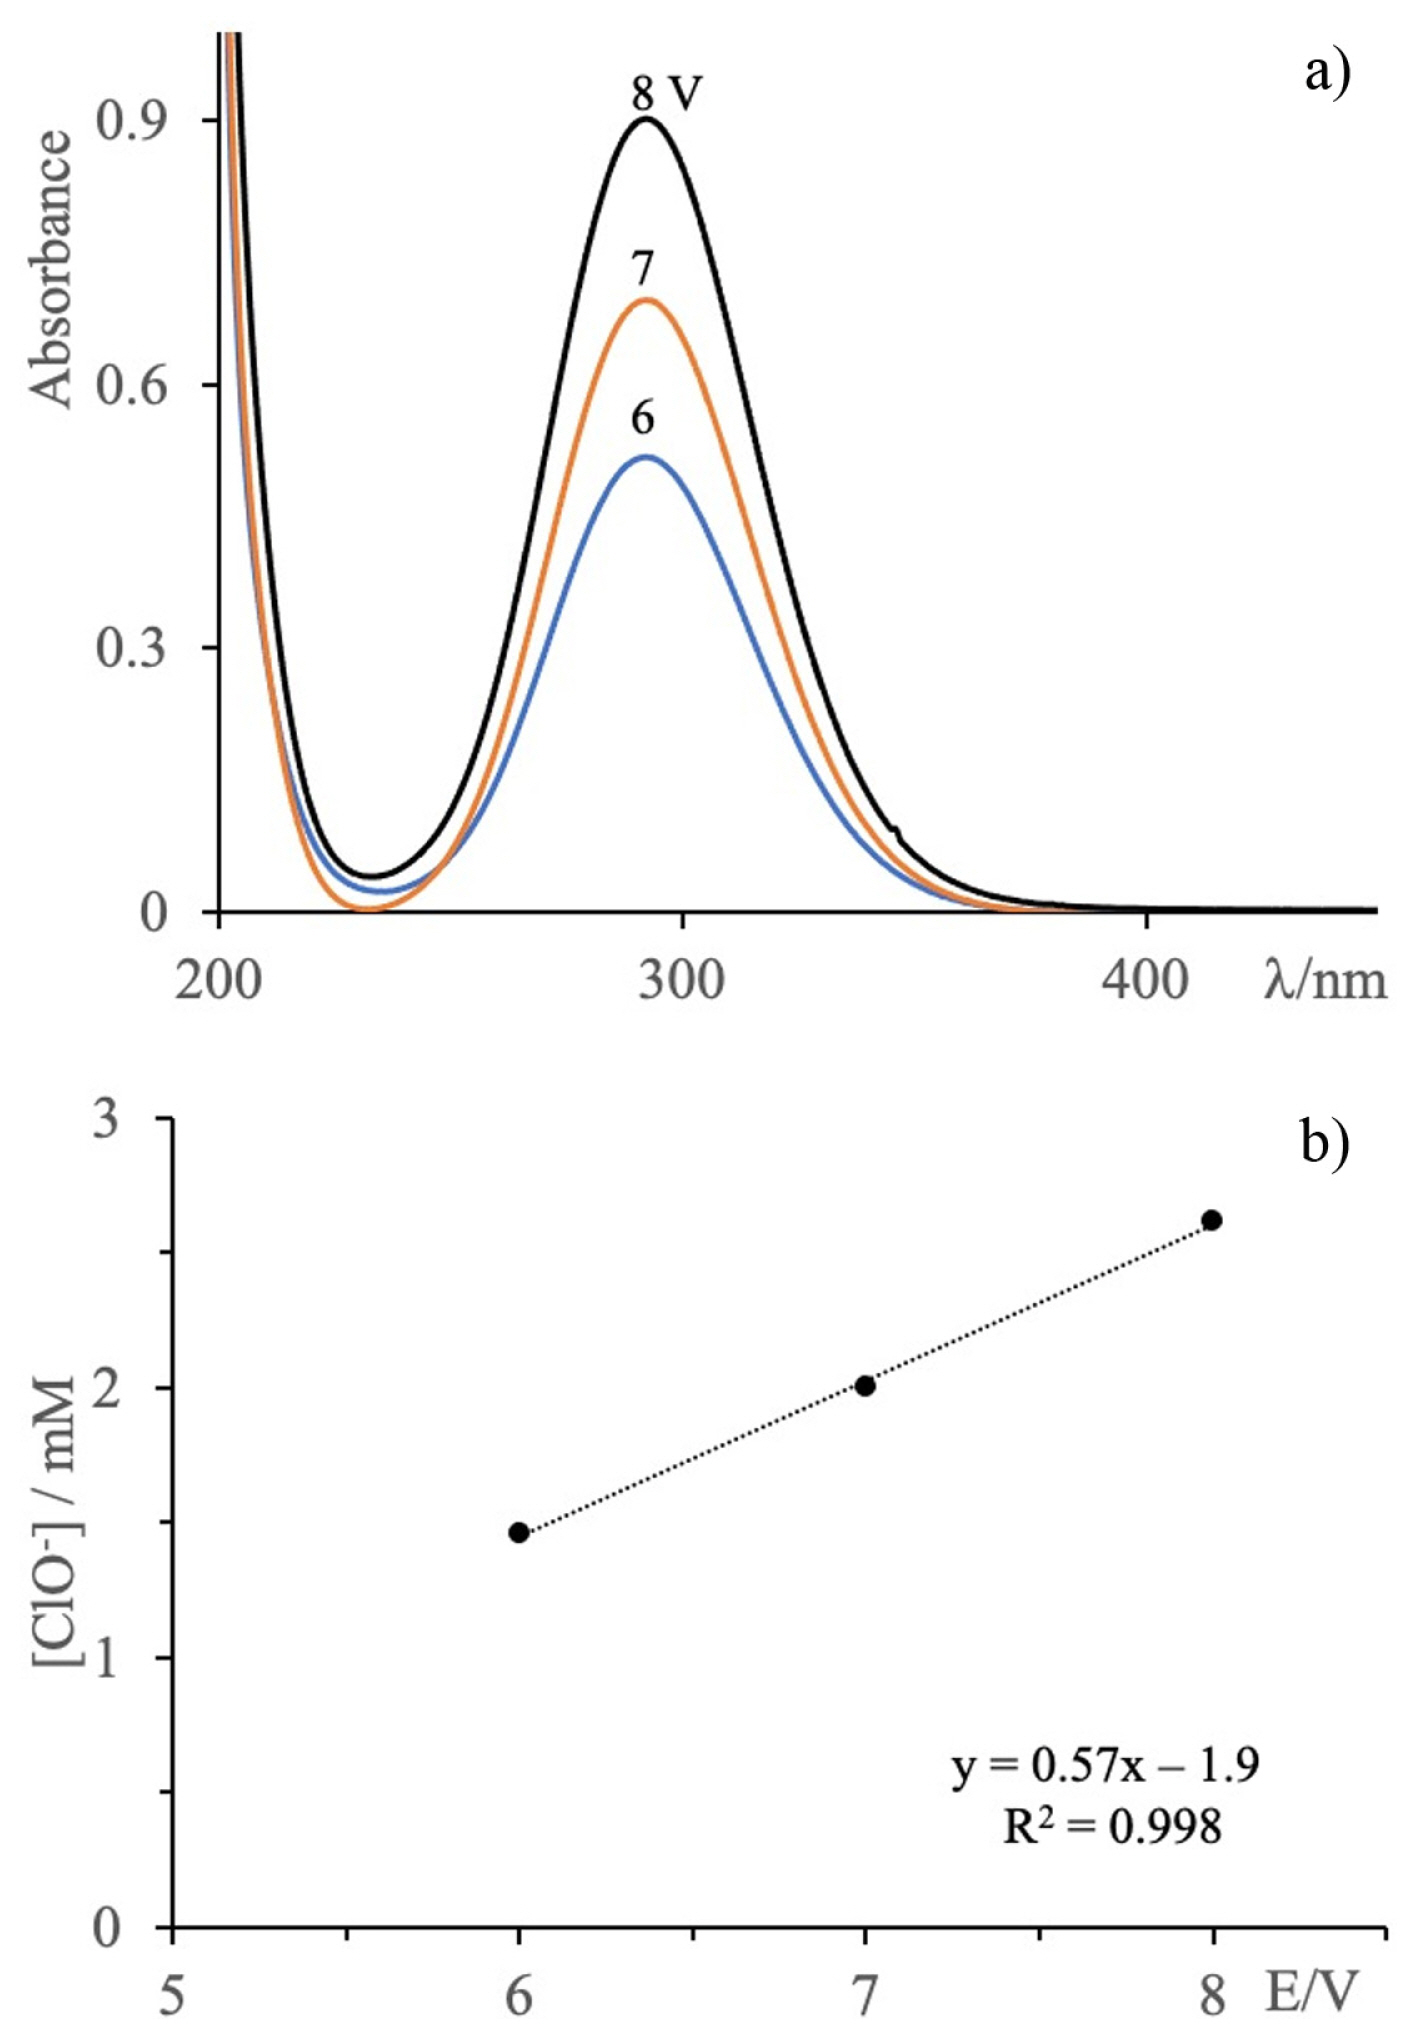
Fig. 7a shows the UV-Vis spectra of aqueous NaCl solutions (2.5 g/L, initial pH 6.7) subjected to electrolysis with cell potential values of 6, 7 and 8 V for 60 min. The intensity of the absorption peak at 292 nm increases as the cell potential difference increases, indicating that the amount of electrogenerated hypochlorite ion increases as the cell potential difference increases from 6 to 8 V. The variation of the hypochlorite ion concentration as a function of potential difference shows a linear relationship as seen in Fig. 7b.
3.5.2 Effect of electrolysis time with different cell potentials
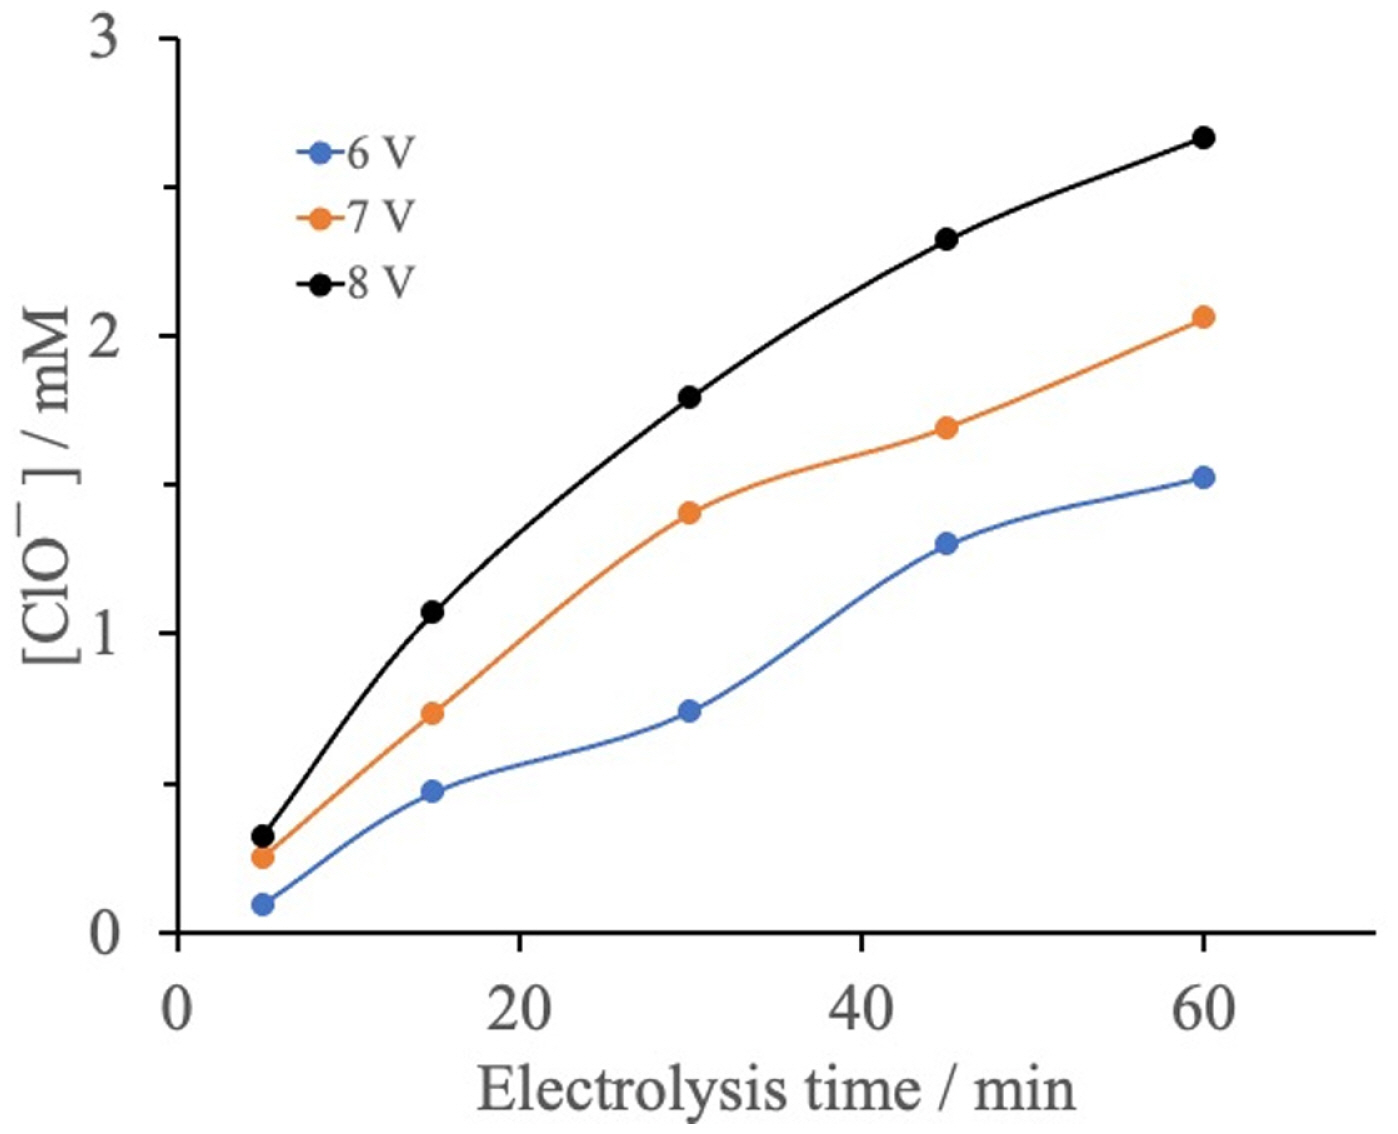
Electrolysis of aqueous NaCl solutions (2.5 g/L) was performed with cell potential values of 6, 7 and 8 V and a range of electrolysis times (0 to 60 min) (Fig. 8). In all cases, the UV-Vis absorption spectra of the electrolyzed solutions exhibited only the absorption peak at 292 nm associated with the ClO−, with the intensity of this peak increasing with increasing electrolysis time. This increase in absorption intensity indicates that, at each of the cell potential values examined, longer electrolysis times promote the formation of larger quantities of hypochlorite ions. As shown in Fig. 8, the hypochlorite ion concentration at each applied cell potential increases and such behavior could follow a parabolic trend. At a given electrolysis time, the hypochlorite ion concentration is higher when the cell potential is higher. For example, with 60 minutes of electrolysis, the amount of hypochlorite ion increases 80% when going from 6 to 8 V. Therefore, the results indicate that with 60 min of electrolysis the hypochlorite ion concentration is proportional to the cell potential. While this proportionality appears to hold at 60 min (as shown above in Fig. 7b), the vertical spacing of the points in Fig. 8 at ~30 min and ~45 min is not even, suggesting that the relation is less clearly linear at these times.
3.5.3 Effect of initial NaCl concentration
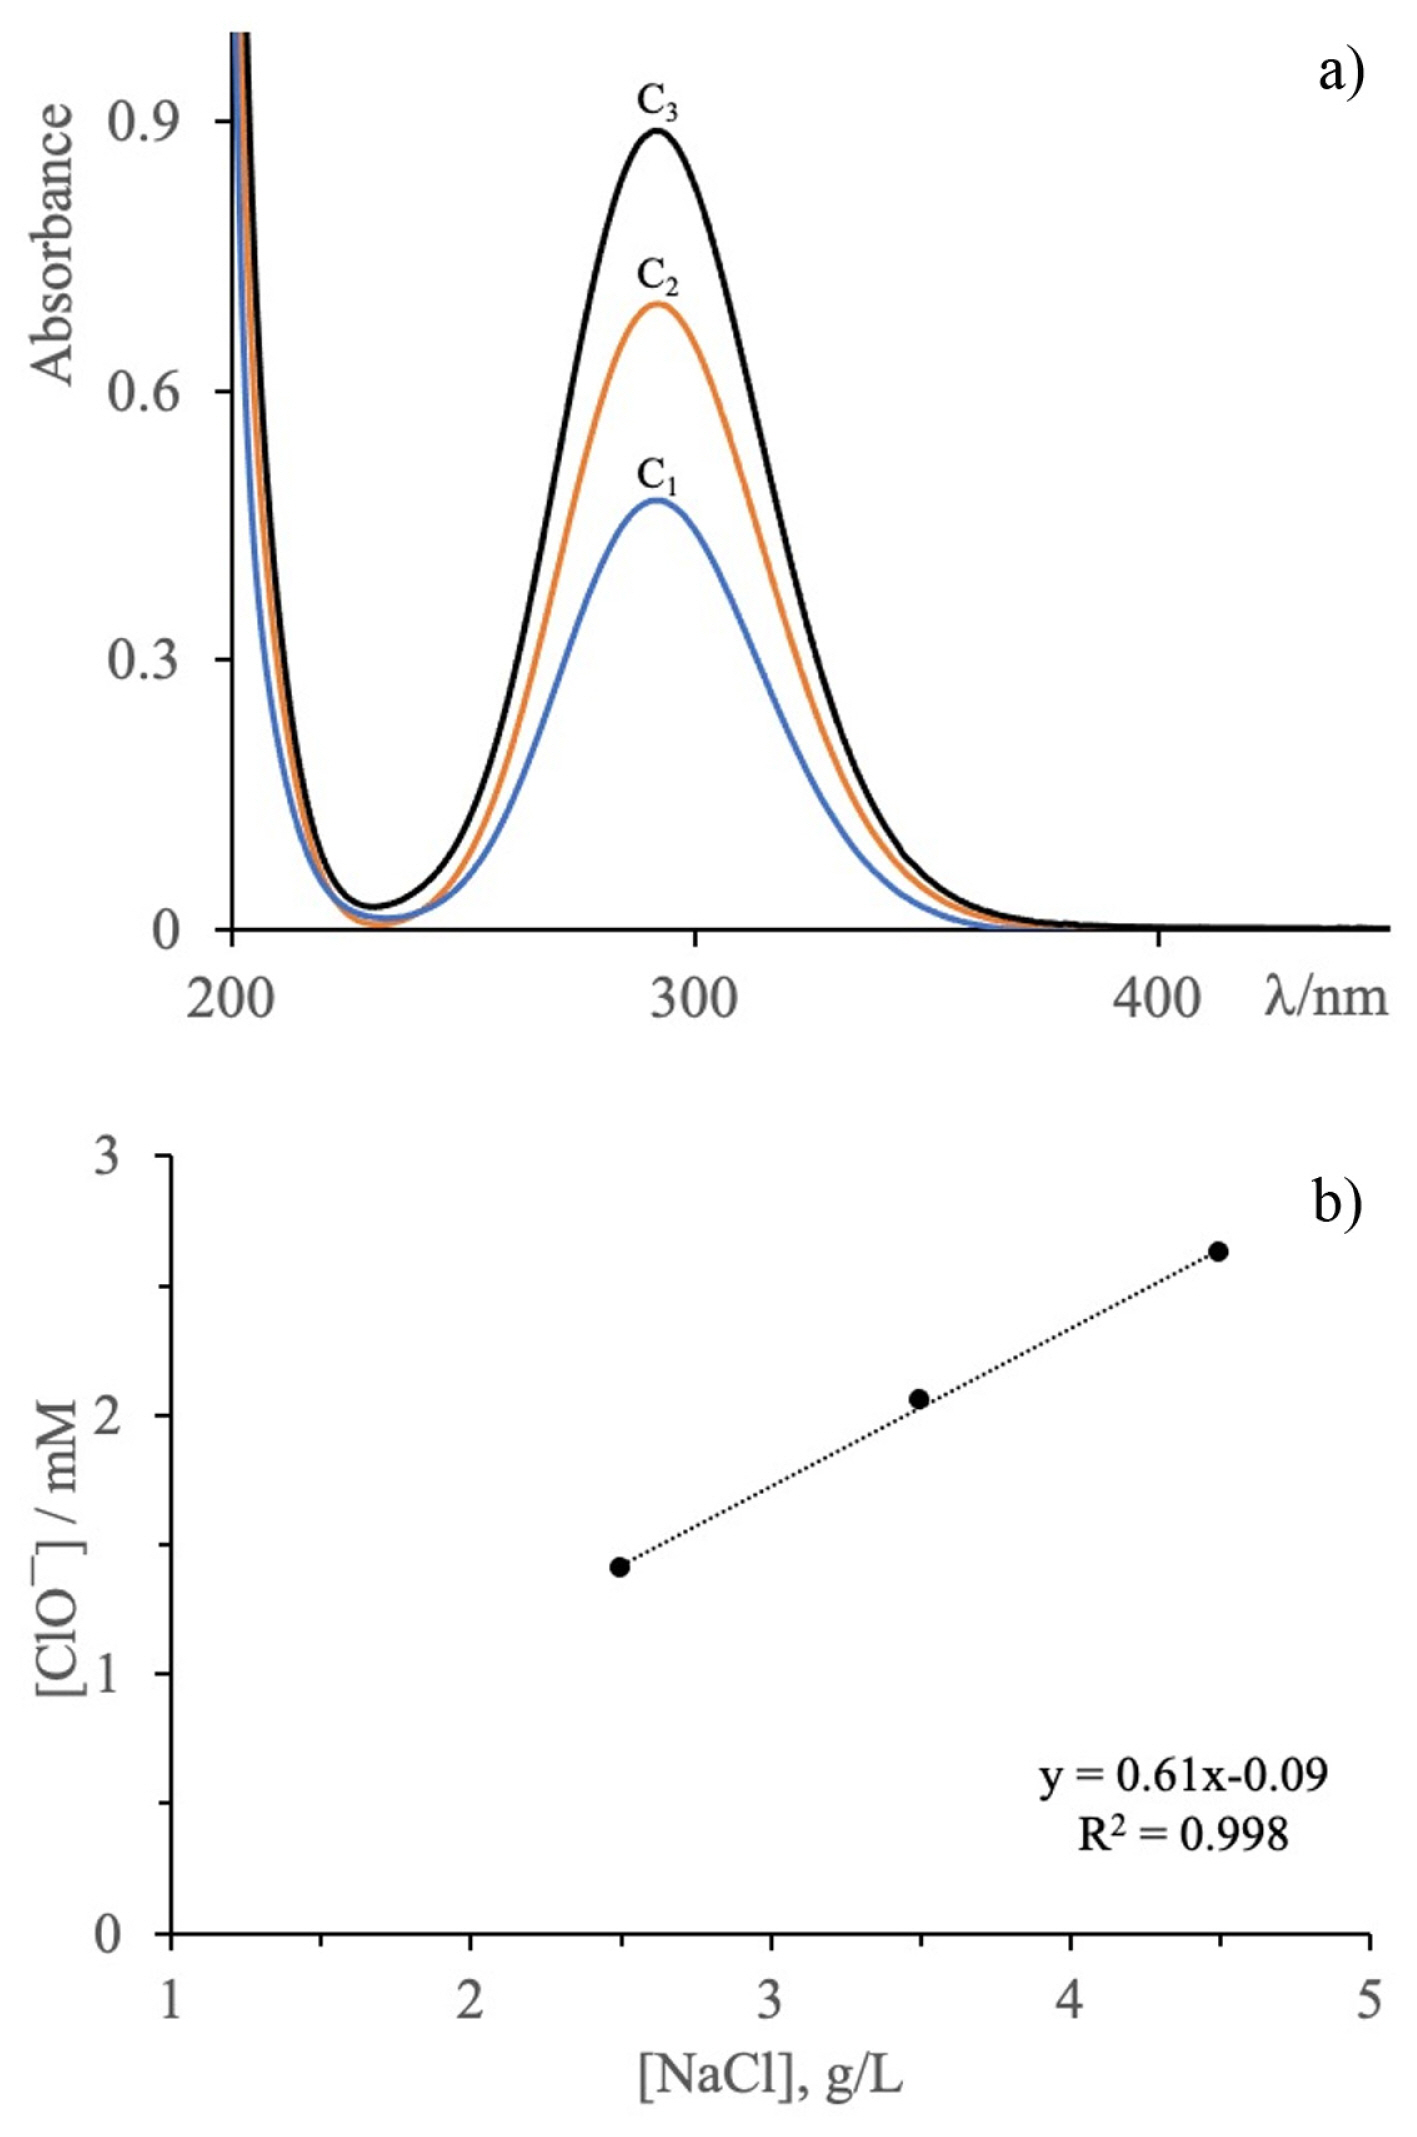
Fig. 9a shows the UV-Vis spectra of aqueous NaCl solutions with different concentrations (2.5, 3.5 and 4.5 g/L) that were electrolyzed using the Ti/PtPd(10%)Ox anode and a cell potential of 7 V for 60 min. The spectrum of each electrolyzed NaCl solution shows a single absorption peak at 292 nm attributed to electrogenerated hypochlorite ions. The intensity of the absorption peak increases as the NaCl concentration increases, indicating that under the same electrolysis conditions hypochlorite ion production is favored at higher NaCl concentrations. The variation of the hypochlorite ion concentration as a function of NaCl concentration follows a linear relationship as shown in Fig. 9b.
3.5.4. Effect of electrolysis time with different concentrations of NaCl
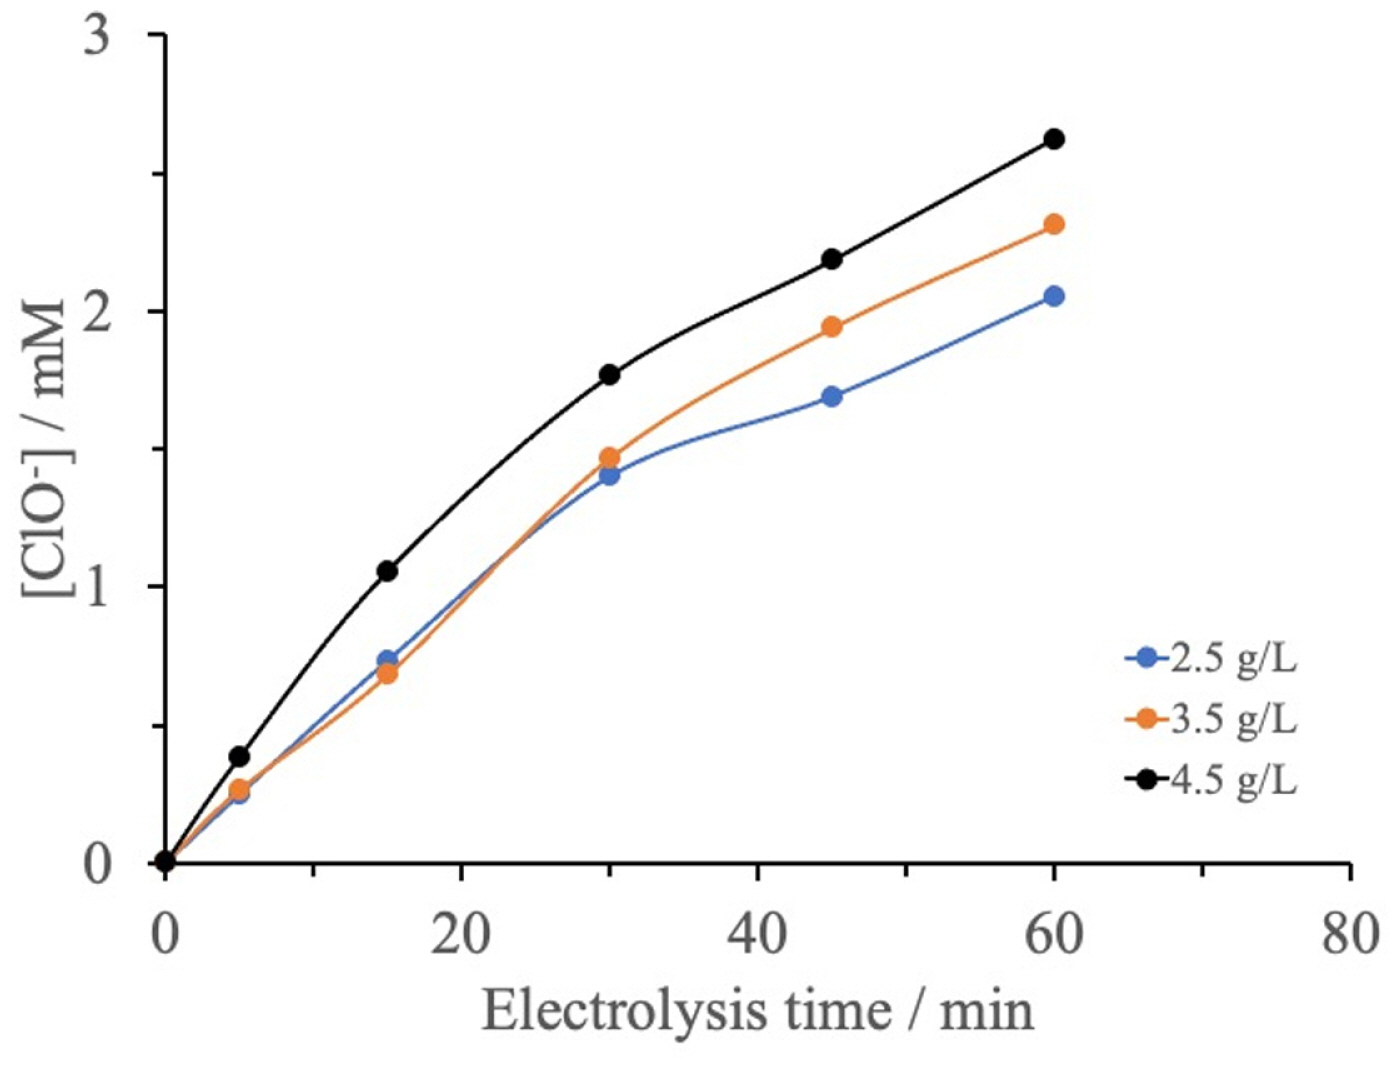
Fig. 10 shows the variation in the concentration of ClO− as a function of electrolysis time for NaCl solutions with different concentrations (2.5 to 4.5 g/L). In these experiments, the solution pH was 6.7 and the cell potential was 7 V. For all of the NaCl concentrations, the concentration of hypochlorite ions increases with electrolysis time and tends to reach maximum value that depends on the initial concentration of NaCl. For all of the applied electrolysis times between 0 and 60 min, the amount of ClO− obtained was higher for the 4.5 g/L NaCl solution than for the 2.5 and 3.5 g/L NaCl solutions. This indicates that the higher the concentration of active species at the electrode/solution interface, the higher the production of oxidized species (Cl2) and hence the higher the production of ClO−.
3.5.5. Effect on pH(final)
As the electrolysis of the NaCl solutions proceeded, the initial pH of 6.7 increased to a value ≥ 8. Fig. 11a shows the variation in the final pH as a function of electrolysis time at applied cell potentials of 6, 7 and 8 V, while Fig. 11b shows the variation in the final pH as a function of electrolysis time for solutions with different initial NaCl concentrations. For all of the experimental conditions examined, the general trend is that pH increases with increasing electrolysis time, consistent with previous findings [23]. Rajkumar et al. (2005) [24], suggested that this phenomenon may be due to the conversion of H+ ions to hydrogen gas during the electrochemical reaction at the cathode, leading to an increase in the pH of the solution. According to this hypothesis, the concentration of protons in the systems examined here decreases significantly during the electrolysis process, giving rise to higher pH values that favor the predominance of the hypochlorite ion, as observed in Fig. 11a,b.
4. Conclusions
The present results demonstrate that the DSA-type Ti/PtPd(10%)Ox anode is capable of producing active chlorine species by electrolysis of aqueous NaCl solutions. The electrolysis process increases the solution pH up to high values (≥ 8.0) that favor the formation of hypochlorite ions over chlorine or hypochlorous acid. Under the operating conditions used in this work, the amount of electrogenerated ClO− is proportional to the NaCl concentration and the applied cell potential difference. Therefore, the Ti/PtPd(10%)Ox anode favors the production of hypochlorite ions, making this anode a promising material for use in electrochemical oxidation of wastewater via an indirect mechanism.