1. Introduction
Modern cities have evolved alongside civilization, and the concentration of population in such cities has increased recently [1]. To address these problems, high-rise buildings are increasingly being constructed [2]. High-rise buildings generally use high-strength concrete because they require high performance of concrete due to large scale of the building [3]. However, one disadvantage of using concrete is that it has a high load compared to the required strength. In other words, constructing a high-rise building with concrete increases the load of the structure. Such high loads of buildings are disadvantageous in several ways, including the need to reinforce the foundation of the building. The reason for the high load of concrete buildings is that aggregates with a high unit weight account for approximately 75% of the concrete volume [4].
One solution for developing lightweight concrete involves the use of lightweight aggregates instead of natural aggregates [5]. Lightweight aggregates are defined as aggregates with an absolute dry density of 2.0 g/cm3 or less. When they are used instead of natural aggregates, the concrete load can be reduced by 10ŌĆō40% [6]. Currently, aggregate production in South Korea has steadily decreased since 2000. Moreover, the collection of river gravels and sands, which are used for aggregates, has been reported to be decreasing [7]. Lightweight aggregates can offer environmental benefits because they can be produced by recycling industrial by products [8]. However, one disadvantage of using lightweight aggregates is their low strength owing to the production process. Lightweight aggregates have several pores because they are produced by expanding and firing raw materials. These surface pores of lightweight aggregates affect the quality of concrete as they lower the strength and increase the water absorption rate [9].
The surface pores of lightweight aggregates are detrimental to the formation of interfaces. Such aggregate interfaces are considered the weakest of the following three factors that determine the strength of concrete: the strength of the cement paste, the aggregate, and interface between the aggregate and cement paste. The strength of the interface, which is the weakest region of concrete, is crucial for high-strength concrete owing to durability [10]. This interface forms a favorable environment for the generation of calcium hydroxide (Ca(OH)2) owing to the presence of a water film at the bottom of the aggregate. The calcium hydroxide formed at the interface does not react with the aggregate or form new reactants, resulting in the creation of numerous pores. The interface has a size of 10ŌĆō50 ╬╝m [11]. The hydrates in the interface have a high proportion of calcium hydroxide and ettringite and a low proportion of calcium silicate hydrate [12]. The high proportion of calcium hydroxide within the interface can be attributed to the lack of reactions with the aggregate, resulting in a lower strength [11,12]. In particular, the aggregate interface is affected by the increased size of the aggregate. Thus, research on the interfacial characterization of coarse aggregates is required [13].
According to conventional interface measurement methods, disk-shaped specimens have been fabricated and tested for fracture toughness using aggregates [14]. In addition, analyses such as scanning electron microscopy (SEM), electron probe micro analysis-backscattered electron (BSE), and SEM-BSE have been performed to check the strength and photograph surfaces after specimen failure [10,15,16]. However, these conventional experimental methods require crushing and fracturing of the specimen, and identifying the characteristics of the entire interface is difficult [14,15]. Furthermore, experiments have only been conducted on specific aggregates and fine aggregate interfaces, and research on changes in the interfacial properties of coarse aggregates is lacking.
Electrochemical impedance spectroscopy (EIS) has been widely applied to investigate the hydration, corrosion, microstructural evolution of cement-based materials, and the establishment of equivalent circuit models is important for the analysis of impedance results and has broadened the application scope of this analysis [17]. Within cement-based materials, solids and liquids with different chemical and mineral compositions are formed and placed, which can exhibit different electrical properties and can be expressed as different electrical elements. In a typical Nyquist plot of a cement-based material, several capacitive loops are found, and every ideal loop can be simulated using a parallel series of resistors and capacitors. This study investigates the correlation between impedance and compressive strength of hardened cement according to the aggregate type. If the aggregate is different, the ITZ is formed differently, and this has a major influence on the determined impedance and compressive strength. In addition, through analysis using appropriate equivalent circuits, we found the specific resistance component that affects the ITZ and found it to be proportional to the compressive strength.
2. Experimental
2.1 Preparation of materials
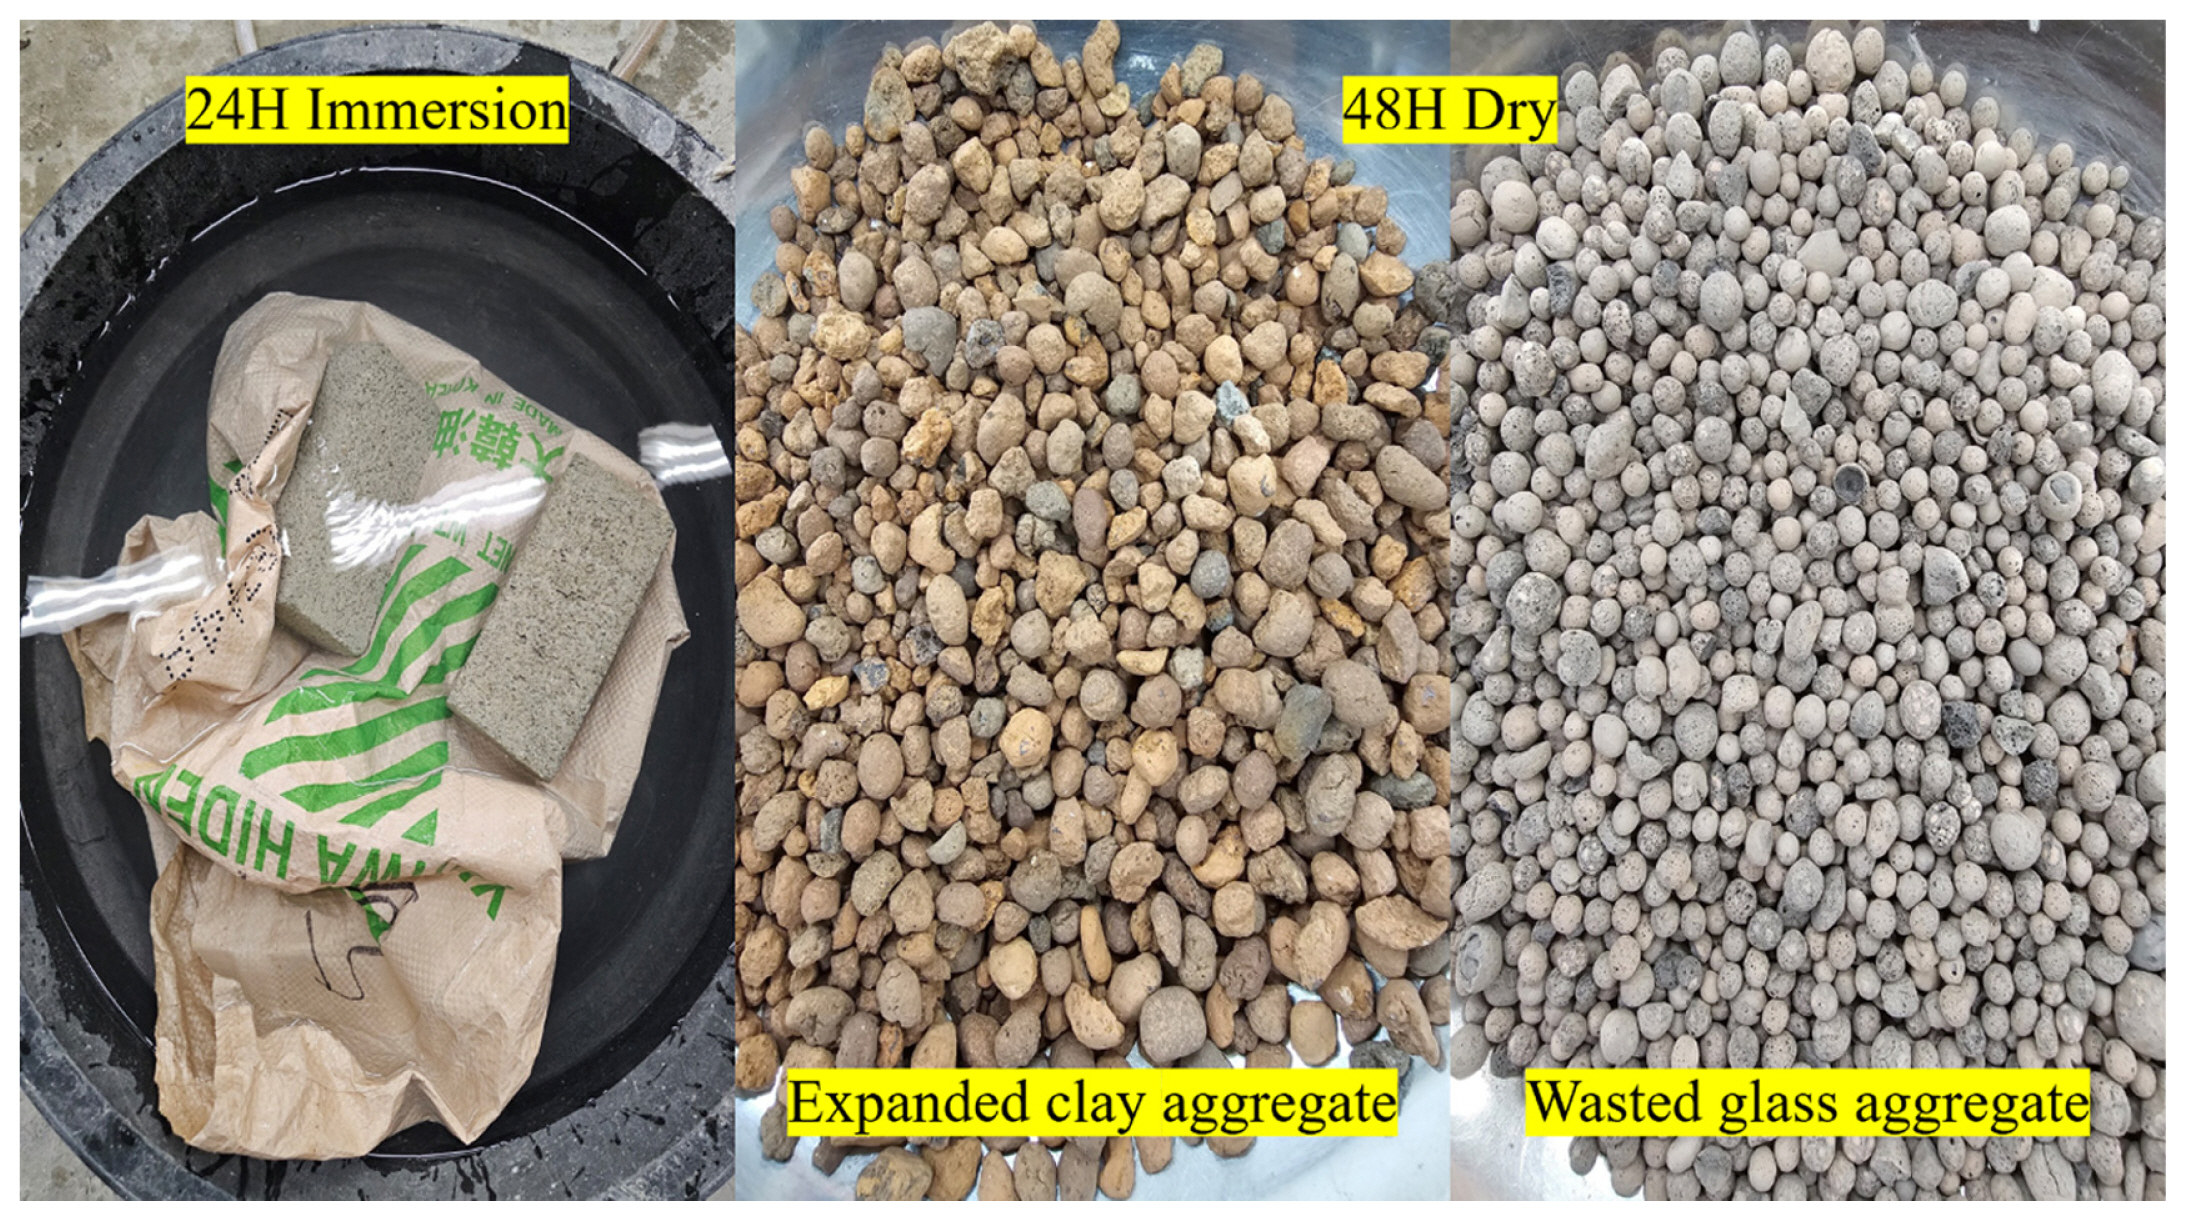
Type I Ordinary Portland cement was used in the analysis. The physical properties of the aggregates used in this experiment are summarized in Table 1. Further, coarse aggregates were used, including natural aggregates, expanded clay aggregates, and wasted glass aggregates with different densities and water absorption rates. The maximum size of the lightweight aggregates used in the experiment was approximately 10 mm. Thus, natural aggregates that were approximately 10 mm in size, same as lightweight aggregates, were used. Notably, the water absorption rate of lightweight aggregates is approximately 20 times that of natural aggregates. The moisture content of lightweight aggregates affects the quality of concrete. Fig. 1 depicts the pre-wetting of lightweight aggregates, considering their high water absorption rate. The lightweight aggregate is prewetted under the same conditions, so it maintained saturated surface dry by status. The lightweight aggregates were immersed in bags filled with water for 24 h and then mixed and dried at room temperature of 20┬▒2┬░C for 48 h. The waterŌĆōcement (W/C) ratios were set to 30, 40, and 50%. The ratio of cement to aggregate was set to 1:2, considering the difference in density between natural and lightweight aggregates. The wasted glass aggregate is a lightweight aggregate manufactured by crushing and expanding wasted glass into powder form. The wasted glass aggregate is basically a material that floats on water because its specific gravity is less than 1, but when used together with cements, there were no major problems when producing test specimens due to the viscosity of cements.
2.2. SEM measurements
The ITZ of different aggregate-cements were characterized by scanning electron microscopy (SEM) using a MIRA3-LMH (Tescan) with an acceleration voltage of 20.0 kV.
2.3. Measurements of compressive strength
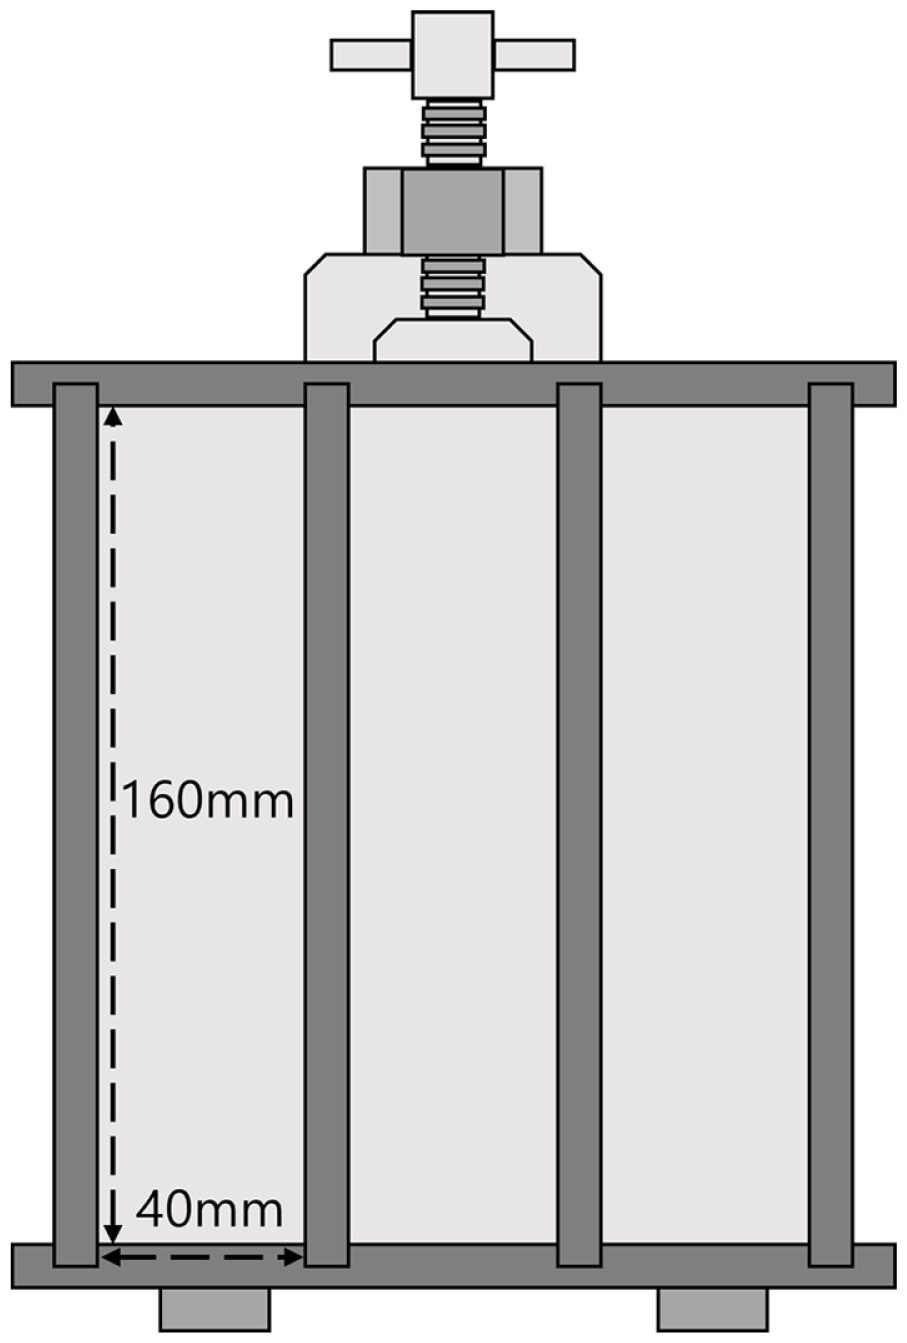
The compressive strength specimens used in the experiment were fabricated based on KS L ISO 679 using molds of 40├Ś40├Ś160 mm, as shown in Fig. 2. The aggregate used for strength test was 5 to 10 mm in size, identical to the size of the lightweight aggregate product. Each strength specimen was split in half, and the compressive strengths of both sides were measured. The specimen paste was mixed, and the aggregates were then added to the mix. Hand mixing was performed to prevent fracturing of the lightweight aggregates. Curing was performed at a room temperature of 20┬▒2┬░C, and the compressive strength was measured on the seventh day.
2.4. Electrochemical measurements
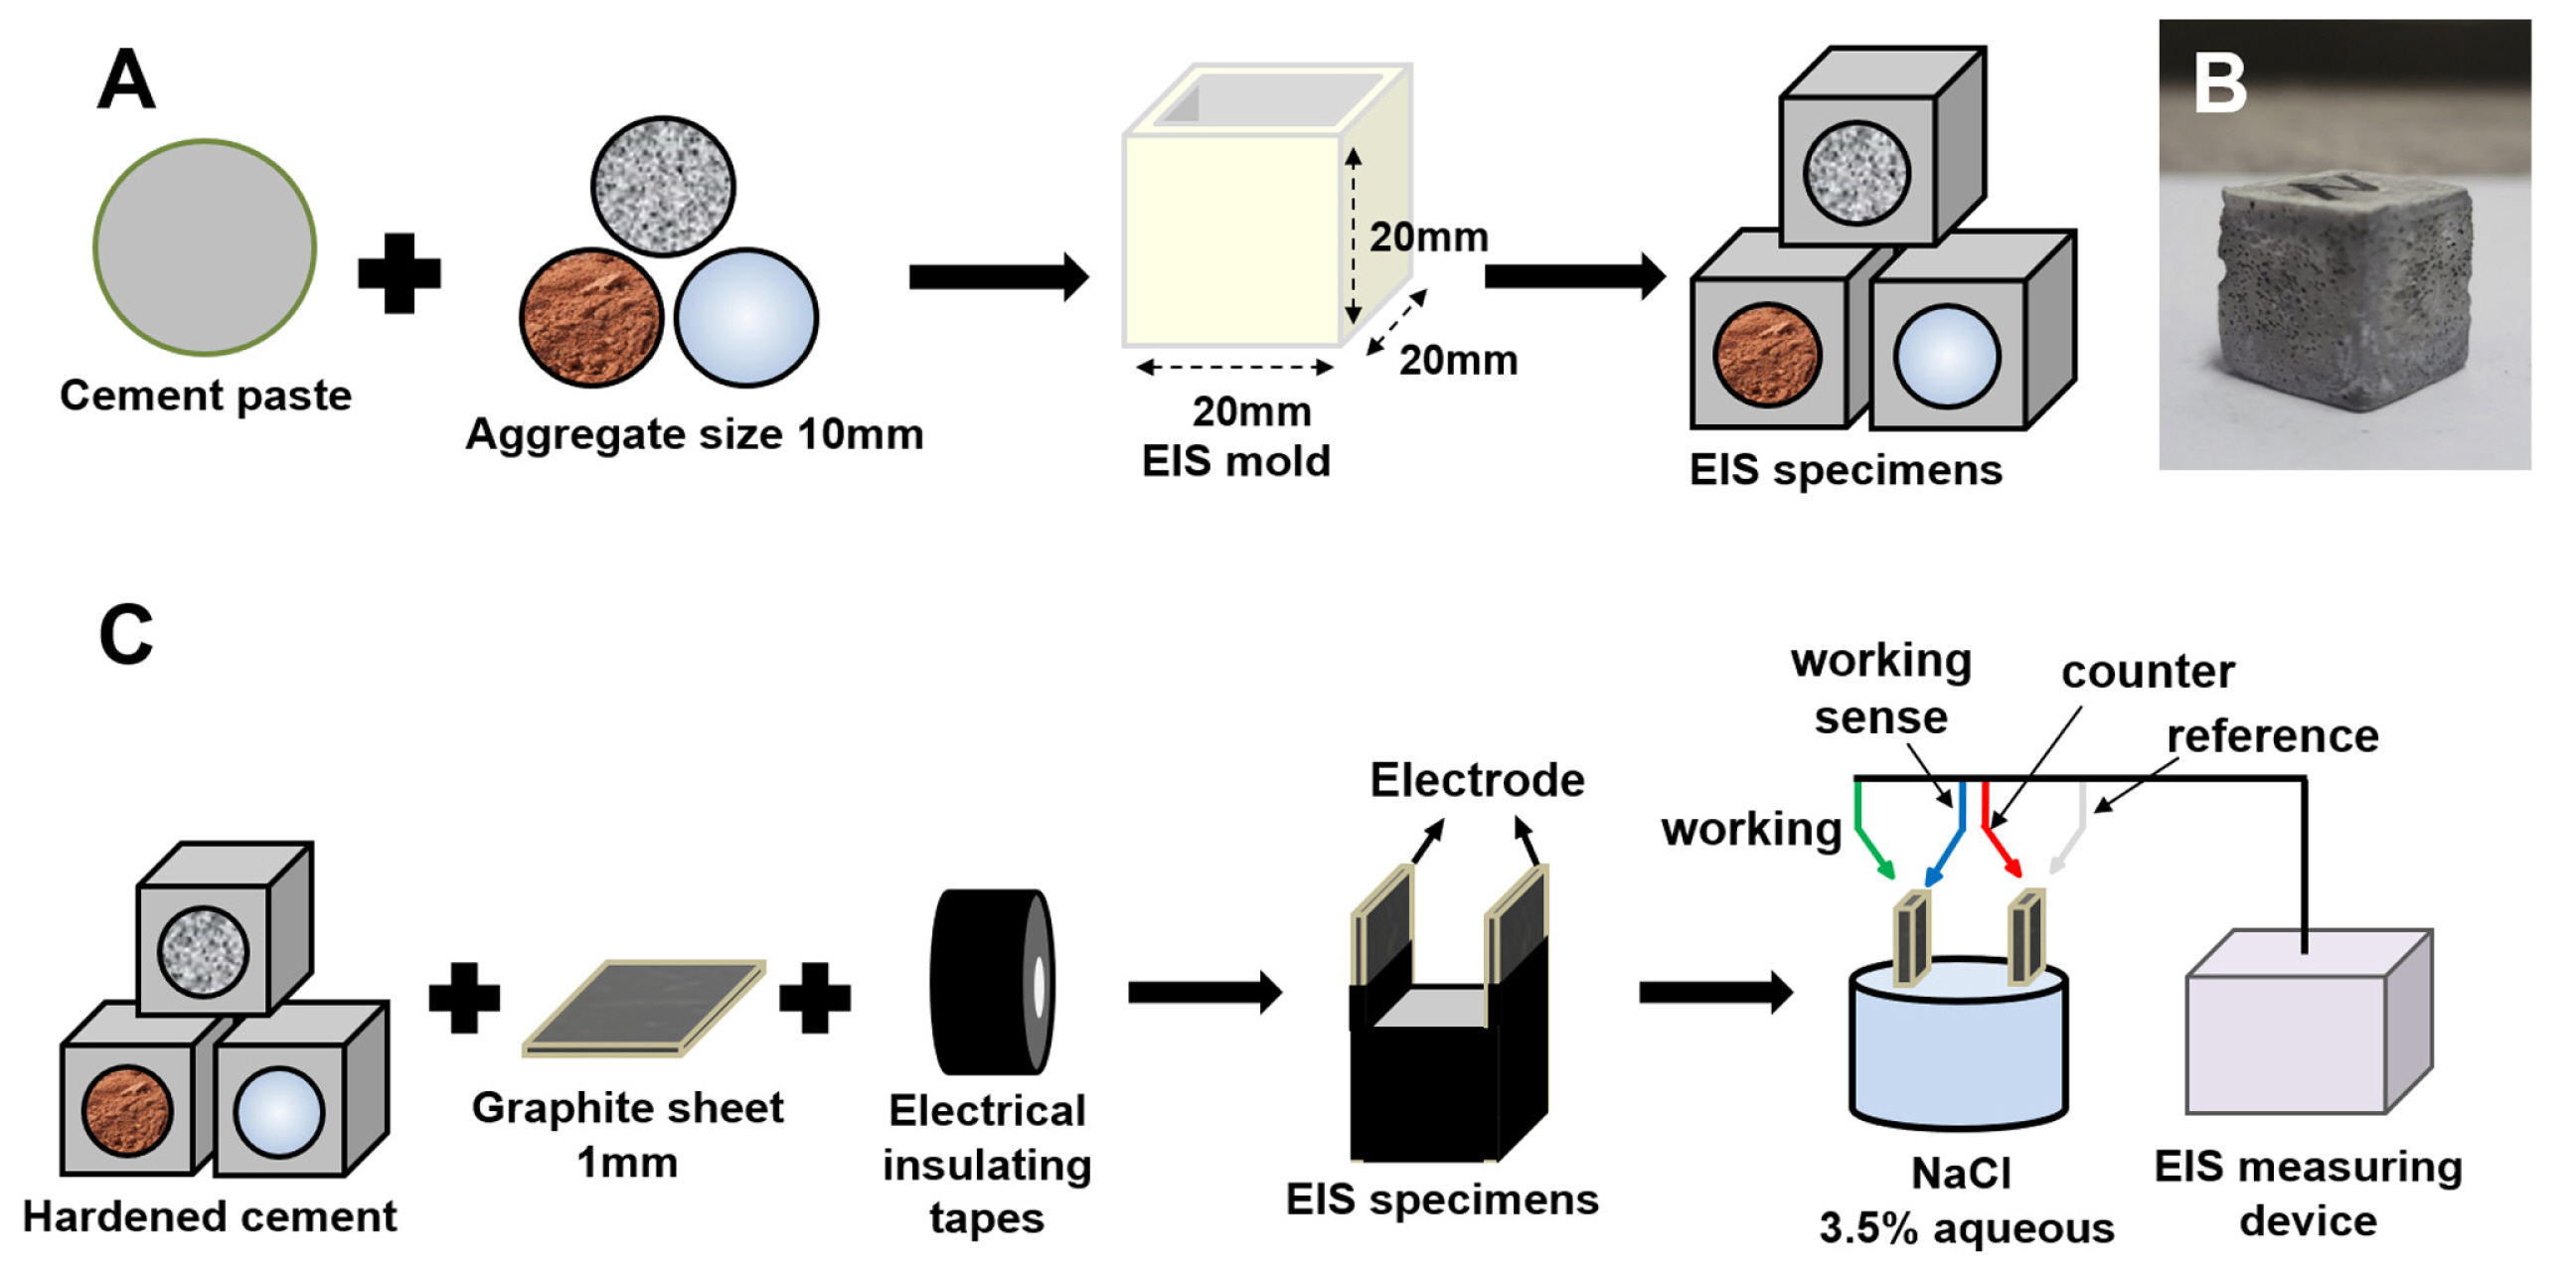
Fig. 3A depicts preparing the specimen mold for measuring the electrical impedance of a single aggregate. The specimen was prepared by pouring half of the cement paste into a silicone mold of 20 mm├Ś20 mm ├Ś20 mm, which was followed by adding one aggregate with a size of 10 mm. This experiment was conducted to check the difference in the ITZ of only one aggregate, and the viscosity of the cement paste was used to secure the centrality of aggregates in the test specimen because the impedance may be affected if centrality is secured using a device outside the aggregate. Also, even in the case of the wasted glass aggregate with a water cement ratio of 50%, it was not difficult to secure the center of the EIS test specimen due to its small size. Since no bleeding of the 50% W/C cement paste occurred, there was no impact on the aggregate interface and ITZ. Generally, measuring the electrical impedance of concrete is difficult because it is a nonconductor. Therefore, electrolyte immersion was performed using a 3.5% aqueous solution of NaCl to reduce the electrical impedance of the concrete. In addition, when NaCl is loaded, the pores in the concrete including the ITZ are filled with NaCl electrolyte, making it easier to determine the effect of the pores on the impedance. The EIS specimen was immersed for 24 h on day 6 of aging, and the electrolyte was absorbed into the internal pores before measurement. Fig. 3B shows how to measure EIS for hardened cement. EIS analysis was performed after surface drying of the specimens soaked in electrolyte, and a 3.5% aqueous solution of NaCl was sprayed to prevent the surface from drying during the experiment. For the electrode attachment of the specimen, a graphite sheet with 1 mm thickness was attached to either side of the surface-dried specimen. One end was used as the working electrode, and the other end was used as the reference and counter electrode. The completed specimen was placed back into the 3.5% NaCl aqueous solution. In this process, the electrodes were kept out of contact with the electrolyte to minimize the fluctuation of resistance. For the EIS settings, an AC voltage of 10 mV was applied to the specimen, and a frequency range of 5MHz to 0.1 Hz was used. 0 V was applied to both ends of the solid specimen as the DC potential of EIS to perform the impedance experiment in a steady state, where the system is not changing due to a reaction.
3. Results and Discussion
3.1 ITZ of hardened cement according to the aggregate type
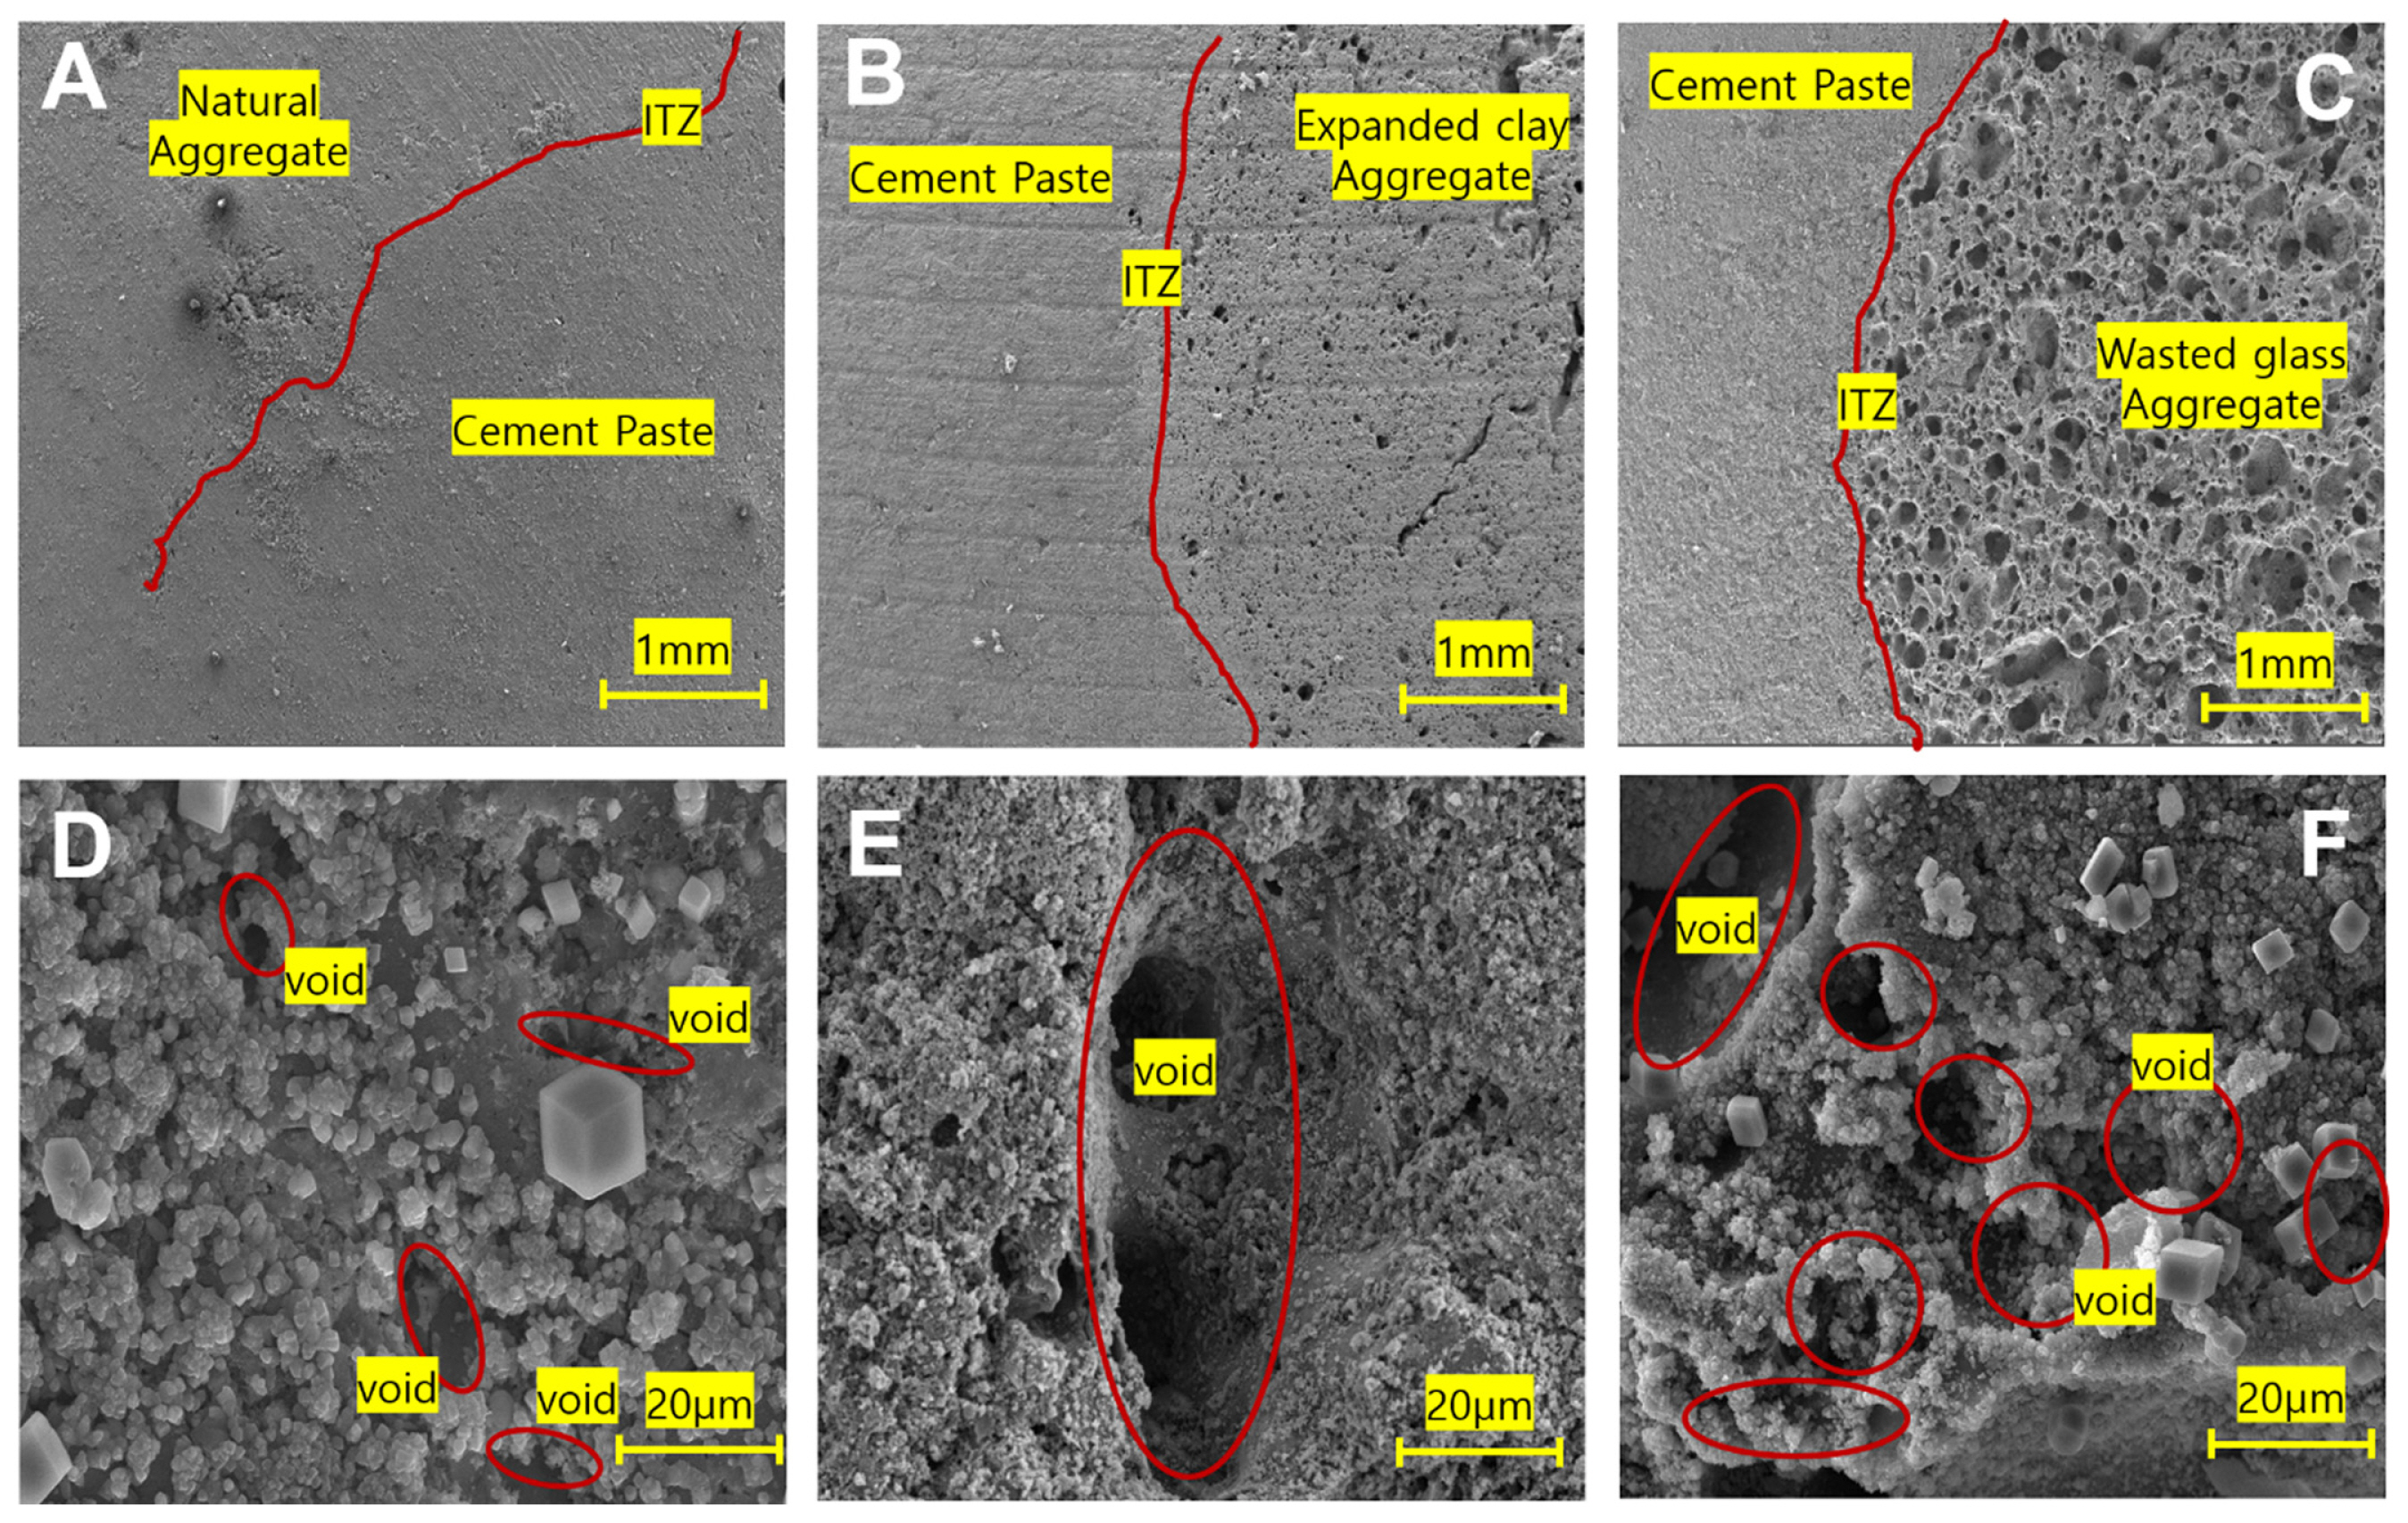
The ITZ is a layer formed between the aggregate and the cement paste, and the ITZ is known to have 2 to 3 times the porosity of cement paste. Fig. 4 shows the SEM images of the ITZ by different aggregate types. Through SEM images, we found that the physical properties of each type of aggregate affect the interface. It is difficult to distinguish the ITZ in the case of natural aggregate, as shown in Fig. 4A. However, the ITZ area is clearly visible in the case of the expanded clay aggregate and the wasted glass aggregate. Specifically, the presence of pores in ITZs formed from lightweight aggregates was observed, with more pores in wasted glass aggregates. The pores for the wasted glass aggregate have a deep shape unlike expanded clay aggregates. Higher density aggregates form a denser, less porous ITZ, while lower density aggregates form a less dense, more porous ITZ. The shape of the aggregate and the ITZ is a factor affecting internal electrolyte penetration and also a factor affecting the difference in compressive strength and impedance. Since three lightweight aggregates create surface drying and internal saturation before mixing, the conditions for ITZ formation can be said to be the same.
3.2 Compressive strength of hardened cement according to the aggregate type
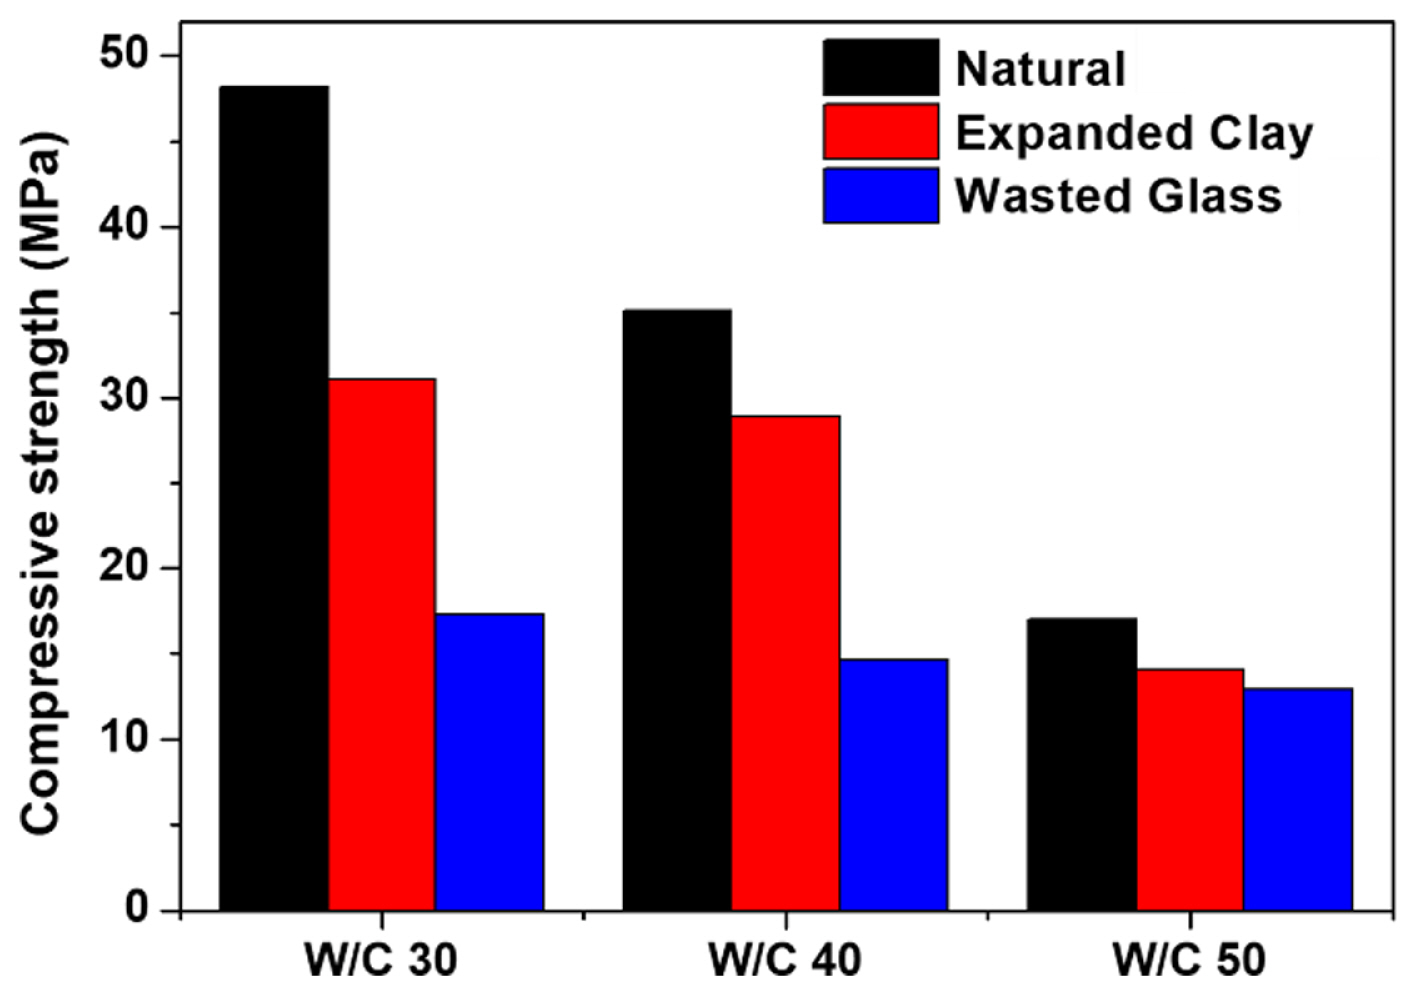
Fig. 5 shows the compressive strength of cured cement at day 7 of curing based on aggregate type. Based on the compressive strength measurements, hardened cement with natural aggregate, which had the highest density, exhibited the highest compressive strength level at every W/C ratio. Expanded clay aggregate and wasted glass aggregate exhibited the next highest compressive strengths in the given order. At a 50% W/C ratio, the compressive strength was low in general. The wasted glass aggregate showed lower variations in strength than other aggregates when W/C ratio changes. These results suggest that the strength of aggregate-infused hardened cement is not only related to the paste but also to the density of the aggregate. The denser the aggregate, the denser the developed ITZ, which appears to contribute to the increase in compressive strength. Furthermore, the above phenomenon is expected to have occurred for the wasted glass aggregate owing to its lower density than water and very low strength.
3.3 Bode plot of hardened cement according to the aggregate type
A Bode plot is a graph that indicates the difference in impedance and phase angle in terms of frequency after EIS measurements. The x-axis represents frequency, and the y-axis represents the impedance and phase angle. The Bode plot can easily indicate the magnitude of the impedance value as a function of frequency; hence, comparing the impedance magnitude between specimens is easy. Moreover, the presence of a capacitor component introduces a phase angle. Hence, it allows us to compare the proportion of capacitor and resistive components in the total measured impedance between specimens.
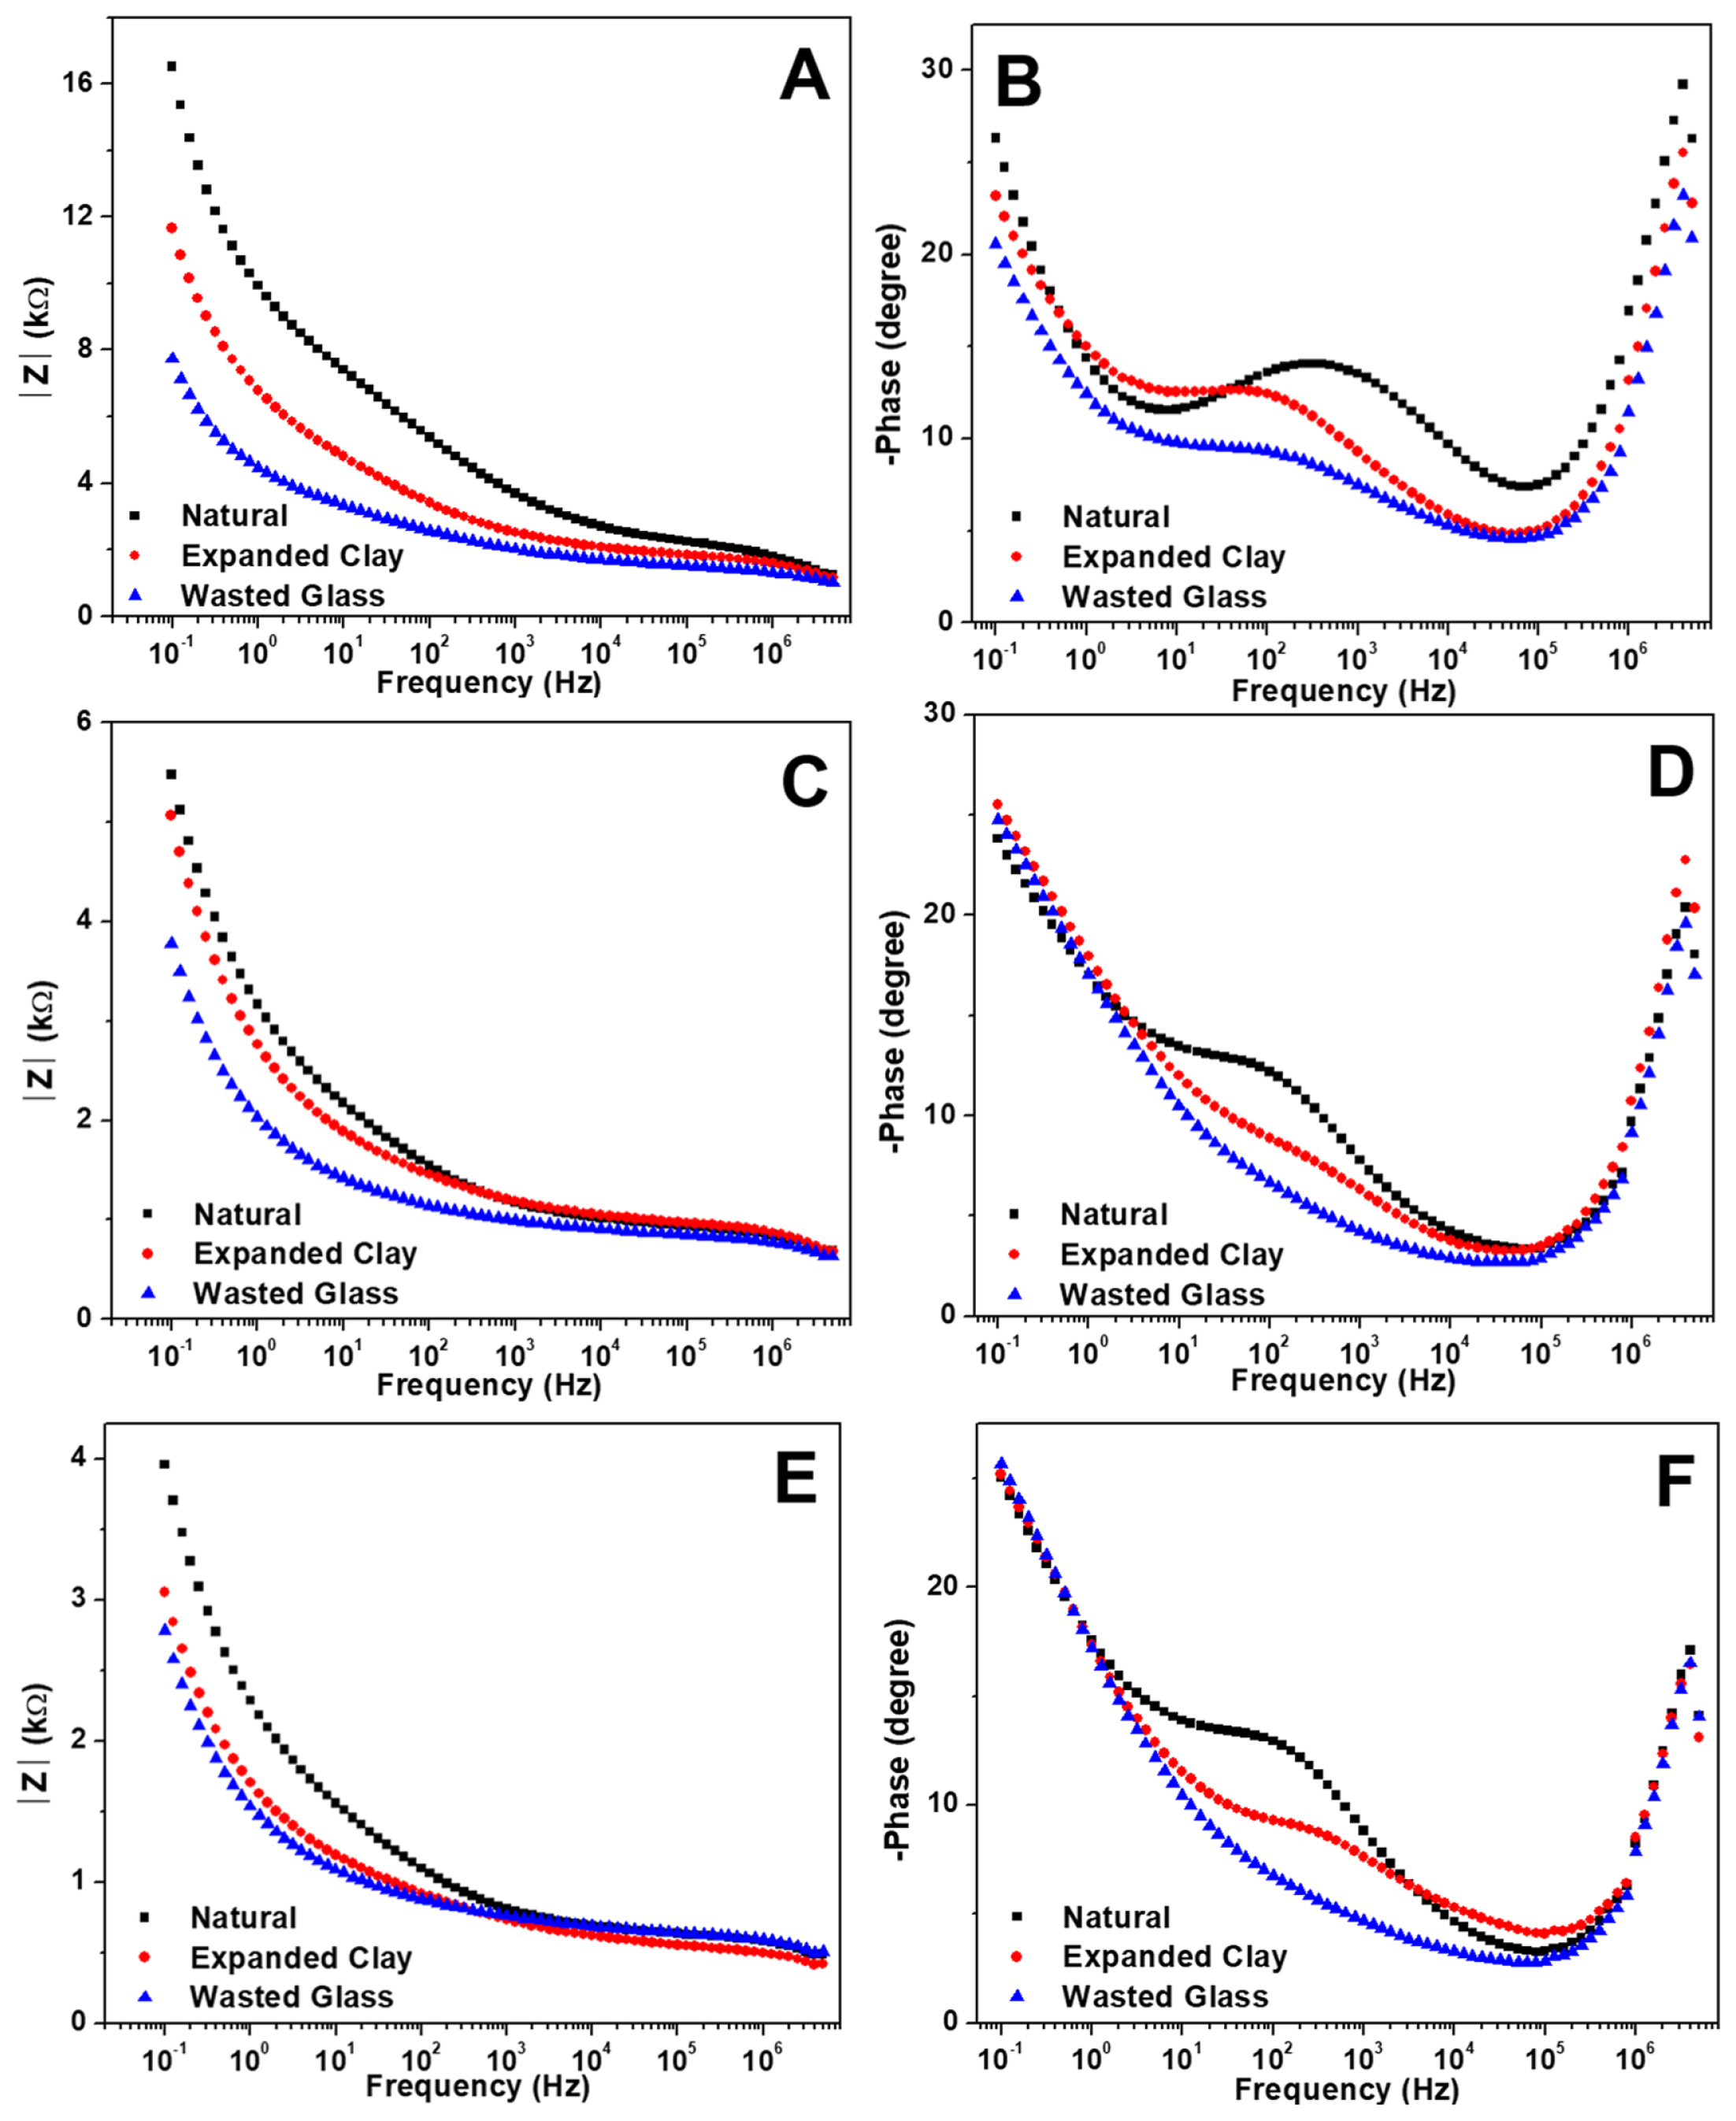
Fig. 6A shows impedance values in the frequency domain for hardened cements with a 30% W/C ratio. The impedance values presented on the y-axis of the Bode plot are the total impedance values measured in the system, which are determined based on the sum of the resistance and capacitance values. The measurement results indicated that in the frequency domain, the impedance was the largest for the natural aggregate, intermediate for expanded clay, and the smallest for the wasted aggregate. The larger impedance in the electrolyte-immersed concrete specimen suggests that it has a higher density, which is a result of low porosity. The natural aggregate specimen with the largest impedance measurement was the densest and also exhibited the largest compressive strength. This implies that higher compressive strengths are associated with higher impedance values.
Fig. 6B depicts the phase angle in the frequency domain for hardened cements with a 30% W/C ratio. The phase angle is generally the largest for the natural aggregate in all frequency bands, followed by expanded clay and wasted glass aggregate. A large phase angle indicates a higher proportion of capacitive components compared to resistive components in the total measured impedance. Thus, it can be inferred that natural aggregates have a relatively large proportion of capacitive components. The higher capacitive components in natural aggregates can be attributed to the fact that natural aggregates are the densest and have the largest interfacial areas. Hence, the aggregate type used in the concrete is found to affect the measured impedance values and phase angle. Denser aggregates form a denser interface, resulting in less electrolyte penetration into the interface and a larger resistance value. Further, a larger capacitance is obtained owing to the increased surface area at the interface.
Fig. 6C,E show the impedance graphs in the frequency domain for hardened cements with W/C ratios of 40% and 50%, respectively. Fig. 6D and 6F show phase angle graphs in the frequency domain for hardened cements with W/C ratios of 40% and 50%, respectively. These graphs indicate that impedance values of hardened cements with W/C ratios of 40% and 50% show a similar trend to that of the 30% W/C ratio, as described earlier. This suggests that the trend of the impedance measurements between aggregates is reproducible. Furthermore, as the W/C ratio increased, the impedance values measured for all aggregates decreased. This can be attributed to the increase in the number of pores at the interface of the lightweight aggregates as the W/C ratio increases, and the electrolyte is better immersed within the interface.
3.4 Nyquist plot of hardened cement according to the aggregate type
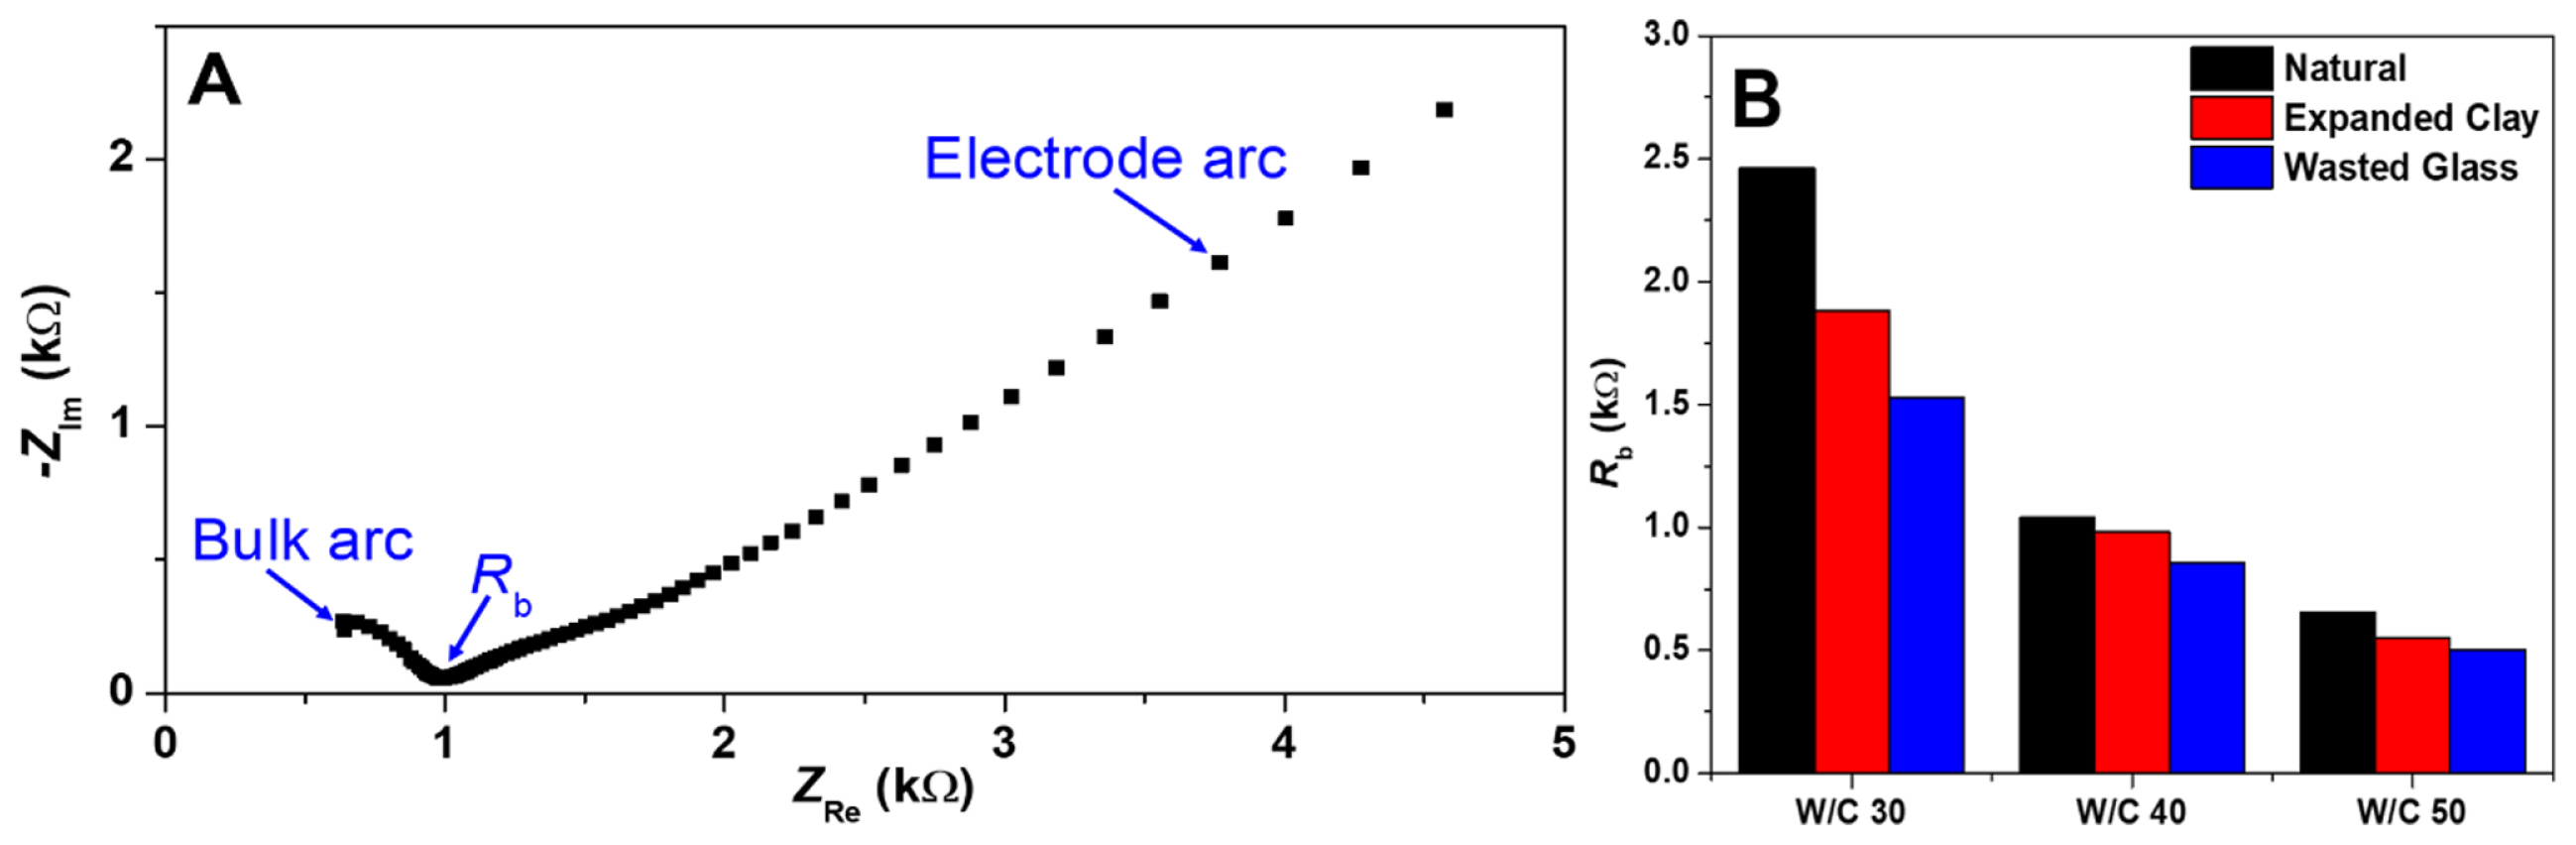
A Nyquist plot is a graph that visualizes impedance as a complex number. The x- and y-axes of this plot represent the real and imaginary parts of the impedance, respectively. Nyquist plots are often used to understand how a measurement system can be represented as an equivalent circuit with resistors and capacitors. The Nyquist plot of hardened cements shown in Fig. 7A shows an impedance shape that is arched on the left and generally straight on the right, starting with a portion of the impedance measurements forming the x-axis intercept. This shape is the same for every aggregate specimen. This implies that even different aggregates can be analyzed with the same equivalent circuit. The shape of the impedance in Nyquist plot is also consistent with the shape reported in other studies that have measured cement impedance [18]. The x-axis intercept value is the bulk resistance (Rb) of the cement specimens, and it represents the effective conductivity of the cement. In Fig. 7B, this value is the largest for natural aggregate, followed by expanded clay, and then wasted glass aggregate. This can be explained by the increase in porosity for wasted glass aggregates, which facilitates electrolyte immersion, resulting in a higher conductivity. This value is correlated with the compressive strength. In other words, the higher the compressive strength, the greater the value of Rb. A similar trend can be observed for the specimens with different W/ C ratios, which is a reliable result. It can also be confirmed that the overall Rb value decreases as the W/C ratio increases. This can be interpreted as a result of the increased porosity with increasing W/C ratios and the resulting smaller resistance with a larger amount of electrolyte immersion.
The left arc of the bulk resistance of the specimen corresponding to the high frequency impedance values represents the impedance of the cement, and the straight line on the right, based on the x-axis intercept value corresponding to the low-frequency impedance value, represents the impedance of the interface of carbon electrode used to analyze the impedance of the cement. The semicircular part of the Nyquist plot shows the impedance of the cement paste, but it also indicates the difference in impedance levels between aggregate types owing to the presence of different aggregate types. The simultaneous presence of both real and imaginary components of impedance indicates that the impedance of the cement aggregate specimens represents a mixture of resistance and capacitance components.
3.5 Equivalent circuit of hardened cement according to the type of aggregate
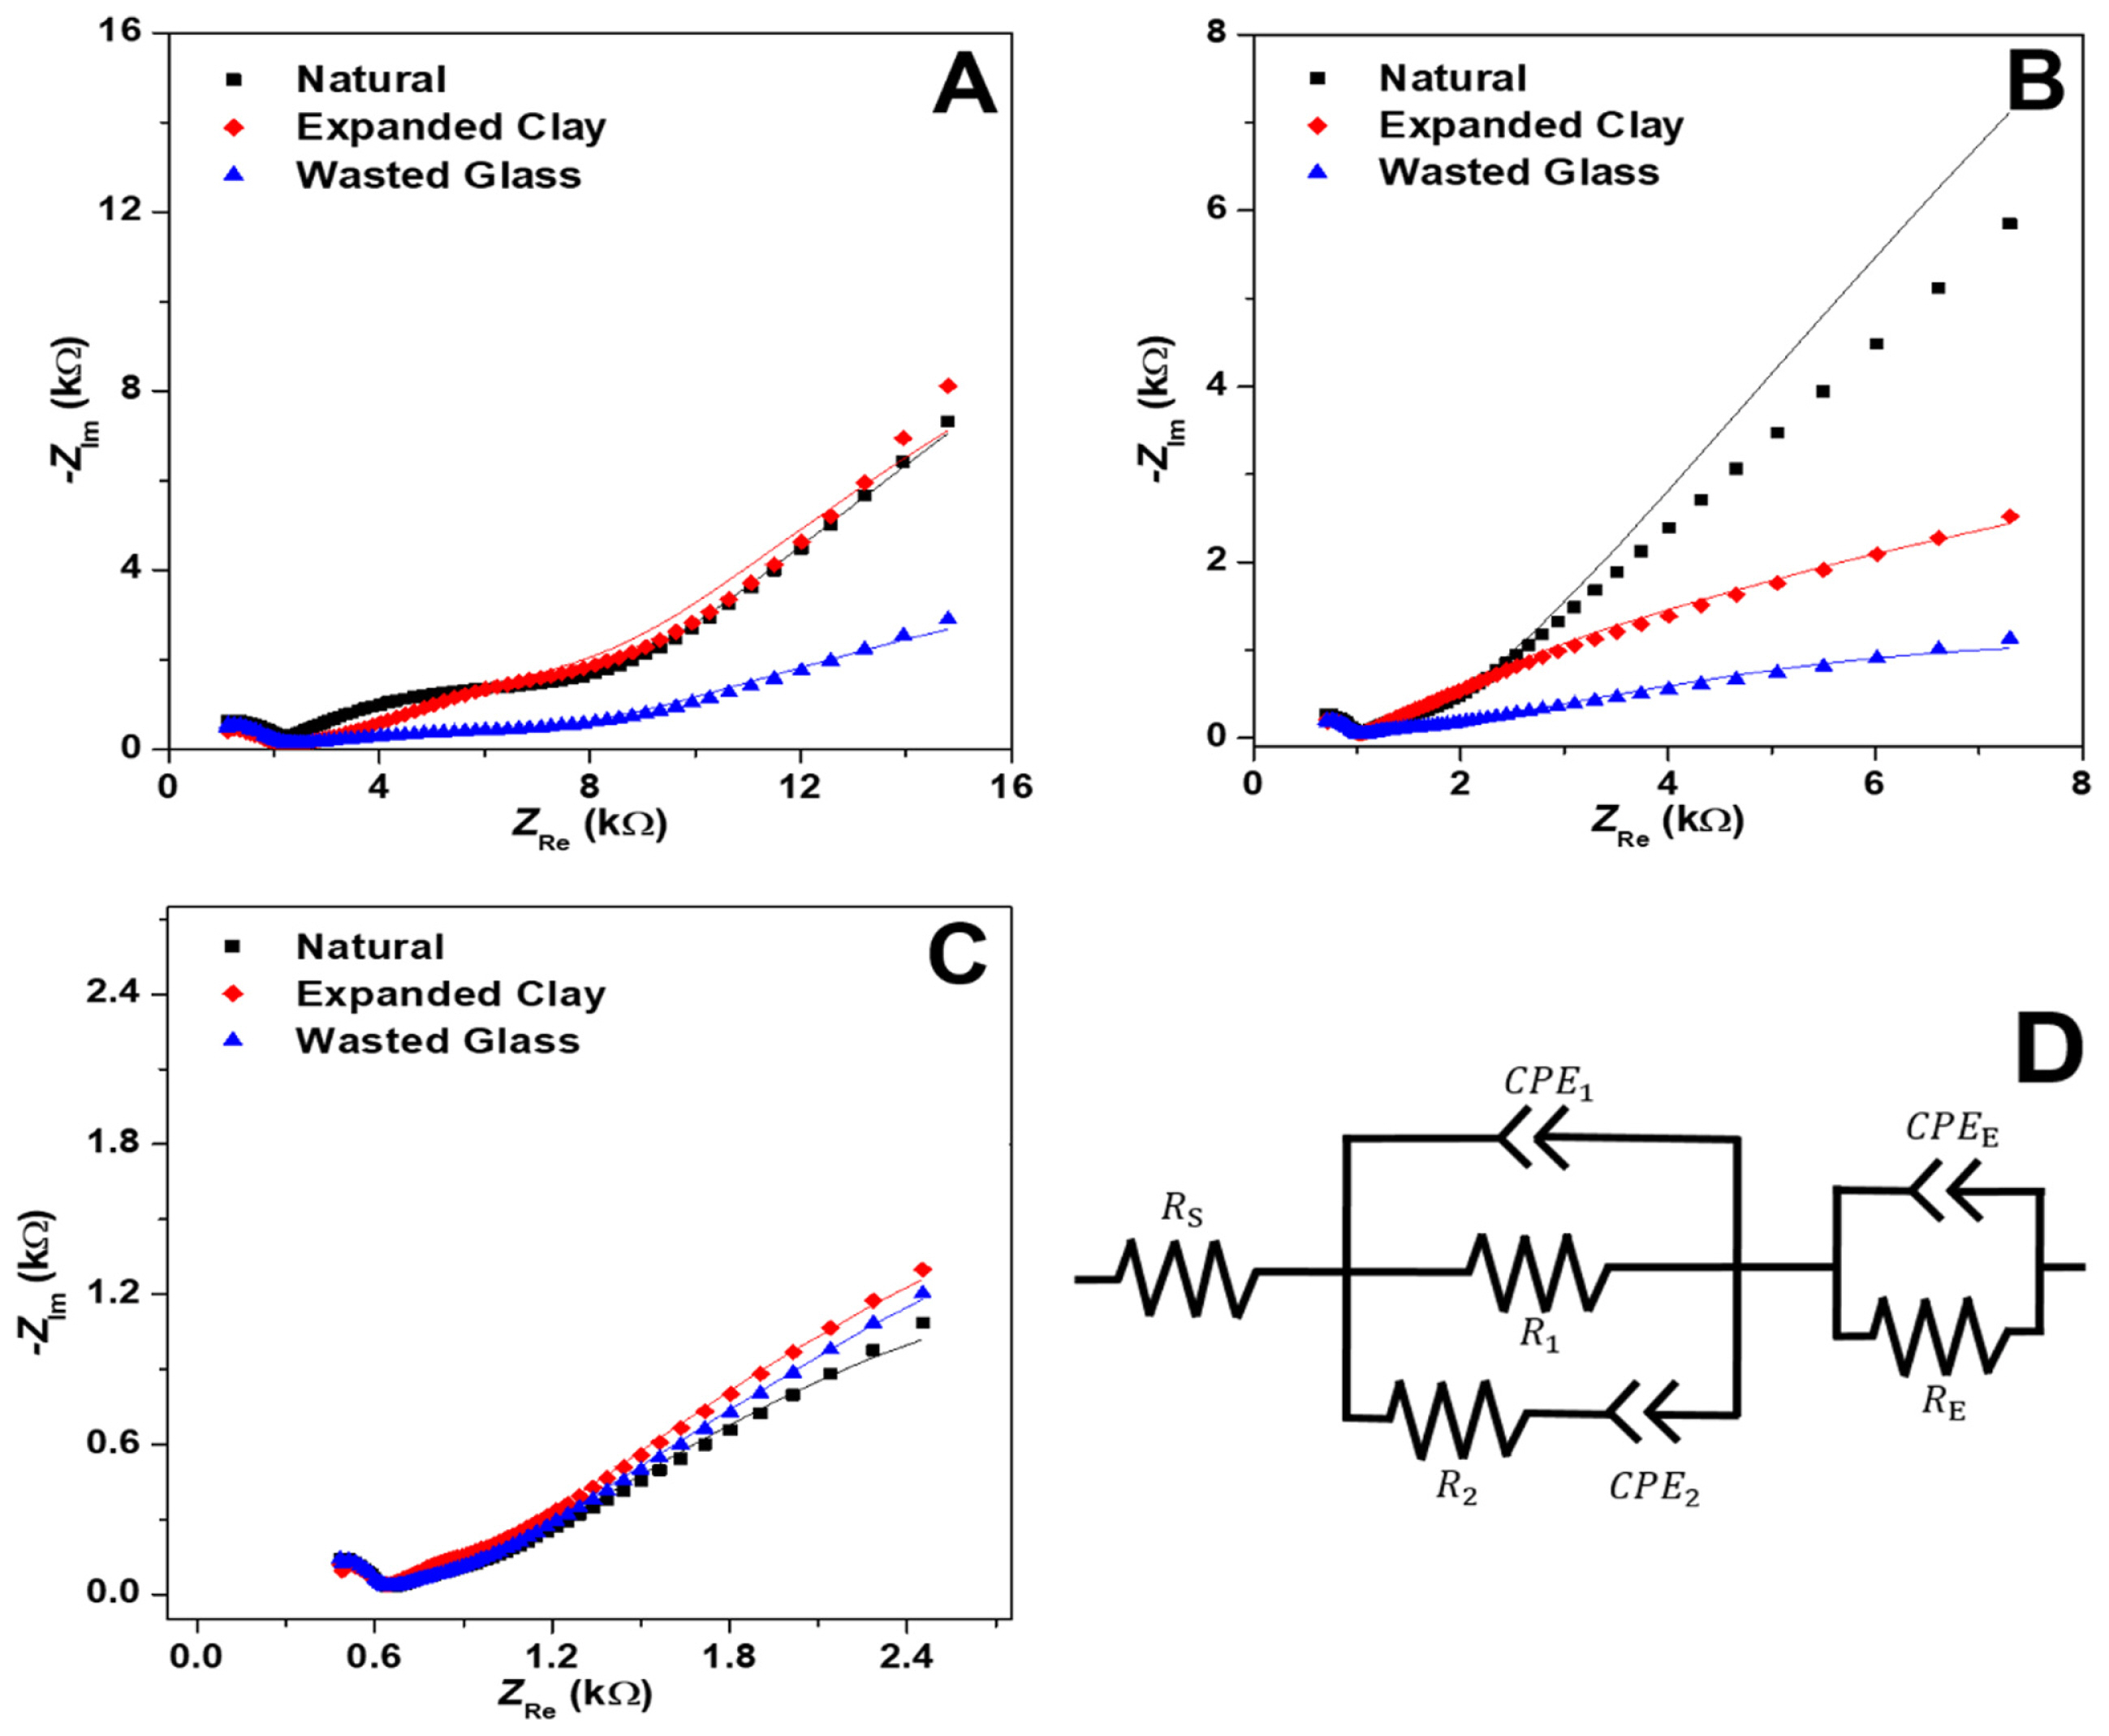
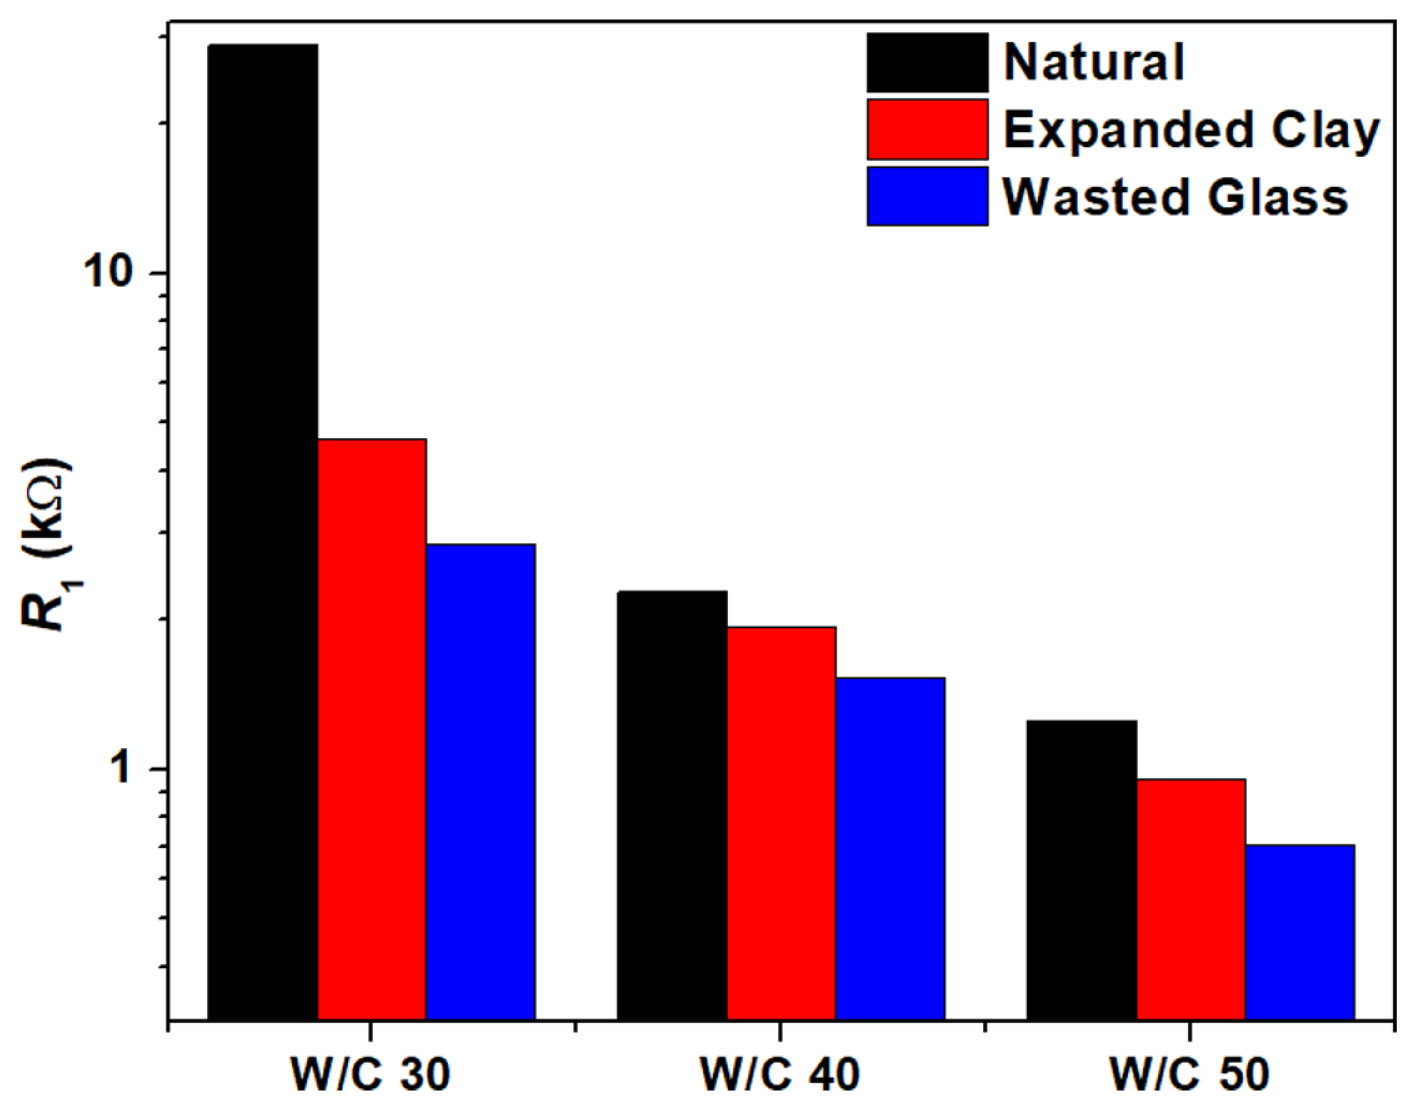
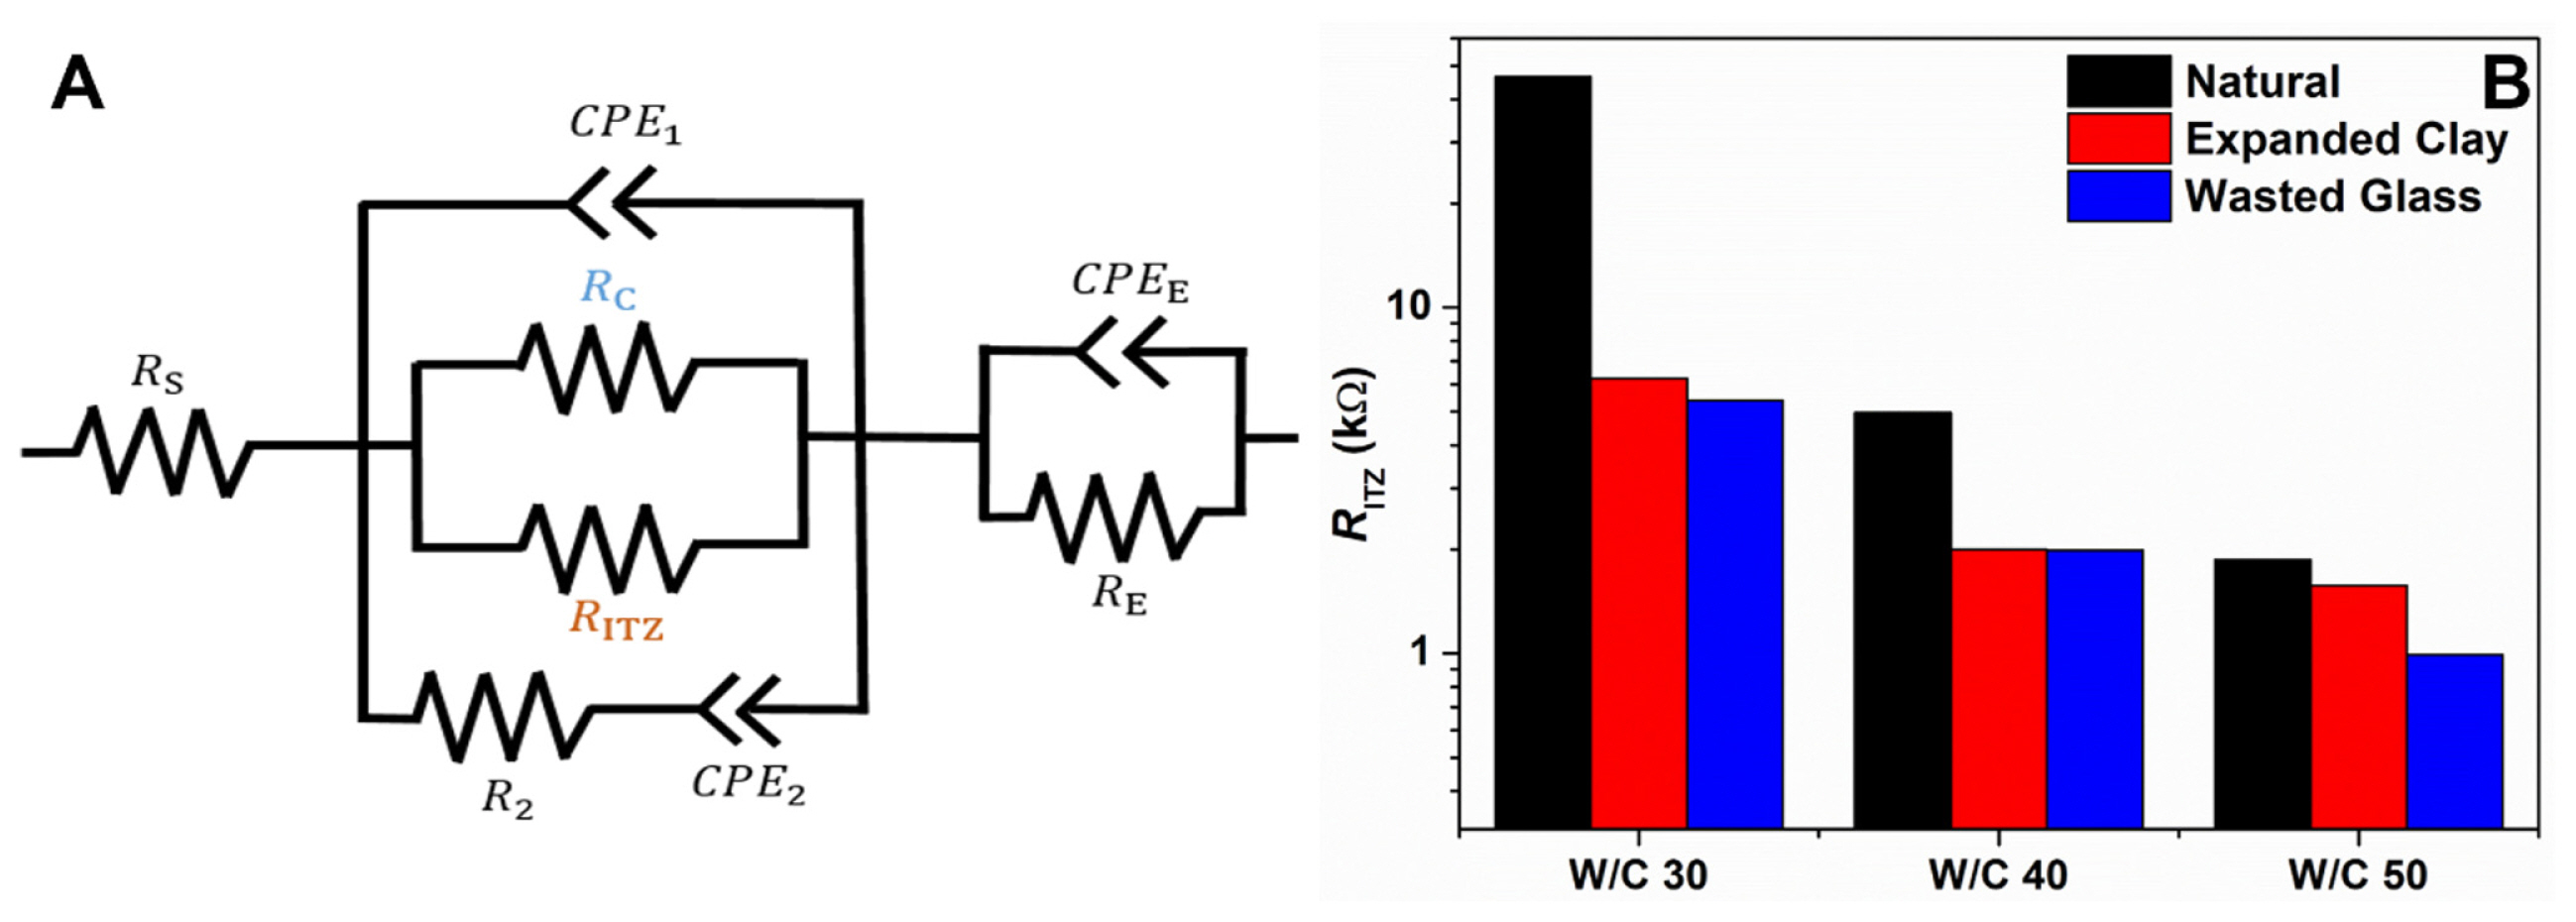
Different materials of hardened cements should exhibit different electrical impedance because they have different interfaces and pores. Lightweight aggregates, in particular, exhibit differences in electrical impedance at the interface owing to porosity, surface pore size, and other factors. In this experiment, as a process for applying lightweight aggregates to high-strength concrete, an equivalent circuit was selected to determine the component of impedance that affects the strength in different aggregates. The experimental results were then fitted to the selected equivalent circuit to analyze the components. A commonly used equivalent circuit was adopted to describe the impedance of the cement (Fig. 8D) [19,20]. In the equivalent circuit, Rs is the electrolyte resistance between the cement specimen and the measuring electrode. R1 and R2 are the resistances of the electrolyte filled in continuous and discontinuous pores in the cement aggregate specimen. Constant phase element (CPE)1 refers to the non-ideal capacitance formed in the solid portion of the cement, and CPE2 refers to the capacitance formed at the solidŌĆōsolution interface present in the cement. RE and CPEE refer to the resistance and non-ideal capacitance, respectively, generated at the interface between the measuring electrode and outer cement. An electrical double layer (EDL) occurs at the interface between the cement and electrolyte in all pores of the cement. Furthermore, EDL may occur at the interface between the surface and the electrolyte in the pores formed in ITZ. Although EDL represented by the capacitor component, the EDL formed by the current system cannot be described as a capacitor formed between two identical plates. Therefore, it cannot be interpreted as a pure capacitor, and a CPE, a capacitance representing non-ideality, should be introduced to fit the experimental results [21,22]. As shown in Fig. 8AŌĆōC, the experimental results are well fitted to the mentioned equivalent circuit. The fitting results confirmed that the R1 value is correlated with the compressive strength. Thus, as shown in Fig. 9, the largest R1 value was measured for the natural aggregate with the highest compressive strength. The smallest R1 value was measured for wasted glass aggregate, which had the lowest compressive strength. Thus, because of the nature of aggregates, the larger the porosity at the ITZ, the easier it is to immerse the electrolyte; this consequently lowers the R1 value, thereby lowering the compressive strength.
We found that the R1 value changed significantly with the difference in aggregate and the change in W/ C content. The R1 value can be understood as the conductive path of the electrolyte in the continuous pores present in the cement-aggregate system. If the aggregate is assumed to be an insulator, the pores affecting R1 are the result of a combination of the pores in the cement and the pores in the ITZ. We split R1 into a parallel connection of the resistance from the pores in the cement (RC) and the resistance from the pores in the ITZ (RITZ) to distinguish between the effects of pores in the cement and pores in the ITZ. The experimental results were then fitted with the modified equivalent circuit shown in Fig. 10A, and since the same cements were used in the samples with three different aggregates, RC values in each aggregate obtained were averaged, and the values were fixed and re-fitted to obtain the RITZ in the different aggregates. The fitting results are given in Table 2 and Fig. 10B. The RITZ values were obtained to be highest for the natural aggregate, second for the expanded clay aggregate, and lowest for the wasted glass aggregate, as shown in Fig. 10B. This order was consistent for different water-cement contents. The lowest resistivity of the ITZ in the wasted glass aggregate suggests that the most pores were formed in the ITZ, which is consistent with the results from the SEM images of the ITZs in various cement-aggregate samples, as shown in Fig. 4. Furthermore, Table 2 shows the RC values decrease with increasing water-cement content, which is attributed to the increase in porosity with increasing water-cement content.
4. Conclusions
We analyzed the interfacial characteristics of hardened cements with different types of aggregates by electrochemical impedance spectroscopy and proposed a method for assessing interfacial properties by selecting an equivalent circuit for each aggregate type. The experimental results are summarized as follows.
(1) The compressive strength results revealed that the lower the W/C ratio, the higher the compressive strength. Regarding the difference in strength based on the aggregate type, dense natural aggregates exhibited the highest strength, followed by expanded clay aggregates and wasted glass aggregates. This is because the higher the aggregate density, the denser the developed interfacial area. For lightweight aggregates, the high water absorption rate affects the formulation of water, thereby increasing interfacial formation and pores. This is considered to be the cause of strength degradation. The decrease in interfacial strength transfers forces to the aggregate, resulting in aggregate fracture.
(2) After the Bode plot analysis, the total impedance value of natural aggregates with high strength was found to be the highest, which is similar to the result of compressive strength, and the impedance increased as the W/C ratio decreased. The phase angle increases as the compressive strength increases. This suggests that higher density increases the surface area of the interface, resulting in a larger measured capacitance.
(3) The Nyquist plot analysis showed a similar trend to the Bode plot results, and the effective conductivity of cement aggregate specimens was the worst for natural aggregates, followed by expanded clay and wasted glass aggregates. In other words, the Rb value, which represents the effective conductivity, was proportional to compressive strength. This can be explained based on the fact that the porosity increases for wasted glass aggregate, which facilitates electrolyte immersion and improves conductivity.
(4) Equivalent circuit and impedance component analyses revealed that the equivalent circuit consisted of three sections: electrolyte, hardened cement, and electrode. Among the various components of impedance in the circuit, the value of the resistances of the electrolyte filled in continuous pores in the cement aggregate and the resistances from the pores in the ITZ increased with the compressive strength.
We expect that our proposed methodology can be applied to a variety of lightweight aggregates and can be utilized to measure the strength of cement in a non-destructive manner.