1. Introduction
Electrochemical machining (ECM) is a highly efficient non-traditional machining method, wherein electrical energy is converted into chemical energy and materials are removed through anodic dissolution. ECM exhibits many advantages as a method, such as no residual stress, no tool loss and no burrs derived from non-contact machining mode, and is widely used in the aerospace field [1ŌĆō3].
As commonly used materials in various fields, the electrochemical dissolution behaviors of stainless steels and nickelbased superalloys have been widely investigated in recent years. Stainless steel 304 (SS304) exhibits higher corrosion resistance in sodium nitrate (NaNO3) than Inconel 718 (IN718) due to the presence of a compact oxide film on its surface, with a loose black film of carbides and oxides of niobium (Nb) also observed on the surface of IN718 after machining [4]. In natural seawater with higher content of ClŌłÆ, the addition of Ni to ferritic steel can decreases the depassivation pH and the dissolution rate at crevices [5]. A transpassivation model of Fe-Cr-Ni stainless steel was proposed, and the transpassivation behaviors were predicted [6]. The nitrogen level in austenitic stainless steels, especially in the molybdenum alloyed steels, can greatly affect pitting corrosion [7]. A generalized kinetic model of transpassive dissolution of nickelbased alloys was presented and it has been found to reproduce quantitatively the current vs. potential curves and the impedance spectra for the studied nickel-based alloys in the transpassive region [8]. The corrosion resistance of different orientations of Nibased single crystal superalloys was investigated and the (001) plane shows the best corrosion resistance [9]. The dissolution of nickel-based cast superalloy K423A in 10% NaNO3 solution is strongly influenced by the carbon and carbide microstructures on its surface, the quality of which is poor [10]. Compared with NaNO3, IN718 has a looser passive film in C6H5K3O7, with the presence of Cit3ŌłÆ ions decreasing the insoluble products, and the structural uniformity after processing being significantly improved [11]. The corrosion rate of IN718 accelerates in the presence of chlorate ions. In sulfosalicylic acid, there is a significant reduction in the amount of dissolved products on the surface of the sample [12]. A thinner passive film on the surface of S136H steel is observed in NaClO3 solution than in NaNO3, which improves the material removal rate and profile accuracy in ECM processing [13]. A mixed solution of NaNO3 and NaCl promotes the dissolution of the passive film of additively manufactured Hastelloy X superalloy and improves the smoothness of the dissolved surface, attributed to the effect of ClŌłÆ [14].
In addition to dissolution properties, temperature is also an important factor that affects ECM. Most of the existing research on how temperature affects ECM is based on the calculation and simulation of the temperature field. Utilizing a gas-liquid two-phase flow simulation in COMSOL, temperature has been shown to play a dominant role in the ECM of film cooling holes [15]. Thermal calculations in pulsed ECM have been performed and the occurring thermal time scales in the system discussed [16]. Simulation results show that pulsed tube electrode ECM can improve temperature distribution. Temperature rise is mainly affected by electrical parameters such as duty cycle [17]. By constructing a multi-physics model and quasi steady state shortcut (QSSSC) method, the temperature field distribution in pulse ECM (PECM) processing has been successfully modeled [18]. To overcome the shortcomings of the QSSSC method, such that it can be used to calculate only rectangular waves, a spectral approach was introduced to successfully calculate the temperature field distribution of PECM under arbitrary waveforms [19]. The thermal imaging simulation for Joule heating was found to be in good agreement with thermal imaging camera results, with the temperature along the horizontal direction of the streamline exhibiting a larger gradient than in the vertical direction [20]. In the electrochemical micromachining of copper, the reaction rate is improved by heating the electrolyte using infrared rays, but the accuracy cannot be well guaranteed [21]. A similar phenomenon has been observed in the fabrication of tungsten microelectrodes using PECM, where in electrolyte conductivity increases with an increase in temperature, while the reaction rate and the thickness of the viscous layer increase, promoting the erosion process [22].
However, most research on electrochemical dissolution behavior has been conducted near to room temperature, with the study of dissolution characteristics in a cryogenic environment yet to be reported. According to previous research, temperature has an effect on the decomposition voltage of materials [11,23]. In addition to changing the conductivity of the solution, temperature also compresses the energy states occupied by electrons on the metal surface, resulting in a change in the electrochemical properties of the solution-metal interface [24]. The electrochemical reaction is hindered at low temperature, with the passive film on surface changing to some extent. Moreover, the hydrogen volume ratio during processing decreases according to the gas state equation. These results suggest that precision ECM with small removal amounts of anodic materials is possible in a cryogenic environment. Hence, the study of dissolution characteristics at low temperature is necessary.
In this study, the dissolution characteristics and passive film properties of SS304 and IN718 were investigated at different temperatures in 20 wt% NaNO3 solution, which has a freezing point of around ŌłÆ10┬░C [25]. To eliminate the influence of the decrease in the solution conductivity caused by the low temperature, an ambient temperature (30┬░C) control group was introduced that exhibits the same conductivity as at low temperature. A variety of electrochemical test methods were then used to thoroughly investigate the differences between the electrochemical properties of these two alloys at different temperatures. X-ray photoelectron spectroscopy (XPS) was used to analyze the difference in the composition of passive films at low and ambient temperature. The surface morphologies of the alloys at different current densities at various temperature were observed by scanning electron microscope (SEM), with the compositions of their surface structures analyzed by energy disperses spectroscopy (EDS). Overall, it was found that the changes in interfacial dissolution properties and passive film modification under cryogenic conditions may have favorable effects on ECM.
2. Experimental
2.1 Sample preparation
Samples of SS304 and IN718 with dimensions 10├Ś10├Ś10 mm3, cubed by wire-electrical discharge machining, were prepared for electrochemical tests and ECM experiments. Prior to testing, the surfaces of the samples were ground and polished with a metallographic grinder. SEM images of the initial surfaces of the materials and the EDS results of their compositions are shown in Fig. 1A and B.
2.2 Design of experimental groups
For comparison, three experiment groups were set up: group 1 (G1) with 20 wt% solution concentration and a conductivity of 159.4 mS/cm at 30┬░C, group 2 (G2) with a 20 wt% solution and a conductivity of 60.1 mS/cm at ŌłÆ10┬░C and group 3 (G3) with a 6 wt% solution concentration and a conductivity of 60.1mS/cm at 30┬░C.
2.3 Electrochemical test system and temperature control system
A three electrodes system was established during the electrochemical measurement (Fig. 1C). A sample coated with epoxy resin and only one finely ground and polished surface (10├Ś10 mm2) exposed was used as the working electrode (WE), a platinum electrode of 20├Ś20├Ś0.2 mm3 in size was used as the auxiliary electrode (AE) and saturated calomel electrode (SCE) was used as the reference electrode (RE). All the electrochemical tests were conducted on the Zahner electrochemical workstation (Zennium E, Zahner Instruments Inc., Germany).
A double-layer glass electrolytic cell was adopted, with electrolyte contained inside and the cooling medium (ethanol) circulated in the interlayer. A well-controlled cryogenic tank was used to cool the external circulating medium. According to the solution temperature measured by the temperature sensor, the set value of the cryogenic tank was adjusted in real time so that the solution temperature could reach the predetermined value.
2.4 ECM experiment system
A cryogenic ECM system was constructed using an ECM machine tool and a cryogenic bath to determine the surface topography at different current densities (Fig. 1D). The machined surface area of the sample is 10 ├Ś 10 mm2. Before processing, the electrolyte in the cryogenic tank was circulated and the processing started after the temperature measured by the sensor reached the set value.
3. Results and Discussion
3.1 Linear sweep voltammetry (LSV) measurements
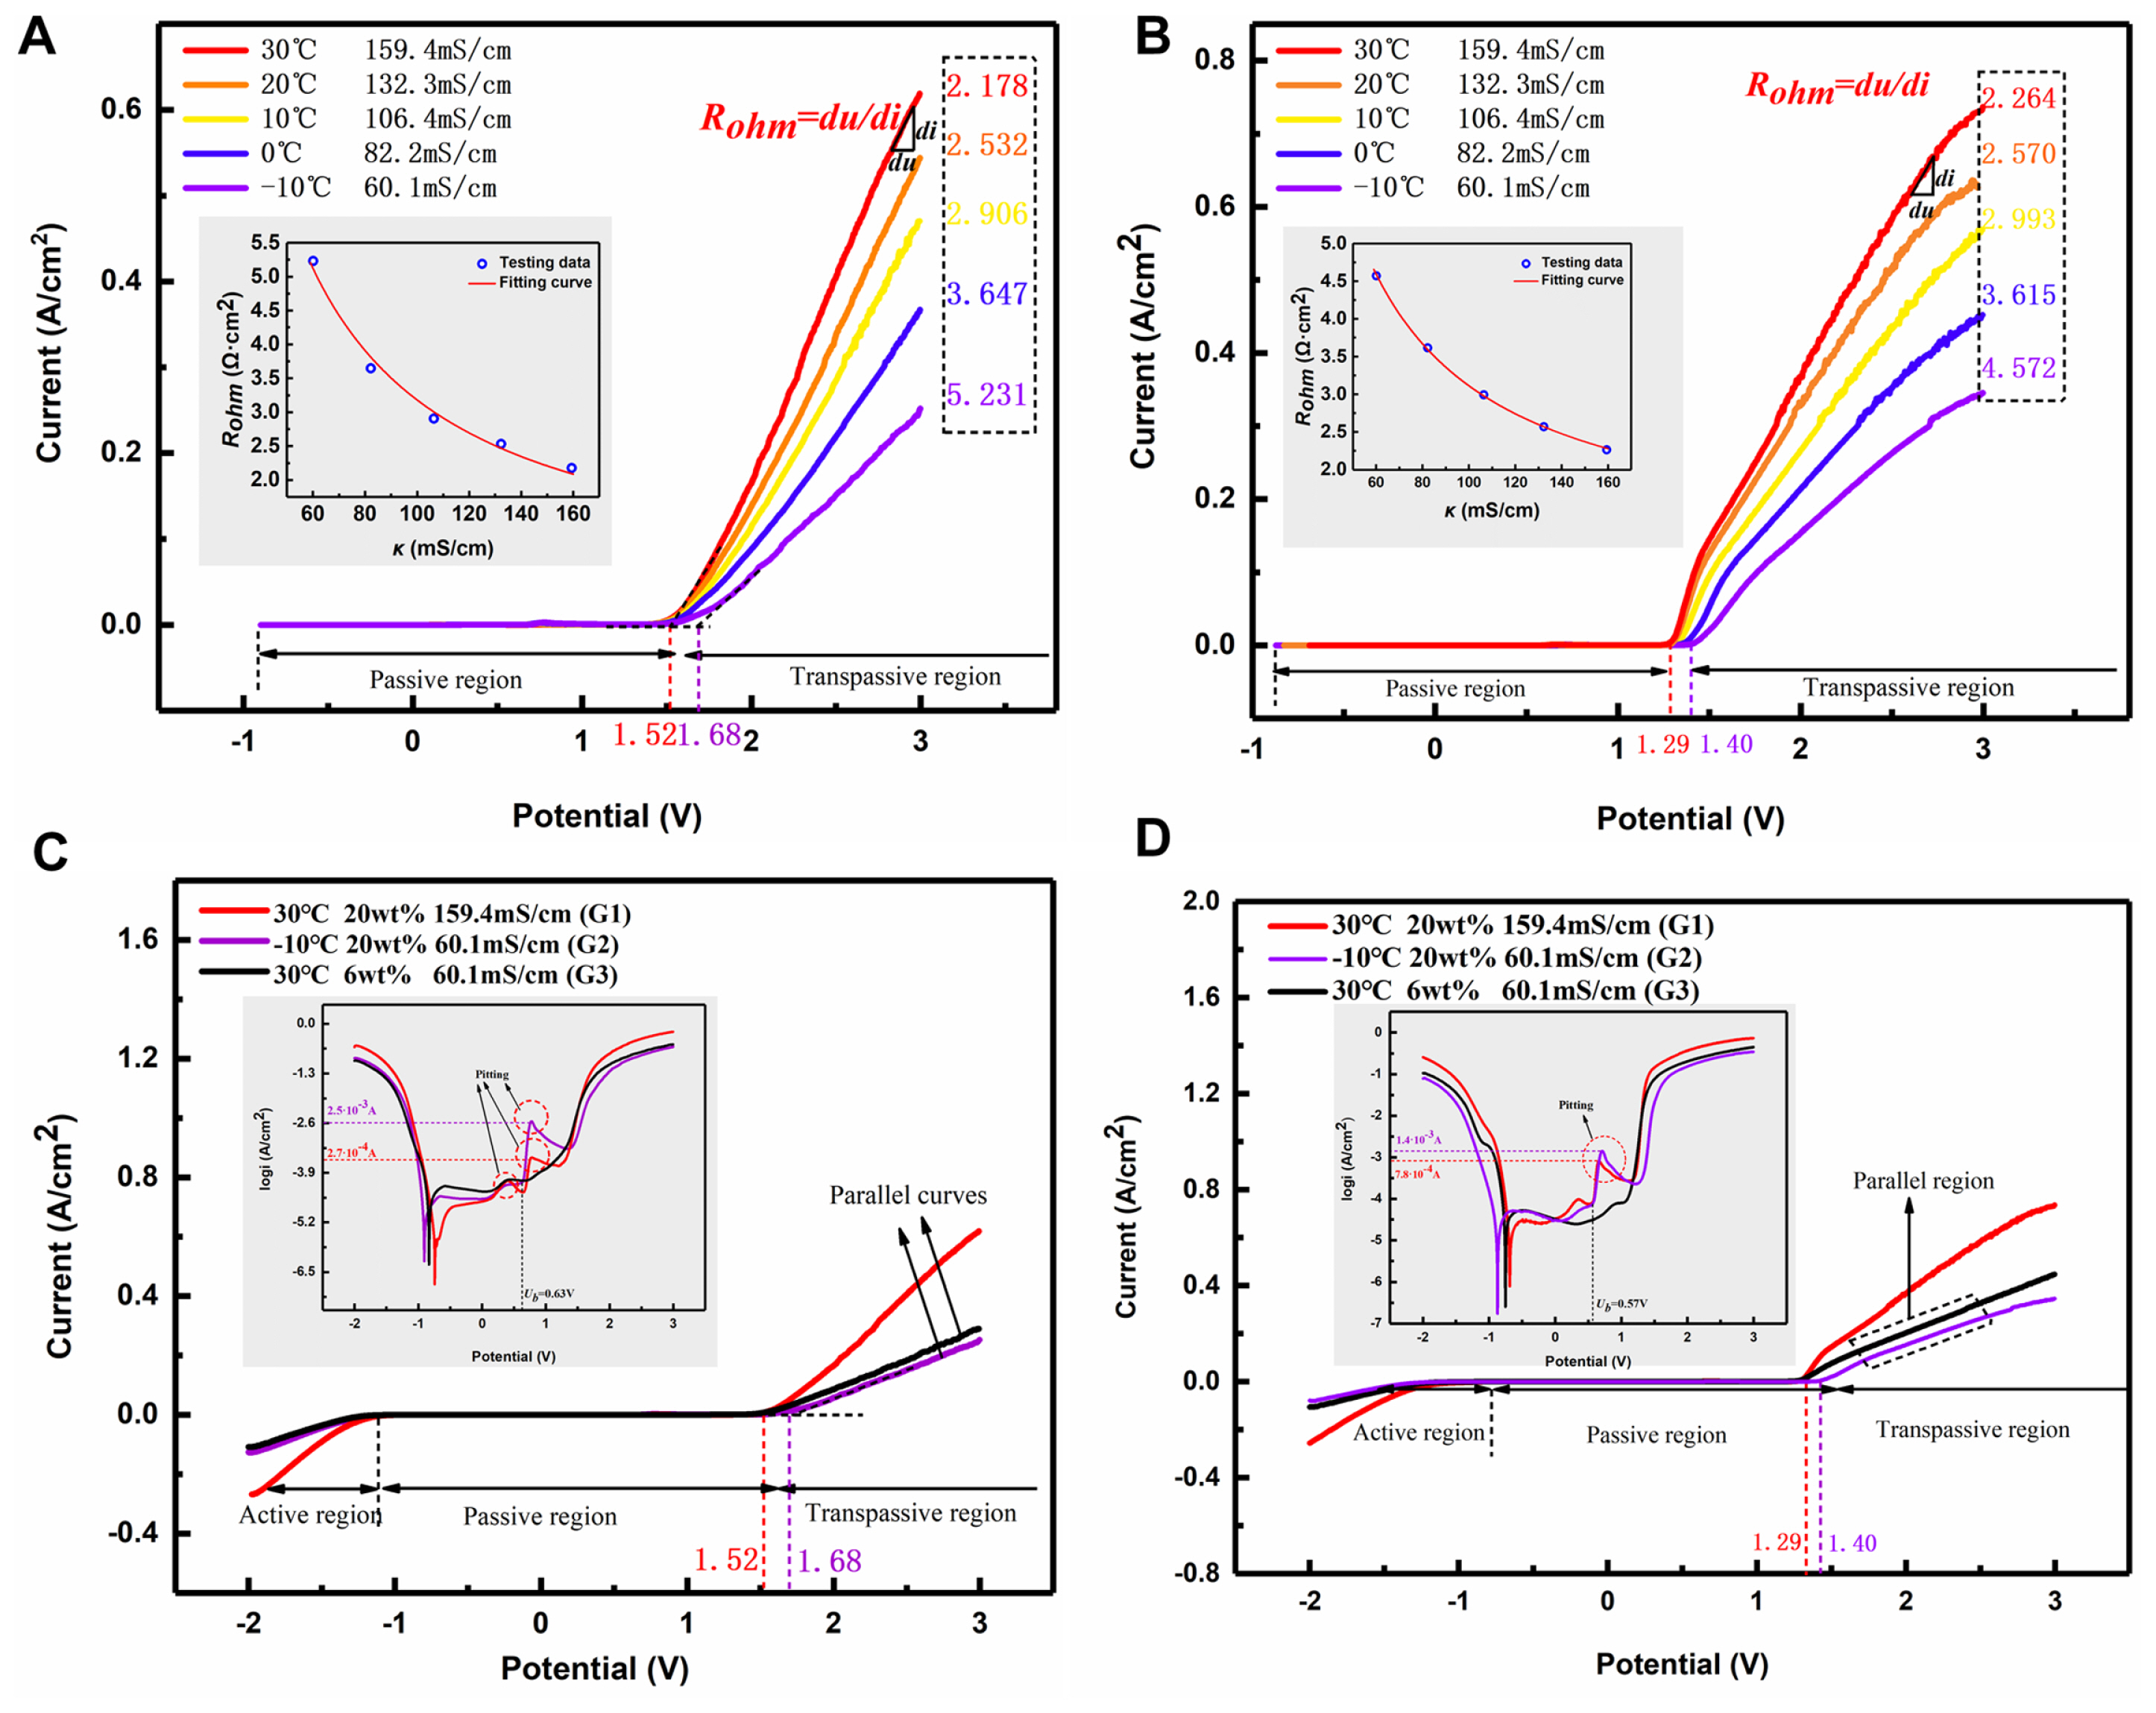
LSV measurements were conducted over a potential range of ŌłÆ2 V to 3 V at a scan rate of 5 mV/s. Prior to conducting the measurements, the potential between WE and RE was set to ŌłÆ1.5V and maintained for 1 min to remove the oxides from the surfaces of the samples and to expose the intact matrix. Afterwards, open circuit potential (OCP) measurements were performed for 2 h to stabilize the entire electrode-solution system at a certain temperature. The anodic polarization behavior of the two alloys in 20 wt% solution at different temperatures is shown in Fig. 2A and B, with both alloys exhibiting passive and transpassive regions. The current density is close to 0 in the passive region, while the potential (U) (vs. SCE)ŌĆōcurrent (i) curves are approximately linear in the transpassive region. SS304 exhibits better linearity, while IN718 deviates slightly under the influence of surface products [26]. The reciprocal of the slope (Rohm=dU/di) of the linear zone at various temperatures was calculated and is listed in the dotted box after each curve. The largest component of this slope is the resistance of the electrolyte. After fitting the relationship between Rohm and the conductivity of solution (Fig. 2A and B, inset), it was found that Rohm consists of two parts:
where Rsol represents the resistance of the solution, Rt represents the charge transfer resistance, l represents the distance between the WE and AE, S represents the area of the WE surface, and ╬║ is the conductivity of the electrolyte. This shows that when the frequency of the electrical signal is low, the inter-electrodes equivalent circuit can be simplified as a series structure of solution resistance and charge transfer resistance.
The values of Rt at different temperatures were calculated and are listed in Table 1. The Rt value of SS304 first decreases with a decrease in temperature, then increases at a temperature < 0┬░C, i.e., the freezing point of pure water. However, the IN718 shows the opposite trend.
In addition, the decomposition voltage (Vde) of these two alloys increases with a reducing in temperature. The Vde of SS304 increases from 1.52 V at 30┬░C to 1.68V at ŌłÆ10┬░C, while that of IN718 increases from 1.29 V at 30┬░C to 1.40 V at ŌłÆ10┬░C. This increase in Vde means that it is more difficult for the surface to enter the active dissolution state at low temperature, which is due to the decrease in the ionic activity in the solution and strong passivation behavior.
LSV measurements were then conducted on the set three groups of each alloy, with the specific experimental parameters and steps kept the same as those detailed above. The polarization curves show similar passive and transpassive regions (Fig. 2C,D). The Vde of G1 and G3 (same temperature, different concentration) are almost the same. It reveals that the solution concentration has less effect on the active dissolution state of the surface of the alloys than temperature. Hence, the curves of G2 and G3 (same conductivity, different temperature) show a near parallel domain in the transpassive region. The small error of the reciprocal of the slope derived from the resistance of interface Rt is defined as:
When the influence of conductivity is removed, the higher Rt at low temperature than at ambient temperature indicates that the charge transfer process at the interface is more limited.
The U (vs. SCE)-log(i) images provide more information on the passive region (Fig. 2C and D, inset). The curves of G1 and G2 (same concentration, different temperature) of both alloys exhibit a current peak at a specific potential in the passive region, attributed to the occurrence of pitting corrosion, while this is not obvious at low concentration. In fact, at high concentration, more ions gather on both sides of the passive film to form a larger potential difference, and pitting corrosion is more likely to occur. The pitting current peak of SS304 at ŌłÆ10┬░C is 2.5├Ś10ŌłÆ3 A/cm2, almost 10 times greater than that at 30┬░C (2.7├Ś10ŌłÆ4 A/cm2), indicating that the pitting region at low temperature is larger than at ambient temperature. In other words, the passive film is more easily broken down in a cryogenic environment. For both alloys, the pitting corrosion at different temperatures basically occurs at the same voltage. For SS304, Ub=0.63 V, for IN718, Ub=0.57 V. Therefore, when the temperature is lowered, the passive film is modified to some extent. A denser passive film enhances its own capacitance characteristics, which increases the number of ions involved in the ŌĆśchargingŌĆÖ process and reduces the number of ions that participate in the ŌĆścrossoverŌĆÖ process. The dense film structure conceals some of the defects that are prone to pitting corrosion, and every part of the entire surface is equally likely to corrode under a larger electric field strength. This is also confirmed by the XPS and EIS measurements of the properties of the passive film described below.
3.2 OCP measurements
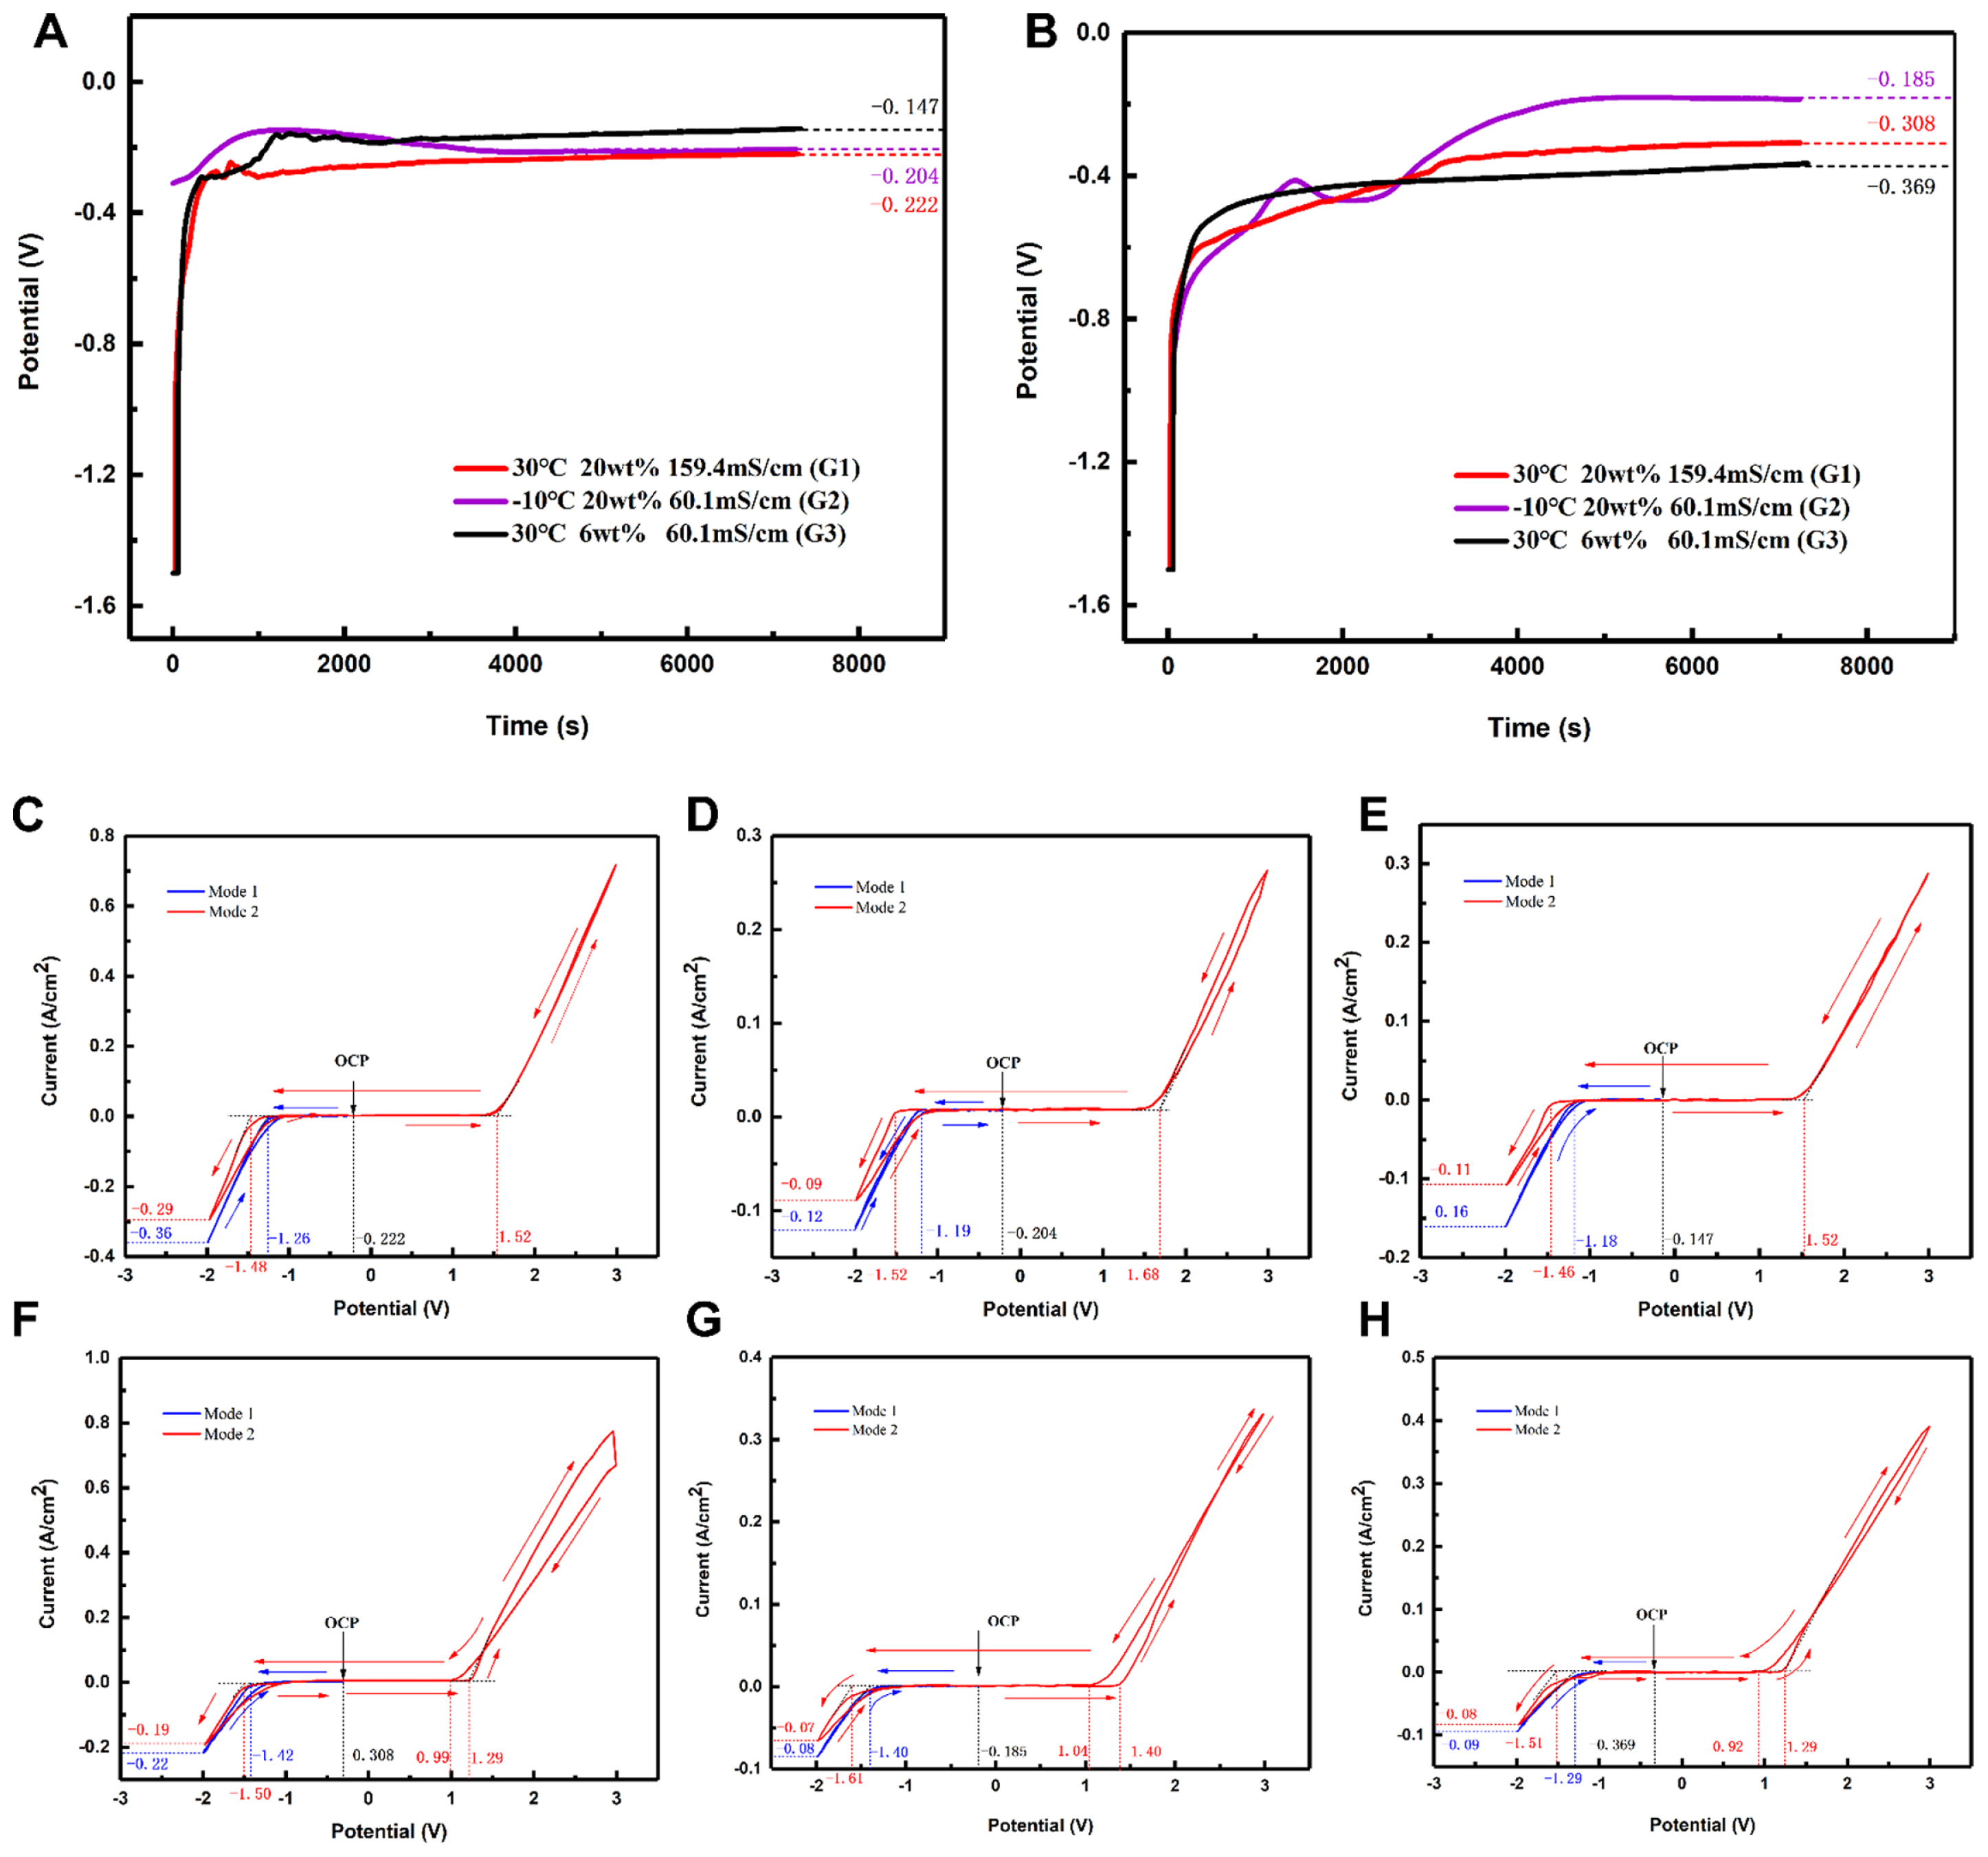
OCP measurements were conducted after applying a negative potential (ŌłÆ1.5 V) for 1 min. The three set experimental groups (G1-3) of each of the alloys were tested for 2 h and the potential was observed to eventually stabilize (Fig. 3A,B). The OCP of SS304 in G3 is ŌłÆ0.147 V, which is higher than that of the other two groups, while the largest OCP of IN718 is ŌłÆ0.185 V in G2. This indicates that the concentration of the solution is the biggest factor that affects the corrosivity of SS304, while the temperature has more influence on IN718. Moreover, the OCP range of SS304 is 0.075 V, lower than that of IN718 of 0.184 V. The better corrosion resistance of SS304 reduces the influence of various factors, while changing factors such as temperature has a great effect on the corrosion resistance of IN718.
3.3 Cyclic voltammetry (CV) measurements
More details of interface passivation and corrosion were revealed by CV measurements. After grinding, polishing, and thoroughly cleaning the samples to be tested, an inverse voltage of 1.5 V was applied for 1 min to remove oxides from the surfaces of the samples. OCP measurements were then conducted for 2 h afterwards prior to the CV measurements. Two scan modes were used in the CV measurements of the three groups of samples of the two alloys (Fig. 3CŌĆōH). Scanning mode 1 (blue line) started at the OCP of the materials at a given temperature, with negative scanning, which was then reversed at ŌłÆ2 V and then finished at the OCP. Scanning mode 2 (red line) started at the OCP of materials, with positive scanning, which was then reversed at 3 V and reversed again when the potential reached ŌłÆ2 V and then finished at the OCP. The scan rate was 5 mV/s.
In mode 1, the current density of negative scanning (OCPŌåÆŌłÆ2V) is less than that of positive scanning (ŌłÆ2VŌåÆOCP) in almost all cases, revealing the presence of passive films on the initial surface after OCP tests. After negative scanning, most passive layer was removed and a larger area of fresh surface was exposed for hydrogen reduction resulting in an increase in current density during positive scanning. This phenomenon exhibits that the attached passive film is semiconductor or insulator, in which the hydrogen reduction in this region is restricted more or less. Similarly, the negative scanning of mode 2 shows the same trend in this voltage region due to the passive film generating in the passive region when reversed from 3 V to ŌłÆ2 V. All the current density values of the scanning from ŌłÆ2 V to OCP in mode 2 are less than those of mode 1. This is due to the dense passive film produced in passivation not being removed completely and covering a larger matrix surface than in mode 1.
The positive scanning from OCP to 3 V and negative scanning from 3 V to OCP in mode 2 for SS304 in G1 and G3 at 30┬░C (Fig. 3C,E) show good coincidence in the transpassive region, indicating that uniform dissolution occurs on its surface. The curve of SS304 at ŌłÆ10┬░C (Fig. 3D) exhibits a hysteresis loop in the transpassive region. The current density of negative scanning is higher than that of the positive scanning. The approximate linear relationship shows that most area undergoes active dissolution, while some of the passive film is not be destroyed, even at 3 V, due to the effect of low temperature. Combined with the LSV results, it can be seen that the passive film has not only been modified, but its thickness has also increased to a certain extent. The attached passive film exhibits capacitance properties, with ions accumulating on both sides. When the charge accumulates to a certain amount, the field strength is high enough to break down these passive films. Therefore, a larger area is involved in active dissolution during negative scanning.
However, in the transpassive region of IN718, positive scanning exhibits a higher current density compared to negative scanning at the beginning of conversion in G1 and G3 (Fig. 3F,H), mainly due to the accumulation of products on the alloy surface [26]. The low temperature G2 exhibits better consistency due to less surface product coverage and a hysteresis loop like that of SS304 (Fig. 3G). With the progress of negative scanning in G1 and G3, the size relationship begins to reverse gradually, and the potential entering the passive region is lower than the decomposition voltage of positive scanning in all groups. This is caused by the combined effect of residual passive film rupture and product adhesion.
3.4 XPS measurements
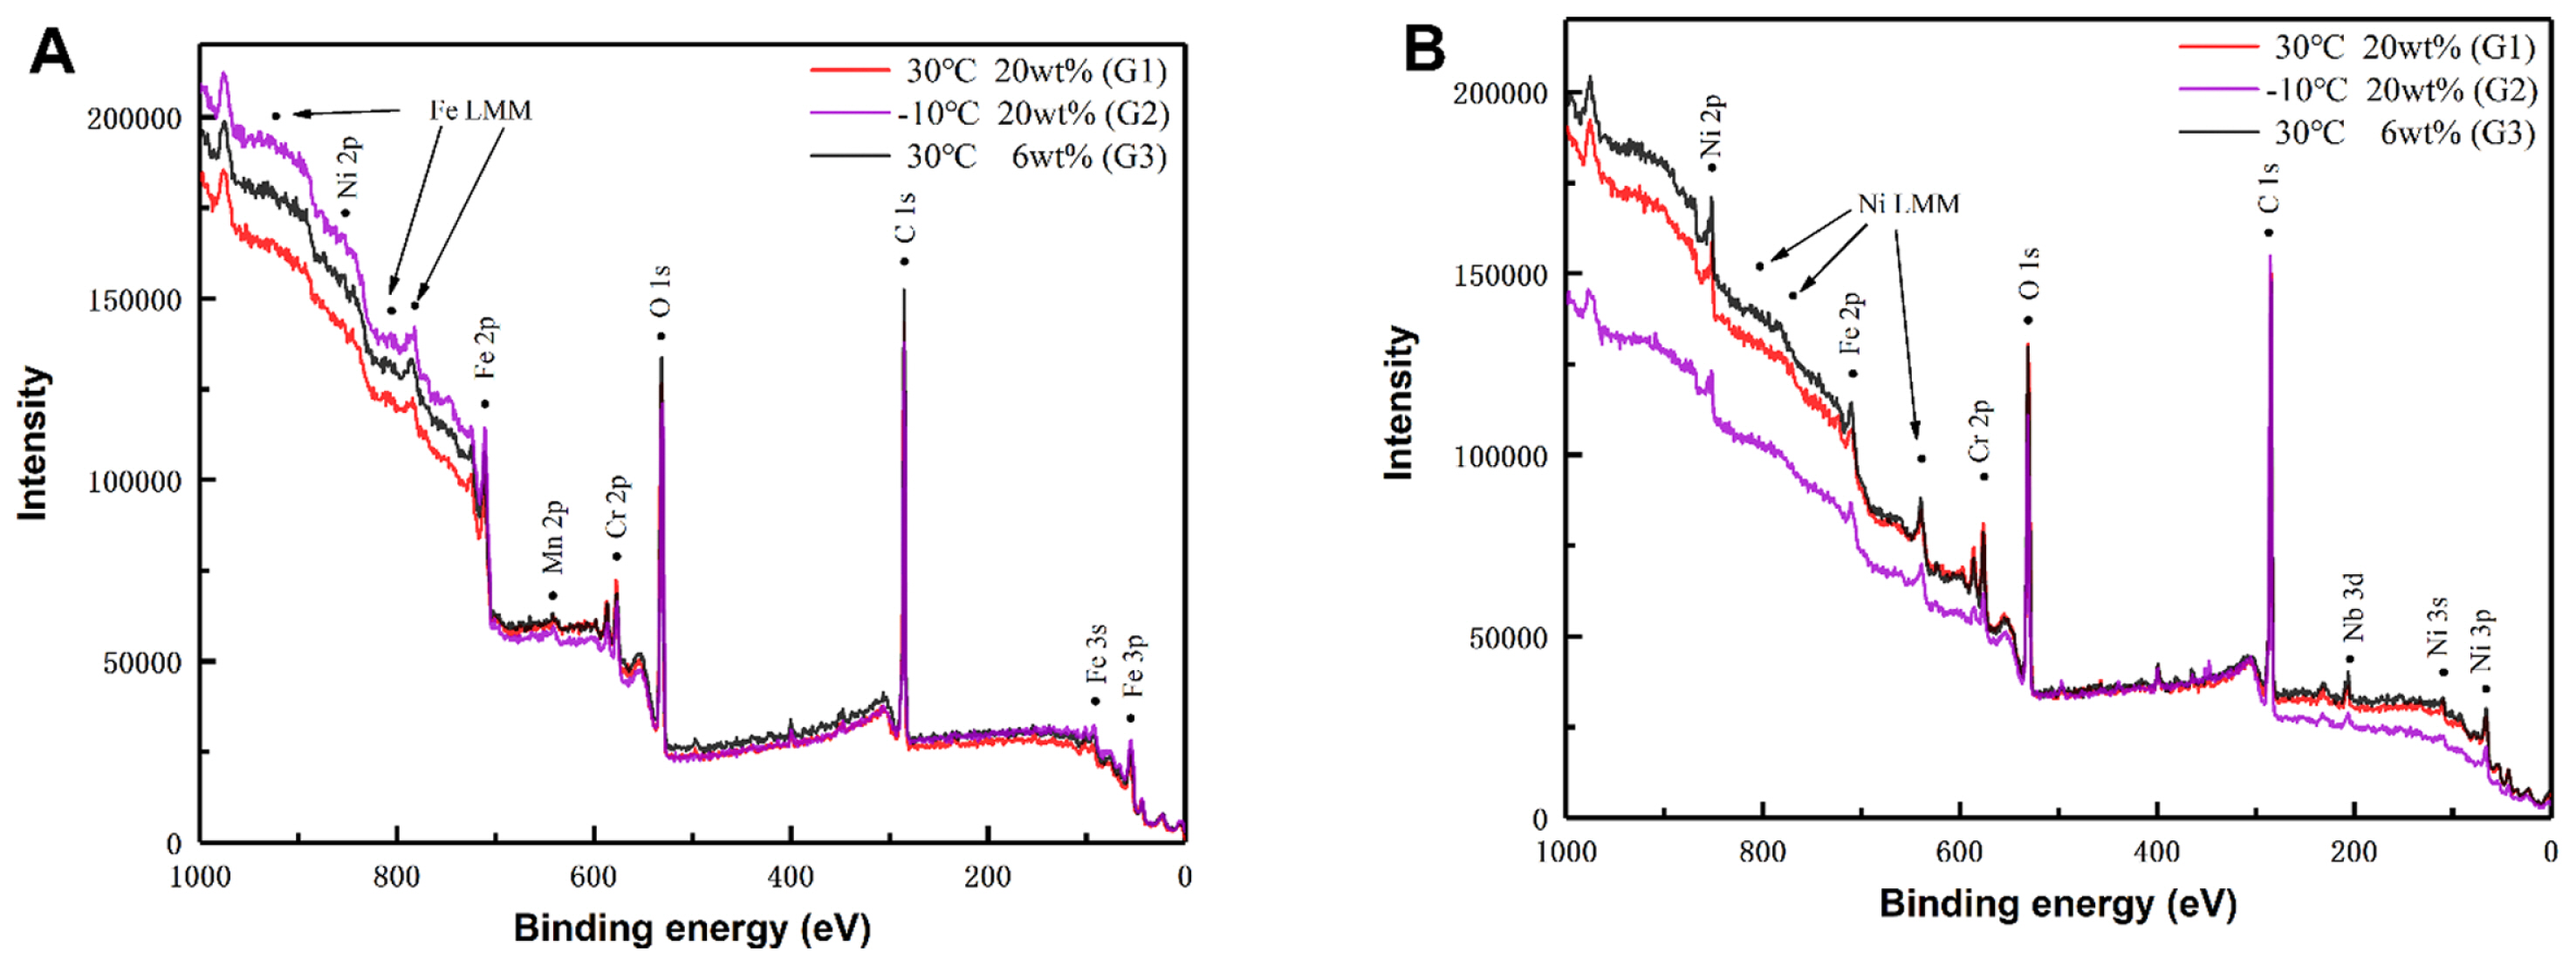
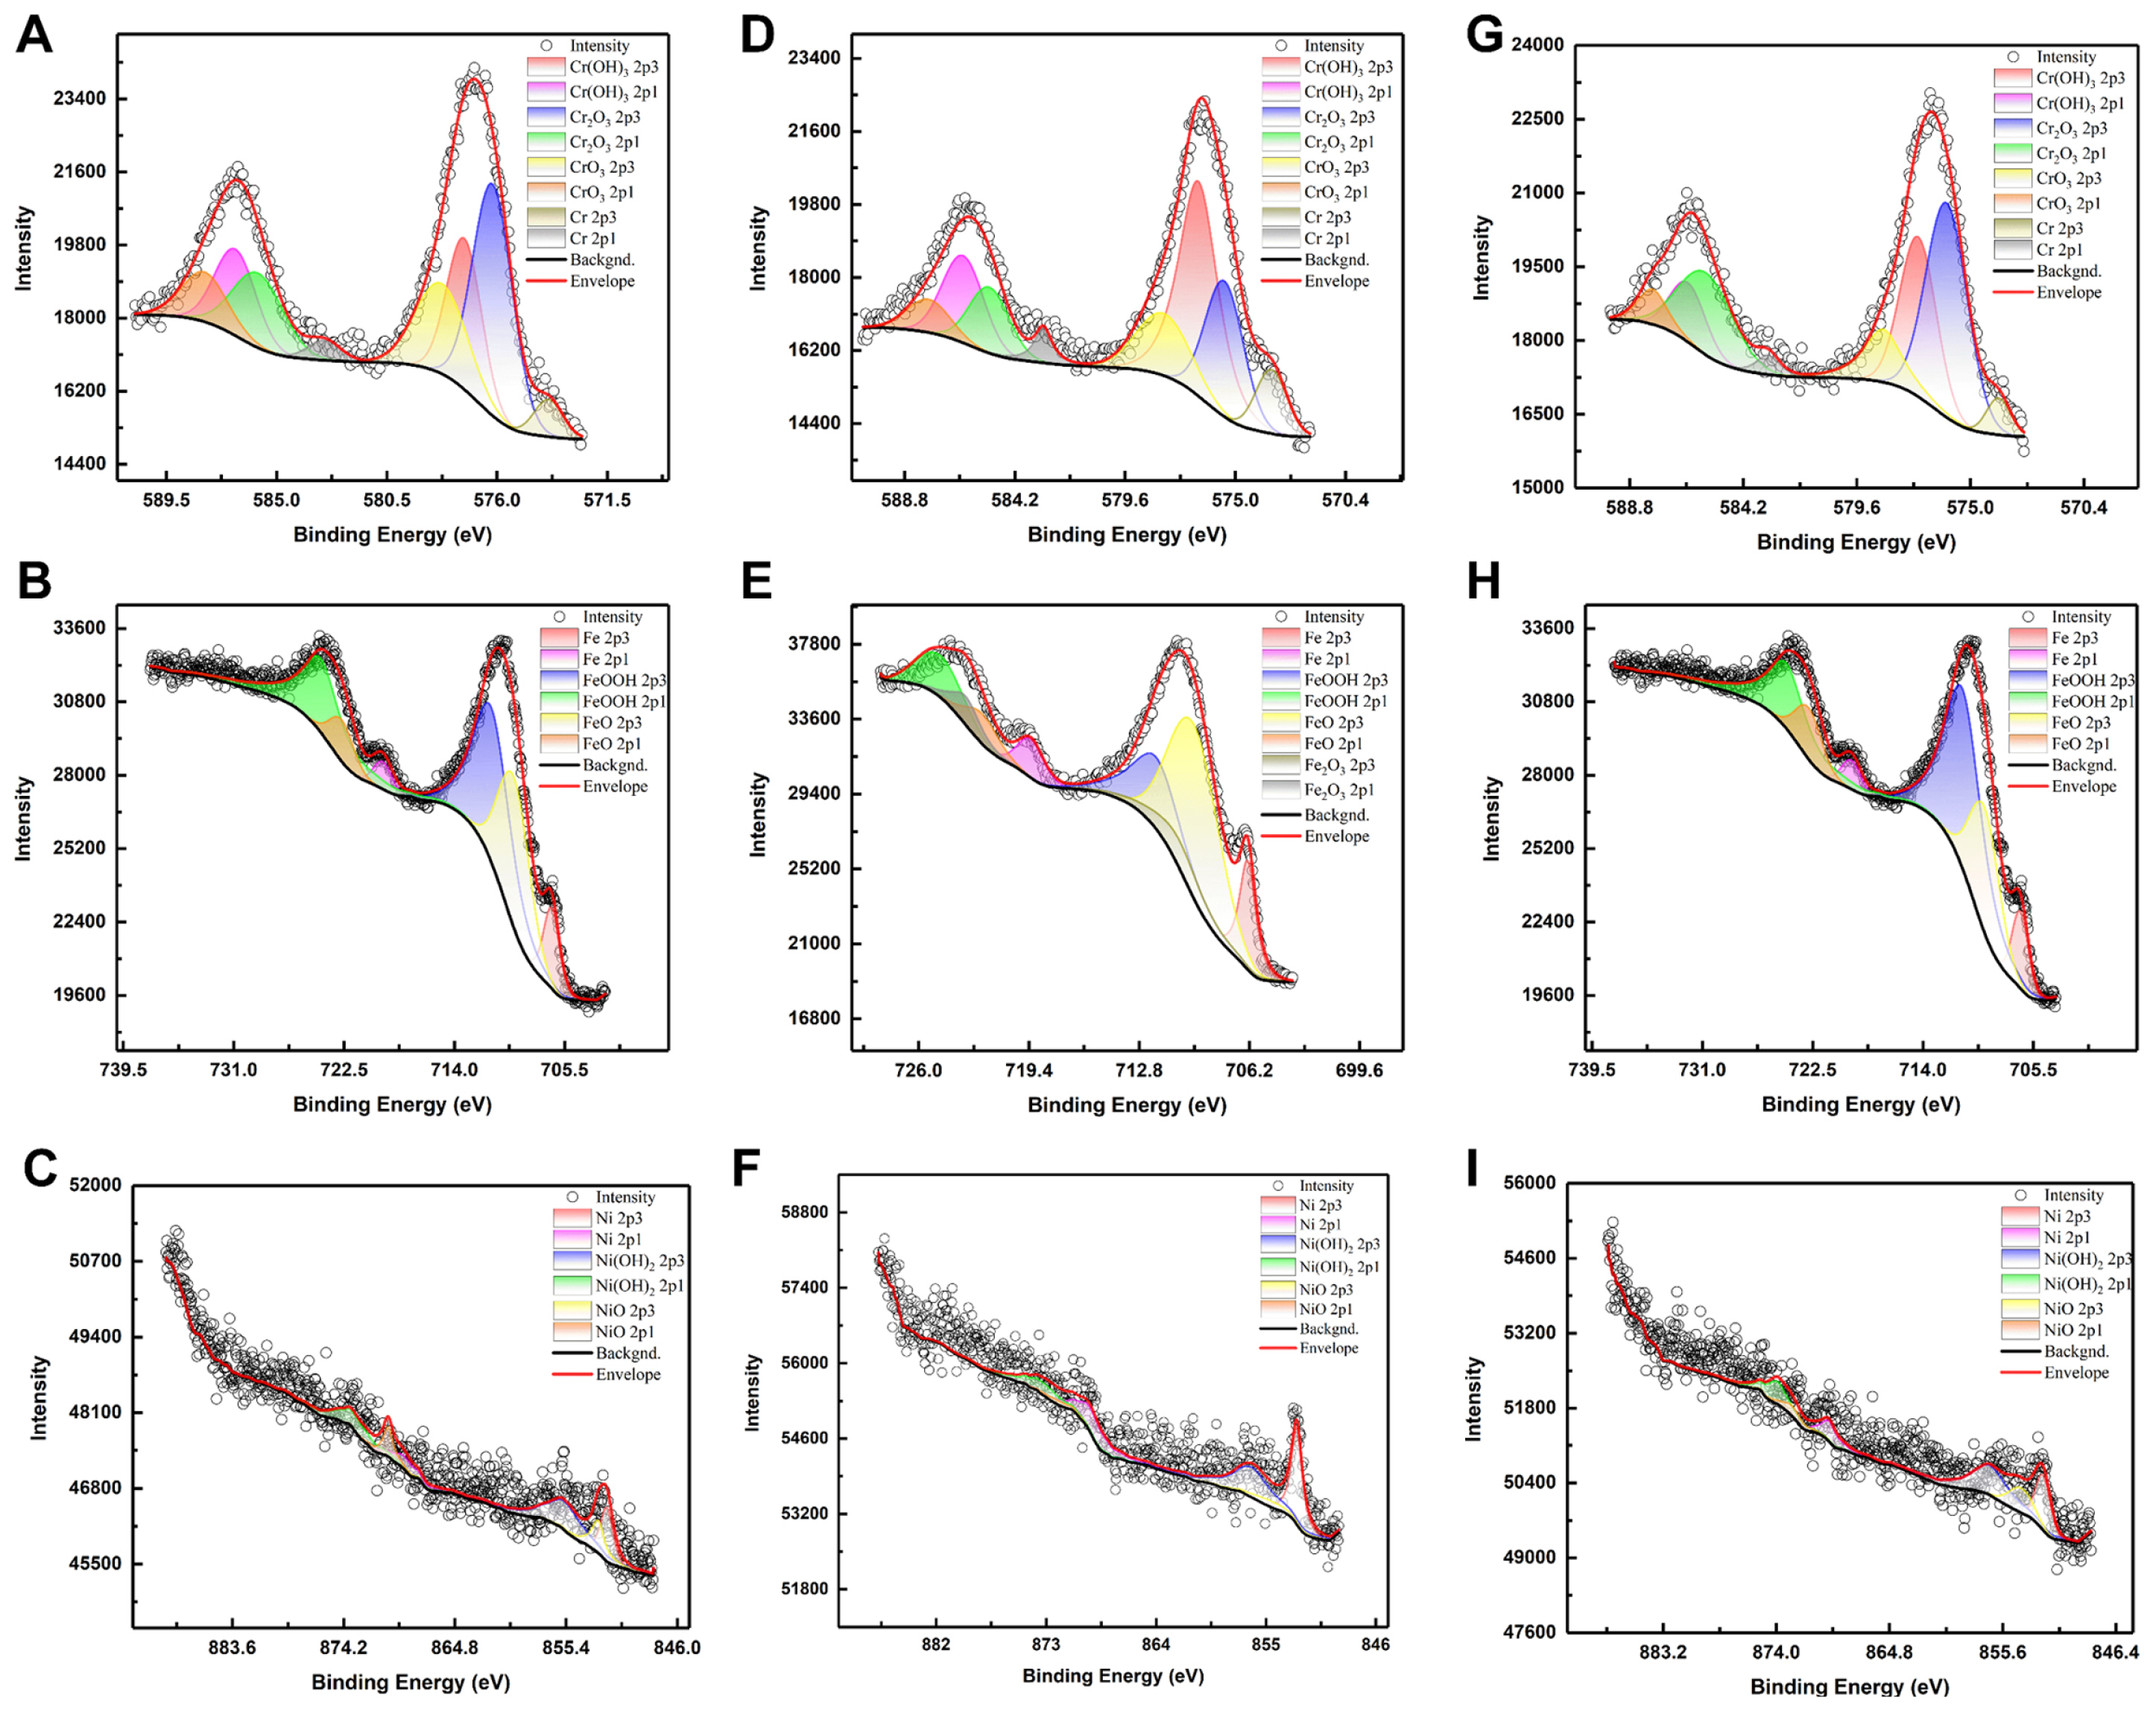
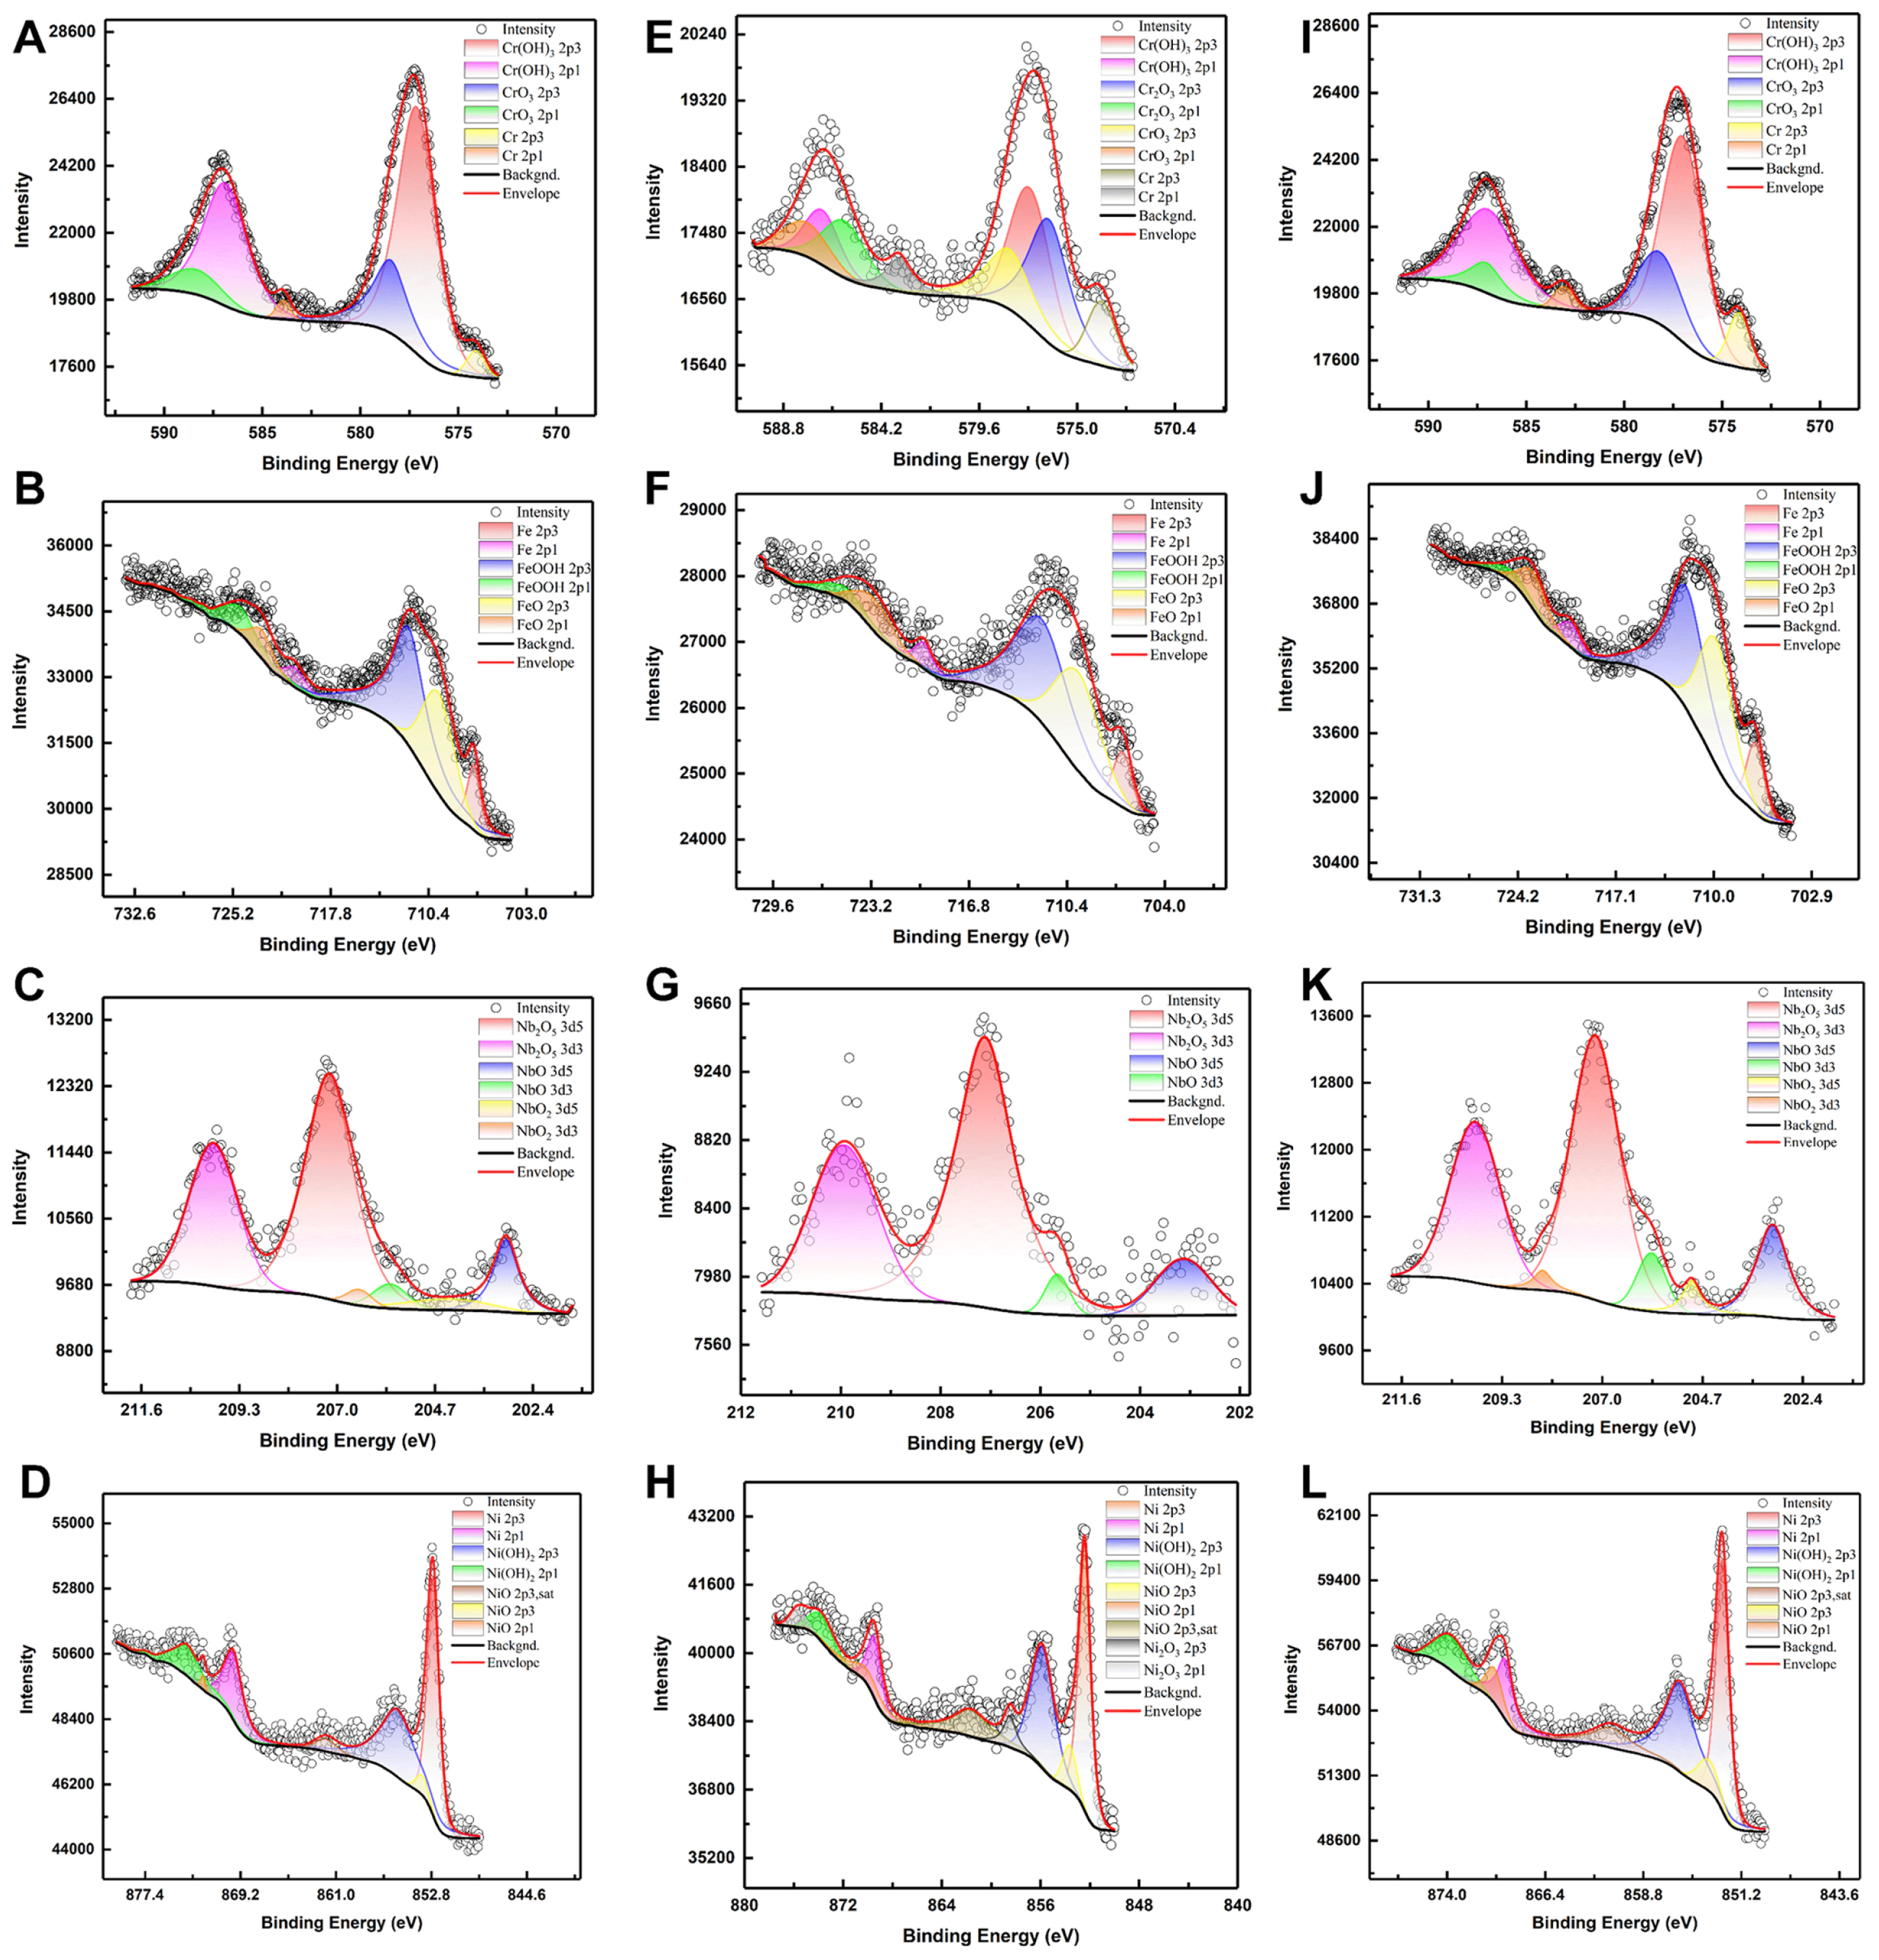
The passive film formed on the surface of matrix has a great influence on the properties of the mental-solution interface, which was revealed in the aforementioned CV measurements. XPS is a highly sensitive surface analysis technology that has a detection depth in the nanometer range, hence it is suitable for testing the compositions and content of the passive film. The samples were subjected to OCP test for 2 h before XPS, so as to generate a stable passive film structure on their surface. The survey XPS spectra of the three set groups of the two alloys (Fig. 4) show that C 1s, O 1s, Ni 2p, Fe 2p, Mn 2p, Cr 2p peaks were observed for SS304, while C 1s, O 1s, Ni 2p, Fe 2p, Nb 3d, Cr 2p peaks were observed for IN718. The peak positions are the same for each element in different groups. The results indicate that the elements present in the passive film of the same alloy are basically the same, even under different temperature and concentration conditions. In the Cr 2p spectra of the different groups of SS304 (Fig. 5A,D,G), the peaks at binding energies (BEs) of 576.90┬▒0.40 eV and 586.55┬▒0.15 eV correspond to the Cr(OH)3 2p3/2 and Cr(OH)3 2p1/2 spin-orbit splitting peaks, respectively. The peaks of Cr2O3 2p3/2 and Cr2O3 2p1/2 are observed at BEs of 575.82┬▒0.36 eV and 585.51┬▒0.25 eV and those of CrO3 2p3/2 and 2p1/2 at BEs of 578.26┬▒0.27 eV and 587.87┬▒0.07 eV. The Cr 2p spectra of SS304 can also be deconvoluted into elemental Cr at BEs of 573.69┬▒0.19eV and 583.10┬▒0.09 eV. The Fe 2p spectra of the three groups of SS304 samples consist of three identical sets of orbital splitting peaks (Fig. 5B,E,H): FeOOH 2p3/2 and 2p1/2 at BEs of 711.34┬▒0.42 eV and 724.50┬▒0.22 eV, FeO 2p3/2 and 2p1/2 at BEs of 709.38┬▒0.14 eV and 722.50┬▒0.30 eV, and Fe 2p3/2 and 2p1/2 at BEs of 706.41┬▒0.10 eV and 719.42┬▒0.13 eV, respectively. The Fe 2p spectrum of G2 can be deconvoluted into Fe2O3 component at BEs of 710.31 eV and 723.16 eV correspond to the two spilt peaks respectively (Fig. 5E). The orbital splitting peaks of metallic Ni 2p3/2 and 2p1/2 at BEs of 852.23┬▒0.35 eV and 869.35┬▒0.35 eV make up the Ni spectrum of SS304 (Fig. 5C,F,I), together with Ni(OH)2 2p3/2 and 2p1/2 peaks at BEs of 856.09┬▒ 0.54 eV and 873.64┬▒0.30 eV and NiO 2p3/2 and 2p1/2 at BEs of 853.7┬▒1.2 eV and 871.57┬▒1.3 eV, respectively.
For IN718, the Cr spectra of all groups can be deconvoluted into the three same components: Cr(OH)3 with peak positions at 577.17┬▒0.05 eV and 586.93┬▒0.05eV, Cr with peak positions at 573.99┬▒0.16 eV and 583.49┬▒0.42 eV and CrO3 peaks at 578.31┬▒0.14 eV and 587.72┬▒0.69 eV, while peaks for Cr2O3 are observed for G2 at BEs of 576.32 eV and 585.94 eV (Fig. 6A, E, I). The Fe spectra feature peaks for three components: FeOOH 2p3/2 and 2p1/2 at BEs of 711.97┬▒0.05 eV and 724.74┬▒0.21 eV, FeO 2p3/2 and 2p1/2 at BEs of 709.72┬▒0.08 eV and 723.02┬▒0.06 eV, and Fe 2p3/2 and 2p1/2 at BEs of 706.87┬▒0.12 eV and 720.14┬▒0.39eV (Fig. 6B,F,J), respectively. The Nb 3d spectra show that this element has three valence states in the two ambient temperature groups G1 and G3, but only two valence states in the low temperature group G2 (Fig. 6C,G,K). Ni spectra reveal that the Ni element in the surface of IN718 exhibits almost the same valence states as that of SS304 (Fig. 6D,H,L). The peaks of Ni are located at 852.55┬▒0.13 eV and 869.65┬▒0.18 eV, those of Ni(OH)2 are located at 855.84┬▒0.14 eV and 873.71┬▒0.08 eV, and those of NiO at BEs of 853.66┬▒0.06 eV and 870.30┬▒0.41 eV, respectively. Satellite peaks of NiO 2p1/2 can also be observed. Moreover, the Ni2O3 peaks of G2 are observed at BEs of 858.48eV and 875.69 eV.
The relative oxide contents of the surface passive films of SS304 and IN718 are listed in Table 2 and 3, respectively. For SS304, the content of the passive film components of the two groups at ambient temperature in G1 and G3 are similar. However, the total amount of hydroxide decreased and the amount of oxide increased in G2. The increase in the amount of FeO and the appearance of Fe2O3 indicate the intensification of passivation. In a cryogenic environment, the outer layer hydroxide tends to dehydrate to form the corresponding oxide, and the passive film may thus become denser [27,28]. Moreover, it is obvious that the proportion of FeO increases in the passive film while that of Cr2O3 decreases at ŌłÆ10┬░C. This change may potentially lead to general corrosion rather than pitting corrosion, and it may contribute to a finer surface after ECM. A similar situation occurred for IN718. The elements in the passive film of IN718 have more valence states in G2. Meanwhile, there was a greater amount of oxides of chromium at low temperature, which may be due to the dehydration of the external hydroxides. The oxide layer of chromium plays a key role in the corrosion resistance of the material, which shows that the passive film on the surface of IN718 in a cryogenic environment is more conducive to protecting the matrix [29ŌĆō31]. Meanwhile, the content of NiO also increases at low temperature. This may further improve the final surface quality due to the occurrence of general corrosion. Of course, this also depends on the degree of pitting caused by the increase in Cr2O3 at low temperature.
The shift of oxides content in the passive film can explain parts of the electrochemical test results, especially those related to the properties of the passive film. OCP of SS304 in G2 is significantly smaller than that in G3, even if the conductivity of the solution environment is equivalent. However, the OCP of IN718 in G2 is the biggest among the three groups. These all attribute to the various of Cr2O3 contents when the temperature changes. In other words, a higher Cr2O3 content can improve the stability of the passive film. This is also the reason why a larger pitting current appears in the passive range of during polarization of SS304, which did not occur in IN718 (Fig. 2C,D).
3.5 Electrochemical Impedance Spectrum (EIS) measurements
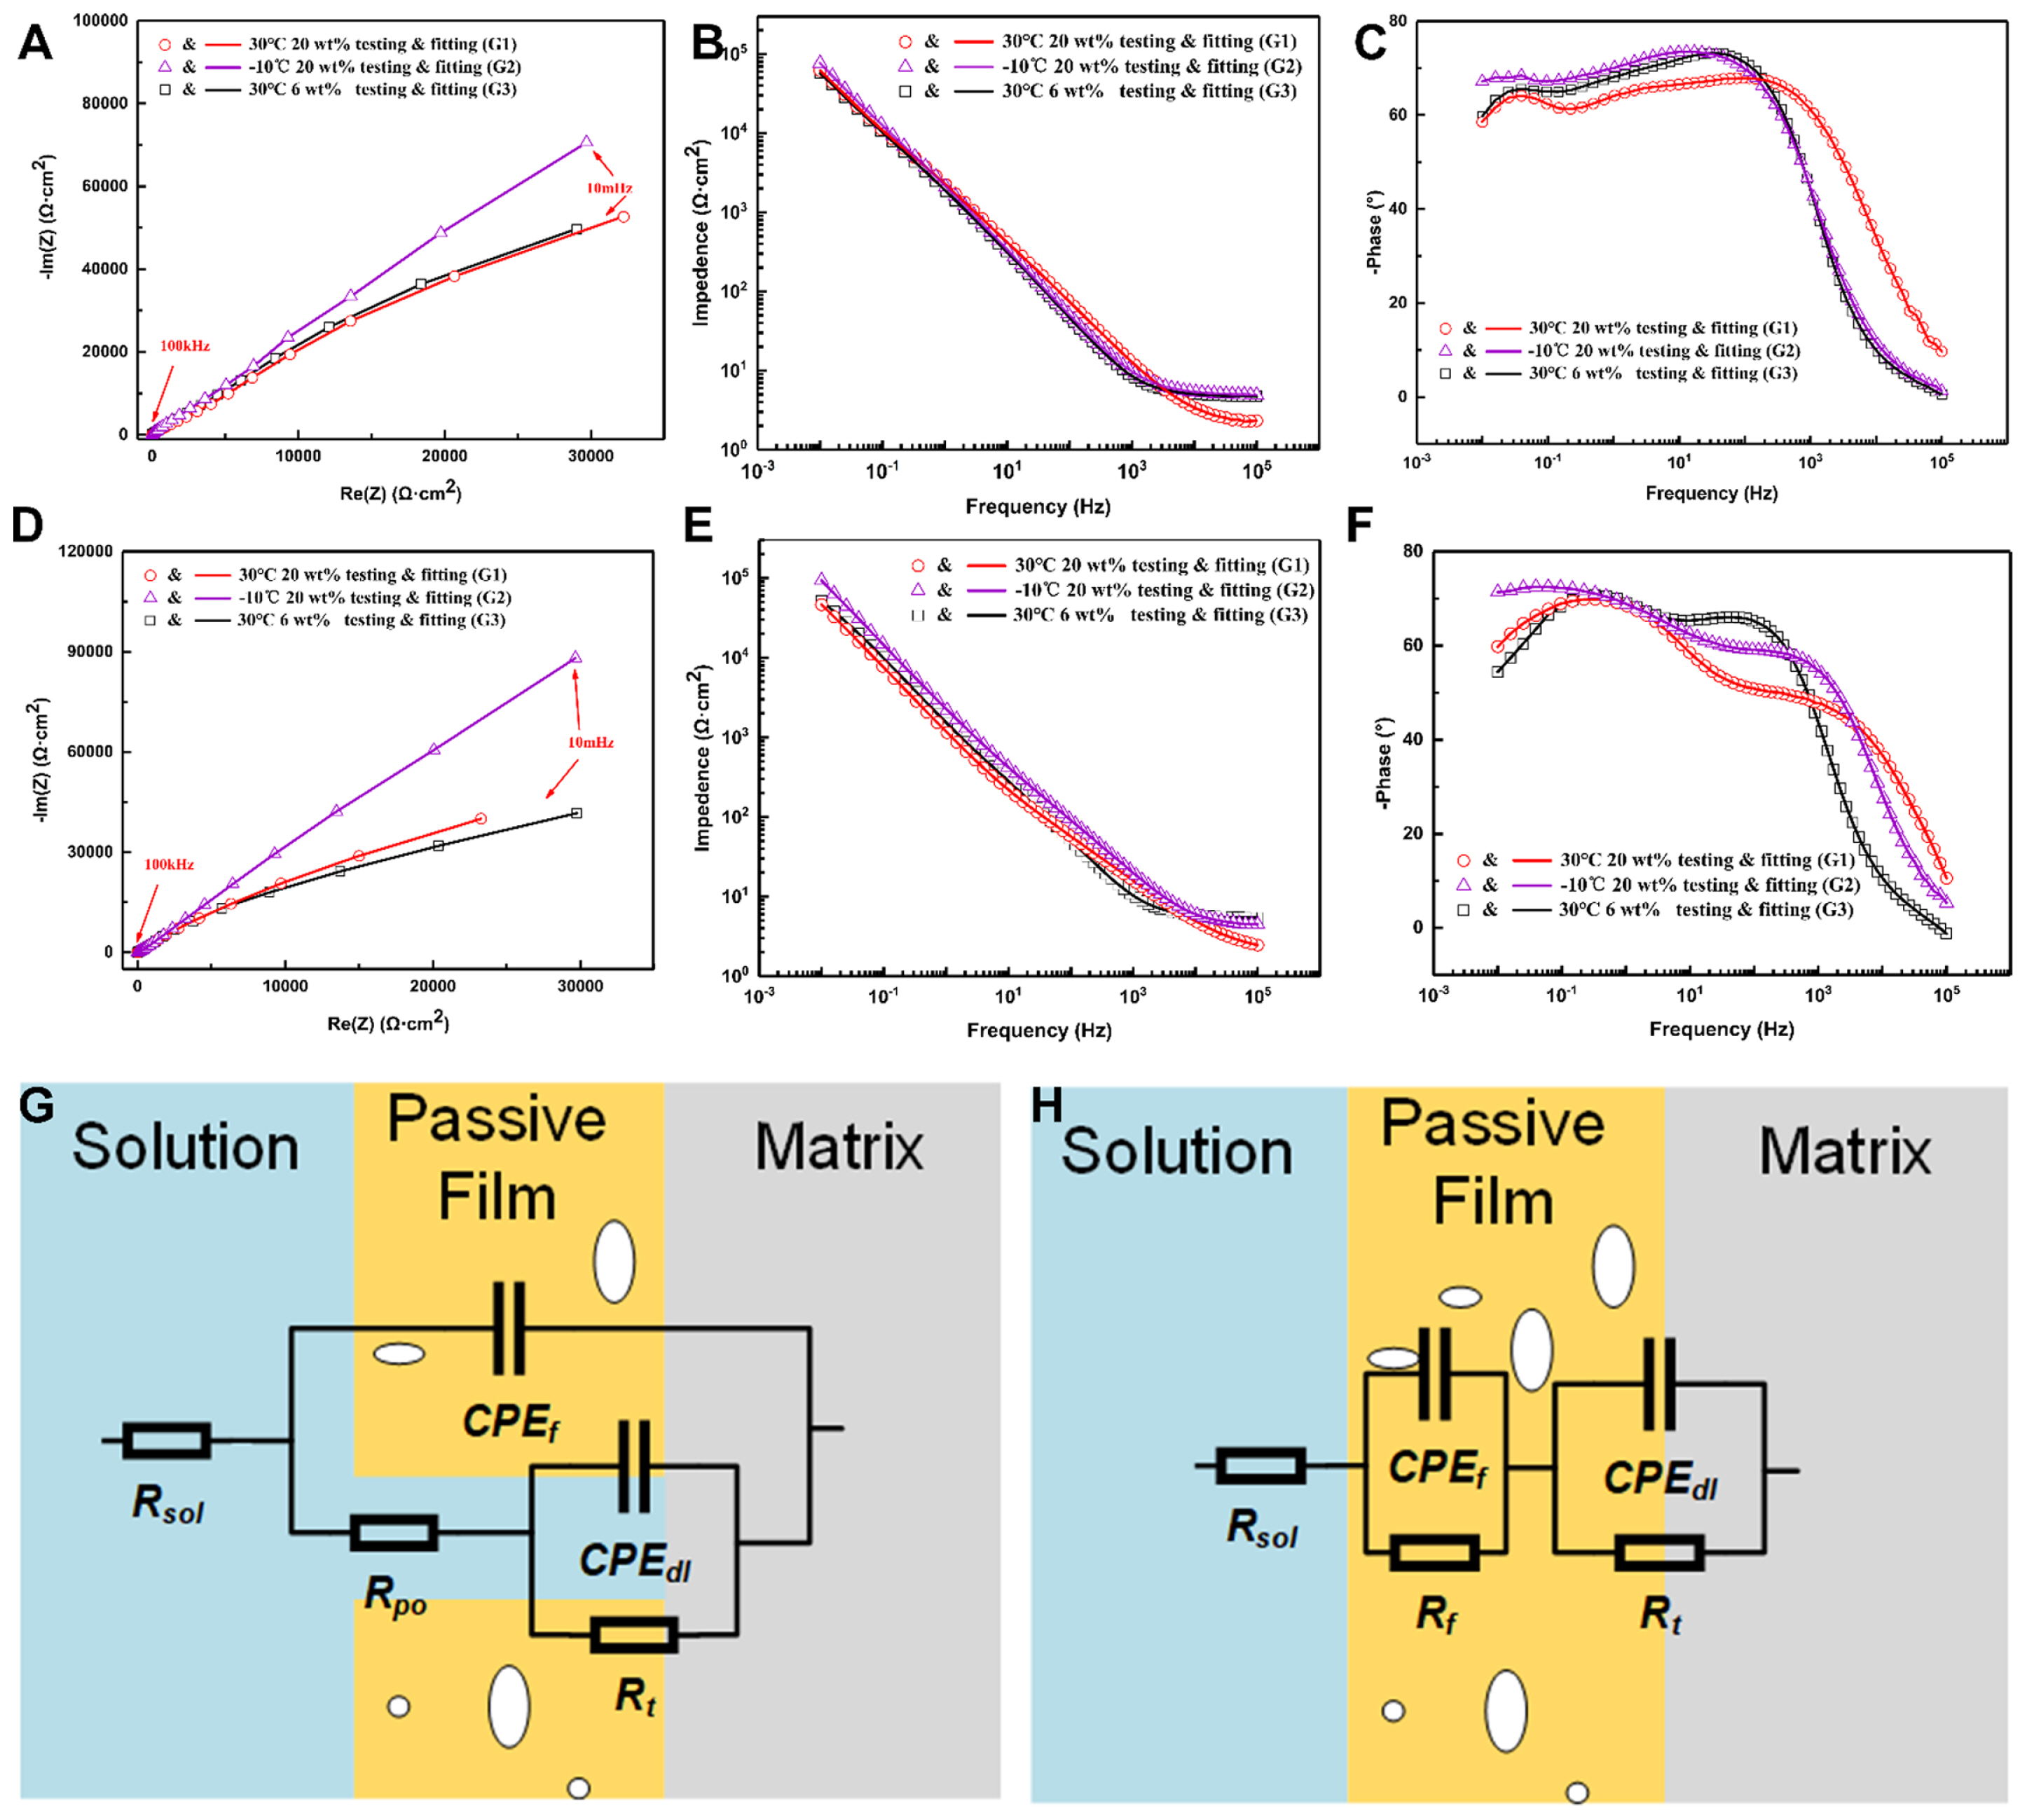
EIS is a powerful technique that is used to determine the electrochemical structure of an interface. After studying the structural composition of the passive films of the alloys, the characteristics of metal-passive film-solution interface were studied by EIS. Prior to conducting the EIS measurements, a negative potential of ŌłÆ1.5 V was applied to the samples for 1 min, followed by 2 h OCP testing. The test potential was set at the OCP of the sample at a specific temperature. The amplitude of the applied AC potential signal was 5 mV and the frequency was varied from 10 mHz to 100 kHz. A fitting study was conducted after the measurements by utilizing the Zview software, with the results being in good agreement with the recorded measurements (Fig. 7AŌĆōF). The overall impedance of both alloys in the low-frequency region, i.e., the Faraday impedance, at ŌłÆ10┬░C is much higher than that at 30┬░C (Fig. 7A,D), related to the stronger passivation observed in a cryogenic solution. The phase diagrams of the two alloys exhibit two obvious peaks, i.e., double time constants (Fig. 7C,F). The low-frequency phase angle maxima at ŌĆō 10┬░C is higher than that at 30┬░C, which indicates that the material is more difficult to corrosion at low temperature [11].
On the basis of fitting, the equivalent circuit (EC) model of the interface was studied (Fig. 7G,H). The EC models of the three groups of SS304 are almost the same, with the values of the components listed in Table 4. Rsol represents the resistance of solution, Rt represents the charge transfer resistance, Rpo represents the electrolyte resistance inside the pores [32,33]. CPE is constant phase element, which is expressed as follows:
where Q is the CPE constant, n is the dispersion index constant. CPEdl represents the constant phase element of double layer, CPEf represents the constant phase element of the passive film. This model indicates that the passive film has a porous structure. The Rt value of G2 is greater than that of G1, but lower than that of G3, consistent with the OCP results. Moreover, the RPO value of G2 is much greater than those of G1 and G3. In addition, ndl value of G2 equals to 1, i.e., the CPE between the passive film and solution transfer to pure capacitance. These phenomena clearly show that with a decrease in temperature, the passive film on the surface of SS304 is modified. The pore structure on the film shrinks, the film itself becomes denser, and the capacitance characteristics become more prominent.
The EC model of IN718 exhibits a set of tandem structures, with the values of the components listed in Table 3. Rsol, Rt, CPEf, CPEdl are defined as aforementioned and Rf represents the resistance of the passive film [11]. The Rt value of G2 is greater than those of G1 and G3, which is also consistent with the OCP results. The EC model of G2 does not have the element Rf. In other words, the passive film behaves like a capacitor under cryogenic conditions. Different from the results of SS304, the passive film structure of the IN718 alloy only allows electrons to participate in charge and discharge, prohibiting the penetration of ions, that is, its semiconducting properties are suppressed in a cryogenic environment. Such a structure may be beneficial for improving the localization of ECM.
The results of EIS fitting can be calculated and analyzed to quantify the impact of low temperature on the thickness of the passive film [32]. The thickness of the passive film can be calculated separately from the capacitance and resistance. The formula for calculating from capacitive is as follows:
where ╔ø0 is the permittivity of the vacuum and has a value of 8.85 ├Ś 10ŌłÆ12 F/m, ╔ø is the relative permittivity and is related to the temperature. ╔ø of water decreases with increasing temperature [34], and has the value of 88 at 0┬░C and 76.58 at 30┬░C. The data at ŌłÆ10┬░C is missing but should be greater than 88, but the calculation still uses the value of 88 at ŌłÆ10┬░C.
The formula for calculating from resistance is as follows:
where Žü is the specific resistivity of the passive film. Although the Rpo in results of SS304 does not represent the passive film resistance, the above formula can still be used for calculation. At this point, Žü represents the solution resistivity, and A represents the pore area. The calculation results exhibits that the passive film of IN718 thickens when the temperature drops. Although the result of SS304 calculated by formula (6) shows that the thickness at ŌłÆ10┬░C is slightly smaller than that at 30┬░C, the result calculated by formula (5) still indicates that SS304 obtain a thicker passive film at low temperature.
Moreover, the charge transfer resistance value Rt of SS304 in G2 is smaller than that in G3, which have the same solution conductivity. While that of IN718 exhibits the opposite trend. According to the results of XPS, these phenomena can be attributed to changes in the content of Cr2O3 when the temperature shifts. This also confirms the previous test results.
3.6 ECM experiments
After testing, ECM experiments were conducted on the flat surfaces of the two alloys. Prior to processing the samples, the electrolyte was fully circulated to ensure that it had reached the set temperature uniformly. Four different current densities (1 A/cm2, 10 A/cm2, 20 A/cm2, 30 A/cm2) were set to observe differences in the morphologies of the alloys. For the sake of consistency, the amount of charge passing through the two electrodes was set to be equal at each current density, that is, current (I)├Śtime (t) is a constant, with a value of 600 C.
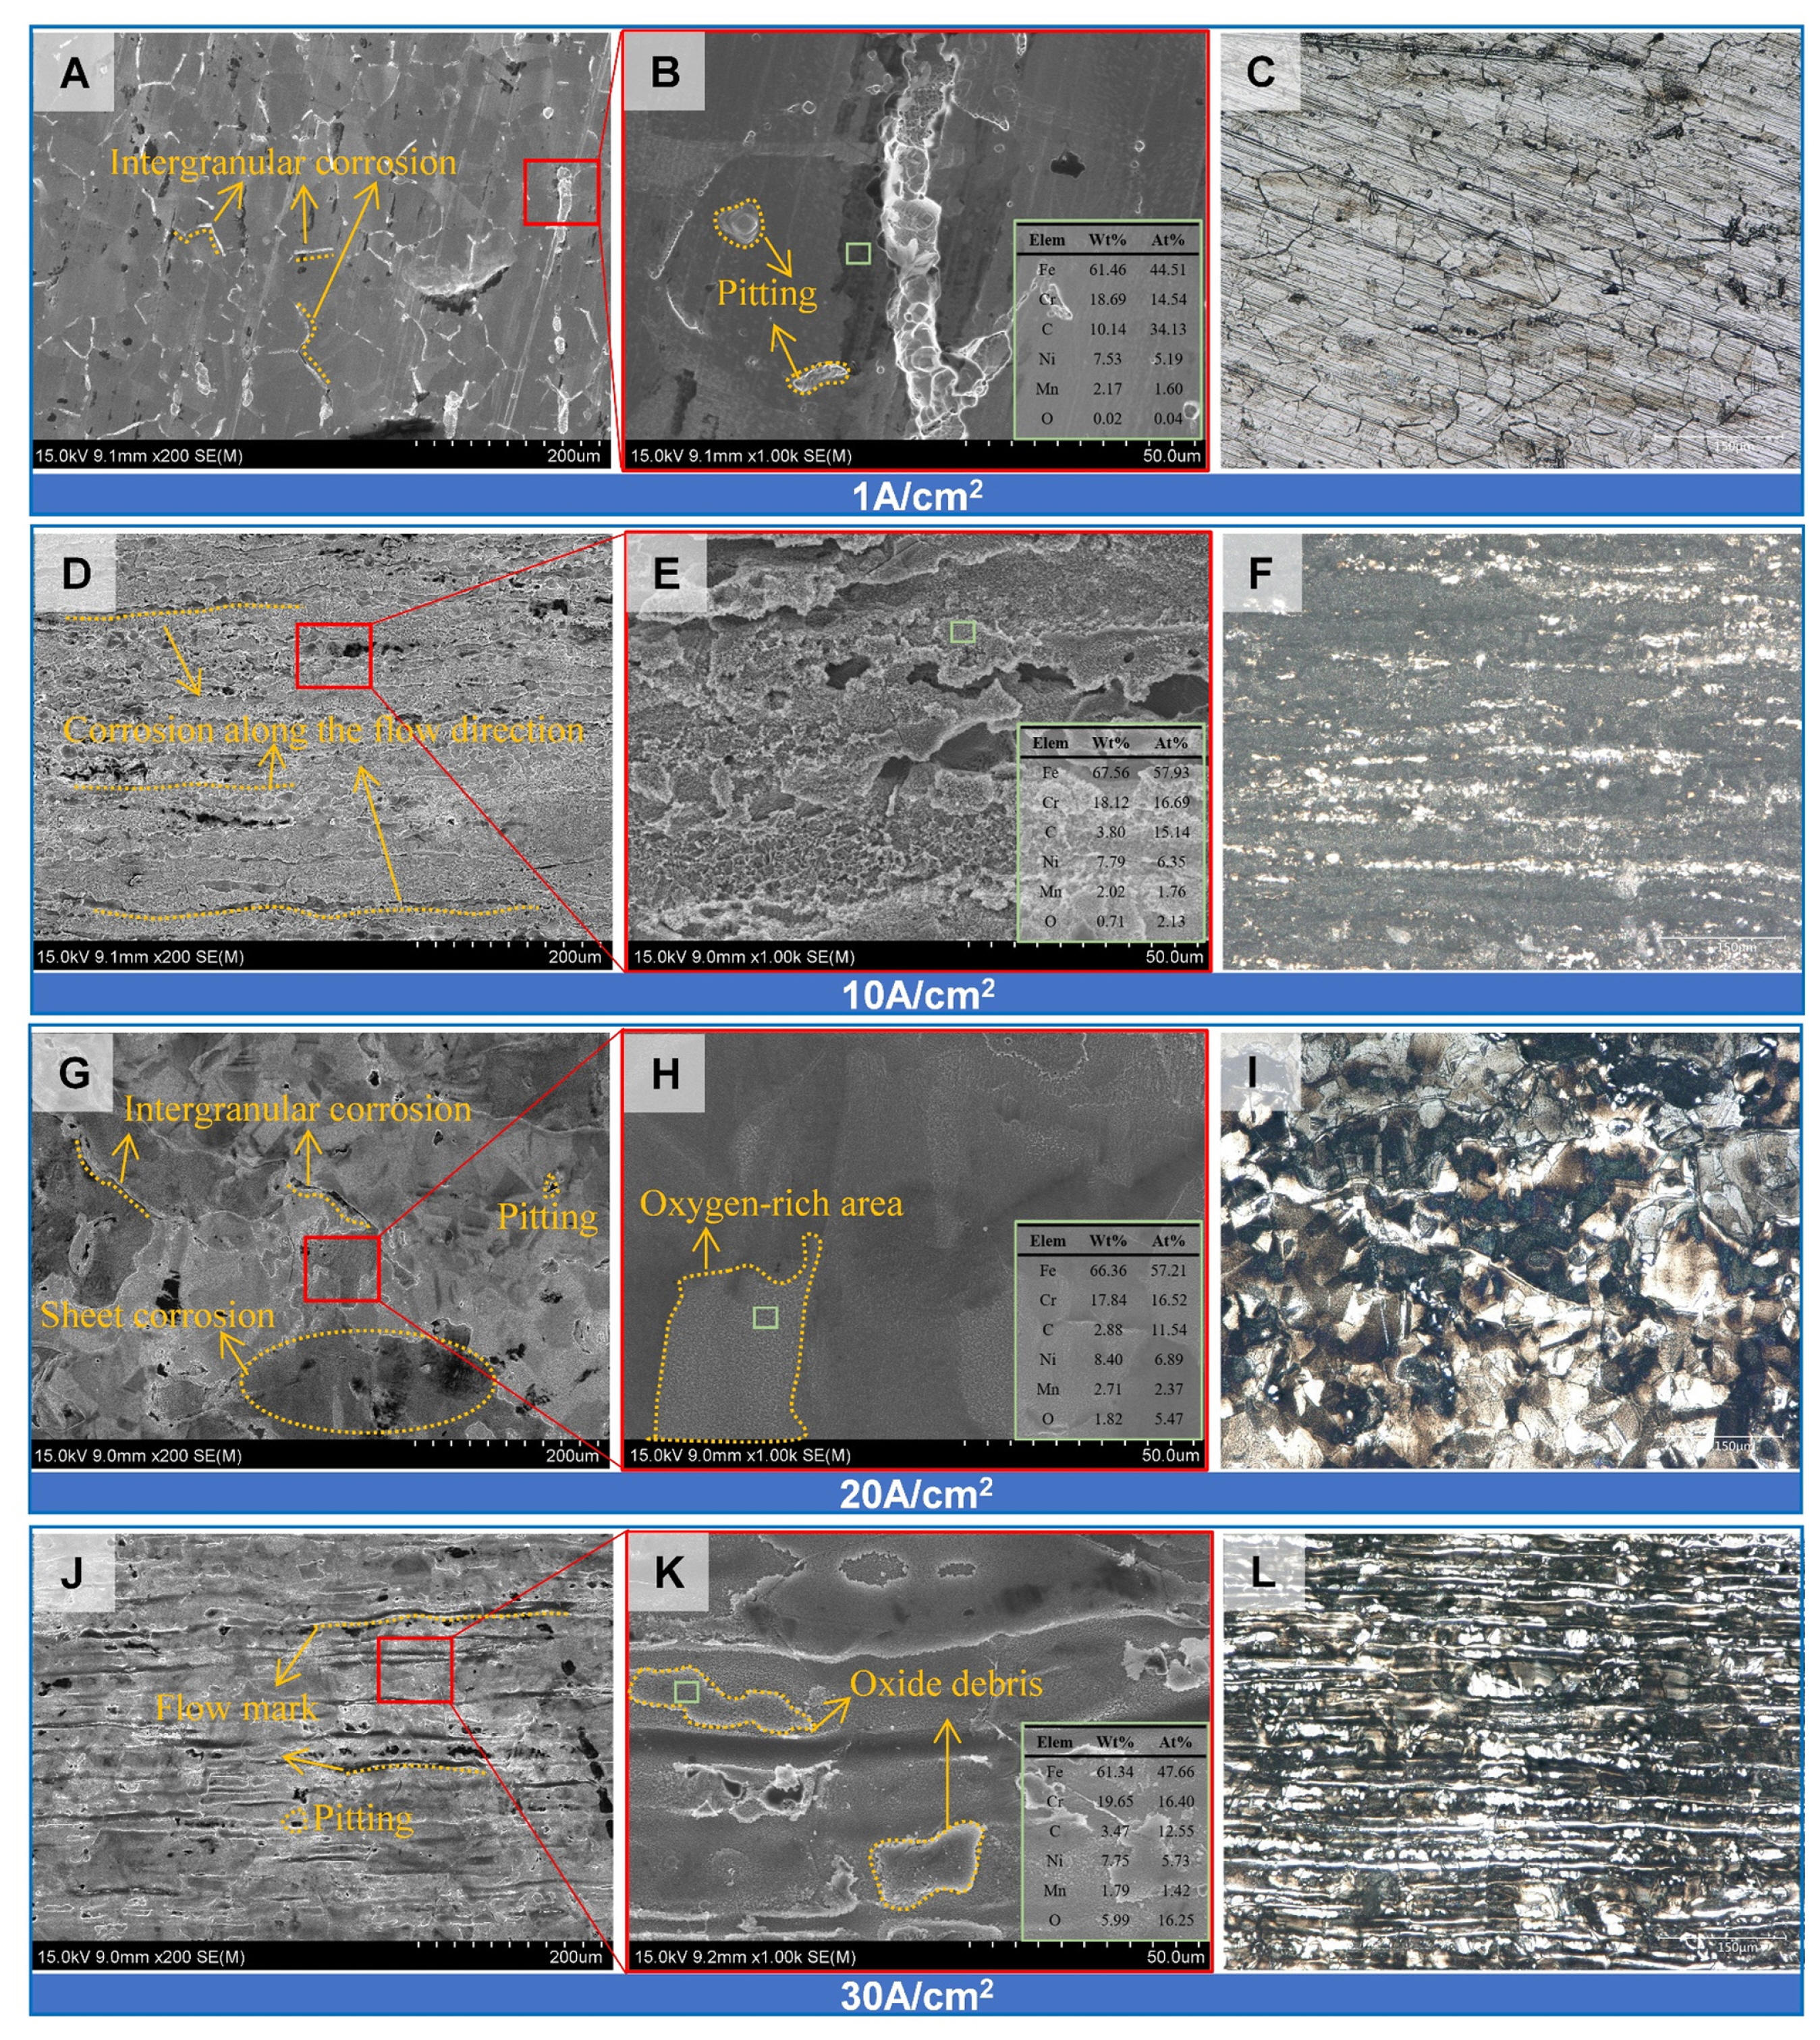
For SS304 in G1, the relatively high temperature and concentration maintained the processing under relatively harsh conditions (Fig. 8). When i=1 A/cm2, austenite grains were outlined by intergranular corrosion. Pitting corrosion was observed near to the intergranular corrosion, indicating the tendency for corrosion to occur in the next step (Fig. 8B). When i=10 A/cm2, the corrosion exhibited a certain directionality and tended to follow the direction of electrolyte flow (Fig. 8D). This is similar to the surface at i=30 A/cm2, but the latter exhibited more severe corrosion along the flow path, leaving flow mark defects (Fig. 8J). Regional dissolution was observed at i=20 A/cm2, along with flaky oxygen-rich regions (Fig. 8G,H). When the current density reached 30 A/ cm2, the oxygen-rich region was broken and the oxygen content increased, attributed to the stronger electrolytic effect and anodic oxygen evolution [35ŌĆō37]. Unlike surface of G1 at 1 A/cm2, there was no intergranular corrosion on the surface of G2 at low current density. Pitting occurred almost uniformly, with dense areas of pitting joining together to form groove-like structures. The protruding parts later corrode due to the high chromium content (Fig. 9A,B). The modified and denser passive film structure at low temperature conceals surface defects, allowing corrosion to occur uniformly on the surface, which is consistent with the above test conclusions. In a cryogenic environment, when the current density continues to increase, there are only some carbon-rich residues and adhered products on the surface, with no defects such as flow marks (Fig. 9E,H,K). An oxygen-rich region also exists, but the oxygen content is significantly reduced, which is related to the inhibition of the oxygen evolution process at low temperature [38]. However, at 30 A/cm2, the violent reaction that occurs results in a complicated flow field in the gap, with some protrusions being observed on the surface of the alloy (Fig. 9L). Although the conductivity is the same, G3 exhibits a completely different surface morphology from that of G2 (Fig. 10). At low current densities (1 A/cm2), the surface is dominated by random pitting (Fig. 10A,B). When the current density increases to 10 A/cm2 or higher, the surface of the alloy is corroded almost all along the flow direction, with the appearance of different degrees of flow mark defects (Fig. 10DŌĆōL). With an increase in current density, the protruding parts between the corrosion grooves are accelerated to dissolve, and the corrosion sites are connected into pieces by points, which gradually makes the surface tend to be flat (Fig. 10E,H,K). It can be seen from the above results that the temperature has a definite effect on the morphology of SS304. The passive film modification and oxygen evolution inhibition effect brought about by low temperature makes the final appearance of the alloy smooth and clean. The greater degree of general corrosion caused by the shift in oxide content in the passive film is also the reason for the better surface quality at low temperature.
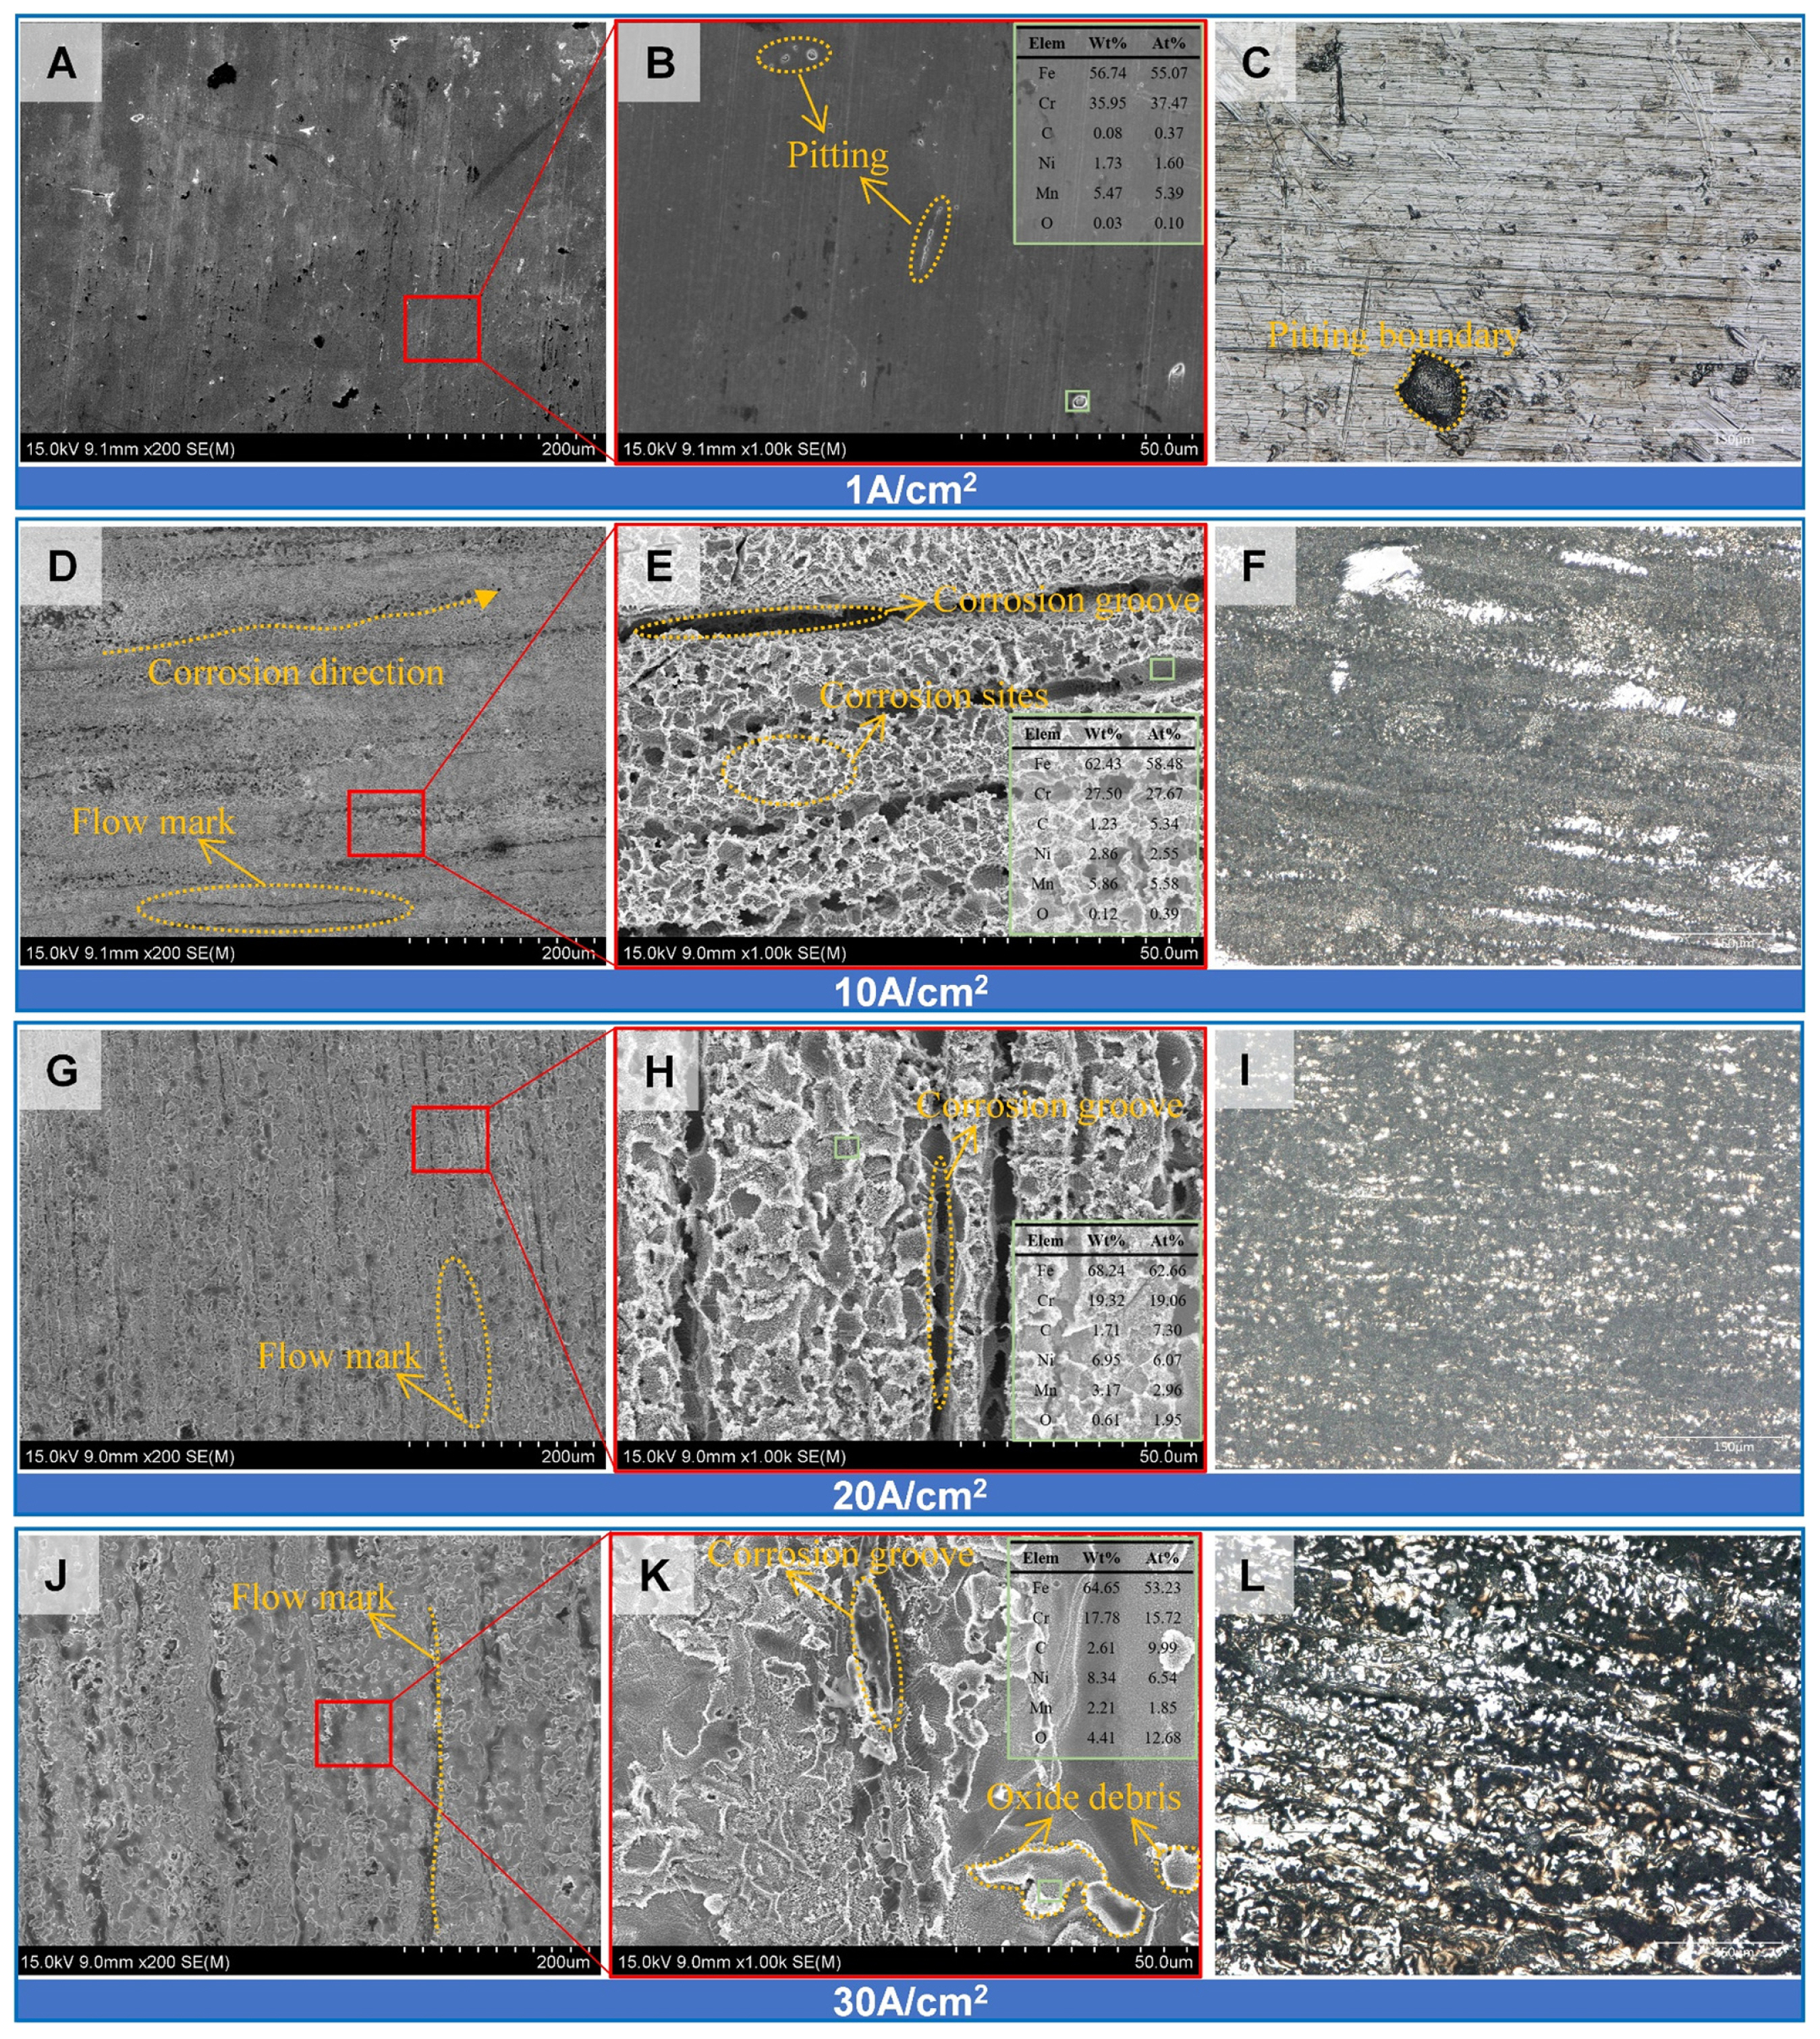
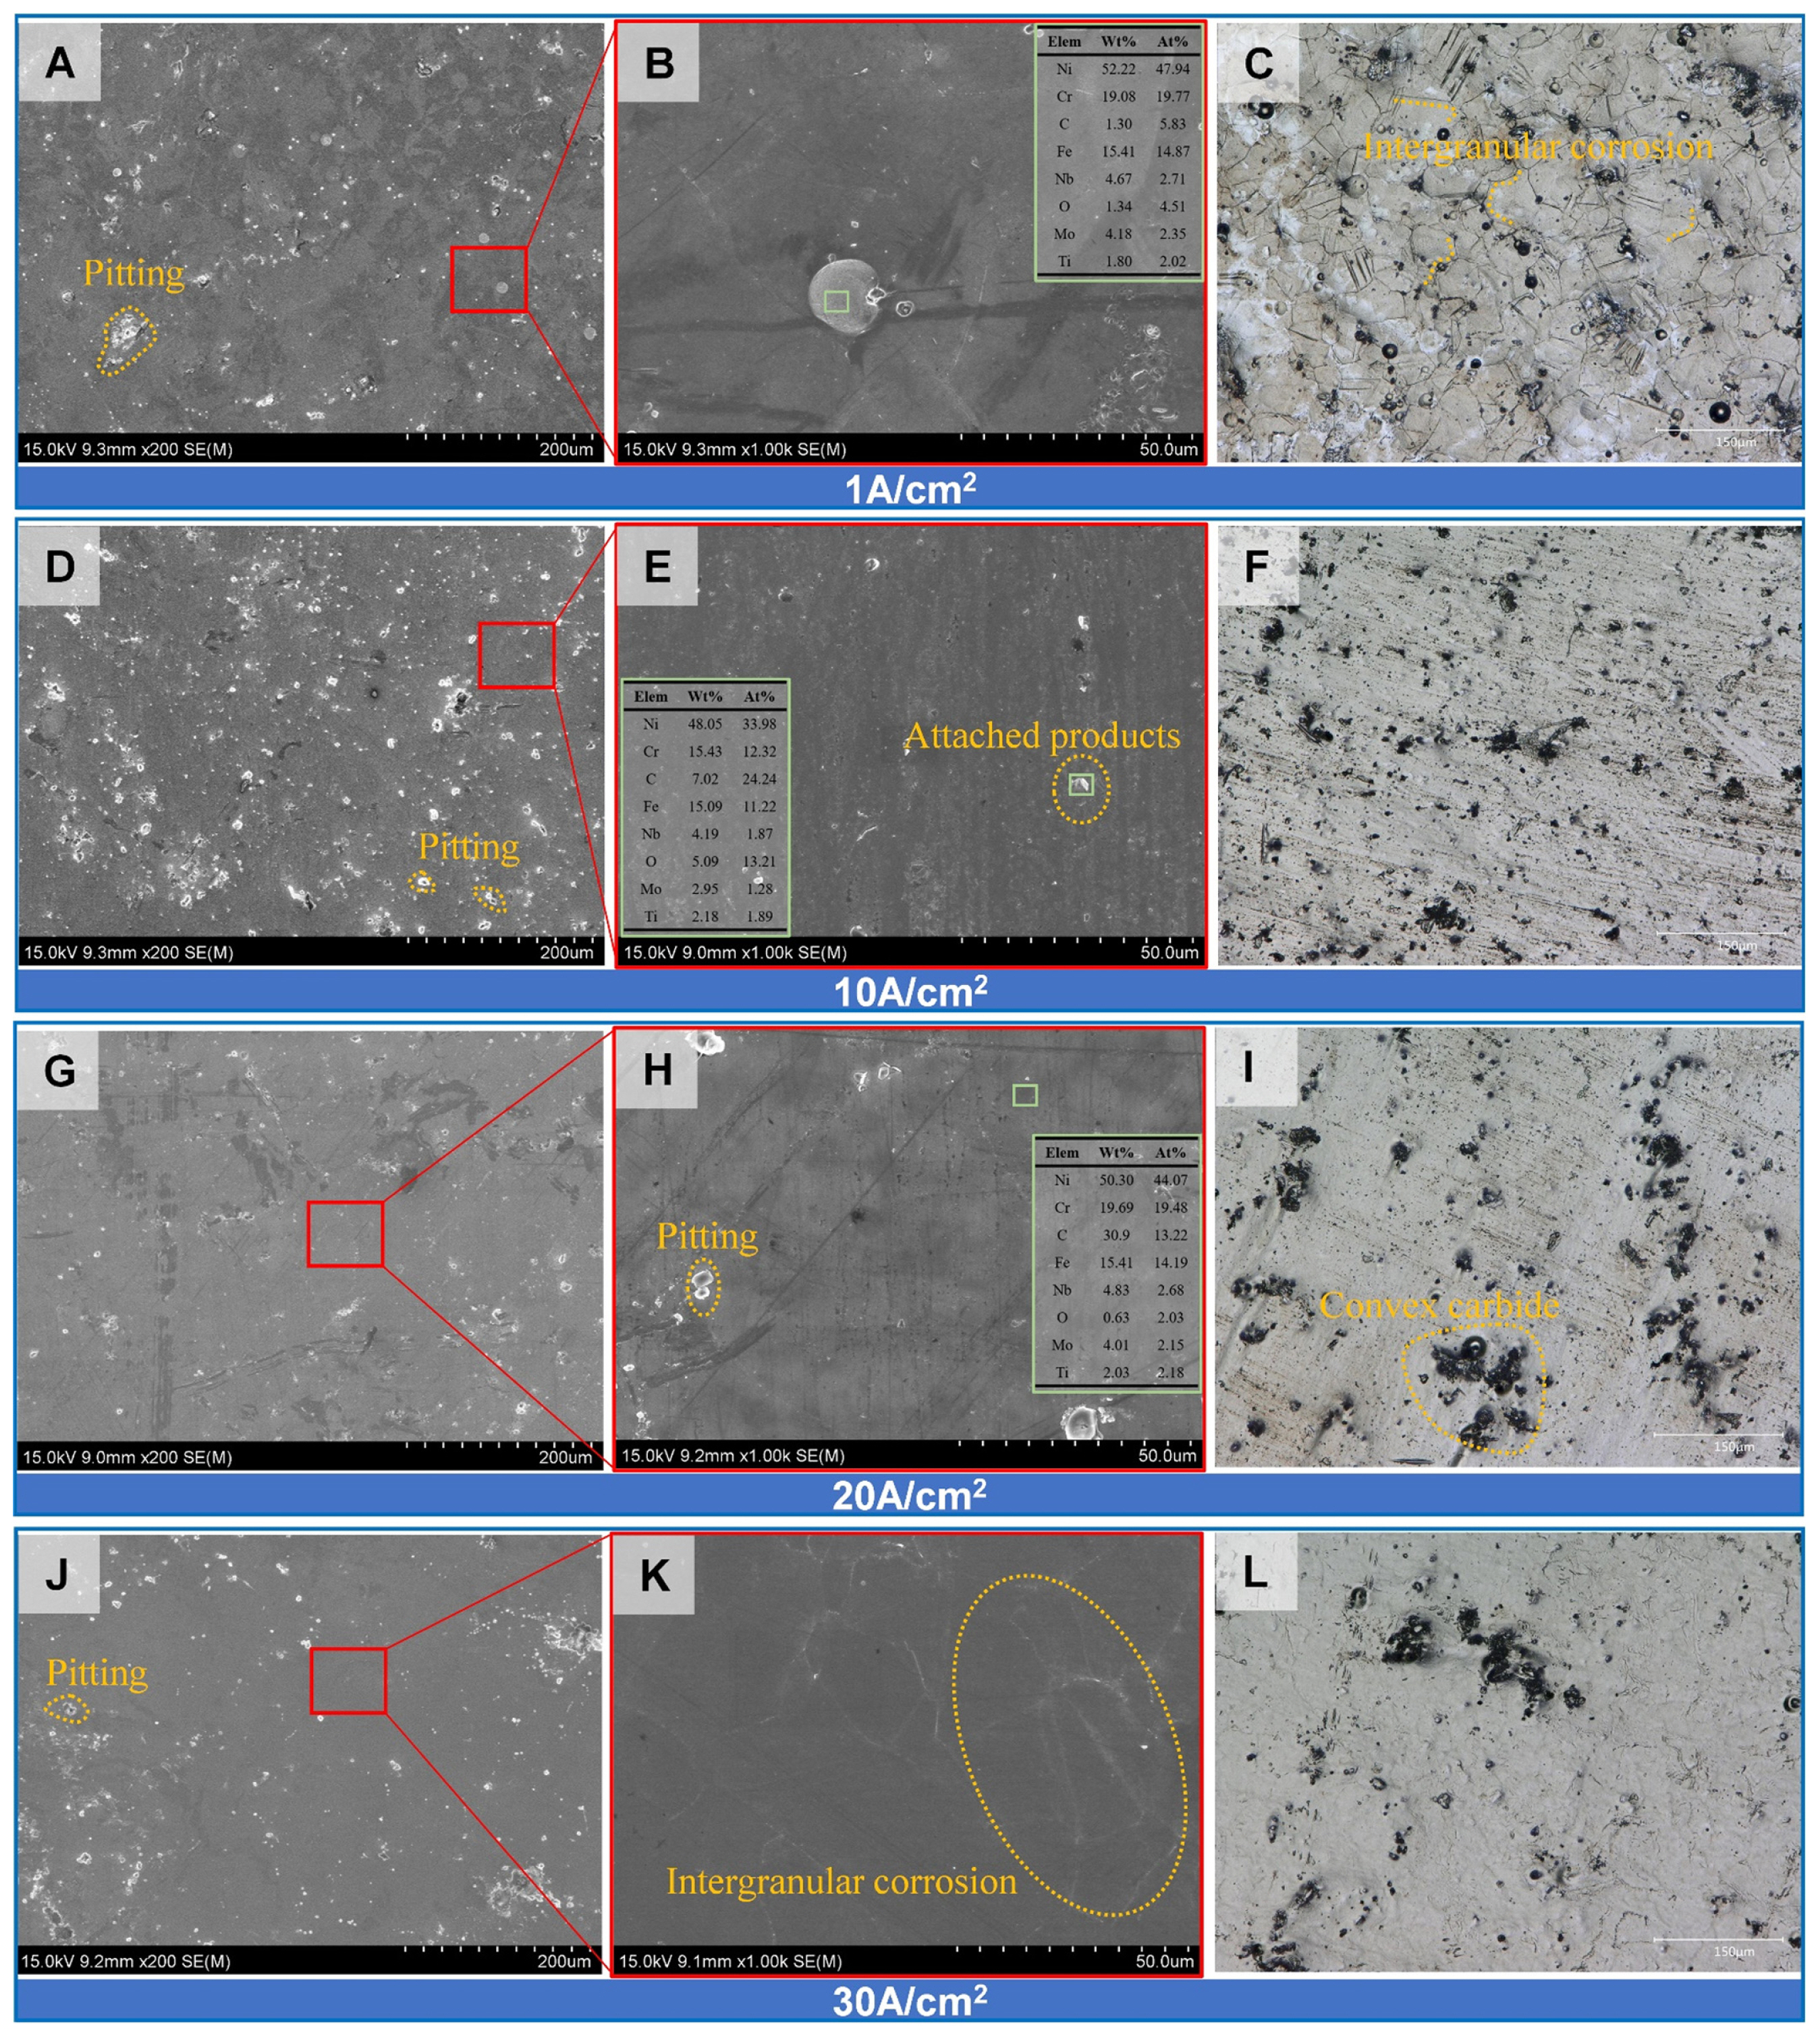
In the case of IN718, the surface morphologies of the three experimental groups at different current densities are not much different (Fig. 11,ŌĆō13). In G1 and G3, the OM images of surface exhibit oxidative discoloration at 1 A/cm2, which was not observed in G2 (Fig. 11C, 12C, 13C), attributed to the inhibition of oxygen evolution by the low temperature as mentioned earlier. Pitting and intergranular corrosion can be observed at various current densities in G1 and G3. Aside from the very shallow intergranular corrosion observed at 30 A/cm2, there is basically only pitting corrosion after I > 1 A/cm2 in G2 (Fig. 12). Carbide agglomerations and bulges are present on almost all surfaces. Under cryogenic conditions, the inhibition of uneven dissolution, such as intergranular corrosion, makes the surface morphology smoother, attributed to the low-temperature modification of the passive film. The better surface quality at low temperature reveals that the enhanced general corrosion caused by the increase of NiO is predominant.
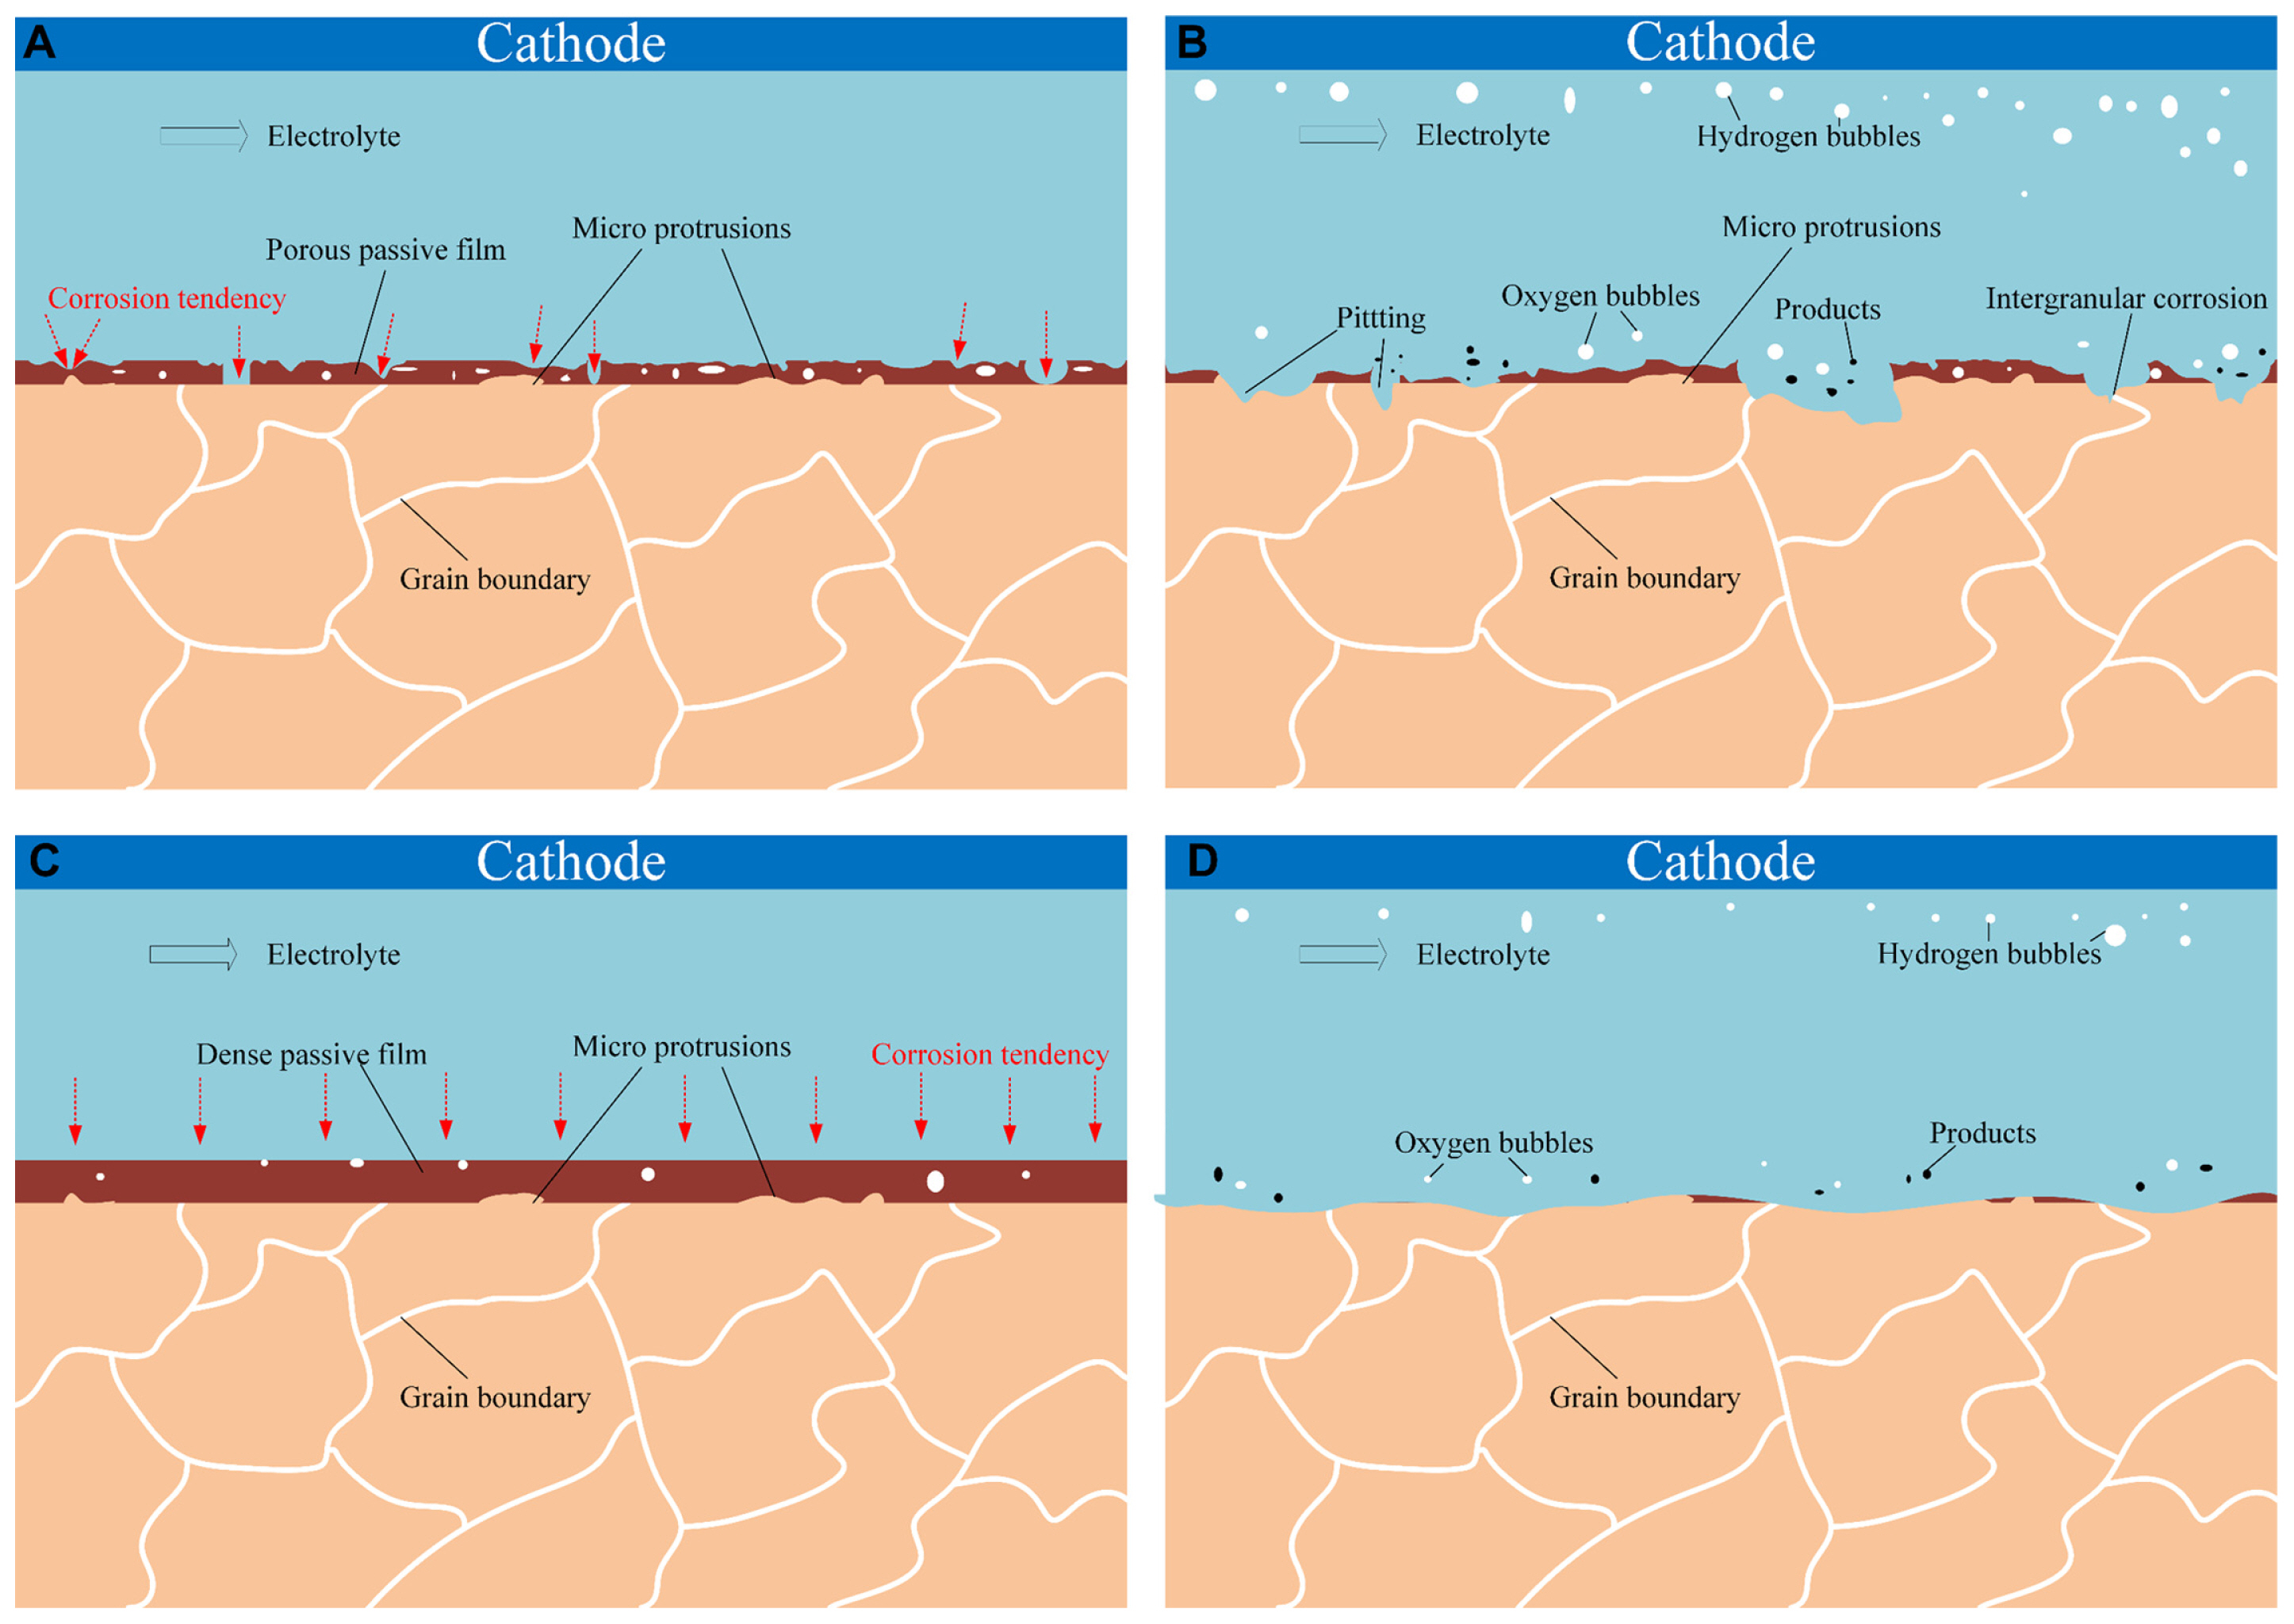
The dissolution behavior of the two alloys at different temperatures shows certain commonalities, as indicated in Fig. 14. At ambient temperature, the passive film exhibits a thin and porous structure (Fig. 14A), with the defects of the passive film structure and the micro protrusions and grain boundaries of the substrate surface being the main sites of corrosion. These corrosion-prone sites continue to dissolve until other active corrosion sites emerge. As a result, the surface morphology becomes uneven, with the appearance of defects such as flow marks. However, at low temperature, the passive film is modified, with its thick and dense structure promoting the occurrence of uniform corrosion (Fig. 14C). This modification process eliminates the defects in the passive film, with the defects on the surface of the substrate being covered up. Moreover, the compression of the electron energy state makes the electrolysis reaction more difficult to proceed in a cryogenic environment. In other words, when a corrosion-prone site appears, the dissolved products more easily block the reaction from proceeding, thereby prompting the corrosion process to resume at new sites, having the overall effect of creating a flat and smooth surface.
4. Conclusions
Material dissolution characteristics play a very important role in ECM, with their effect at low temperature having not previously been explored. Herein, the dissolution characteristics, passive film properties, and surface morphologies of two alloys, iron-based SS304 and nickel-based IN718, were studied in a cryogenic environment, with three experimental control groups set to highlight temperature differences. Electrochemical test methods, such as LSV, OCP, CV and EIS, were applied to analyze the differences in the electrochemical properties of the alloys. XPS was utilized to analyze the composition of the passive films. The surface morphologies and composition were examined by SEM, OM and EDS. The conclusions of the study are as follows.
(1) The passive films of the two alloys were modified in a cryogenic environment, with that of SS304 exhibiting a porous structure. Upon a decrease in temperature, the pore structure shrank and the film became denser. The passive film structure of IN718 was also observed to be loose, exhibiting pure capacitive characteristics at low temperature, with its internal ion migration being completely inhibited.
(2) At low temperature, the degree of pitting that occurs in the passive region of the alloys was observed to be greater than that at ambient temperature, attributed to the aggregation of ions and the modification of the passive films of the alloys.
(3) The hydroxide in the outer layer of the passive film is more prone to dehydration to form an oxide, with the oxide content in the inner layer increasing in a cryogenic environment. The elements in the passive film of IN718 have more valence states at low temperature.
(4) At low temperature, SS304 presents a smoother and flatter morphology, with defects such as intergranular corrosion and pitting being suppressed. The inhibition of the oxygen evolution reaction at low temperature not only reduces the oxygen content on the surface of SS304, but also inhibits the oxidative discoloration of IN718 at low current density. The non-uniform dissolution of IN718 is also suppressed at low temperature.